Stock Market Update- Record Highs in stocks as yields fall.
For a slow day in equity markets, there are actually quite a few interesting developments today. Since not much happened in stocks I’m going to touch on the salient points, most of which started appearing Tuesday morning as the S&P and NASDAQ set out to make new highs. If you want a recap, here’s Tuesday morning’s Early Update – Eclectic Mix describing the early risk-off tone in commodity currencies, emerging market currencies, and the bid in treasuries and volatility.
For the major U.S. averages, today’s price action was little more than a consolidation day, resulting in small bodied daily star candlesticks (loss of yesterday’s momentum). They don’t say much more than – loss of momentum, pause, or consolidation. Yesterday morning I described conditions that were a likely intraday pivot (IWM $158) from the morning’s strong gains, to something else. That something else turned into a sideways consolidation that has gone on from noon Tuesday right through today’s close. The S&P closed today -0.15% from its Tuesday noon level.
Small Caps showed minor relative strength, but none of the averages did anything more than consolidate in a tight intraday range.
S&P 500 ⇩ -0.22 %
NASDAQ ⇩ -0.34 %
DOW JONES ⇩ -0.22 %
RUSSELL 2000 ⇧ 0.19 %
Of interest, FXI (China 25) and EEM (Emerging Markets) were down -1.5% and -1.35% respectively, closing just off session lows.
A defensive tone was evident this morning shortly after the cash open with defensive bond proxy S&P sectors (Utilities, Consumer Staples and Real Estate) leading. The Energy sector was the standout for its weakness. The weakness in the Energy sector was established well before this morning’s oil inventory data that caused crude prices to lose some ground.
Materials ⇩ -0.62 %
Energy ⇩ -1.75 %
Financials ⇩ -0.11 %
Industrial ⇩ -0.29 %
Technology ⇧ 0.04 %
Consumer Staples ⇧ 0.21 %
Utilities ⇧ 0.64 %
Health Care ⇩ -0.11 %
Consumer Discretionary ⇧ 0.09 %
Real Estate ⇧ 0.70 %
Communications ⇩ -0.46 %
Individual sectors saw mixed price action due to earnings, like the Industrials (-0.3%) and Transports (+0.9%) within them. Earnings related action within the sector included: Boeing (BA +0.4%) gaining despite suspending forward guidance and share buybacks. Caterpillar (CAT -3.0%) lost ground despite beating earnings estimates, there’s concern about CAT’s sales to China. Northrop Grumman (NOC -4.3%), and Norfolk Southern (NSC+2.5%) reported as well. The latter drove gains in the Transports.
Semiconductors (SMH +0.85%) were strong today as well, choosing to ignore guidance warnings from Texas Instruments (TXN +1.75%) earlier today.
Internals were mixed like the rest of the market. NYSE advancing issues came in at 1441 and decliners nearly the same at 1400 (+41) on lighter volume of 804.7 mn shares. There was no dominant price/volume relationship and no 1-day overbought/oversold conditions depicted by internals.
Market breadth issues are still there.
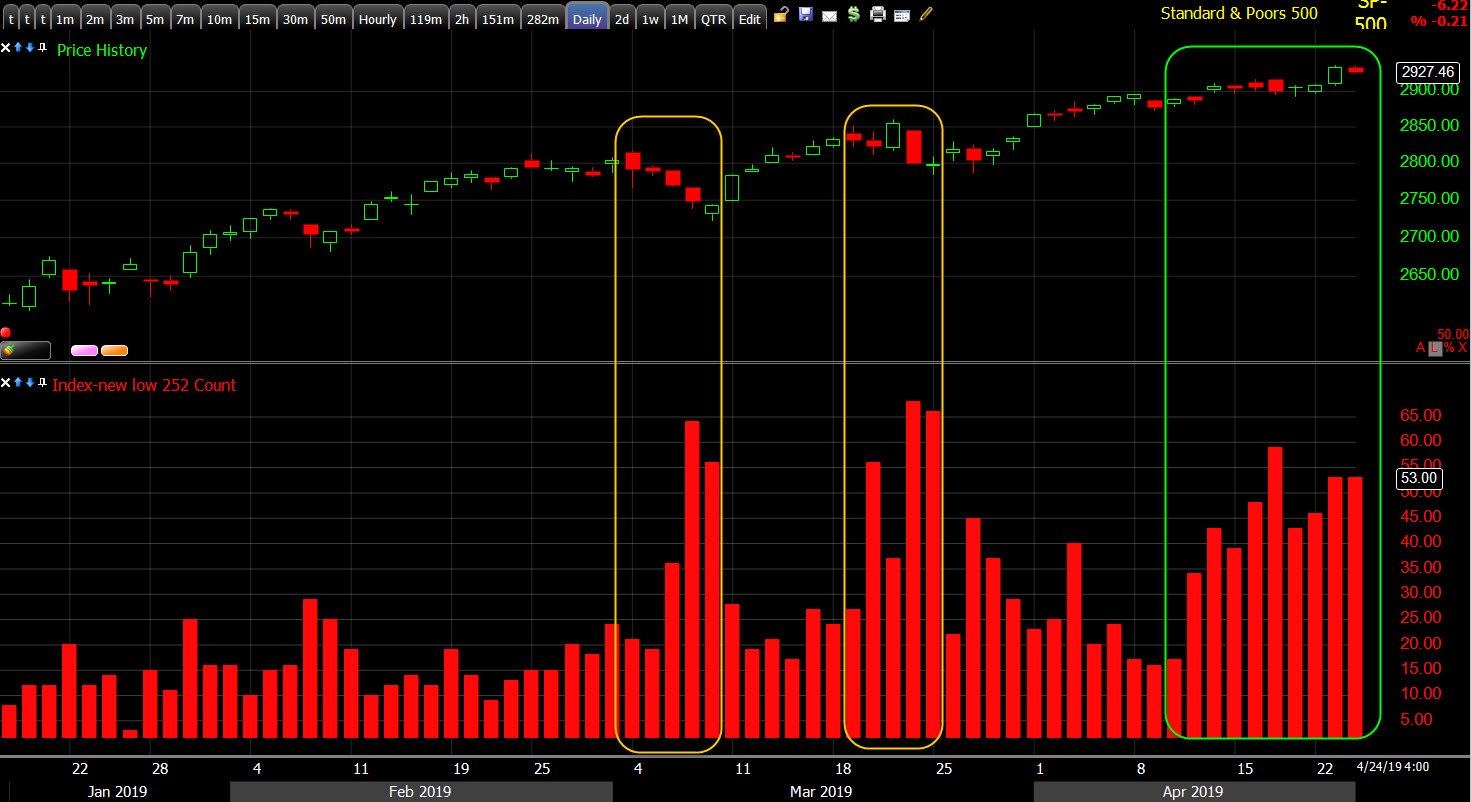
S&P-500 and NYSE 52 week lows (all items). As touched on last night, 52 week lows are not declining. The past 2 episodes of rising new lows (yellow) were notable because they were already the highest since December, new lows should not increase much in a healthy up-trend, they should decrease. The more recent episode (green) is notable because the last 2 episodes of increasing new lows came as the broader market was correcting or pulling back, not moving sideways or making a new high.
The defensive tone was also evident early Tuesday in volatility and Treasuries. The latter followed through on that defensive tone today and we started to get more color as to why. U.S. Treasuries saw increased buying interest overnight and through today, which drove yields lower across the curve and underpinned the outperformance of the rate-sensitive Real Estate and Utilities sectors.
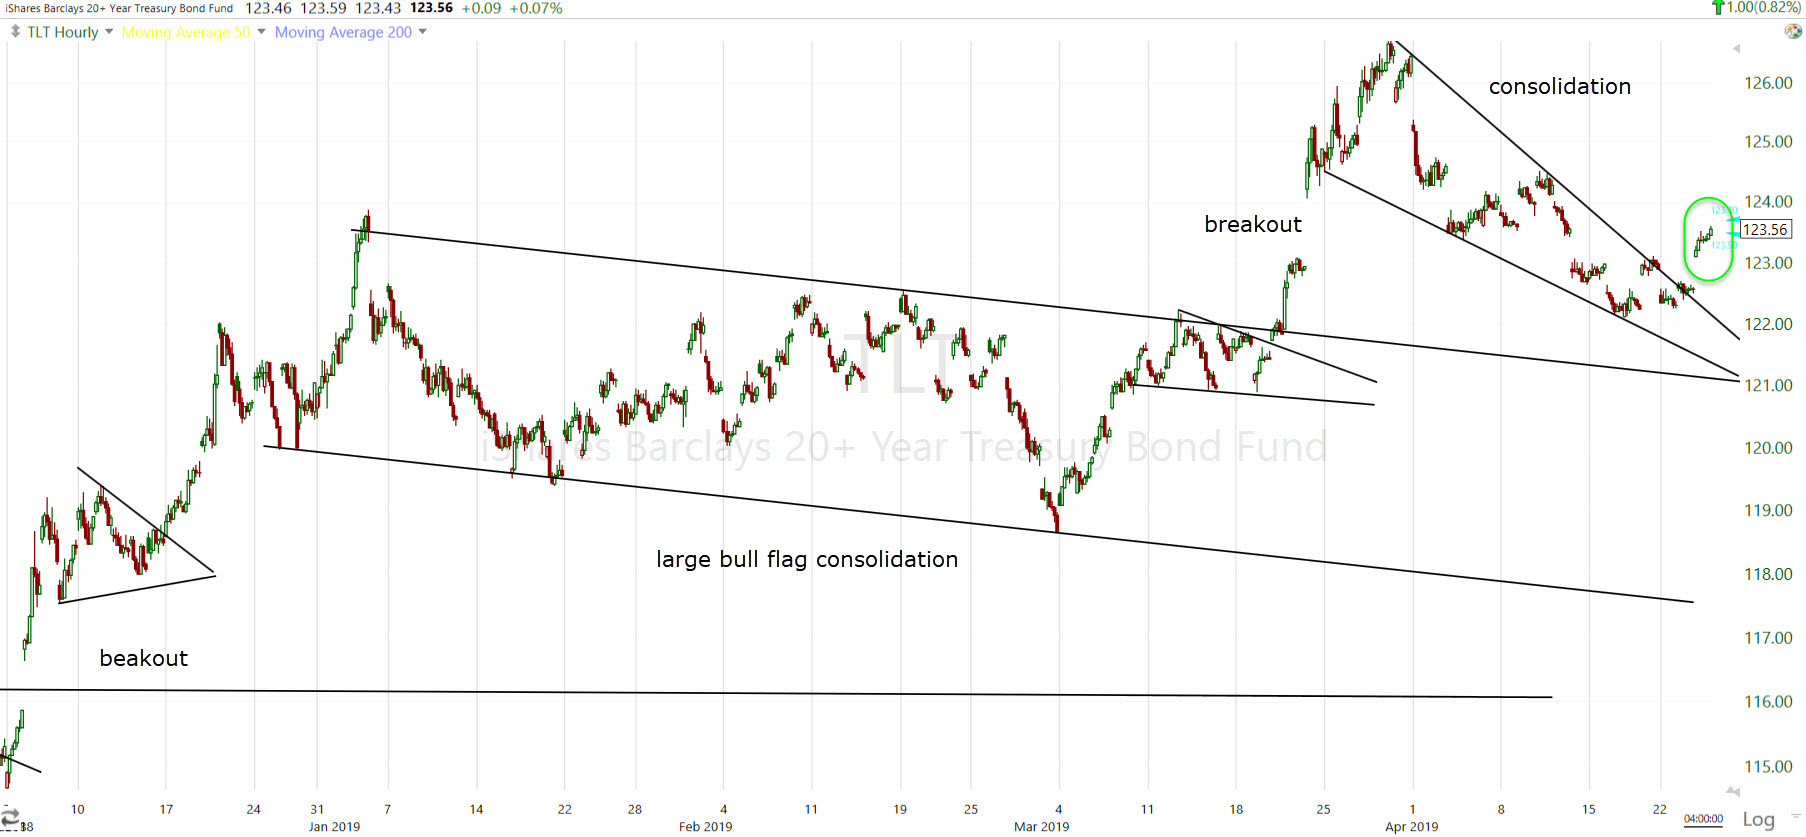
TLT (60m) since the breakout from the large bull flag hit the first target of $125, my expectation has been TLT would pull back to the $122.50 area. Remember the breakout in March was a growth scare with yield curves inverting. My other expectation has been that once Treasuries (TLT) are done pulling back, that we could very well see more volatile times ahead for stocks-including yield curves moving back toward inversion. As noted last week when I drew these most recent consolidation trend lines, there was a certain irony that TLT’s consolidation started taking constructive shape at the same time China released economic data that appeared decent on the surface. A few things have happened since that I’ll touch on below.
Today the 2-year yield declined four basis points to 2.31%, and the 10-year yield declined five basis points to 2.52%. The 3 -month/10-year yield spread that inverted at the end of March and early April, before bouncing in April, fell back down to 10 basis points above inversion today – one of the developments I have suspected would re-emerge after TLT had finished pulling back and started to advance again.
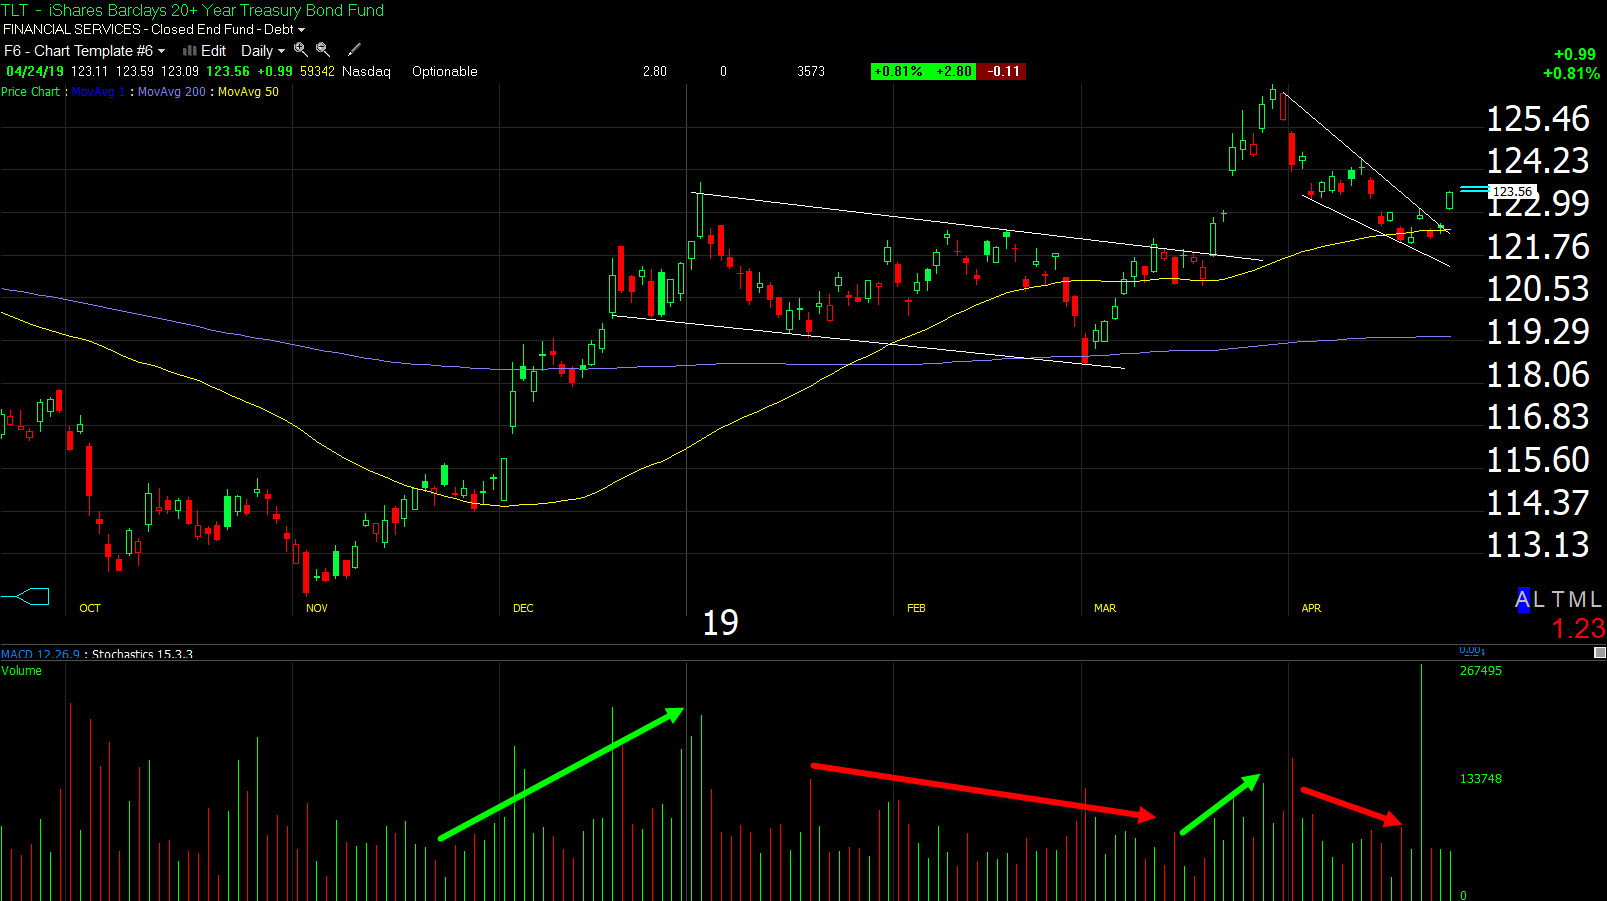 TLT (daily) closed above $123.50, the area I consider to be a breakout on the close. Volume could have been heavier today, but with a quiet day (no selling panic) in U.S. stocks, it’s not surprising that it wasn’t all that heavy. TLT’s price and volume has been spectacular- volume rising on advances, pulling back on consolidations.
The U.S. Dollar Index gained +0.4% to 98.06, its highest level since May 2017. Germany’s Ifo Business Climate Index contributed to caution and weakness in the Euro, which fell -0.6% against the dollar to 1.1157, the lowest close since June 2017. Even gold was bid today as an apparent safe haven. That’s a little strange since the Dollar was also up, which typically pressures commodities and dollar denominated assets like gold lower.
The dollar alone is tough to interpret. The dollar can be strong as global markets are weak and U.S. markets are strong (fund flows to the U.S.), or it can be strong when both global markets and U.S. markets are weak (safe haven flows to the U.S. Dollar/Cash). The dollar tends to be weak when both global and U.S. markets are doing fine-some call this the “Dollar smile”.
What really stood out today in contrast to the Dollar’s strength was the continuation of the losses in commodity currencies like the Australian Dollar, and Emerging Market currencies. Among the EM currencies under selling pressure today: Turkish Lira, South African Rand, Argentine Peso. A basket of EM currencies fell to the lowest level of 2019, that started to weight on both FXI -1.5% (China) and EEM -1.35% (Emerging Markets).
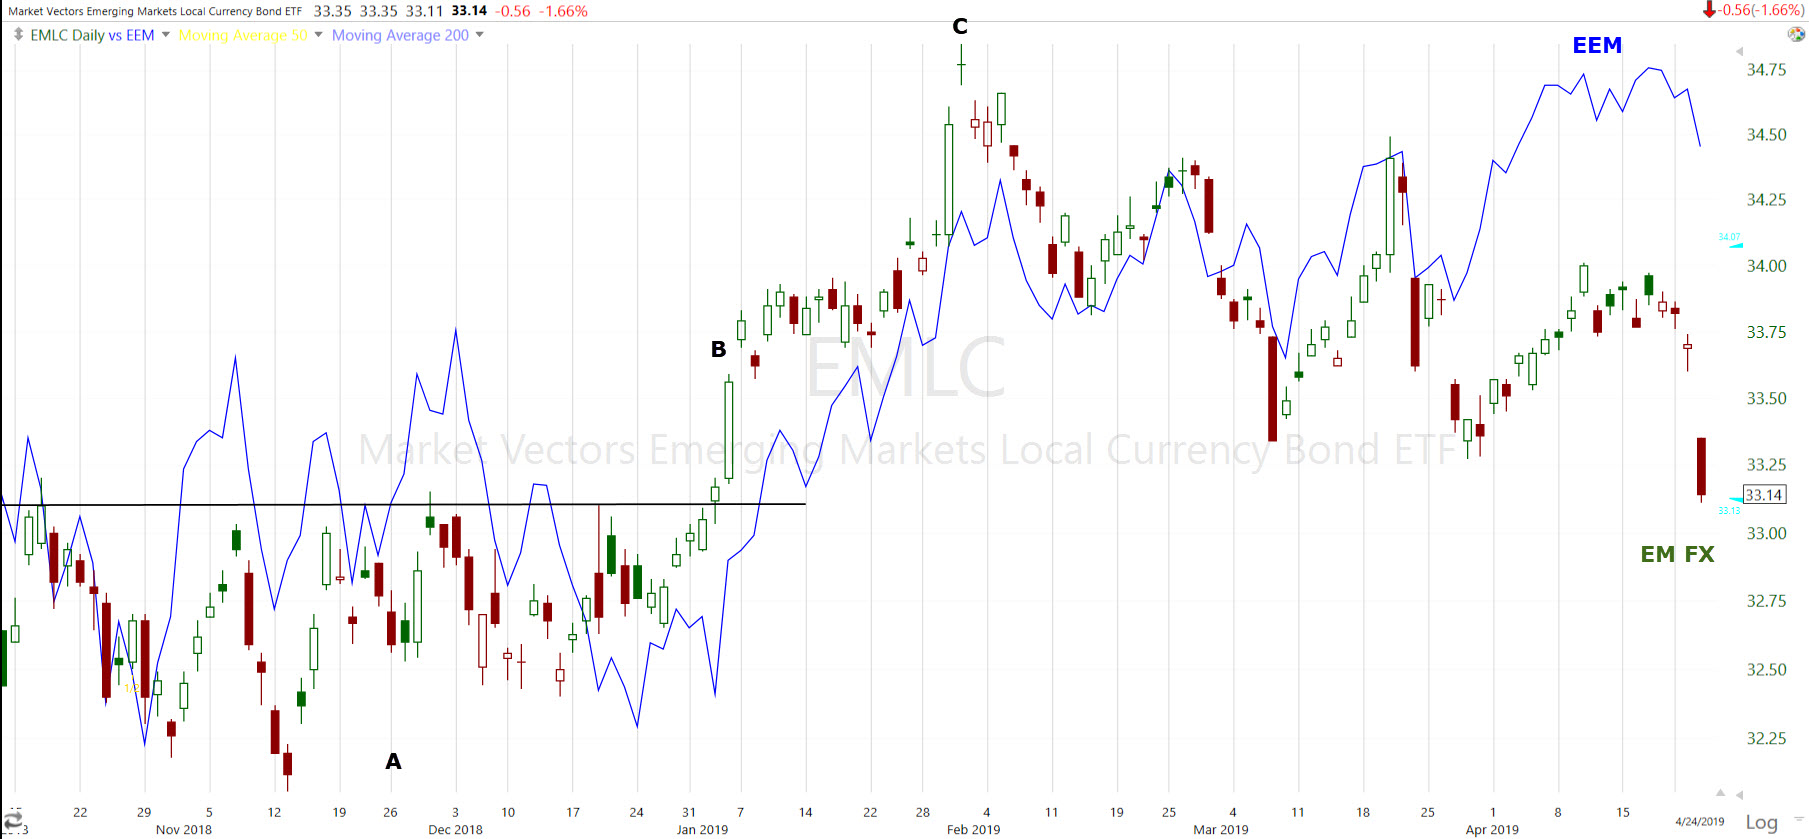 EMLC (proxy for EM FX basket) at the lowest level of the year today. I overlaid EEM (Emerging markets) in blue. You might remember last year that EM currencies led EM stocks lower, then higher. On average, currencies led stocks by 4-6 weeks. Above at A) it was the currencies that based first before the stocks. At B) the currencies broke out first, leading EM stocks higher into 2019. I’ve mentioned some warning signs in EM currencies recently. For the most part those warning signs got put on the back-burner through April, but are re-emerging again-starting Tuesday morning.
Here’s a closer look at one of the clearer price patterns and developments in EM currencies-the South African Rand.
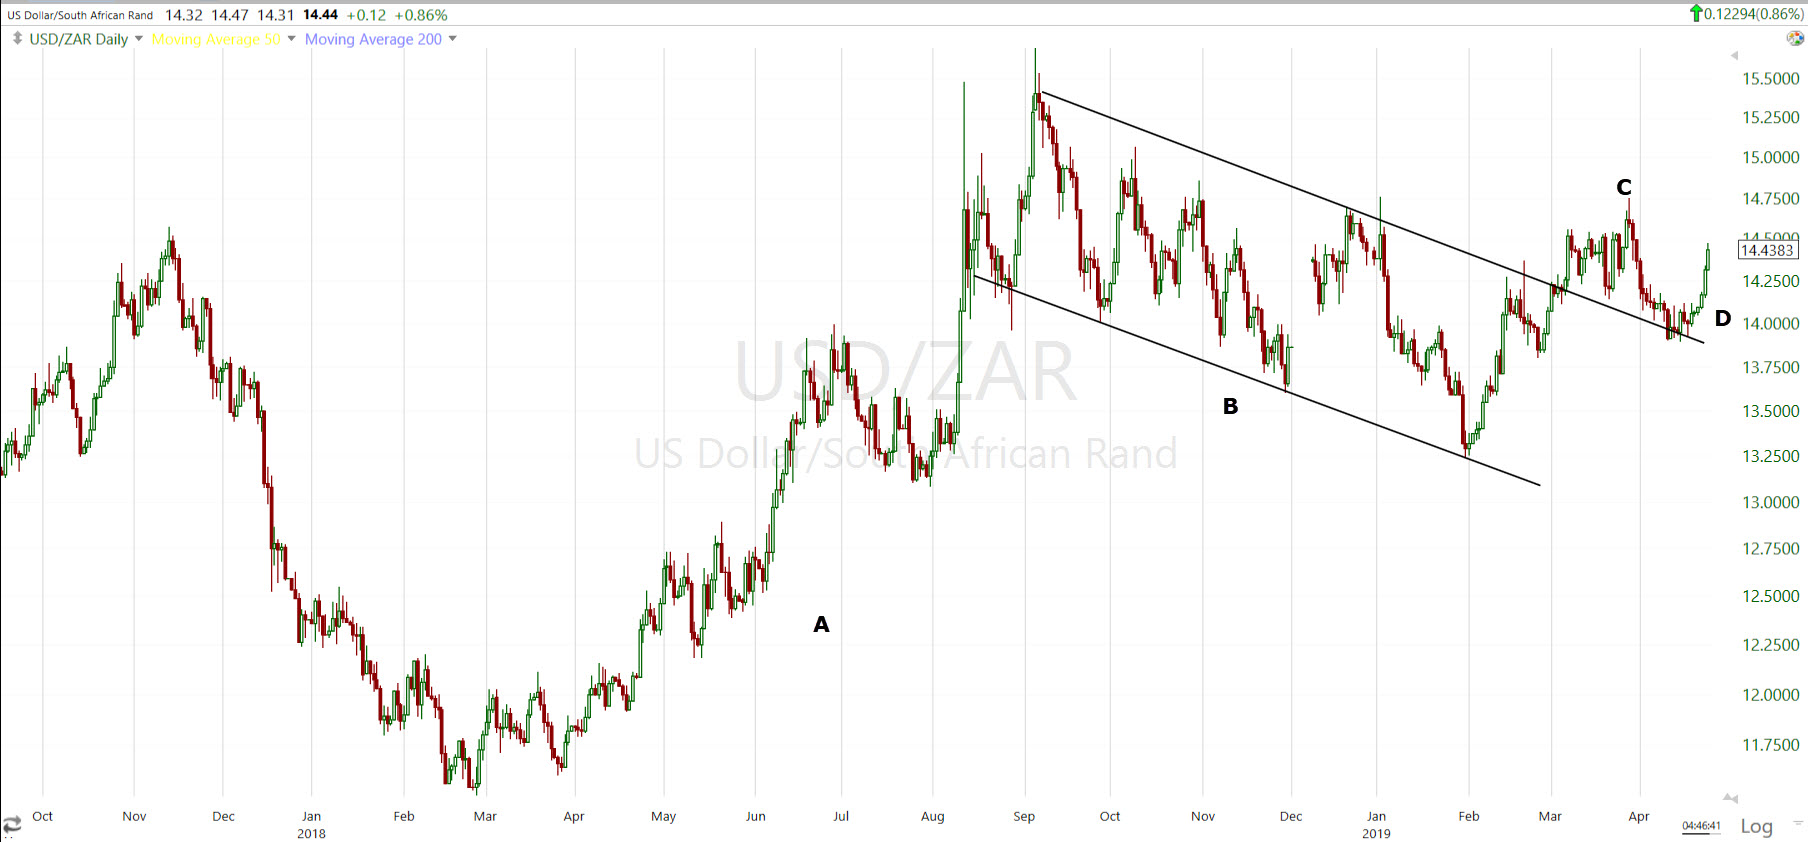 USD/ZAR (daily) Remember this is the USD vs. the Rand. For the perspective from the Rand, invert the chart. At “A” the Rand (and other EM currencies) sold off last year, leading EM stocks lower and eventually U.S. stocks as well. At “B” the Rand bounced and spent 6+ months in consolidation (a bull flag above suggesting probabilities of a breakout-more Rand selling to come). That’s the period of relative calm in FX that allowed emerging market stocks to rally during the same period. At “C” we have a breakout from the large bull flag (bullish U.S. dollar and bearish S. African Rand) in March. Remember at the end of March U.S. Treasury yield curves inverted in a growth scare around the same time, then bounced through April. From “C” to “D” the Rand bounced (USD/ZAR pulled back), a brief period of relative calm in the first half of April. At “D” the Rand is selling off again vs. the Dollar, which is this week from Monday.
Like any other asset, the price pattern above is a large bull flag (bullish U.S. Dollar/bearish S. African Rand), and it suggests a breakout which has technically already started.
It wasn’t just the emerging markets yesterday and today, but commodity currencies like the Australian Dollar and Canadian Dollar too. The Aussie is one of the better proxy currencies that acts as a leading indicator for global trade, global growth inflation/deflation expectations, and is Asia sensitive.
Here’s AUD/USD with FXI (China 25).
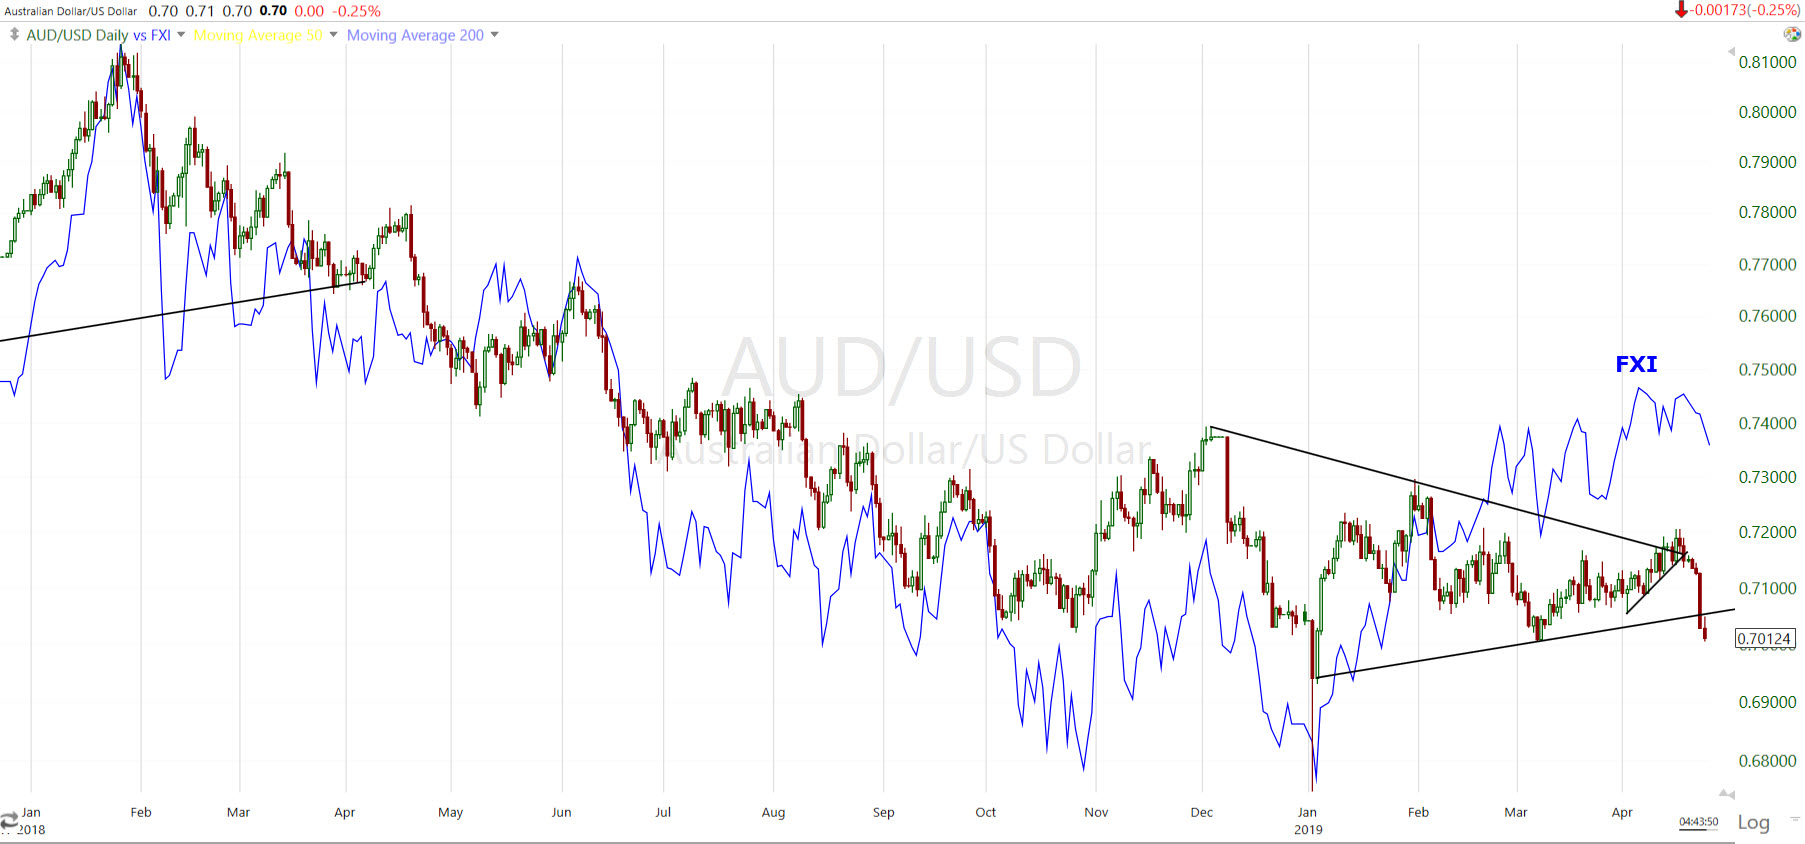
AUD/USD (daily) and FXI (blue). To the far left is the global synchronized growth up-trend that was broken in 2018 with the Aussies leading China stocks (FXI here) lower in 2018. The large triangle to the far right is the uncertainty, and so far a failure to confirm global equities in 2019.
I touched on this Monday. Here’s an excerpt from the end of Monday’s Daily Wrap…
“I’ve covered the Q1 2016 market low from the perspective of AUD/USD before. By this time in the recovery in stocks, actually well before it, AUD/USD was leading stocks higher, not just confirming…
From the 2018 market low, AUD/USD initially rallied sharply with the major market averages across the world in confirmation early-on, then started making lower highs relative to the averages, but not lower lows. This resulted in AUD/USD putting in a large symmetrical triangle-indecision.
Here’s the bigger picture…
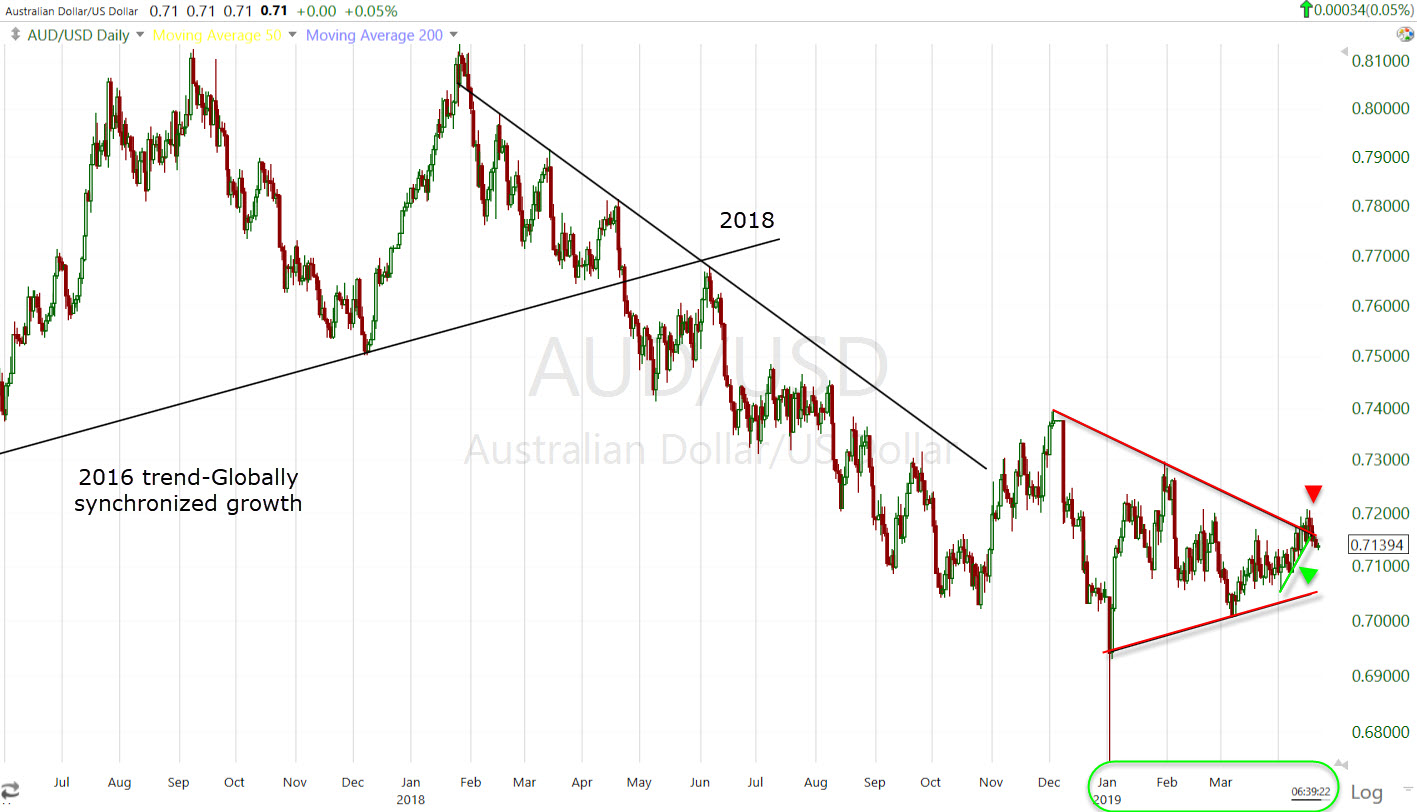 AUD/USD (daily) from left to right, the uptrend from 2016 lows is the globally synchronized growth trend of 2016-2017, breaking that trend in summer 2018 and leading global markets lower. The period from the market’s December/January lows is highlighted in green with the sym. triangle in red. April’s trend above is highlighted with a green trend line/arrow. The China data dump with the red arrow.
It will be interesting to see what happens here next in AUD/USD, not just for U.S. stock markets, but the global equity picture, as well as Bond (inflation/deflation expectations). “
Well we didn’t have to wait long. AUD/USD broke the April risk-on trend last week, and broke below the triangle this week. Here’s the updated daily chart of AUD/USD…

AUD/USD (daily): “A” is the globally synchronized growth uptrend from 2016. “B” is the break of that trend leading global markets and eventually U.S. markets lower, as well as being one of the clearest signs of global deflation, which we’ve seen in bond yields and yield spreads since. “C” is the flash crash after Apple cut their guidance in early January and the rally off the low is the very next day as the Fed’s Jay Powell made a dovish pivot putting rate hike expectations on pause just 3 weeks after hiking rates in December. “D” is the uncertainty of the large triangle since, failing to make higher highs with U.S. and even Chinese stocks. AUD/USD broke below the triangle, challenging the March 7th low.
Here’s a closer look..
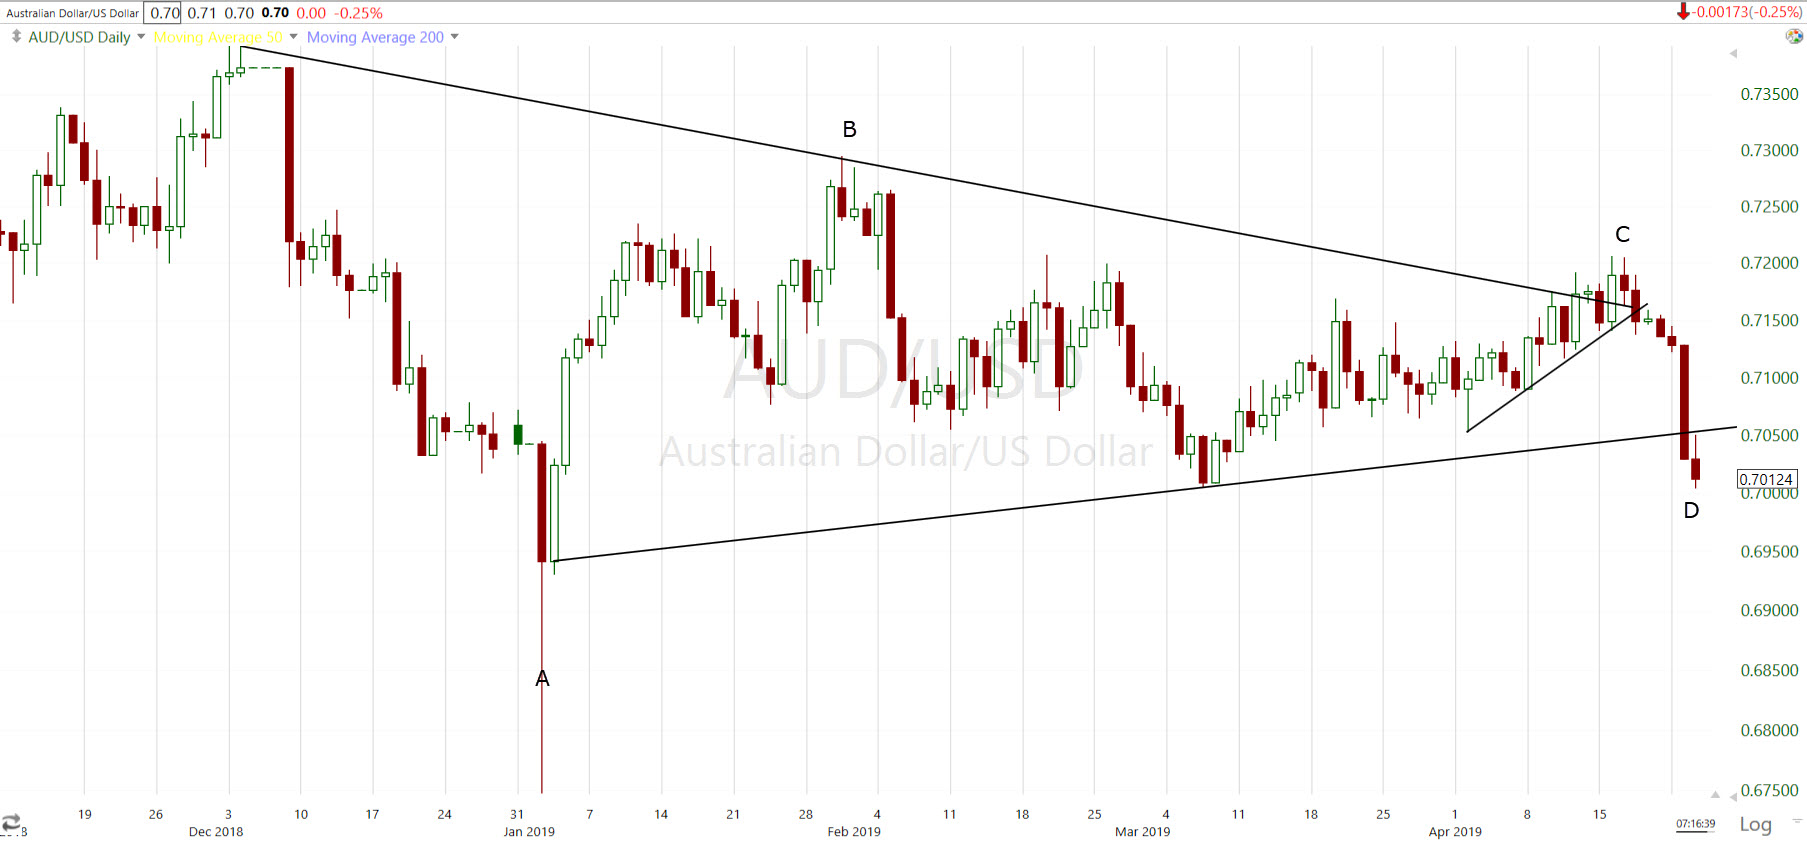
AUD/USD (daily): “A” is the flash crash in currencies Jan 3rd as Apple lowered guidance for only the second time in 20 years. The recovery off that low is Powell’s well-timed dovish pivot the very next day. “B” is AUD/USD confirming the early part of the rally in stocks with higher highs into February, and drifting since. “C” is the move above the triangle ahead of and in anticipation of strong Chinese economic data, and also the failure of that breakout after the data release. (D) is today, breaking below the triangle and challenging the March low. In my view it’s not coincidence that TLT broke out today as AUD/USD broke below support. This is what I was saying last night- U.S, stocks were looking at new highs, everything else (currencies, treasuries, volatility) was looking in another direction.
In the full comments toward the end of Monday’s Daily Wrap, I show specifically how AUD/USD started to breakout of the triangle just ahead of last week’s massive Chinese economic data dump, and how that breakout failed just after the Chinese data, which was strange as the data beat expectations. Also covered last week, not a lot of investors trust China’s official data releases. Especially as other countries in the region that trade with China (like Japan and South Korea) have released their own economic data contradicting China’s (Japanese exports to China falling sharply, South Korean semiconductor exports to China falling sharply, etc.). It’s not the news, it’s how price reacts. More often than not the initial knee jerk reaction is faded, it just takes some patience to allow price to talk.
For one final piece of perspective, here’s the Aussie’s usefulness as a leading macroeconomic indicator (inflation/deflation, global trade, etc.)
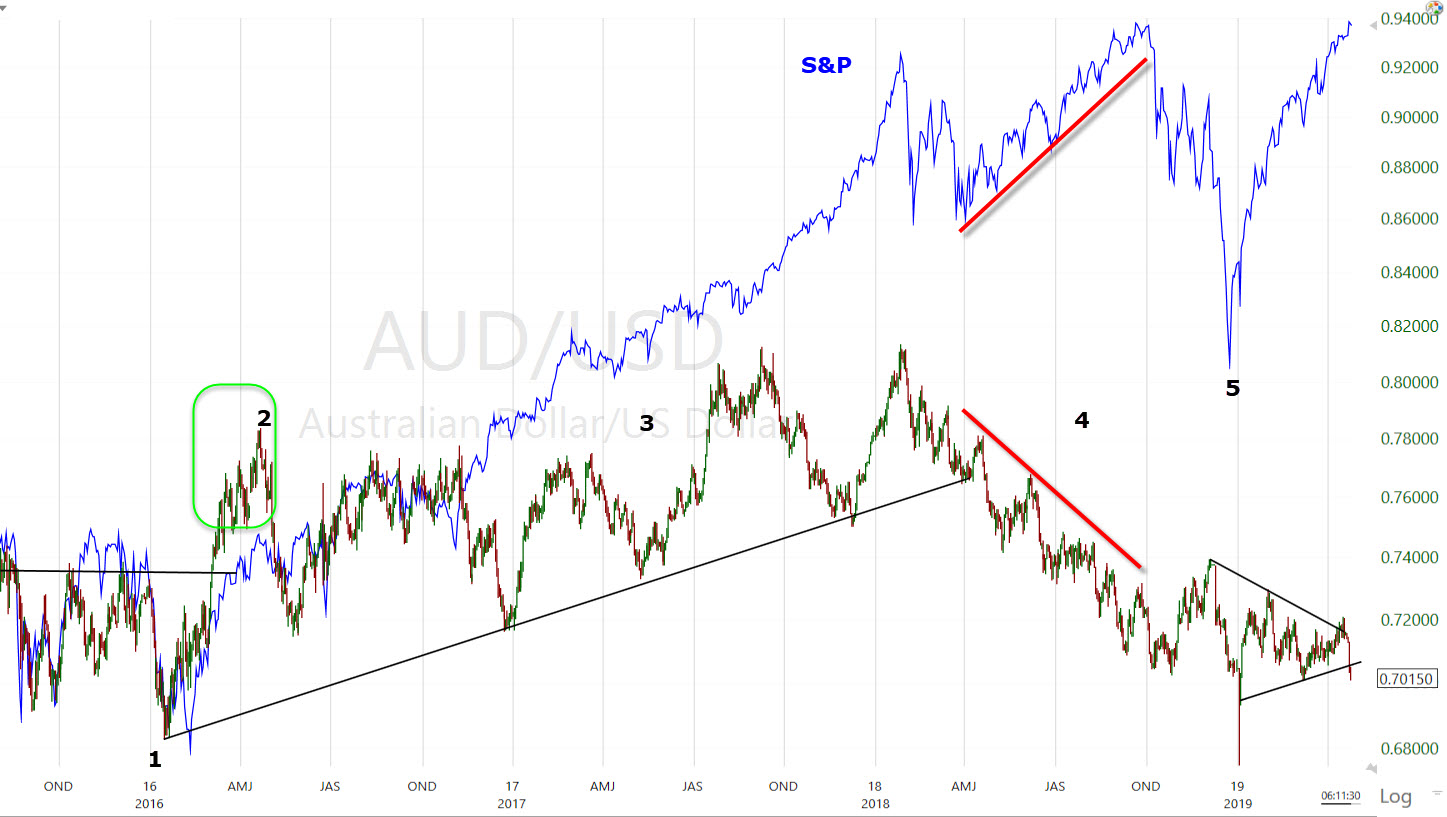
AUD/USD (daily) and the S&P-500 (blue) from 2016’s AUD/USD and S&P-500 lows at “1”. At “2” you can see how AUD/USD led even the S&P off the early February low. The Aussie made its low first almost a month ahead of the S&P and it broke out above resistance first at “2” well before the S&P. This led to the globally synchronized growth trend at “3”. AUD/USD did not recover from the decline from it’s January 2018 high like the S&P did, leading to what Jeff Gundlach called the “Alligator jaws of death” in the summer of 2018 as the S&P made new record highs, while global stocks markets were trending lower with the Aussie at “4”. The S&P and U.S. stocks were still benefiting from newly enacted U.S. tax cuts, eventually they caught onto the global deflationary wave sweeping the globe and sold off from October to December.
The low in AUD/USD and the S&P at “5” was: U.S. Treasury Secretary Steve Mnuchin calling in the plunge protection team (per his own December 23rd tweet), and Jay Powell’s January 4th dovish pivot, followed by 3 or 4 more Fed dovish pivots since. As I’ve covered ad nauseam, going back throughout history all the way to the early 20th century, rallies off sell-off lows all have one thing in common, a Fed or central bank dovish pivot-whether verbal or actual. The same thing happened in 2016 on the charts above, global growth slowed, stock markets rolled over, central banks around the globe made a coordinated dovish pivot (Fed paused rate hikes for a year after only hiking once, China dumped billions of dollars in stimulus into the financial system, etc.).
I’m not sure the central bank pivot was as coordinated as 2016 (Shanghai accord) this time, China dumped far more money into the financial system this time in a shorter period, nearly $800 billion in Q1 2019. In many ways 2018/2019 is a reflection of 2015/2016. The future is not pre-ordained on the price charts, it develops every day. Maybe the central banks dovish pivot was enough and the stock markets faith is not misplaced. Each time the market has stumbled since the Financial crisis the Fed has bailed out the market (QE 1, QE2, operation twist, QE3, Shanghai accord, Powell’s pivot 3 week after hiking rates and claiming the balance sheet was on auto-pilot). There’s virtually no difference between the Fed’s reaction in the early 20th century (and since) and now, except to say that the bailouts since the Financial crisis have been much more extreme. Otherwise their reaction has been the same for a century.
AUD/USD just happens to be one of the clearest differences between the early 2016 bailout and now. In 2016 the Aussie started reflecting inflationary (growth) expectations before stocks, and led stocks higher. This time stocks have reacted more forcefully and earlier to the Fed dovish pivot as markets anticipate Fed easing (bailout), maybe putting the cart before the horse.
Maybe AUD/USD finds support here and the story continues to develop, maybe it doesn’t. The break below AUD/USD’s triangle is not a great sign, especially as the S&P was making a new high Tuesday. Emerging Markets and Treasuries seem to be looking the same way as the Aussie.
If all other things were equal (i.e- AUD/USD was confirming a higher high), I’d be paying a lot more attention to corporate earnings for hints. When a macro economic leading indicator like the Aussie is not confirming, that bigger picture trumps even earnings. As we saw in the summer of 2018 (Alligator jaws of death), U.S. stocks were high on the U.S. tax cuts and resulting buyback binge, disconnecting from global markets until October. I’m not sure how much last quarters’ earnings matter when a real-time deflationary signal is being sent that effects virtually all growth expectations (thus earnings) moving forward.
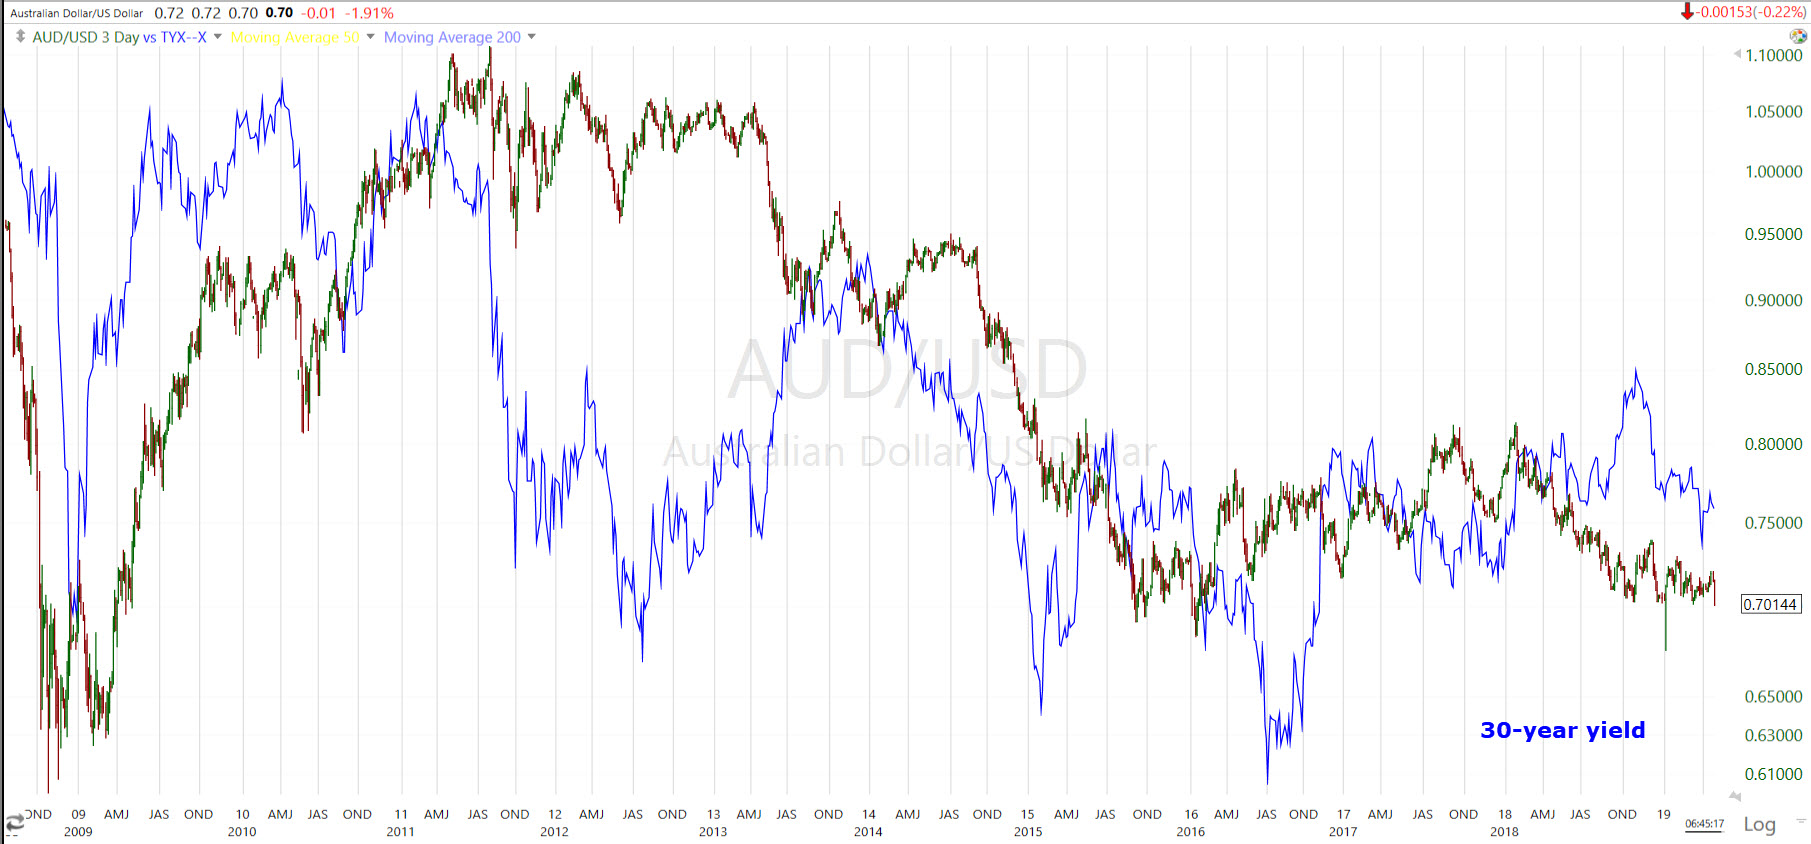
AUD/USD (daily) and 30-year yield (blue). Global markets can and do disconnect from each other, but over the long term the Aussie has done a good job of tracking inflation/deflation as you can see its trend has been very similar to long term Treasury yields.
Today was interesting in that the macro side of things (yields/currencies) fleshed out more of a picture today and Emerging markets reacted as U.S. stocks tread water. The defensive tone in S&P sectors could have simply been because the averages paused, it could have been a reaction to falling yields as Treasuries climbed, or both. I think it’s less likely they were looking in the same direction as the other assets from Tuesday as I didn’t see a lot of other evidence in growth sensitive sectors, a few of which out-performed today (Transports/semis), more focused on earnings related results. The market is pretty well focused on earnings, but it will be interesting to see whether yesterday and today start being reflected in other areas, and whether the Aussie follows through on the downside as Treauries appear to be breaking out of their month-long consolidation.
Overnight.. S&P futures are near flat, NASDAQ futures +0.10% up on after hours earnings like Facebook. S&P, Dow and Russell 2000 futures all saw deterioration on their 3C charts into the close, not divergent though. The positive divergence in VIX futures was much clearer and stronger Tuesday. I’m not seeing clear selling there, the divergence is just less enthusiastic. I expect that the overnight session, at least from the perspective of U.S. index futures, is going to be uneventful. I don’t know how Asia reacts-the Bank of Japan releases their policy statement tonight. Reports have suggested the BOJ may downgrade their growth/inflation outlook – which was reflected in the Japanese Yen declining this afternoon.
Crude is down -0.20%, but I think it can bounce a little overnight.
Treasury futures look just as strong tonight as they did Tuesday night. I like how they’re acting and want to see that continue, but I wouldn’t sneeze at a pull back either.
U.S. economic data was sparse today. The weekly MBA Mortgage Applications Index fell 7.3% following a 3.5% decline in the prior week. Looking ahead, investors will receive the weekly Initial and Continuing Claims report and Durable Orders for March on Thursday. Friday U.S. Q1 GDP is out.