Daily Stock Market Wrap (Public)
Well that was not a typical slow Monday. I have a lot of charts for you tonight.
S&P futures were up about +0.4% between Sunday’s futures’ open and pre-market. Better than expected soft-economic (survey) data from China and Europe got futures off on the right foot. Early index futures’ ignored a report from Global Times that China’s priority in securing a partial trade deal is to remove existing tariffs on imports from China, not just December 15 tariffs yet to go into effect. they also ignored that Axios reported that the trade deal is now “stalled” due to the passage of the Hong Kong Human Rights and Democracy Act. China’s Foreign Ministry announced today that the U.S. military will no longer be able to visit Hong Kong.
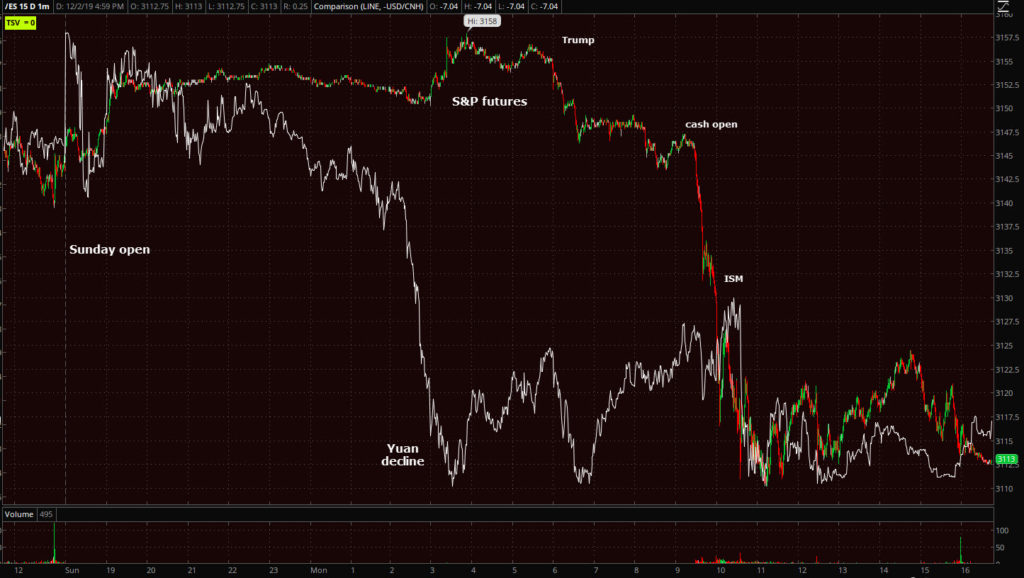
The Chinese yuan, however, did not ignore this news and plunged reflecting the deteriorating developments in the trade deal talks.
Stocks opened lower and selling quickly ensued and accelerated after the ISM Manufacturing Index for November declined to 48.1% (consensus 49.2%) from 48.3% in October. The dividing line between expansion and contraction is 50.0%, so the November reading is a deceleration in activity from the prior month, and the fourth month of recessionary manufacturing prints.
Total construction spending also declined -0.8% m/m in October (consensus +0.3%) on the heels of a downwardly revised 0.3% decline (from +0.5%) in September.
The market’s early decline caught down to the yuan that had already plunged hours earlier.
S&P futures in red/green candlesticks and USD/CNH (inverted) in white from Sunday’s open. This is a great example of currencies often more accurately discounting information as compared to stocks. The Yuan was reflecting risk-off due to the trade war news, while stocks were ignoring the same news trying to rally higher, then catching don to currencies.
Averages
Today was the biggest 1-day decline in 6 weeks, and the worst start for December in 11 years, or since 2008.
S&P 500 ⇩ -0.82 %
NASDAQ ⇩ -1.12 %
DOW JONES ⇩ -0.96 %
RUSSELL 2000 ⇩ -1.04 %
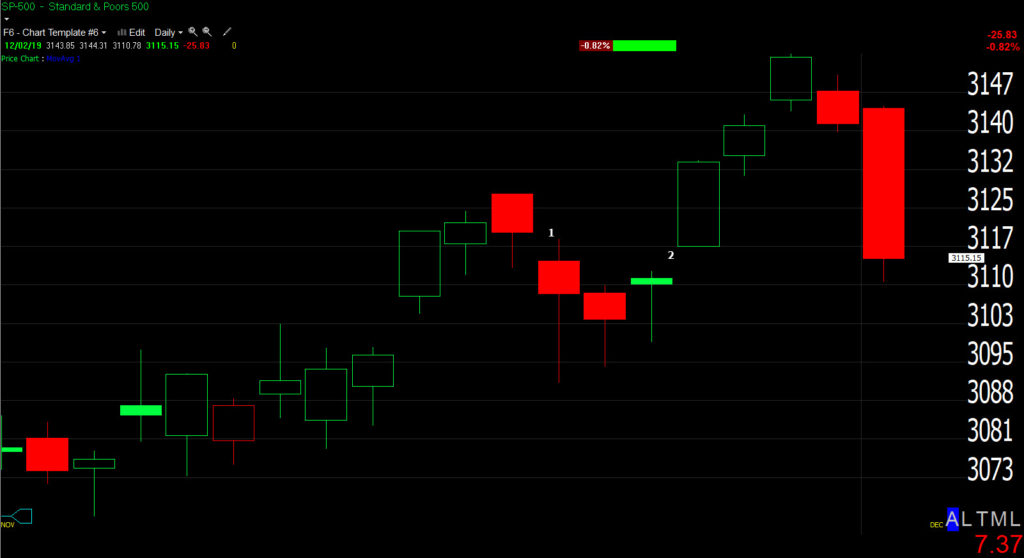 SP-500 (daily) retraced nearly all of last week’s 0.99% gain by 11:15 a.m. and closed near the low of the day.
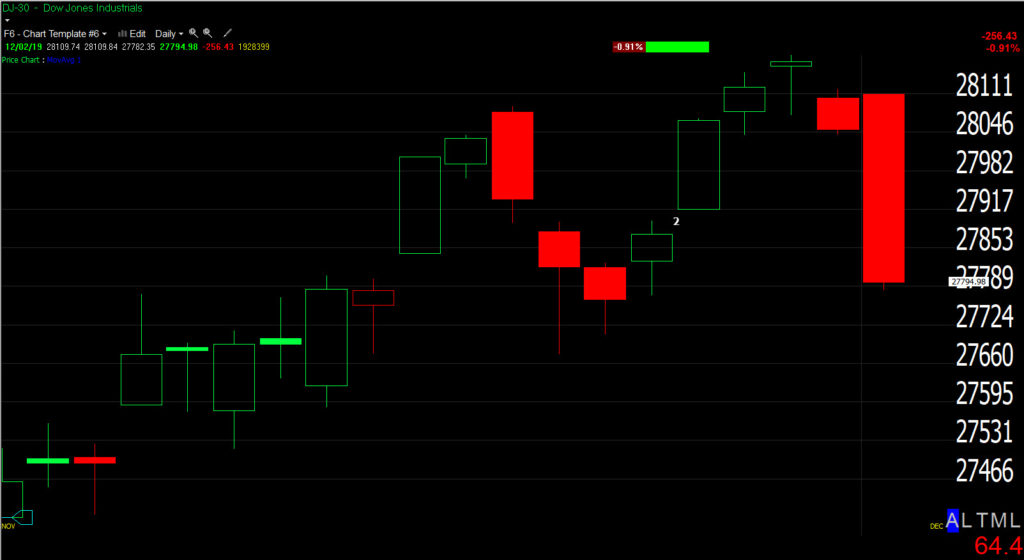 Dow Industrial Average (daily) retraced all of last week’s gain by 11 a.m. and then some, also closing near the low of the day.
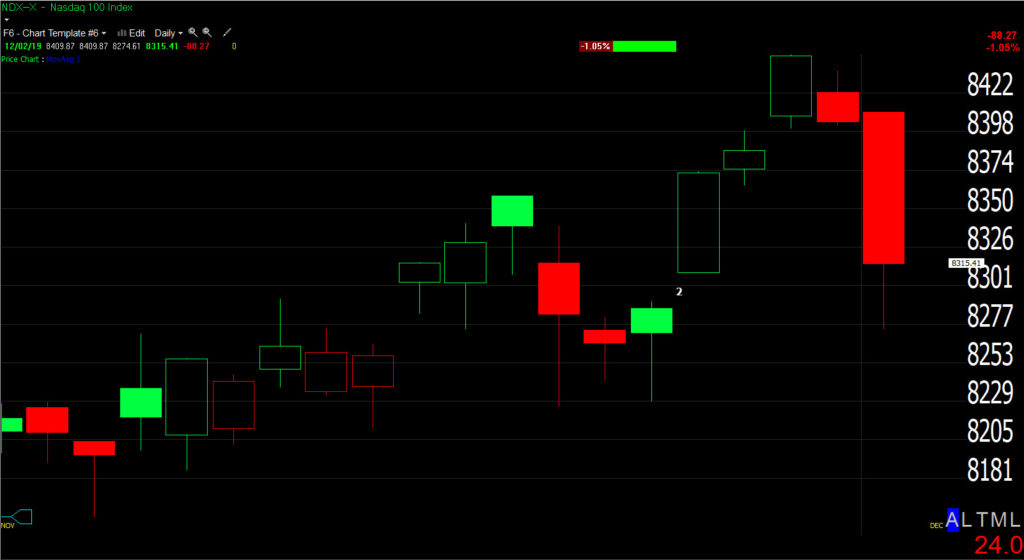 NASDAQ 100 (daily) was 4 basis points (0.04%) shy of retracing all of last week’s gain, but closed off the low of the day, although the worst performing average.
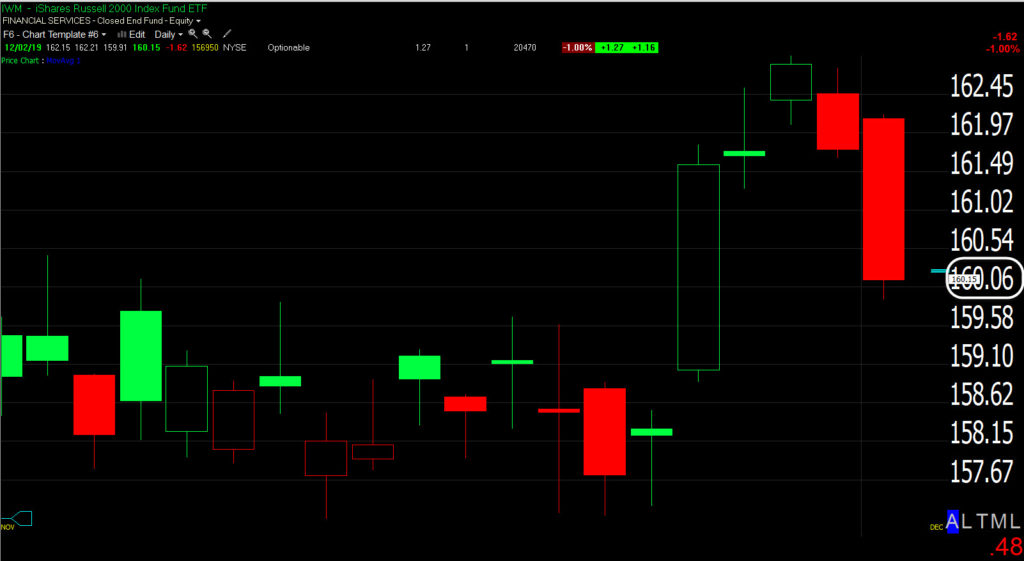 IWM/Small Caps (daily) fell back to last week’s breakout level of $160 and stayed there the rest of the day.
The weekly wrap video posted just over a week ago, Change in Price Action, was all about a bearish change in price action. At the end of the video I said I thought that the upcoming holiday-shortened week (last week) would finish positive because of the holiday and specifically Black Friday. It finished better than I expected, but as noted a couple of times last week, most S&P sectors did nothing to advance their technical price action. We’ll take a look at several S&P sectors below. Lets start with the averages.
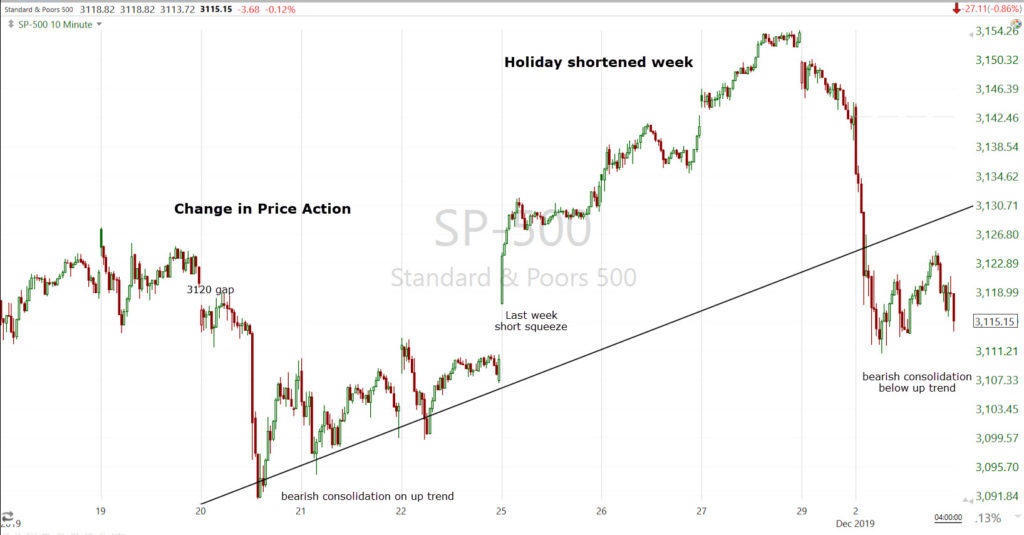 SP-500 (10m) shows the change in price action with the prior week ending with a bearish consolidation, but right along the phase I trade deal up trend. I expected last week to at least fill the gap at $3120, which was blown through last Monday. The last 2 days have given back last week’s gains. Today ended with a similar bearish price consolidation, but this time below the primary rally trend.
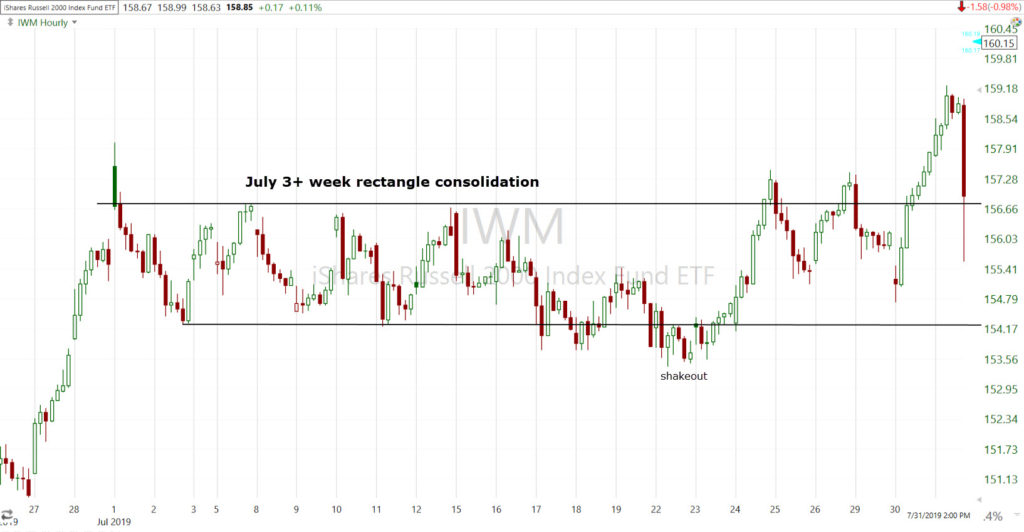
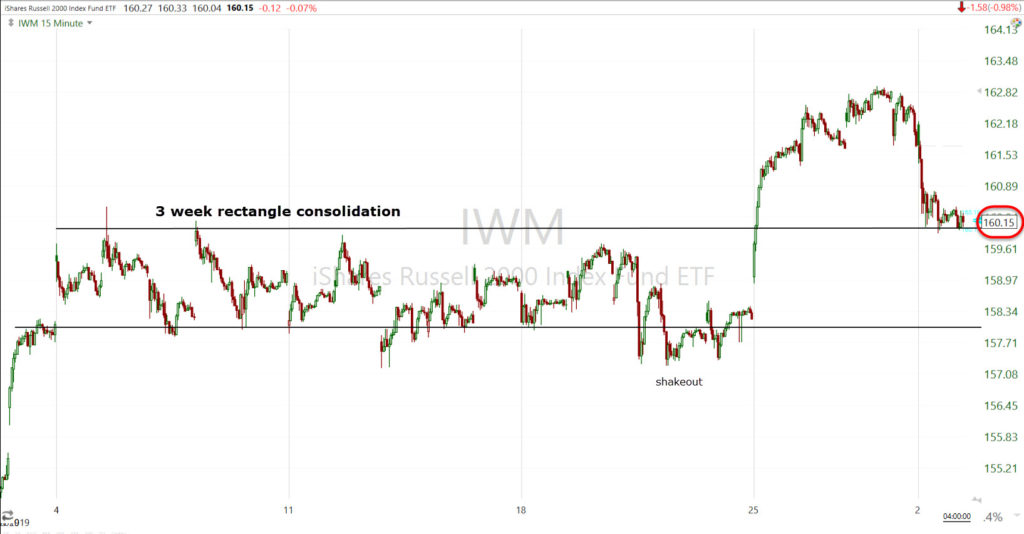 IWM / Small Caps (15m). In the Volatility/VIX post this weekend IWM’s chart and how it has typically gone from a very low price volatility consolidation, to an increase in price volatility like last week’s short squeeze, just before volatility explodes to the upside. I’ve also been noting for the last month how similar IWM’s price action over the lat month has been to July amid trade deal hopes. This is one of the primary reasons I’ve stayed away from IWM in the short term, there’s too much potential for violent shakeouts.
Here’s IWM back in July…
IWM (60m backed up to July). As of today, IM is a spitting image of July… a 3 week rectangle followed by a shakeout below, and a breakout above, and back to testing the breakout level (currently $160). This breakout was a failed move and followed be a -7.5% sell-off.
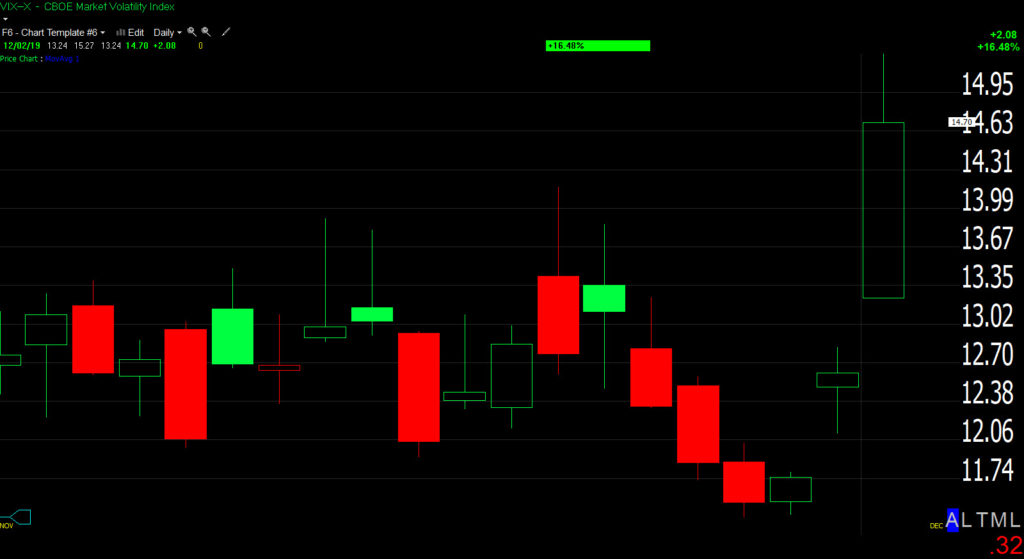
And VIX got moving today. This is VIX’s 3rd consecutive close higher, ending the day +16.5% higher, surging as much as 21% intraday, and 27% higher the last 3 days.
VIX (daily) highest close since October 11th, and biggest 1-day gain since August 23rd. The conclusion of the weekend post on VIX was that numerous signals had set the stage for a big move up in volatility.
S&P sectors
Today’s decline across S&P sectors was broad-based. Leading the decline were the Materials, Real Estate, Industrial, and Technology sectors, all of which fell 1% or more. The Consumer Staples and Energy sectors finished unchanged or in positive territory. The latter finding support from higher oil prices (+1.5%). Defensive sectors would usually outperform on a day like this, but yields were oddly sharply higher today, weighing on the rate sensitive bond proxy sectors.
Materials ⇩ -1.00 %
Energy 0.00 %
Financials ⇩ -0.63 %
Industrial ⇩ -1.65 %
Technology ⇩ -1.43 %
Consumer Staples ⇧ 0.23 %
Utilities ⇩ -0.65 %
Health Care ⇩ -0.44 %
Consumer Discretionary ⇩ -0.82 %
Real Estate ⇩ -1.84 %
Communications ⇩ -0.95 %
Philadelphia Semiconductor Index (-1.5%) and Dow Transports (-1.1%) were areas of relative weakness as the sectors are sensitive to the trade war.
I have quite a few charts below to illustrate that despite last week’s solid gains among the averages, most sectors did not improve their technical outlook since the prior week, summarized in the November 24th video, Changes in Character. Is Volatility About to Explode Higher?
The areas of interest are the last 3 weeks. The first week was mostly bullish consolidations with a few bearish. The second is the change in character with many bullish price patterns failing or many others turning bearish. The third is last week’s holiday shortened session in which there was little outlook change from a technical price perspective, and the start of this week.
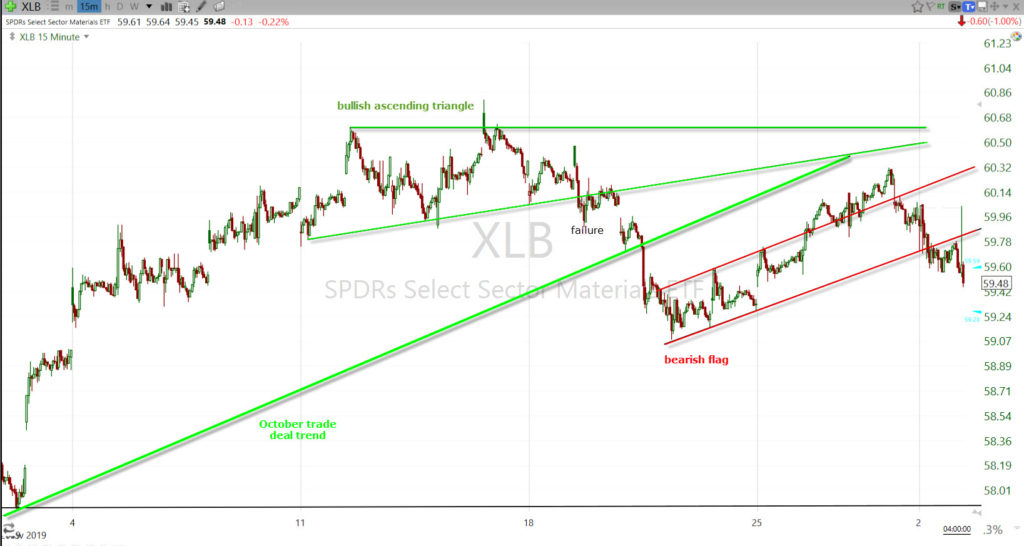 Materials sector (15m) Transitioning from a bullish ascending triangle consolidation, to a failure breaking below the trade deal up trend and starting a bearish flag. Despite last week’s gains, the flag was merely extended. The sector did not get back above trend or the consolidation that failed.
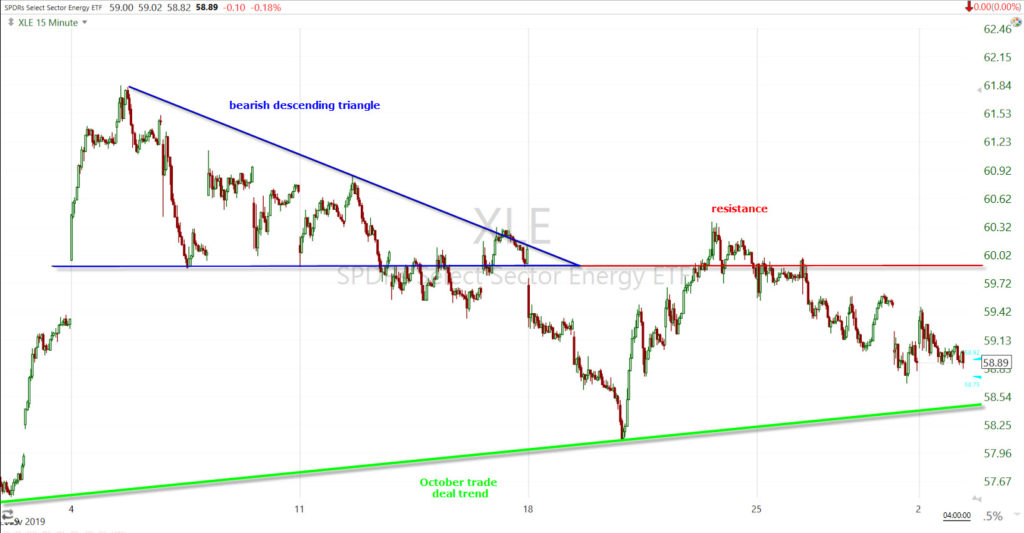 Energy sector (15m) with a bearish descending triangle that was given the benefit of the doubt due to the preceding up trend. It broke below the consolidation, but bounced off the trade deal trend. Last week it met resistance at the former consolidation’s support.
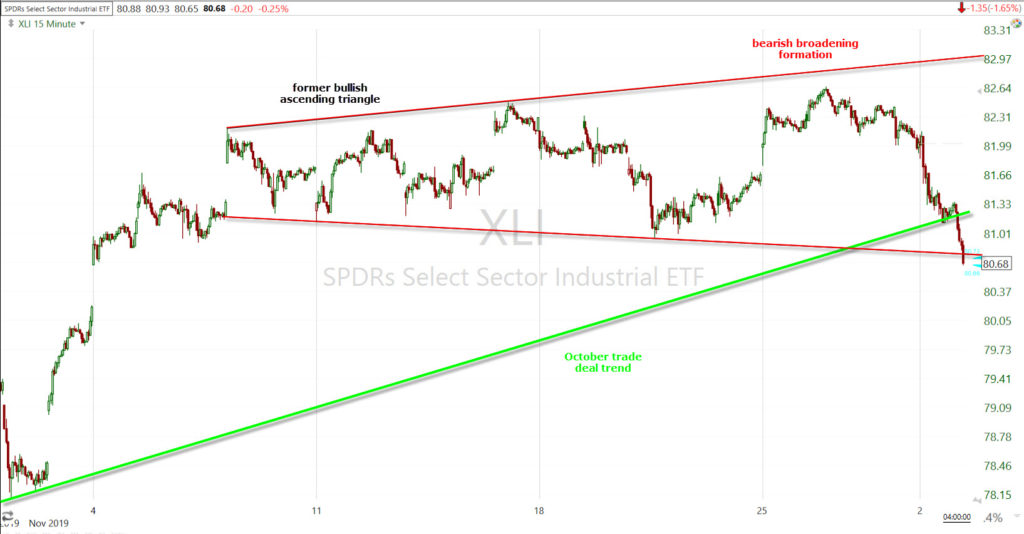 Industrial sector (15m) a few weeks ago it was actually a bullish ascending triangle. Since the failure of the bullish triangle it has made higher highs and lower lows, tracing out a bearish broadening range. Remember that broadening ranges area depiction of chaos, a lack of intelligent sponsorship, and driven by rumor and news. Very appropriate for the last few weeks of mixed trade deal headlines. Today it slipped below the developed (5 pivot) broadening formation, and just below the trade deal up trend.
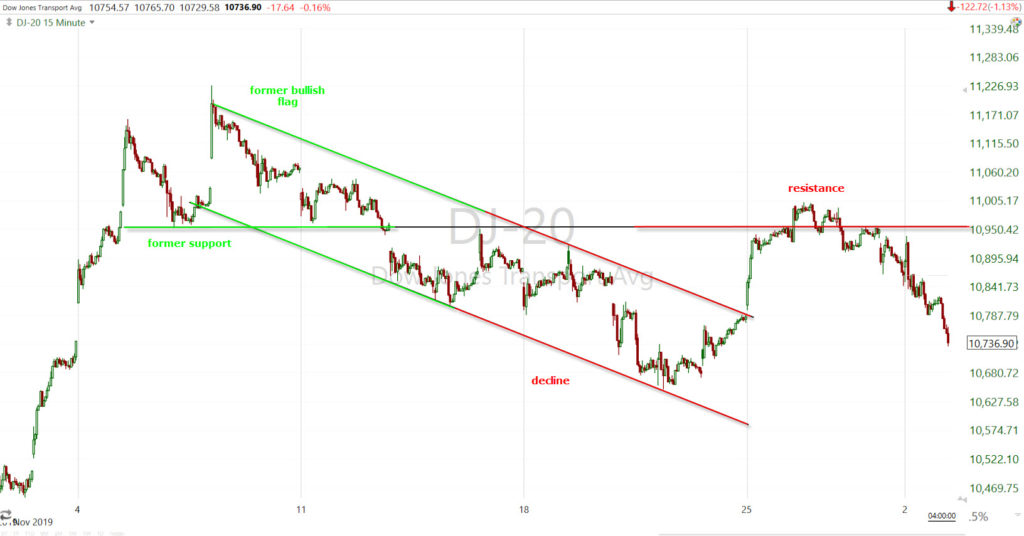 Dow Transports (15m) went from a bullish flag to a minor down trend, as did Regional Banks, the same way they performed at the July trade deal optimism highs. Last week they rallied, but met resistance at former support and turned down.
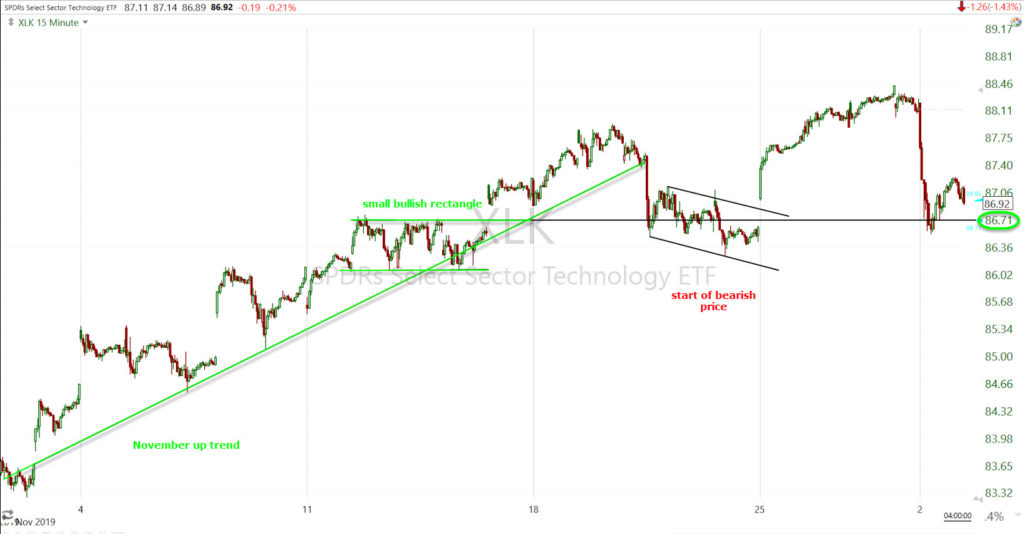 Technology sector (15m) the sector didn’t have much damage other than breaking its November up trend and starting brief bearish price action. Last week it made a higher high, but today were back to where we were 2 weeks ago. The $86.70 area for XLK is a key level of support held today.
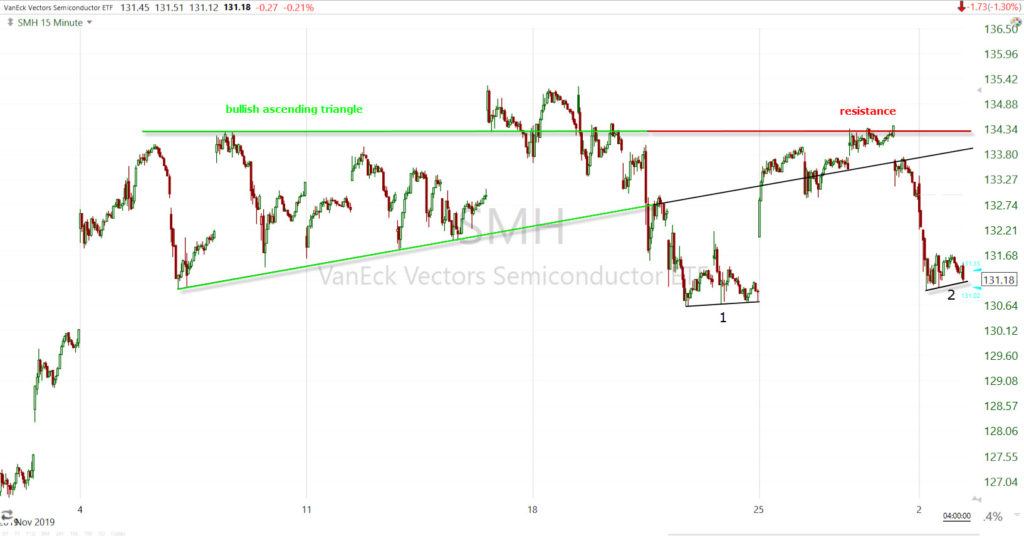 Semiconductors (15m) went from a clean, clear bullish ascending triangle consolidation, to a failed breakout attempt, and broke below the consolidation a little over a week ago. It started a small bearish consolidation before last week lifted the entire market, but it too met resistance at the former bullish consolidation and turned lower. The sector ended today with the start of a bearish flag-like consolidation.
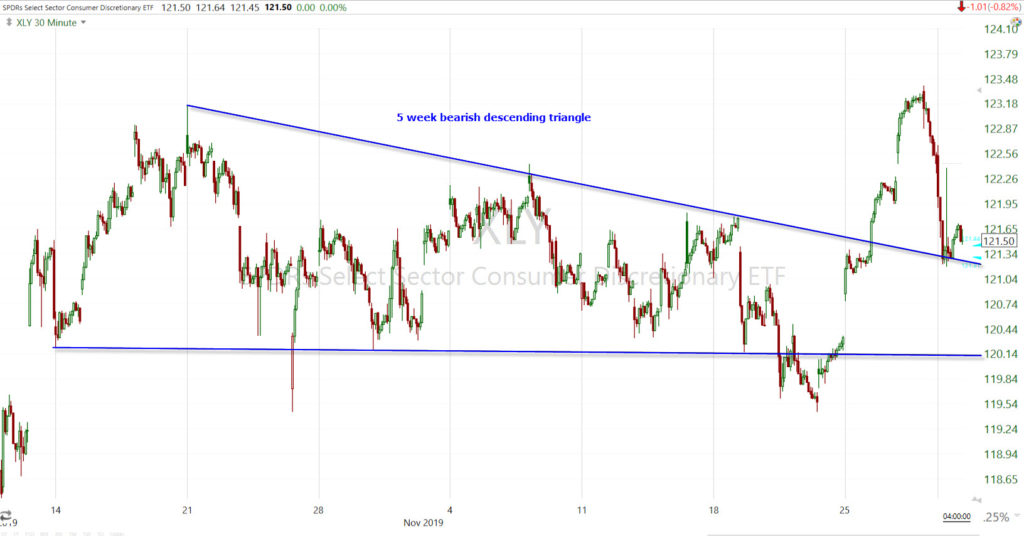 Consumer Discretionary sector (30m) had been one of the worst performers until last week, in a 5 week bearish descending triangle and not participating in any of the S&P’s new highs, or even higher highs. Last week it broke out above, much like IWM, today it’s in danger of a failed breakout, much like IWM. This is clearly one of the sectors that was part of last week’s massive short squeeze and that short squeze appears to have been driven by Moore Capital Management unwinding their short book as they close the fund down.
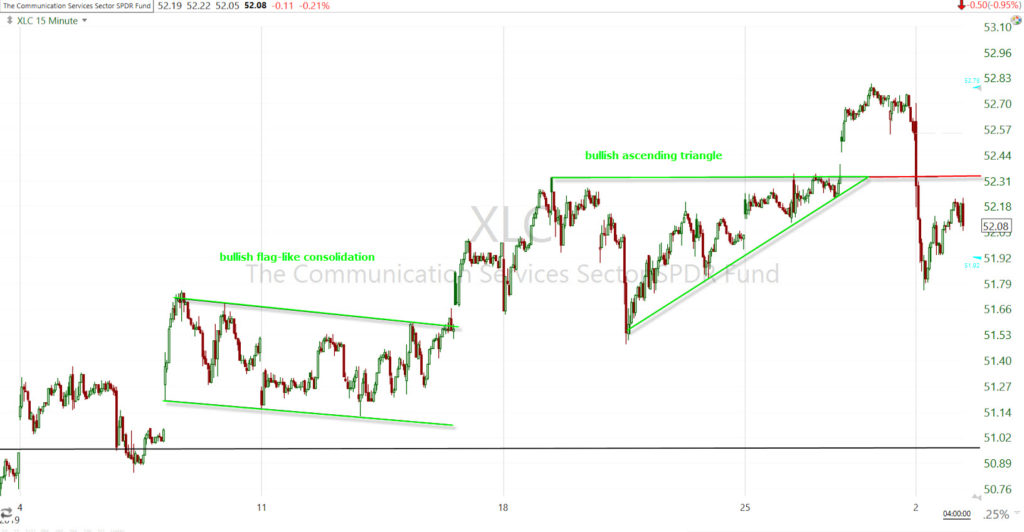 Communications sector (15m) broke out of a small bullish ascending triangle last week, and failed today.
The technical outlook from a price perspective, is back to the week before last as things were taking a turn from bullish, to more bearish price action. There was a 3-day break in the more bearish price action (last week).
Internals
NYSE Advancers came in at 807 vs. Decliners of 2090 on Volume of 784.5 mln
There is a Dominant price/volume relationship of close down/volume up which is a 1-day oversold condition, however today’s volume is not comparable to Friday’s half day.
Treasuries
Treasuries did not at all as I would have expected on a risk off day. They sold off with stocks with major steepening of the yield curve.
The 2-year yield increased two basis points to 1.84%, and the 10-year yield increased six basis points to 1.84%.
There may be two reasons for this. Longer-dated U.S. Treasuries succumbed to more selling pressure, which could be a result of the Financial Times reporting that the Fed is considering a rule to allow inflation to exceed its 2.0% target. Lower for longer, which should effect the long end more than the short as seen today.
Second, the yield curve move has the smell of rate-locks given the underlying macro data, but we will have to wait and see what the calendar looks like – high-grade dealers expect this week to bring $15b-$20b in supply. This is likely to be December’s busiest week, with just about $25b for the full-month in store, according to estimates. That’s $8b more than last year and in line with the $23b that priced in December 2017.
Or the unusual action may have to do with positioning for the new month as November just ended. All I can say now is that I would have expected yields to be lower, not higher today. As I posted earlier today…
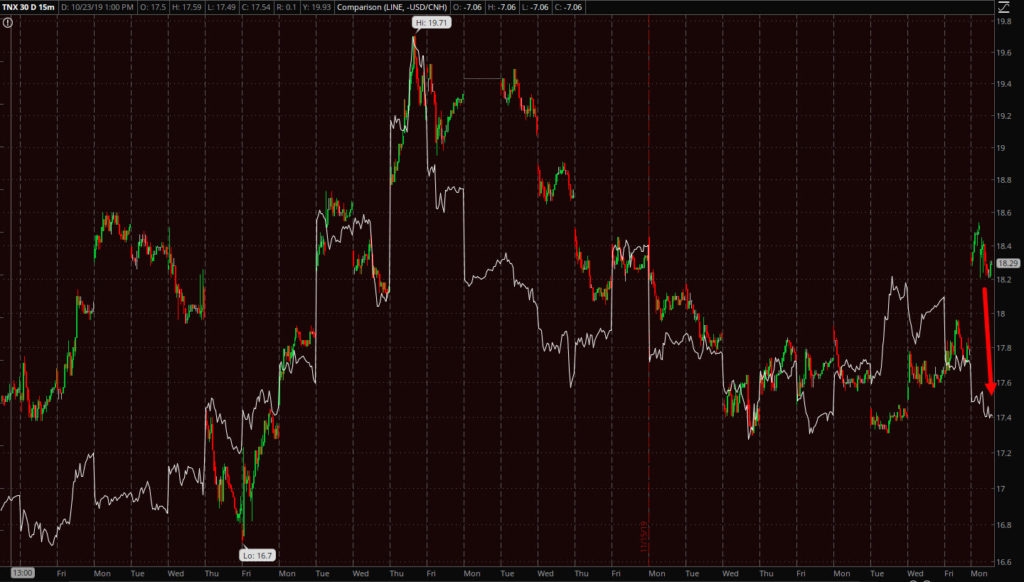
“The 10-year yield has been led by the nose the last 2 months by the Chinese yuan. Yields look a bit high today relative to the Yuan which stocks caught down to this morning, on a short term basis anyway.
10-year yield (15m) and USD/CNH (inverted). The 10-year is up 5 basis points at 1.83%. The yuan suggests it should be near 1.74%”
Currencies and Commodities
The U.S. Dollar Index declined -0.4% to 97.84 in part on the weak ISM manufacturing data, and at odds with the move higher in yields. Today was the Dollar’s biggest drop in 6 weeks.
As already touched on, the Yuan declined on the pessimistic trade news and stocks caught down to the yuan’s take on trade talks. The Dollar-Yen pair moved ower with stocks and led slightly lower at the end of the day.
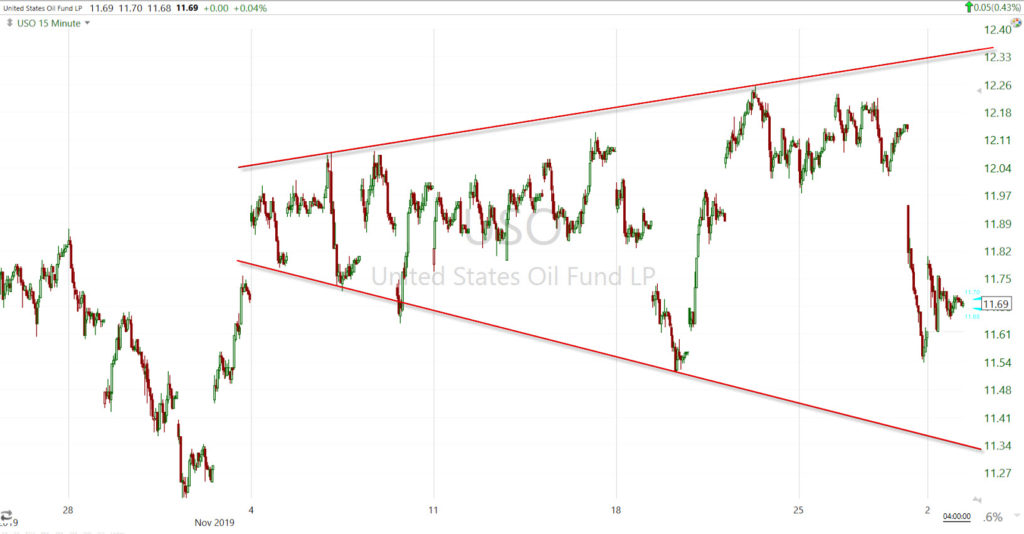
WTI crude settled up +1.5% to $55.99/bbl. Saudi Arabia is reportedly looking to push OPEC for further production cuts in 2020 as it gets ready for its IPO. Just a little over 3 weeks ago there were some broadening formations starting to develop in S&P sectors, the same time one was developing in crude, which has struggled with resistance near WTI $58.
USO/Crude (15m) the price action here has turned from a right angle broadening formation to a more typical mega-phone broadening formation. Again, the price action depicts a market being driven by rumors and news, lacking direction. OR said another way, chaos.
Summary
There has not been a lot of intraday movement on 3C charts the last 6 weeks, other than fairly persistent low grade negative divergence reflecting a lack of follow through in the cash market as most gains have been on overnight gaps. Last week there was a very clear lack of confirmation as the SPY 5m as the S&P gained 1%.
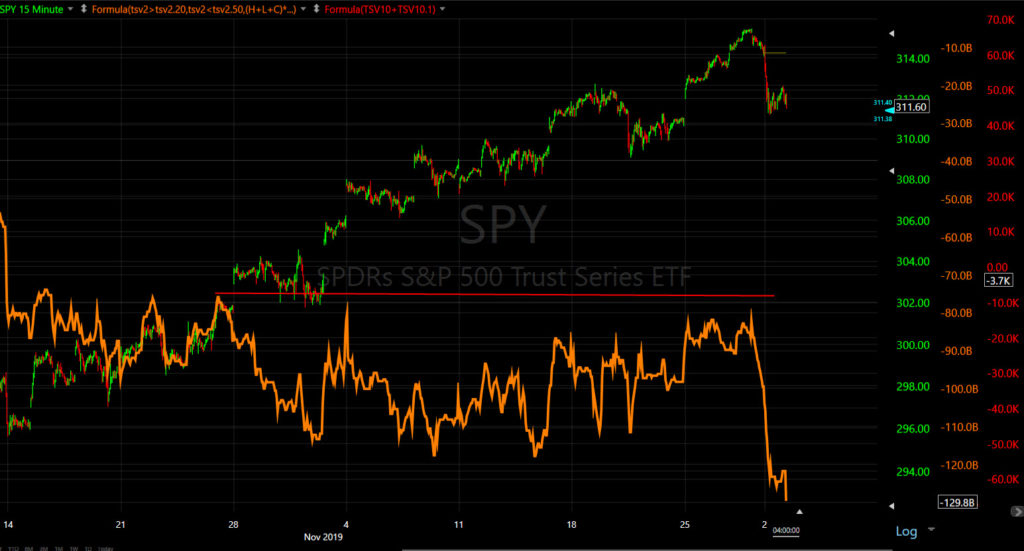 SPY (15m) the cumulative lack of confirmation of the short term charts can be seen on this 15 min trend. Today did some damage.
Today’s intraday 3C activity was more like normal, at least normal before the last 6 weeks. It was much easier to pick out an intraday low as there were some actual participants and higher volatility. This intraday post from 11:28 a.m. ET showing signs of an intraday pivot or low, was within 15 minutes of the actual low and held the rest of the day. That said, the divergence was exactly what I’d expect for the consolidative price that followed.
Internals are pretty close to reflecting a 1-day oversold condition with the majority of S&P sectors down and decliners more than 2:1 over advancers. The price/volume relationship is the third factor needed to confirm a 1-day oversold condition, but volume today is not comparable to Friday’s half day. That said, volume was not all that heavy, coming in under the 50-day average. If volume were notably heavier, I’d call it 1-day oversold.
The averages closed near the low of the day, which is never a good thing. In any case, being nothing much changed by the close, I’d expect that this consolidative bearish price trend from this afternoon, continues tomorrow.
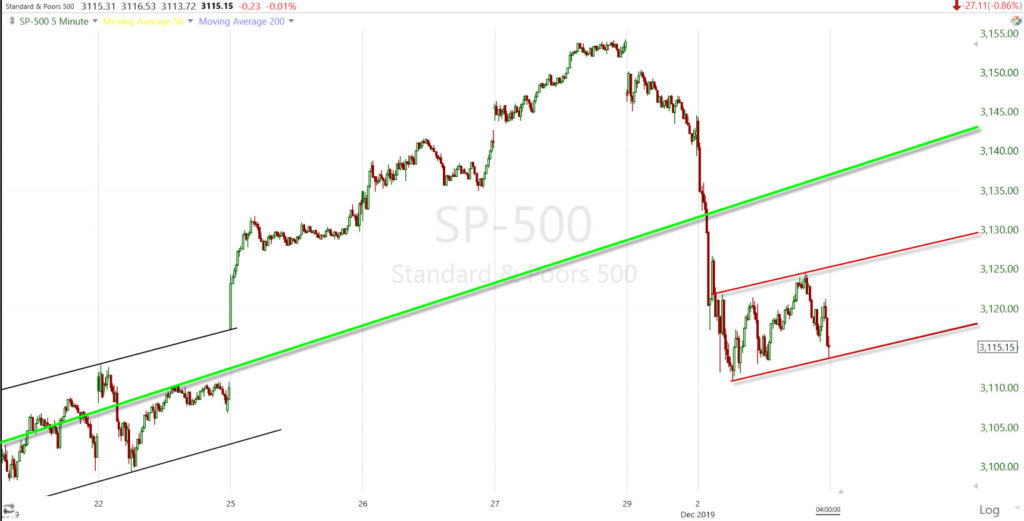
SP-500 (5m) started tracing out a bearish flag after the early decline. Probabilities favor that flag (red trend lines) continuing tomorrow, maybe widening out a little and trading between the lower trend line and the phase I trade deal primary trend in green.
All things equal, if price action continues depicting a bearish flag and price stays below the broken primary up trend, probabilities favor a second leg down which would carry an approximate measured move of -1.3 to -1.4%, or roughly SPX $3070-$3075. I understand the quant/algos average cost is $3100, so a break below $3100 could trigger a larger decline as a break of the quants stop would force them to start deleveraging.
Volatility has made a pretty impressive move so far. I have no reason to believe there’s not more to come presently. Higher volatility also forces the systematic strategies to de-leverage. VVIX closed near $99. A move above $100 would almost certainly see them start selling, and above 110, we’d already be in the thick of something more than just a correction in the major averages.
Overnight
S&P futures are near unchanged and still have the small intraday positive divergence off the morning low, as do the other index futures, suggesting they’ll not lose much ground tonight unless there are new developments (news). Index futures could even gain some ground overnight.
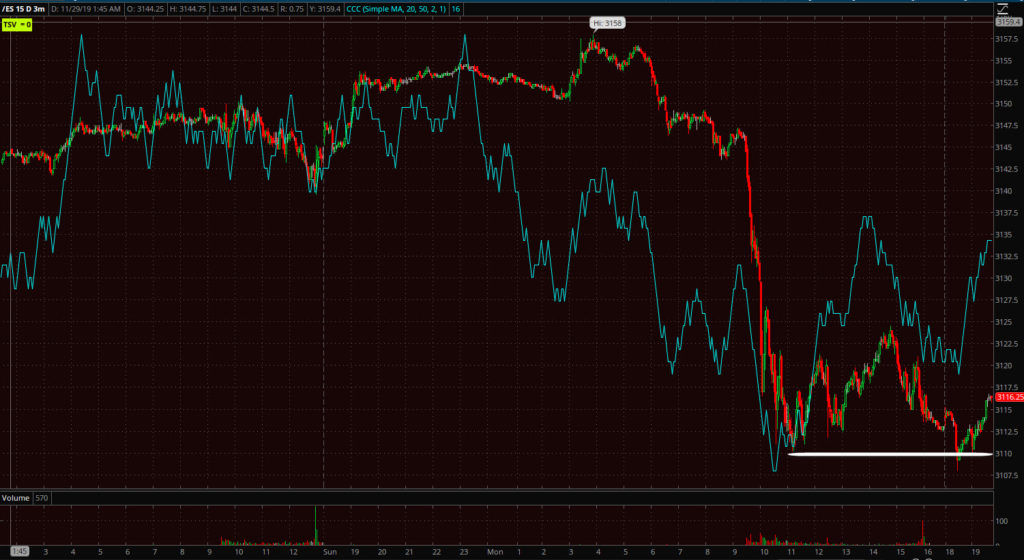 ES/S&P futures (3m) shows some 3C weakness between Sunday’s open and Monday’s cash open, but a small positive divergence by the close.
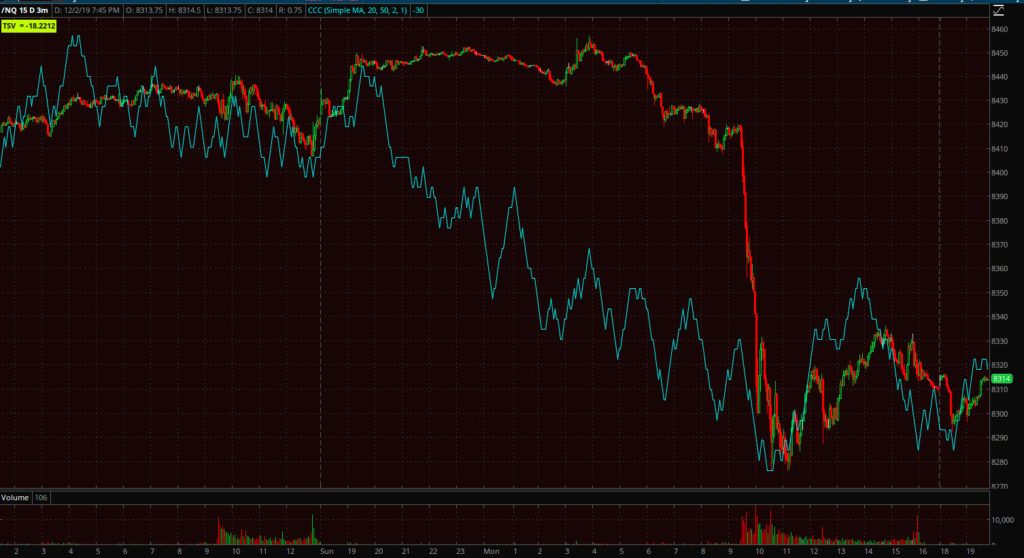 NQ/NASDAQ 100 futures (3m) shows even more of a 3C negative divergence at the same time.
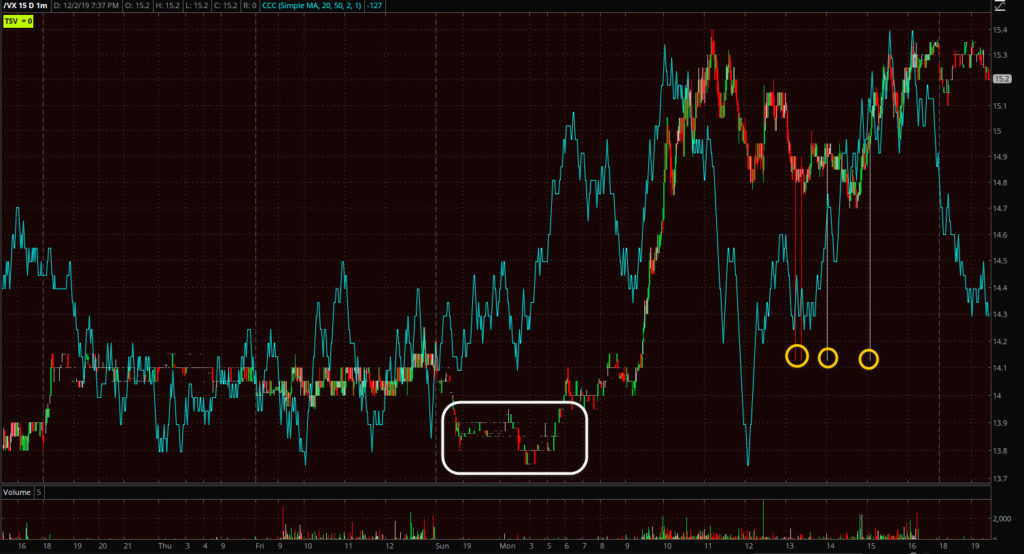
VIX futures (1m) are in pretty good shape tonight. Notice the solid stance this morning with a positive divergence (white) even as S&P future were up 0.4% at the same time. There are some signs of funny business at the long lower candlestick wicks or tails (yellow). The 2-3 minute charts shown this weekend are pretty much the same – in good shape, especially compared to the persistent selling/negative divergences seen for weeks.
I’ll be very interested to see what Treasuries do over the next day or so. They’re price action today did not fit the economic data, the dollar’s reaction, stocks’ price action, or the yuan’s.
Investors will not receive any notable economic data on Tuesday.


