Daily Wrap – Election Day Stock Market Update
Small Caps led the way higher for a second day, although the mega-caps did some early catching up and some afternoon stagnating. The U.S. Dollar pulling back fairly sharply was a major tailwind for stocks. Still, trade was exceptionally technical in nature. The bond market reflected a positive economic bias too with yields trading higher in curve steepening trade.
Trade was very technical again. After filling gaps from last Wednesday and running into various technical trend lines, the averages spent the afternoon in consolidation. Russell 2000 did make new session highs and that was due to the Most Shorted stocks squeezing shorts through the afternoon.
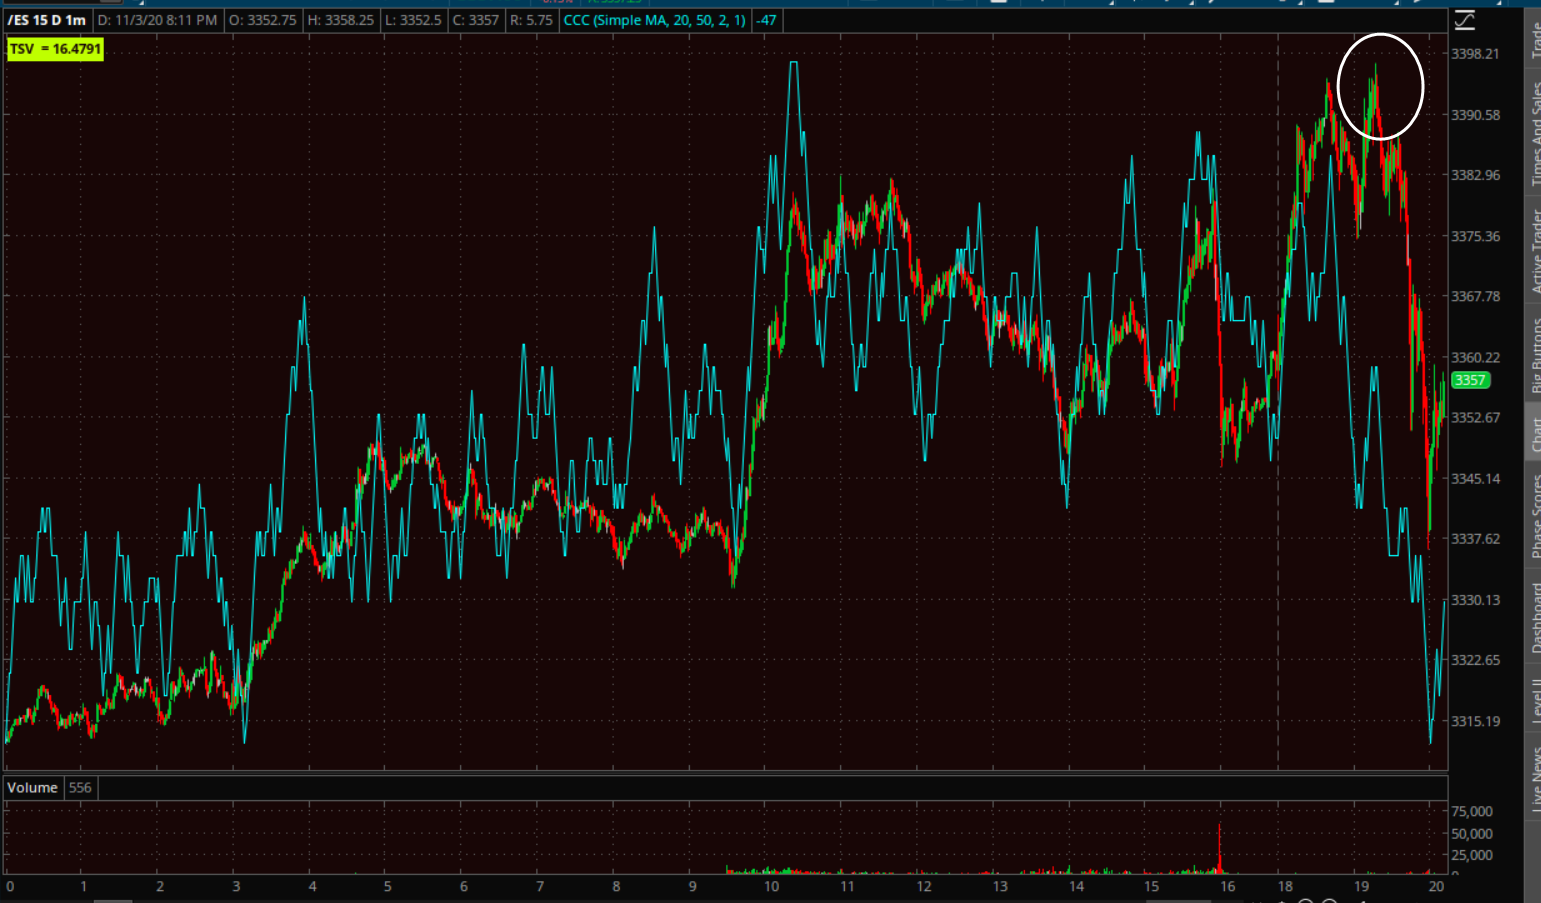
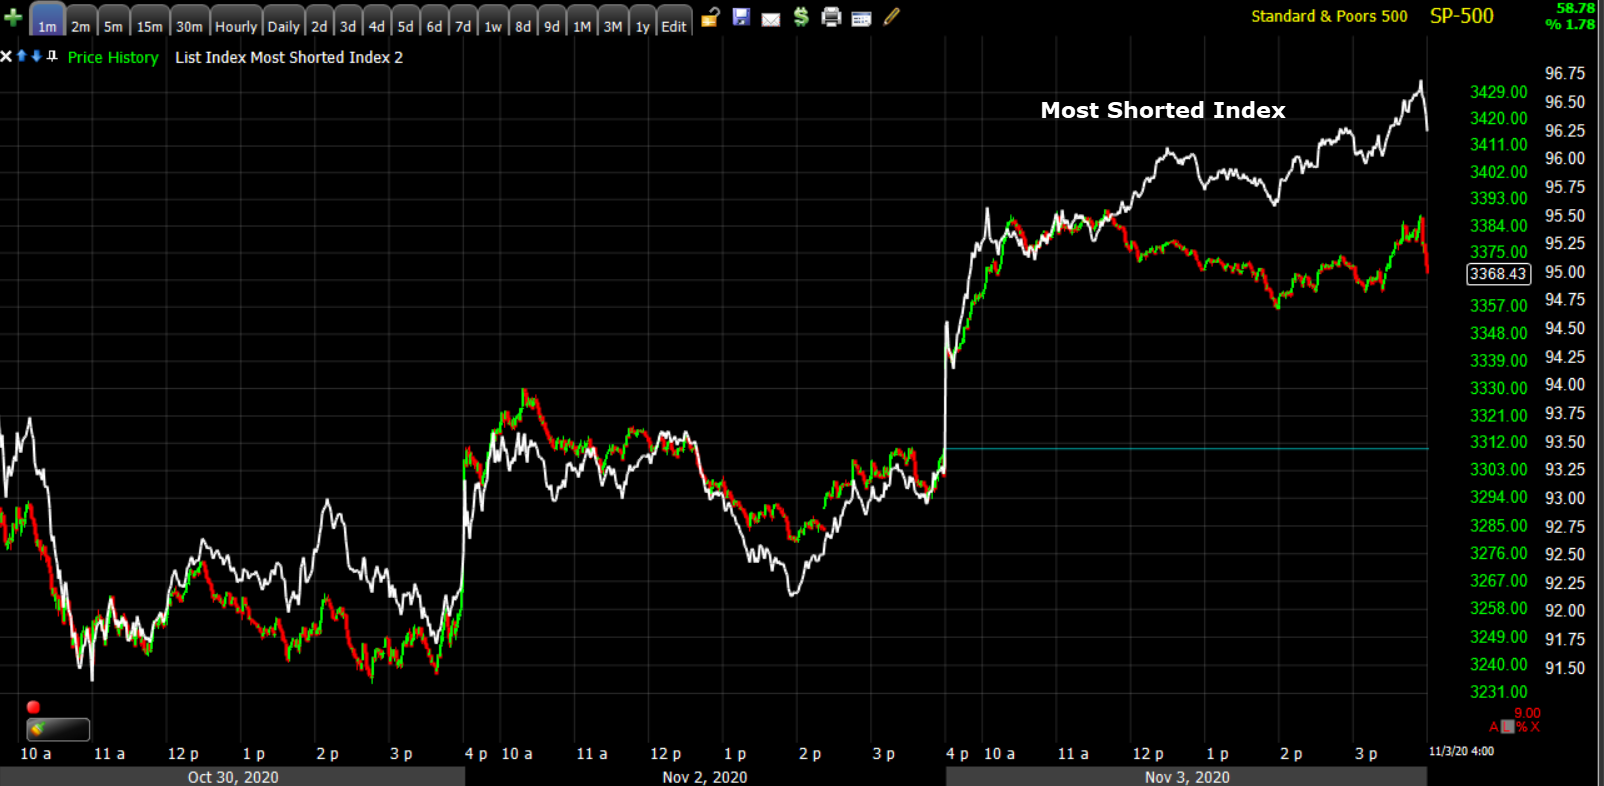 SP-500 (1m) and Most Shorted Index of stocks. As I said last night (and often), this is why I rarely open new short trades when markets are at extreme oversold levels. You’re begging to be squeezed out of your short position.
Averages
Small Caps outperform again.
S&P 500 ⇧ 1.78 %
NASDAQ ⇧ 1.76 %
DOW JONES ⇧ 2.06 %
RUSSELL 2000 ⇧ 2.91 %
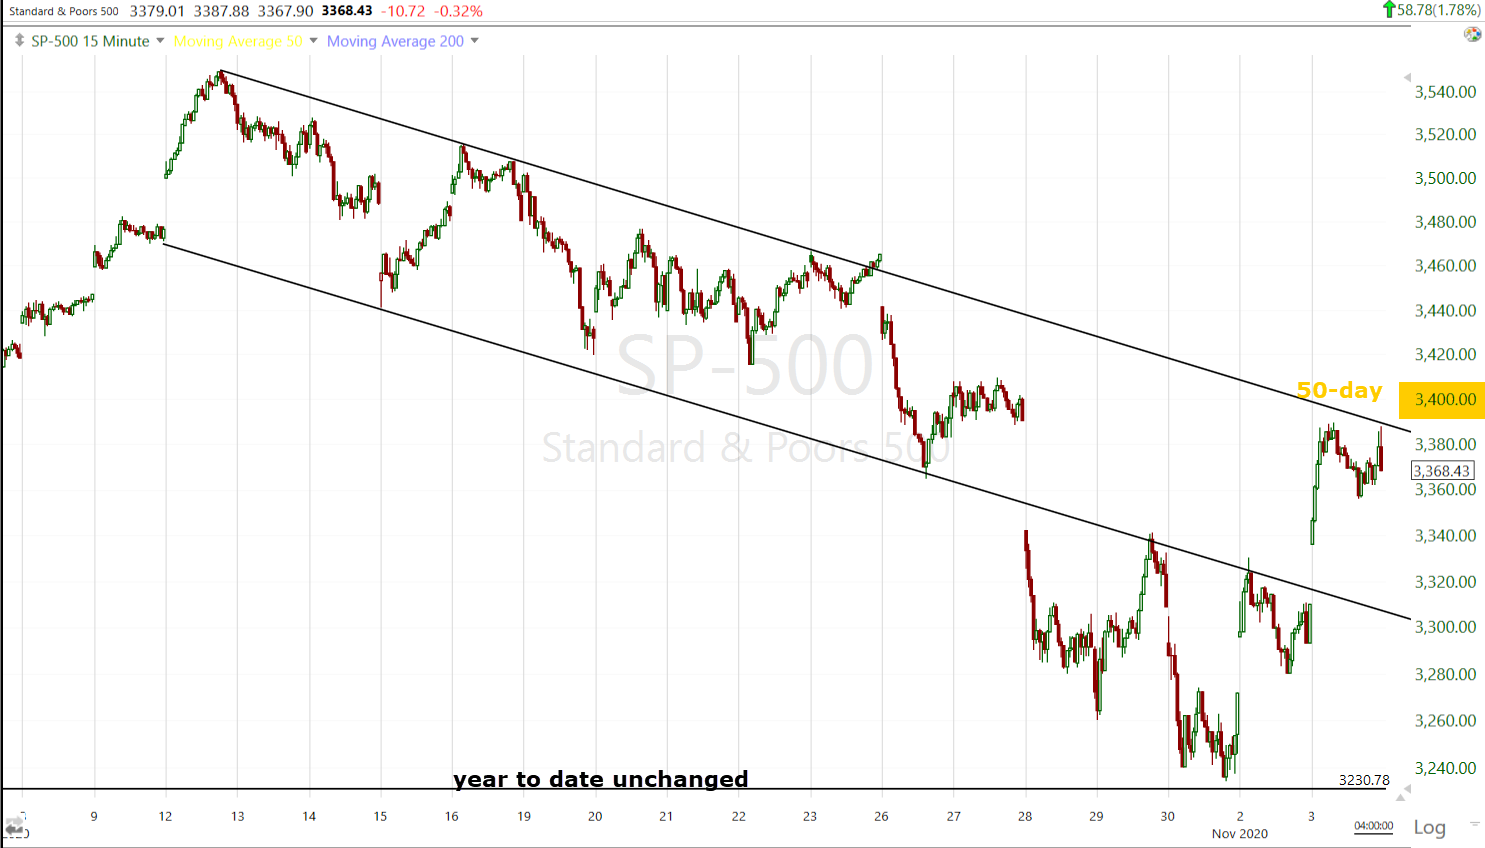 SP-500 (15m) traded up to the top of the channel and just under the 50-day around $3400.
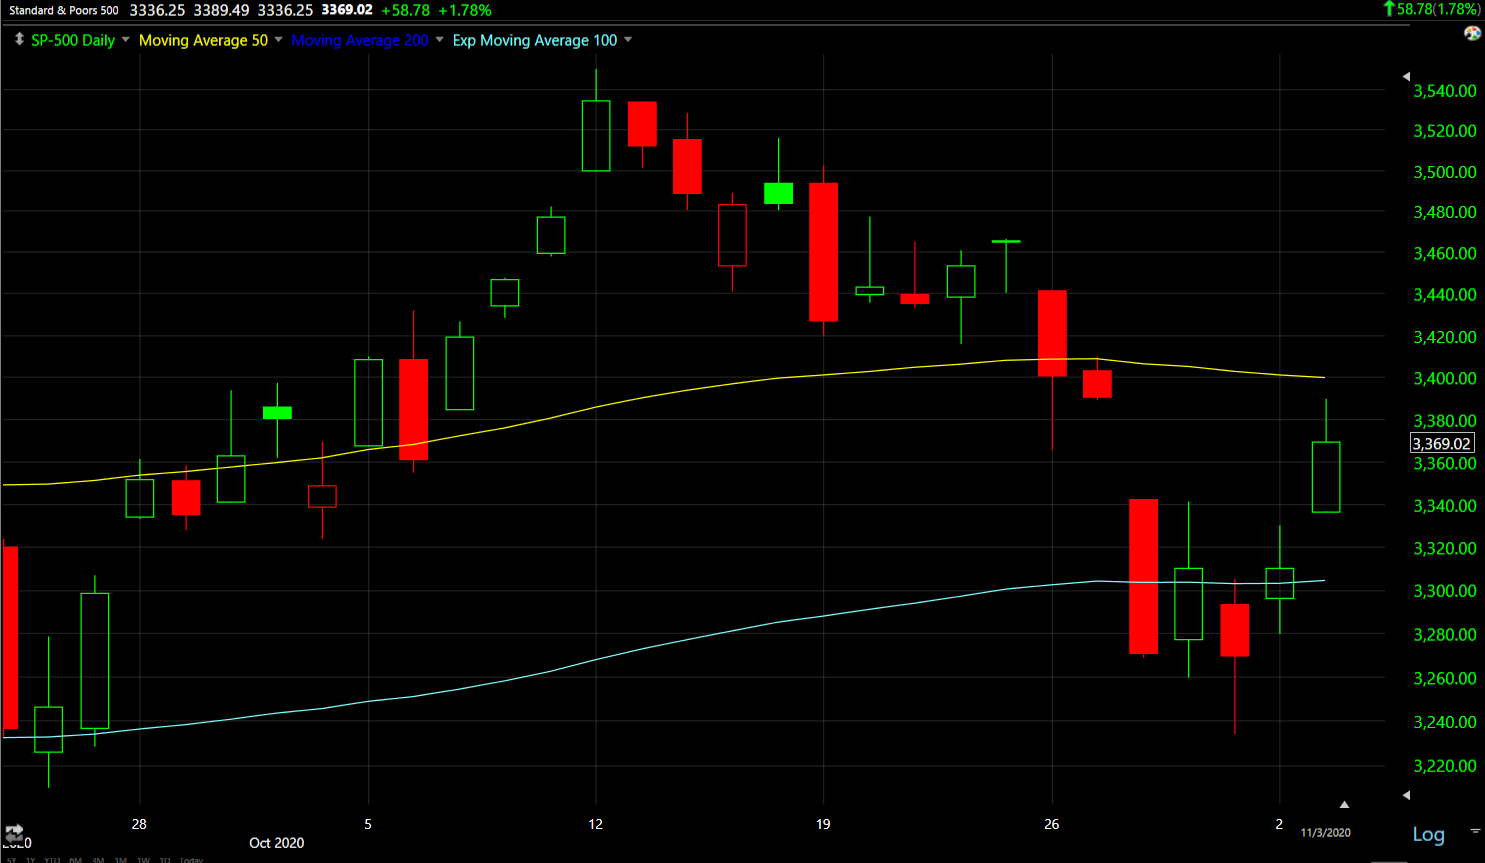 SP-500 (daily) just 12 points short of its 50-day, which is the upper boundary I expected yesterday.
It’s remarkable how similar the current market looks to this day 4 years ago in at the 2016 Presidential election.
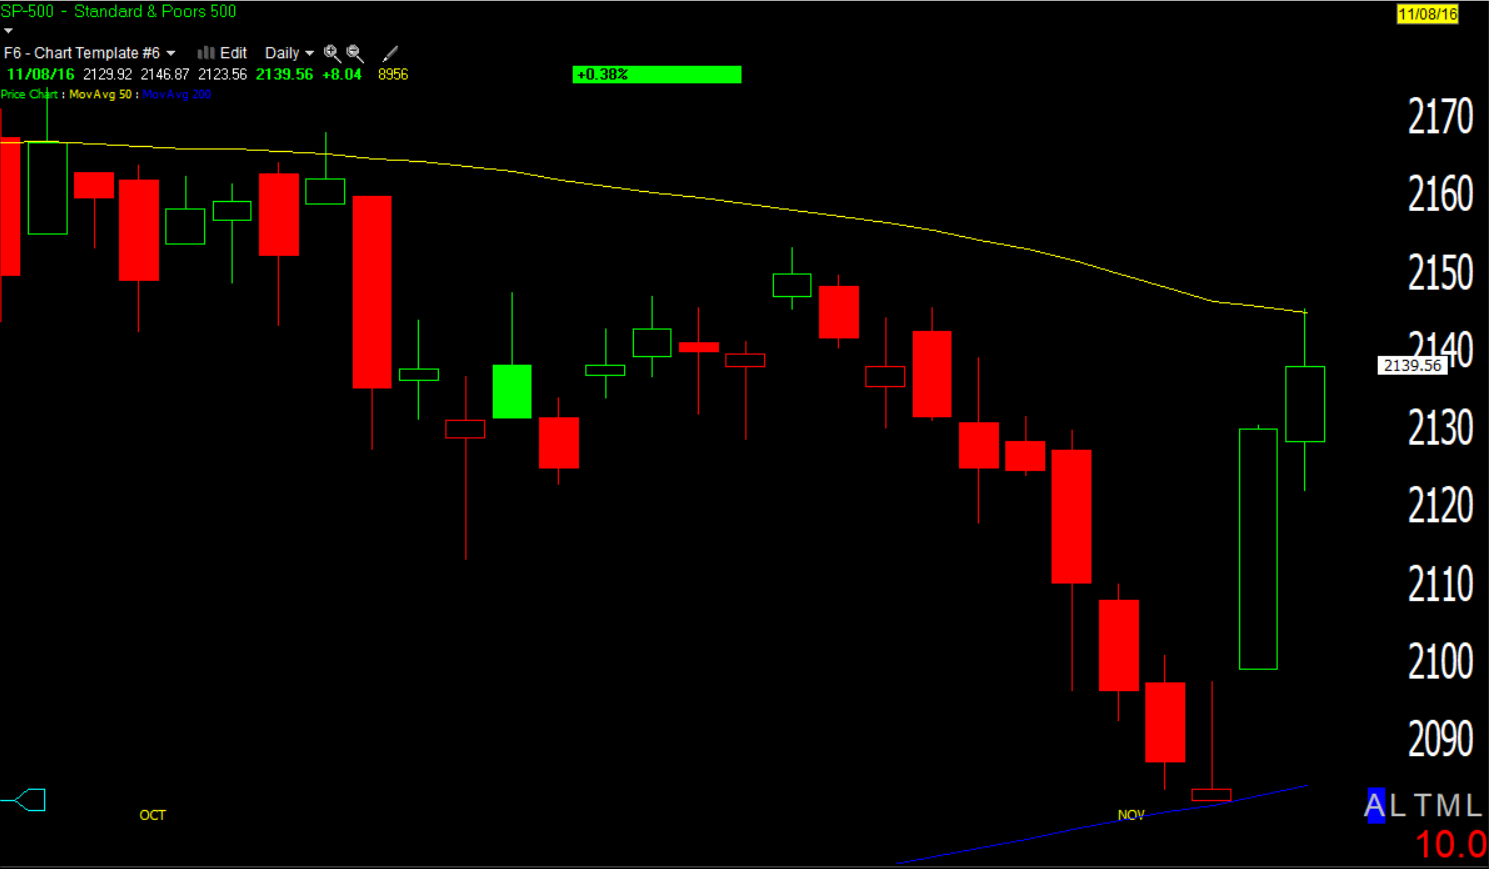 SP-500 (daily 2016) sold off a couple weeks ahead of the election, found technical support at the 200-day sma and bounced Monday and election Tuesday into the 50-day, which acted as resistance. Most of you know the market went on a tear higher from there, but few remember that late that night after Trump pulled out a surprise win the market was not expecting, S&P futures tumbled -5% to go limit down, then VIX futures were quite visibly crushed and soon after S&P futures soared higher. Later on we found out that Carl Icahn went out and bought a billion in S&P futures, expecting Trump to deregulate to the benefit of business.
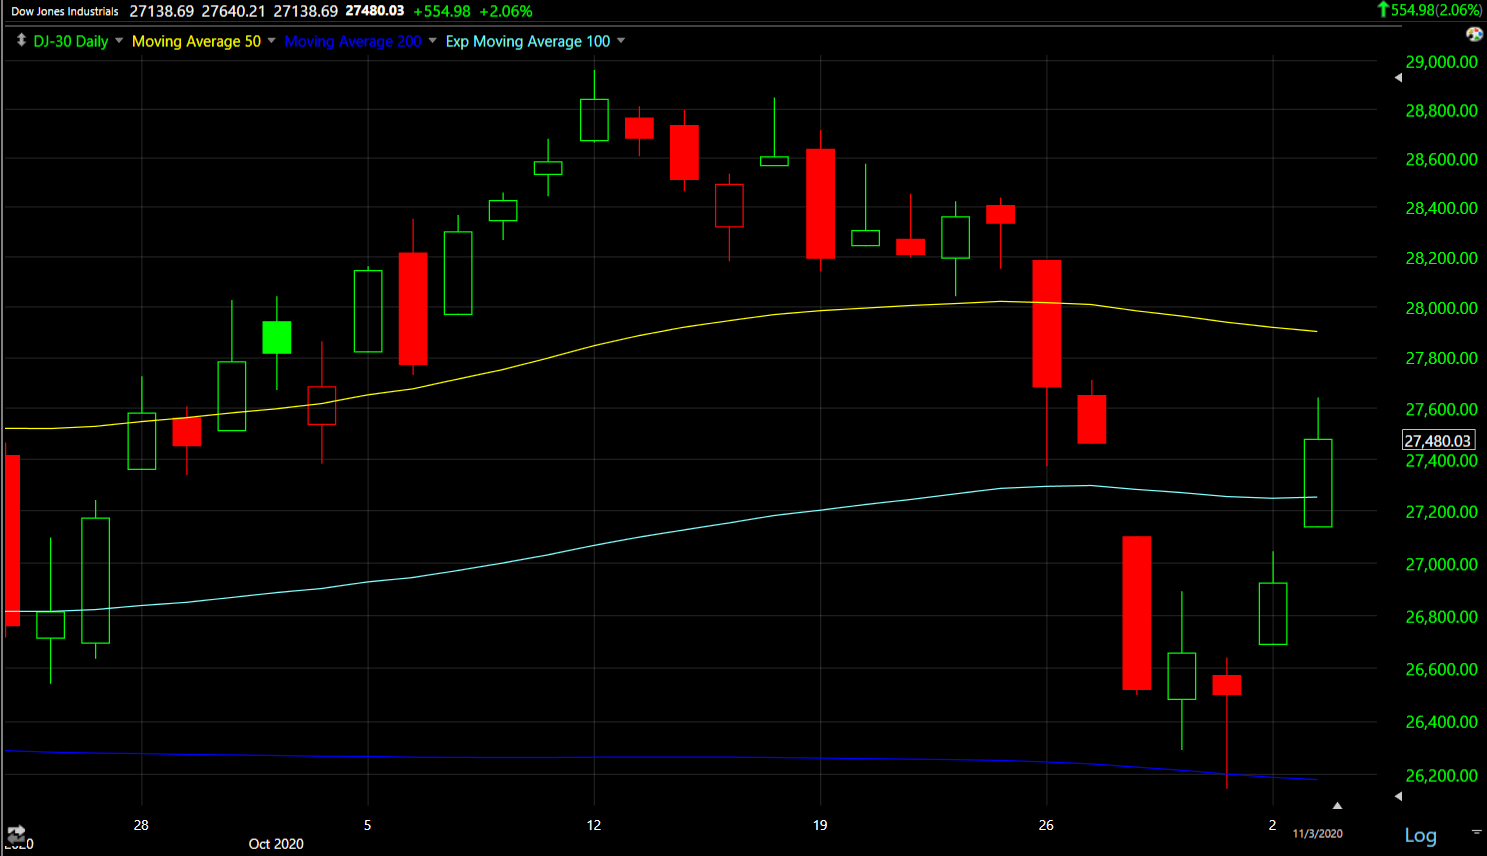 The Dow (daily) fell a little short of its 50-day (yellow), but did bounce from its 200-day (dark blue).
Here’s why…
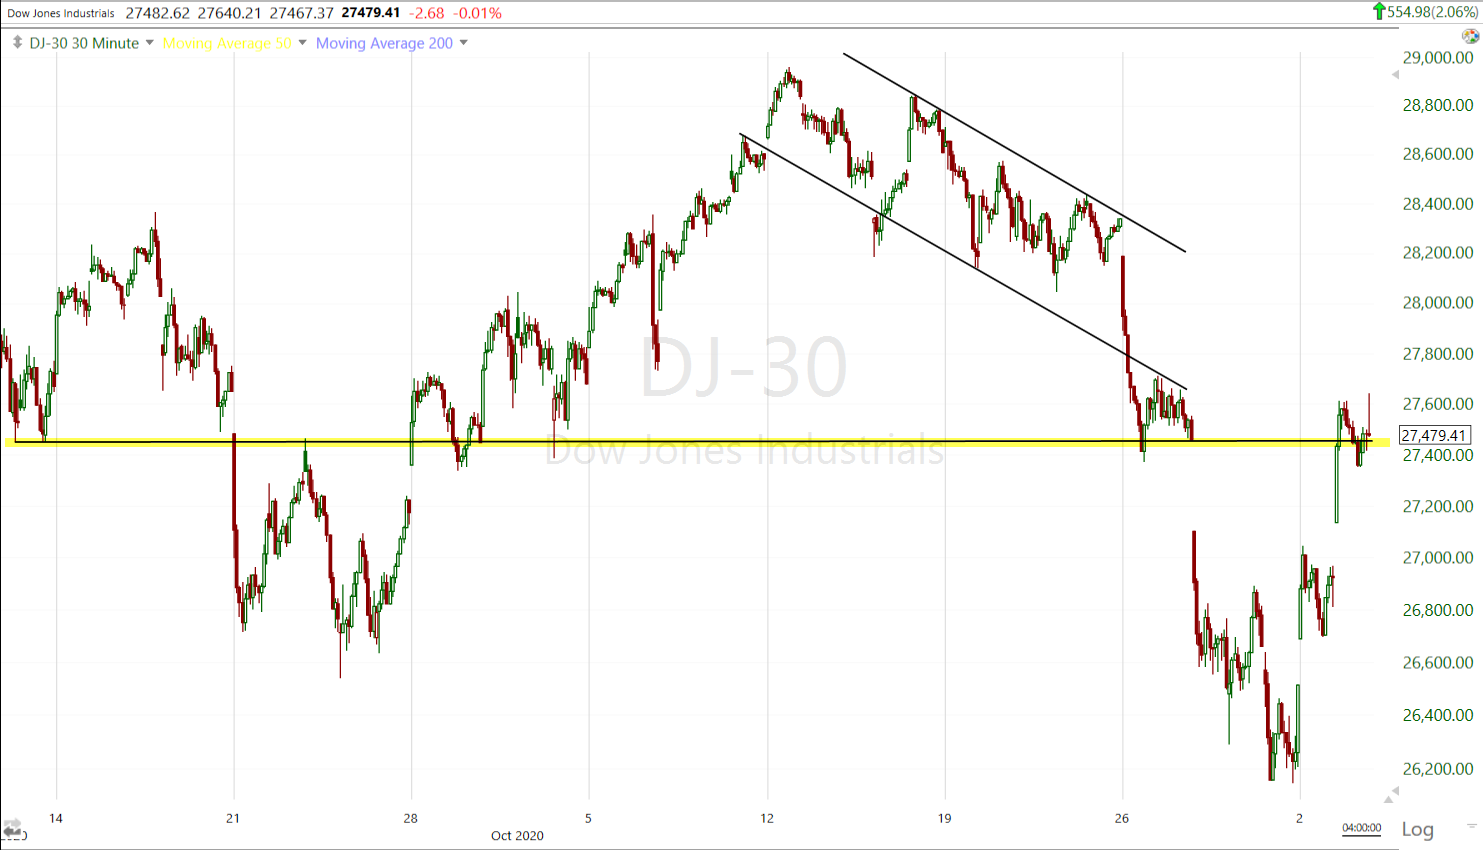 Dow (30m) support/resistance (technical level) at the $27,450 area.
Dow Transports (+3.1%) outperformed Dow Industrials and closed above the 50-day, but fell short of its own key technical level.
![]() Dow Transports (15m) with a key level at $11,700
Dow Transports (15m) with a key level at $11,700
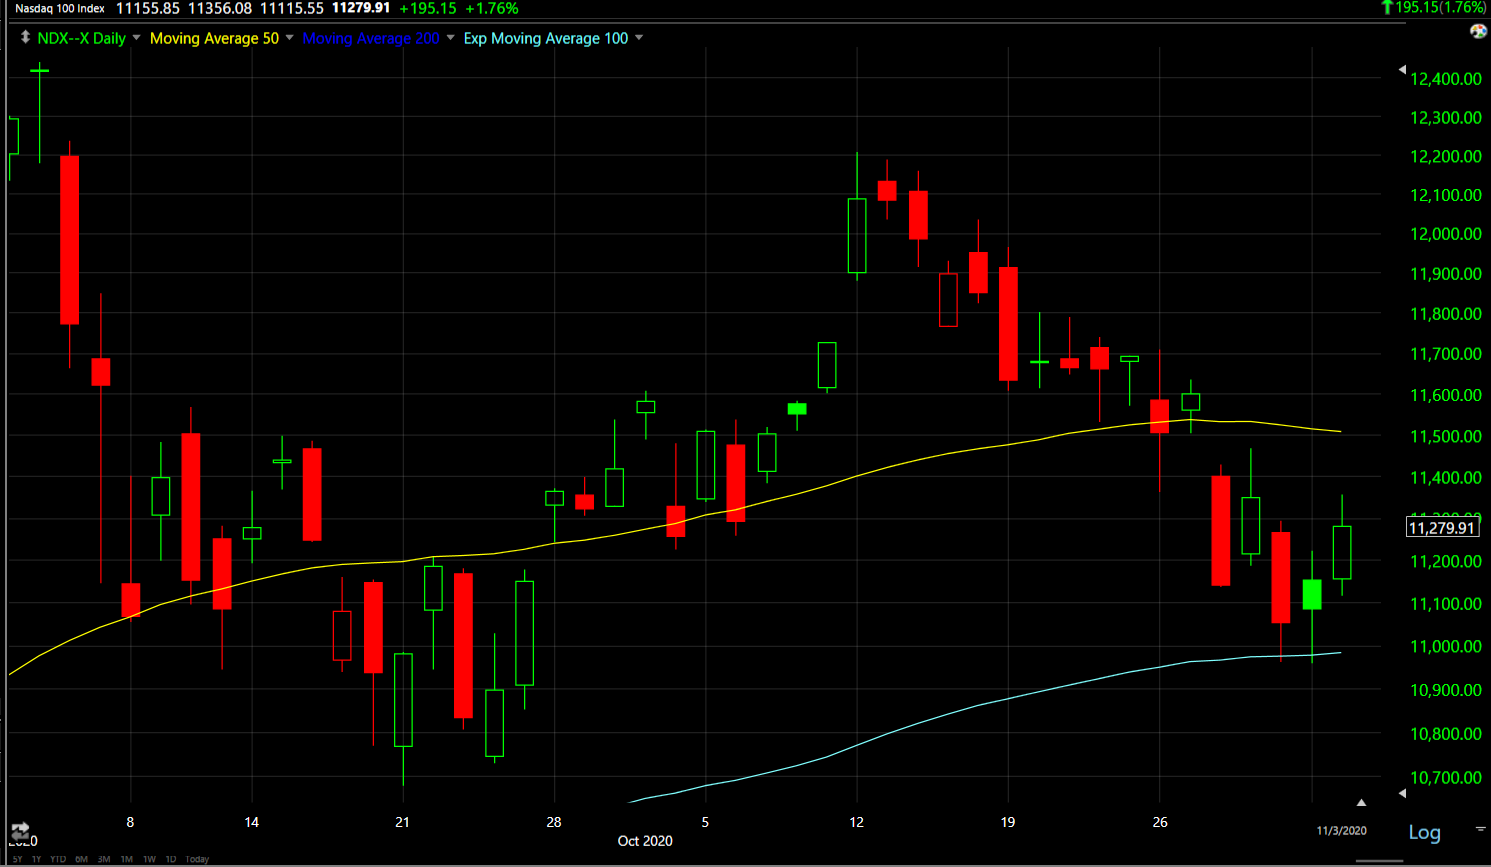 NASDAQ-100 (daily) bounced off its 100-day ema, but fell short of its 50-day, again due to technical resistance.
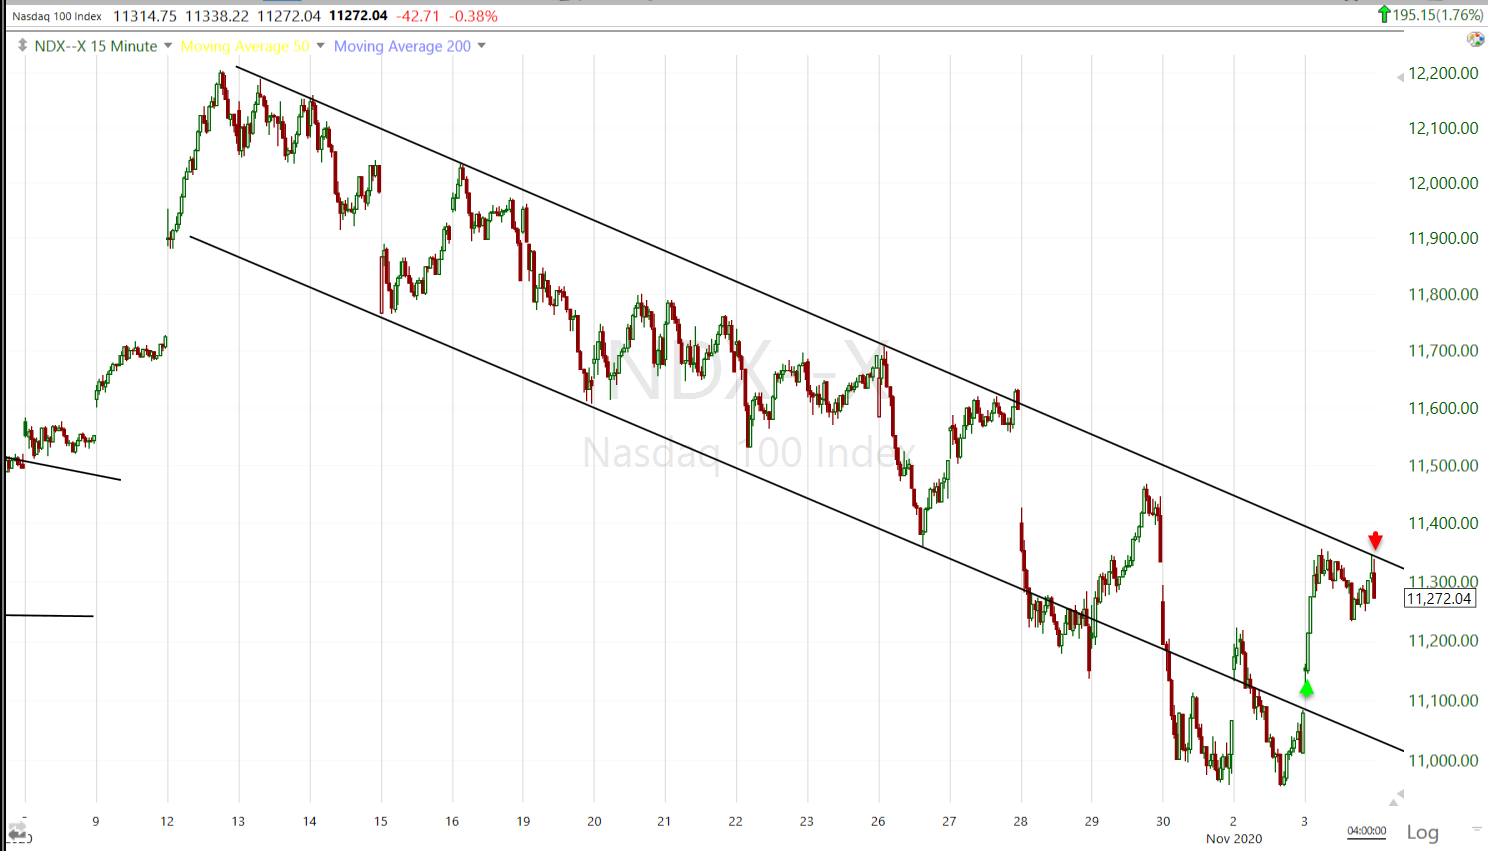 NASDAQ-100 (15m) met resistance right at its 3 week channel
Small Caps did the best in price-percentage terms and technically.
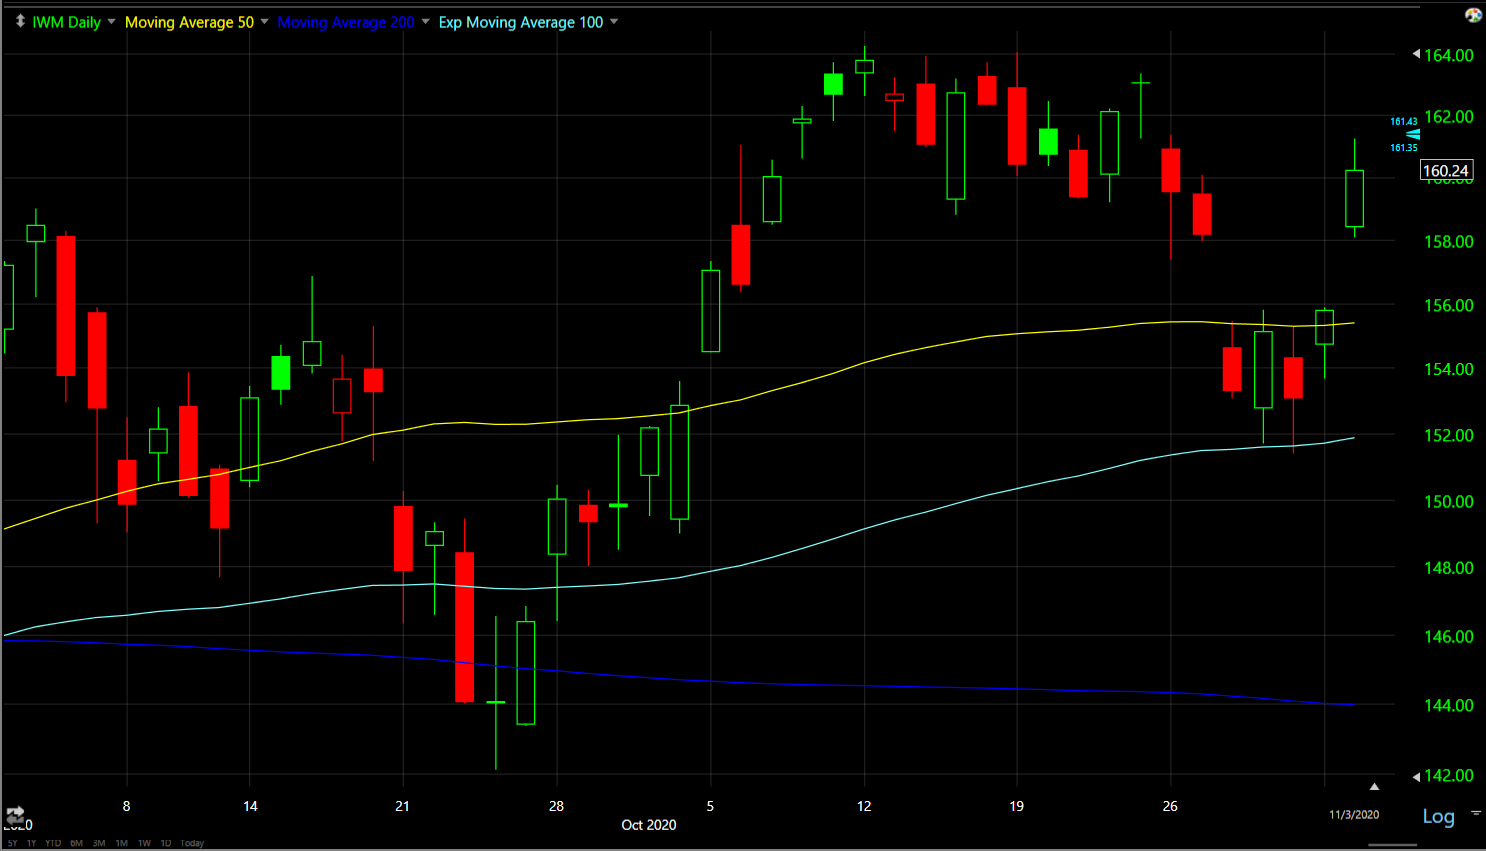 IWM/Small Caps (daily) bouncing from its 100-day ema and above its 50-day sma.
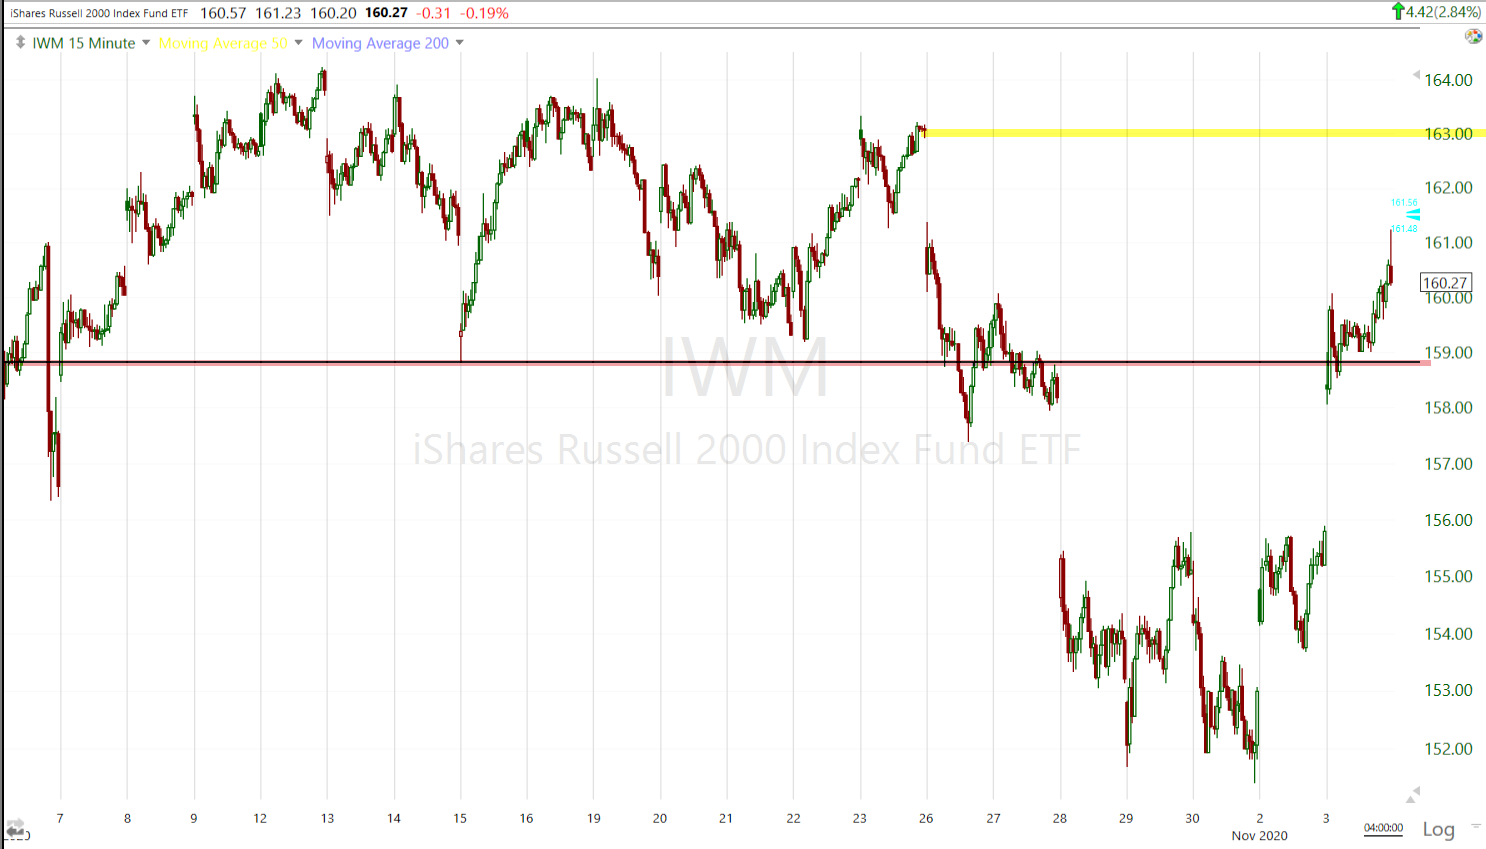 IWM (15m) traded above its own key technical level near $159. It still has a gap up around $163.
3C charts are pretty uneventful at the moment. They displayed the tell-tale signs of technical buying as the averages neared technical support (i.e. S&P’s YTD unchanged mark, NASDAQ’s and Small Caps 100-day ema and Dow’s 200-day sma).
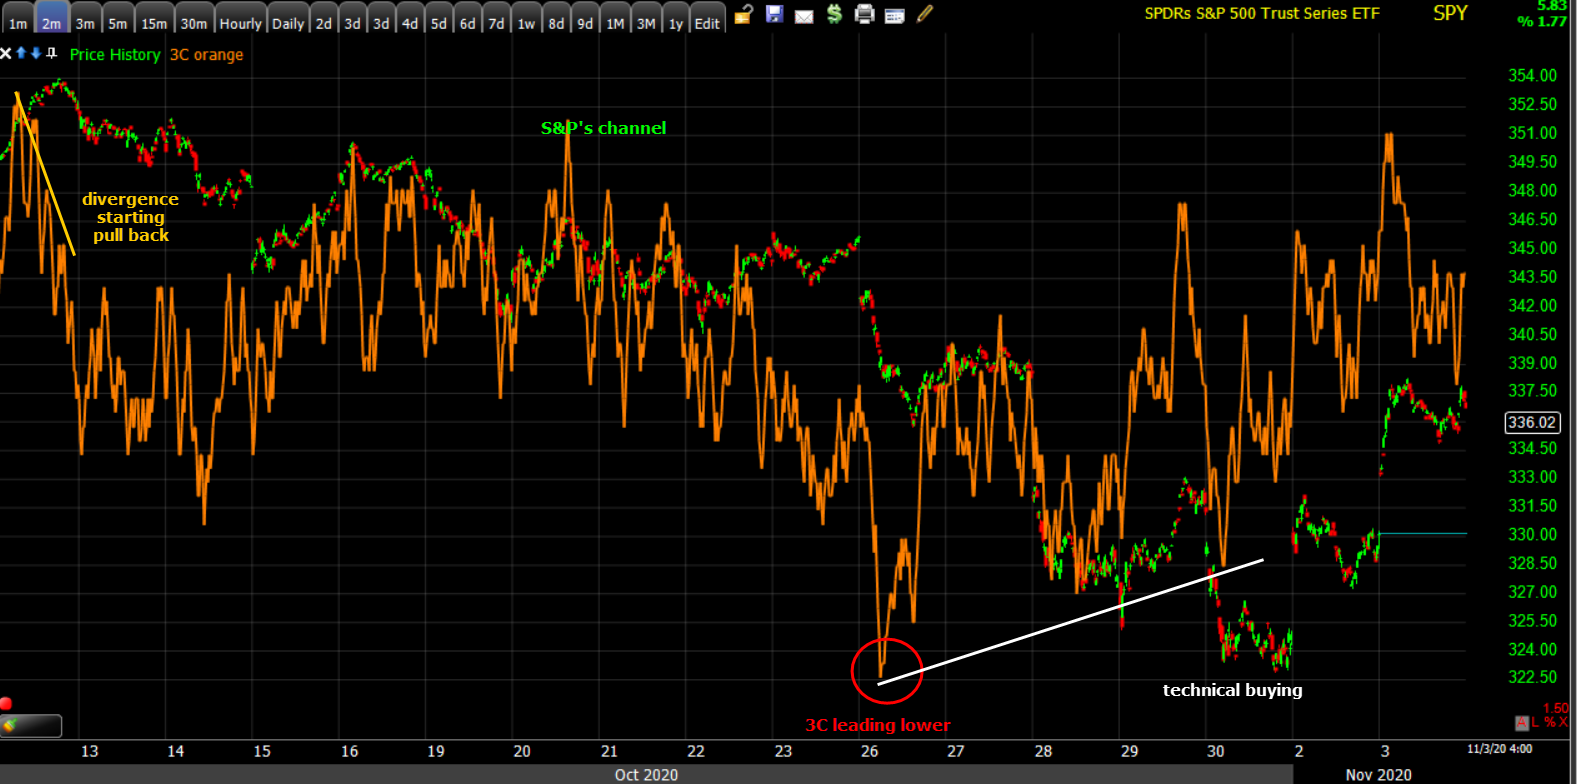
SPY (2m)
I was hoping EEM (+0.45%) would make more progress in filling its gaps above $46. China is a big part of Emerging markets and FXI (China 25) underperformed +0.2%. Last night I mentioned sharp volatility in the yuan. In my view both FXI’s underperformance and the volatility in the yuan suggest concerns over a Trump win and renewed trade war as the administration more or less put it on hold until after the election with the threat that terms would be much worse if a deal were not finished before the election.
Volatility
I mentioned VIX -4.25% earlier with a reminder the FOMC is tomorrow and volatility typically comes under selling pressure 24 hours ahead of Fed events. VIX’s price action suggested a decline to the $32 area…
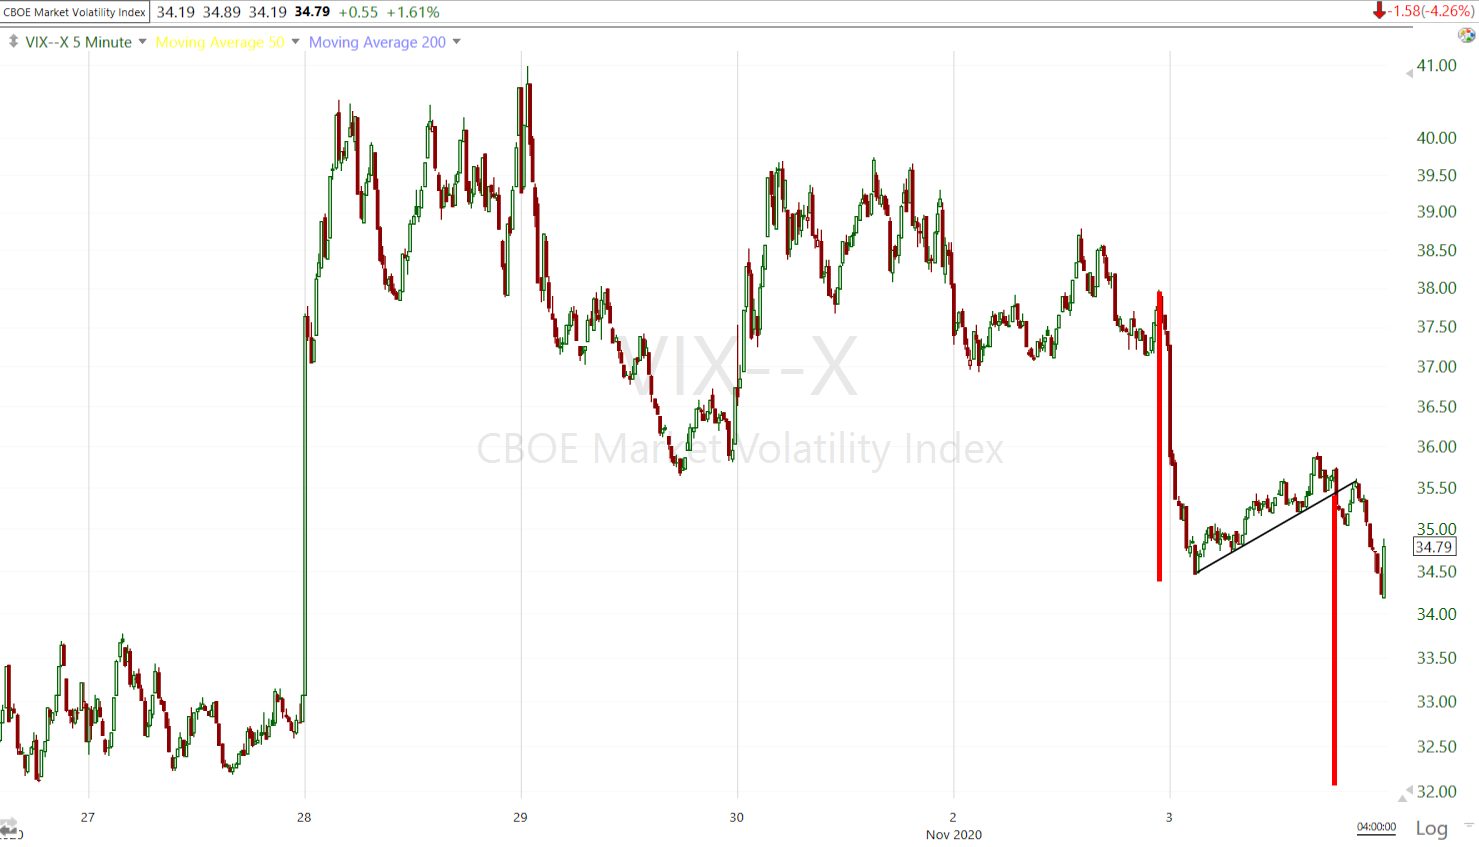 VIX (5m) price-implied second leg toward $32, which also happens to be close to its 200-day…
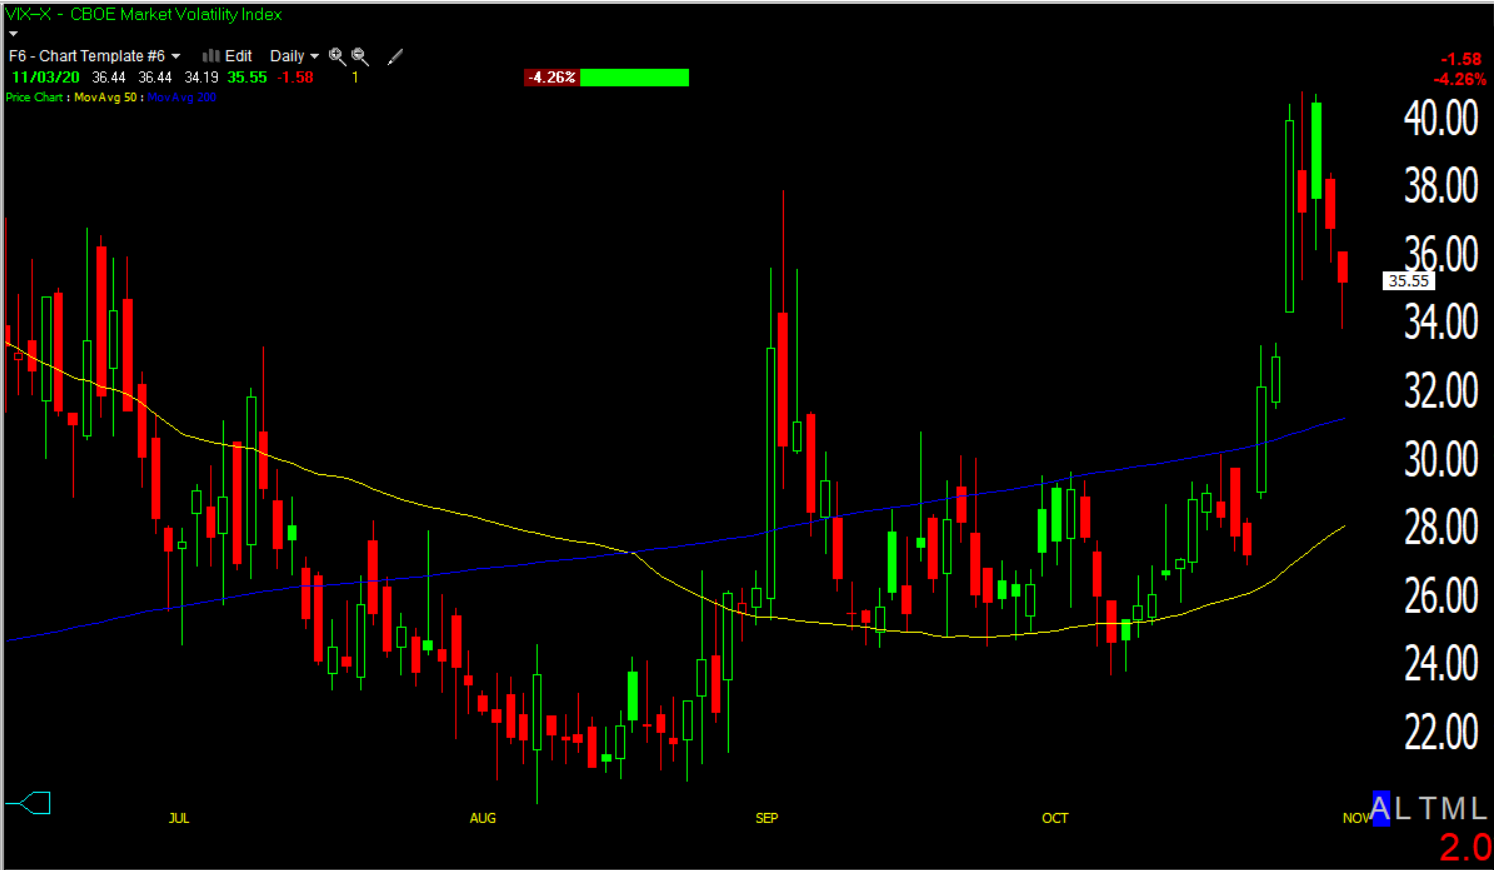 VIX (daily)
Volatility has built up pretty significant relative strength (chart here in the Early Update) . If there’s a clear, uncontested winner tonight, VIX will likely roll off all that strength and trade below its 200-day. The other side of the coin is if the election is too close to call for days or weeks, or contested.
S&P sectors
In one of the best example of the highly technical nature of trade, the Energy sector, which was yesterday’s best performing sector, was the only sector to close lower despite a clear cyclical bias throughout the day, a lower Dollar and crude higher by +2.3%.
Materials ⇧ 1.56 %
Energy ⇩ -0.57 %
Financials ⇧ 2.22 %
Industrial ⇧ 2.95 %
Technology ⇧ 1.76 %
Consumer Staples ⇧ 1.64 %
Utilities ⇧ 1.44 %
Health Care ⇧ 1.46 %
Consumer Discretionary ⇧ 2.20 %
Real Estate ⇧ 1.57 %
Communications ⇧ 1.49 %
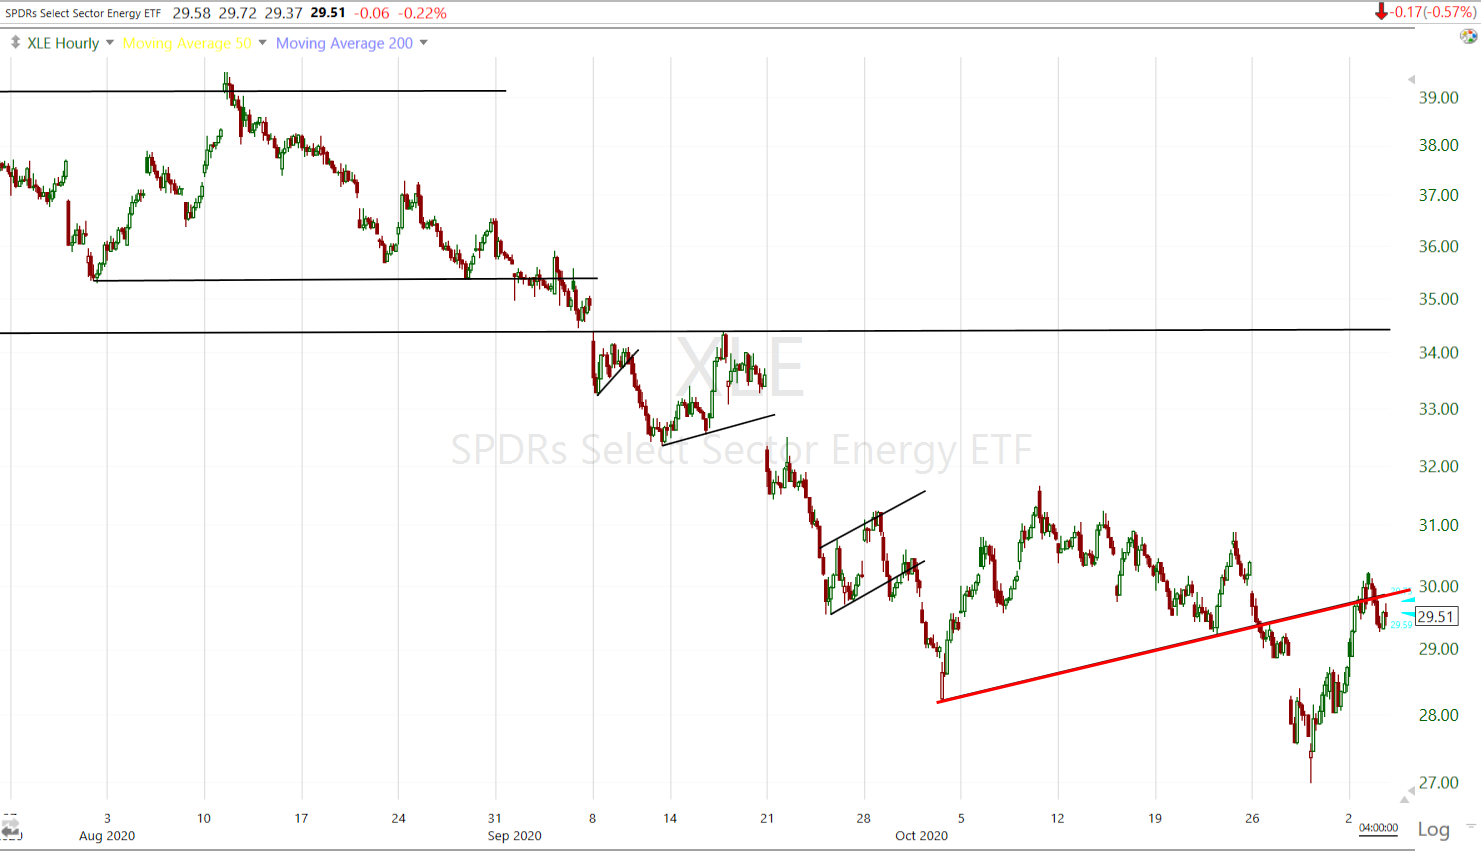 Energy sector (60m) resistance at the broken trend line on a back-test from below.
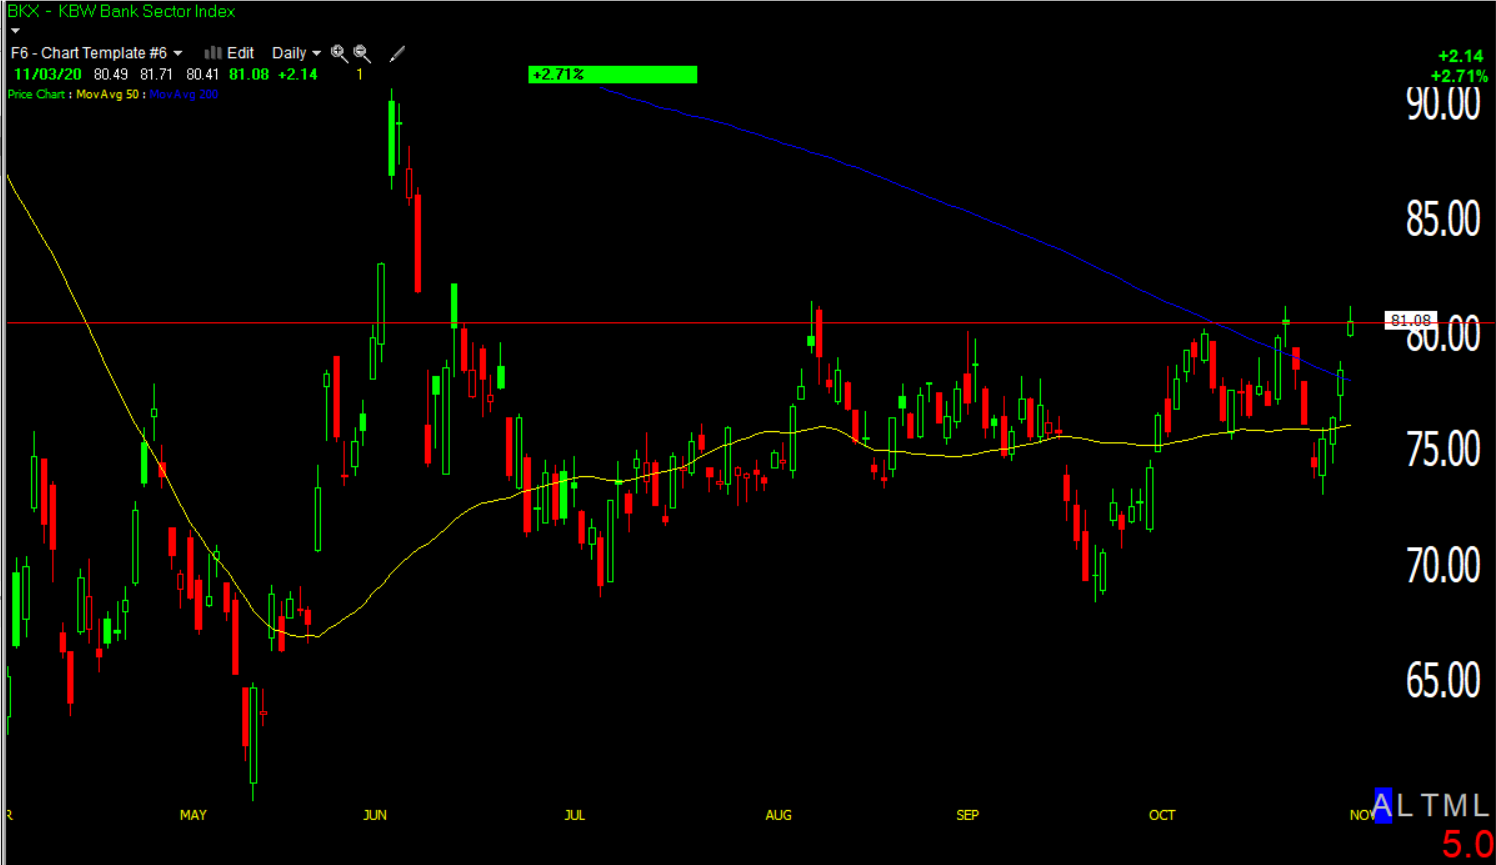 The KBW Bank Index (daily) has every advantage at the moment, higher yields, a steeper curve, a reflationary/cyclical/value bias, yet here it is at resistance at $81.
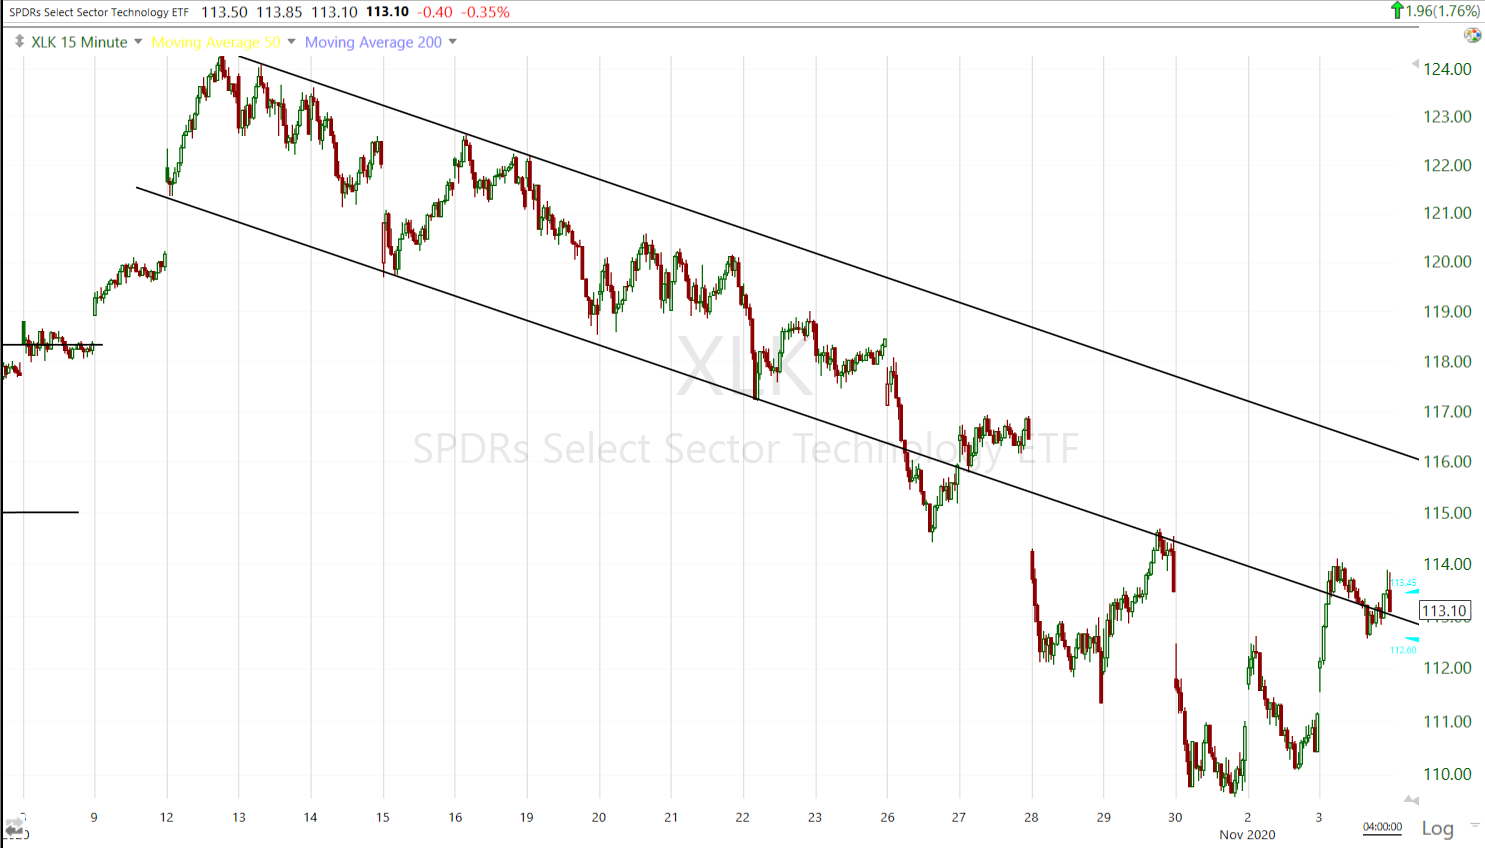 The Technology sector (15m) finding resistance at the bottom of the 3 week channel.
I could go on and on with examples, and it’s not unusual for technicals to play a big role, but the takeaway for me is it’s like the lights are out and the market is holding the handrails (technical levels) until there’s some certainty and the lights come back on.
Internals
Internals reflect small caps’ outperformance. NYSE Advancers (2407) are nearly 4-to-1 over Decliners (606) on slightly lower Volume of 861.9 mln shares, but roughly comparable.
The Dominant price/volume relationship is Close Up/Volume Down, which is the weakest relationship, but Close Up/Volume Up (strongest) wasn’t too far behind.
Overall internals today looked better than yesterday, reflecting more conviction and I think that was because of the Dollar weakness.
I didn’t see any troublesome breadth issues today. The market is out of oversold territory and into overbought.
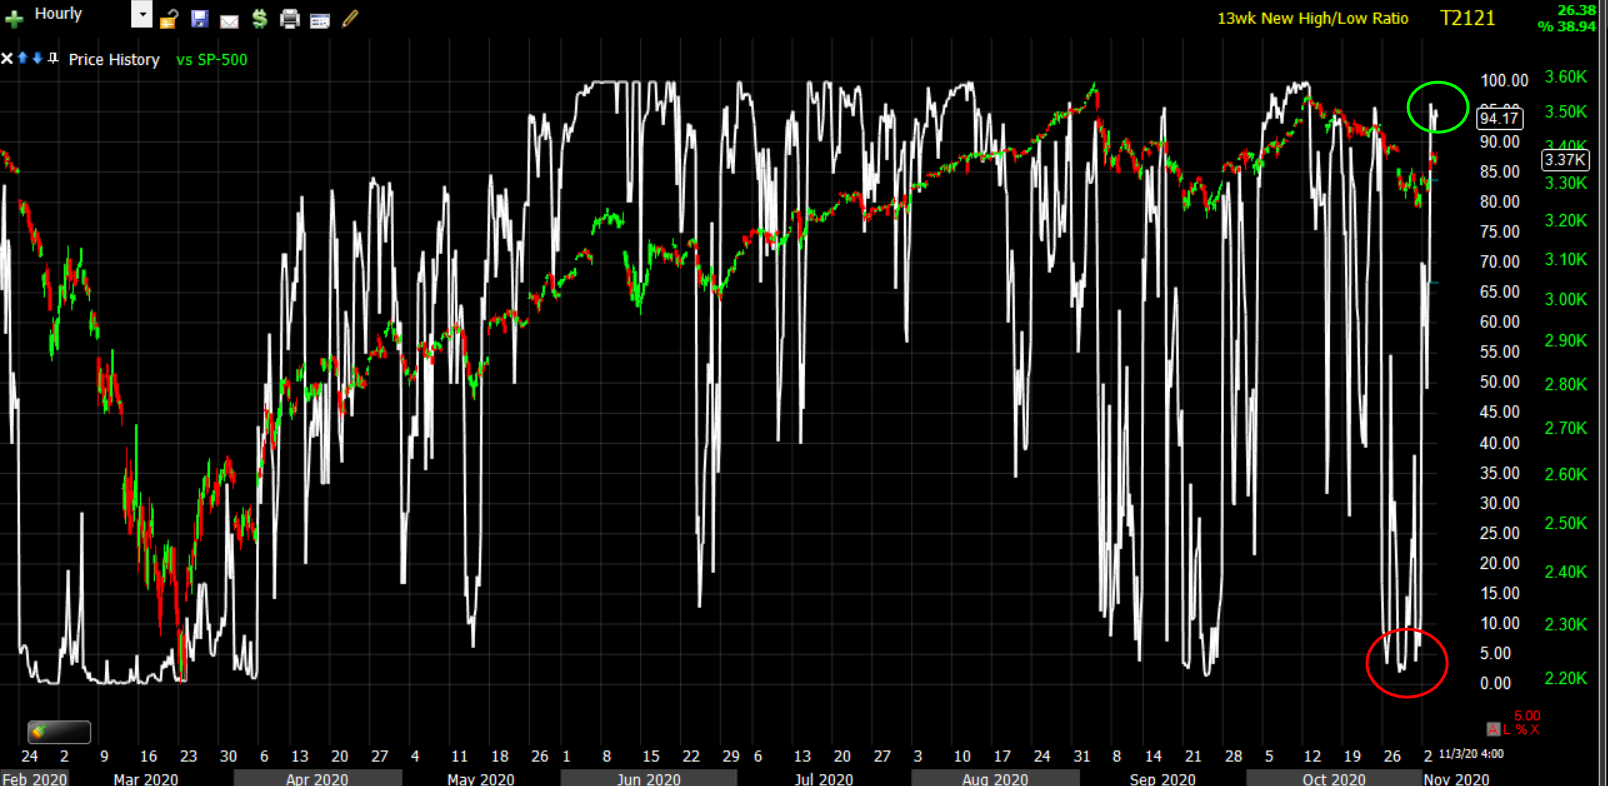 SP-500 (60m) and NYSE 13 week new high/new low ratio from deep oversold to overbought in just 3 days.
Treasuries
The positive price action contributed to continued selling in longer-dated Treasuries, which steepened the curve in a trade that benefited the financials sector and banks.
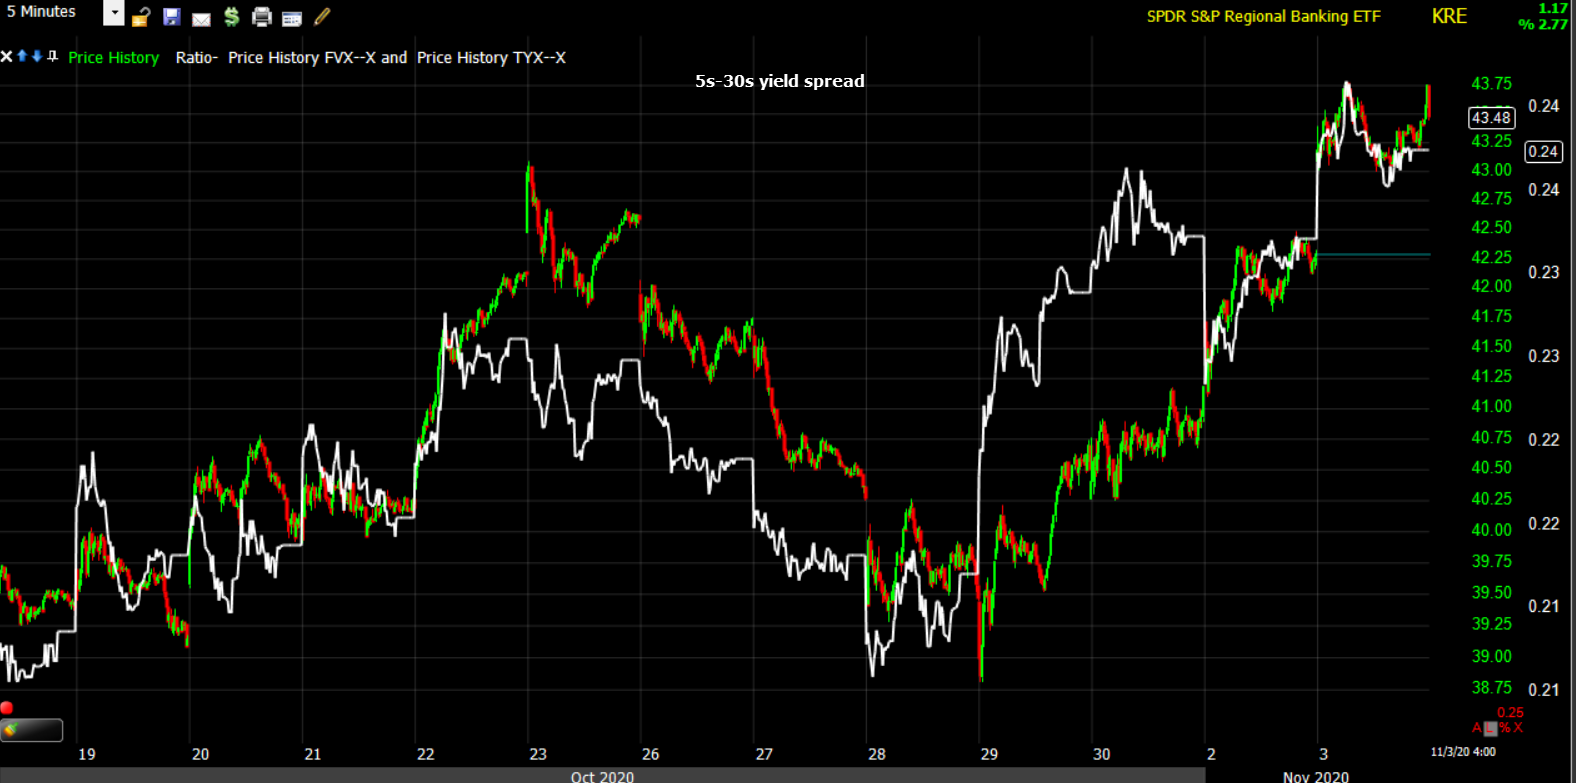 The Regional Banks (+2.75%) are tracking the yield curve.
The 2-year yield was unchanged at 0.16%, while the 10-year yield increased three basis points to 0.88% to close at its highest level since June 8, and above the 200-day sma.
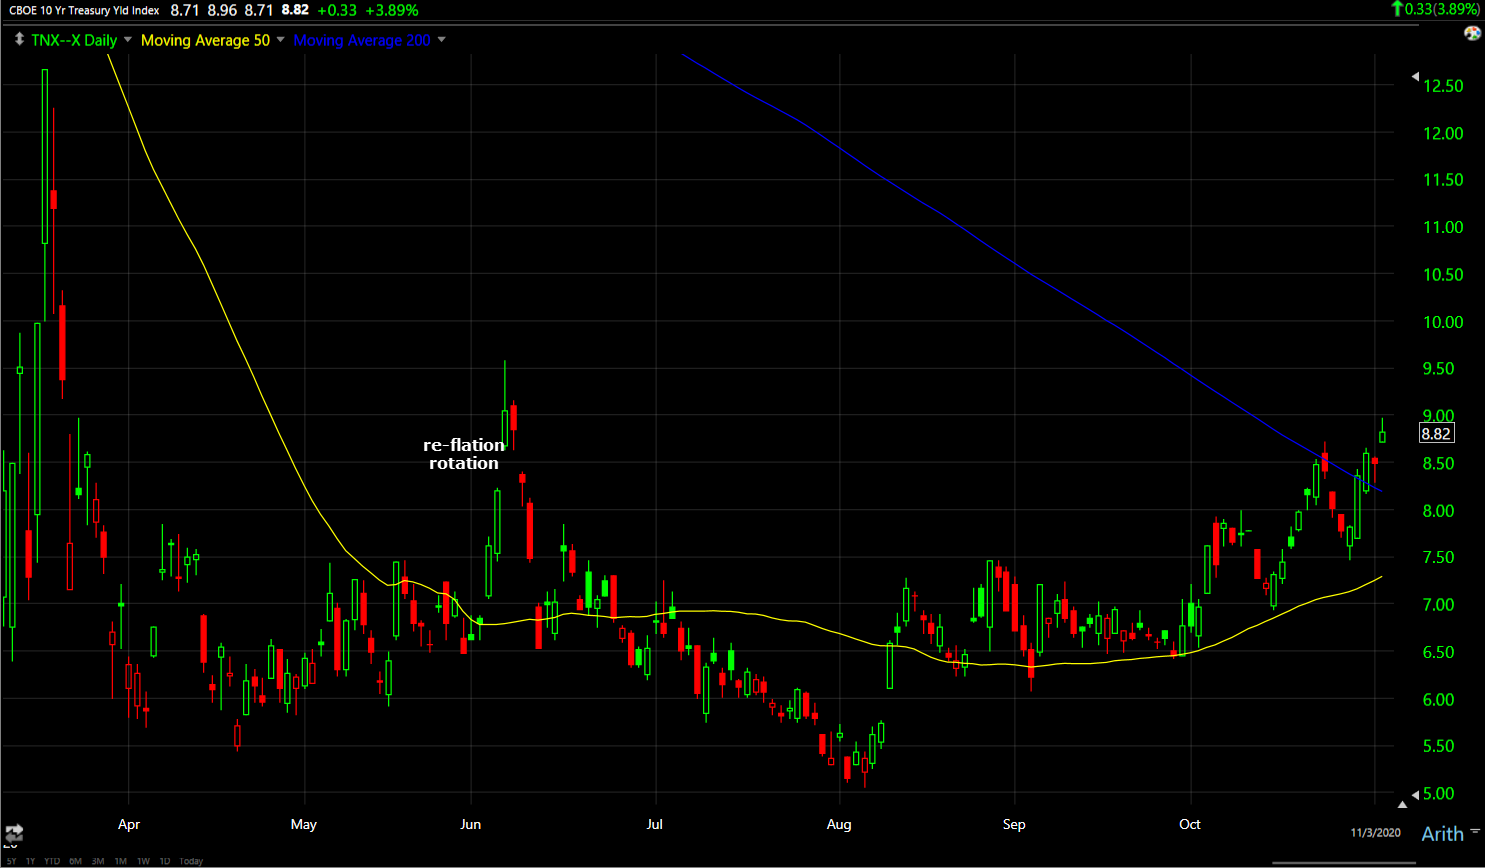 10-year yield (daily) the June spike in yields was part of a cyclical/value rotation and quick frankly, the strongest I’ve seen the market all year, but it failed rather quickly in early June, if memory serves, I believe after a Payrolls report. The October Payrolls report is Friday before the open.
Yields at the long end did give some back and the ultra t-bond treasury futures were acting a bit stronger this afternoon. I wouldn’t call it a flight to safety, especially not because of the 2 basis points the 30-year yield gave back from session highs, but 3C did look stronger, it just wasn’t confirmed in other areas like the 10 or 30-year T-futures.
Credit was fine on the day, in fact it looked a little better into the close. That may be because yields came down a little in the afternoon. However, overall credit suggests that the pros that trade it are more cautious on the week ahead of the election.
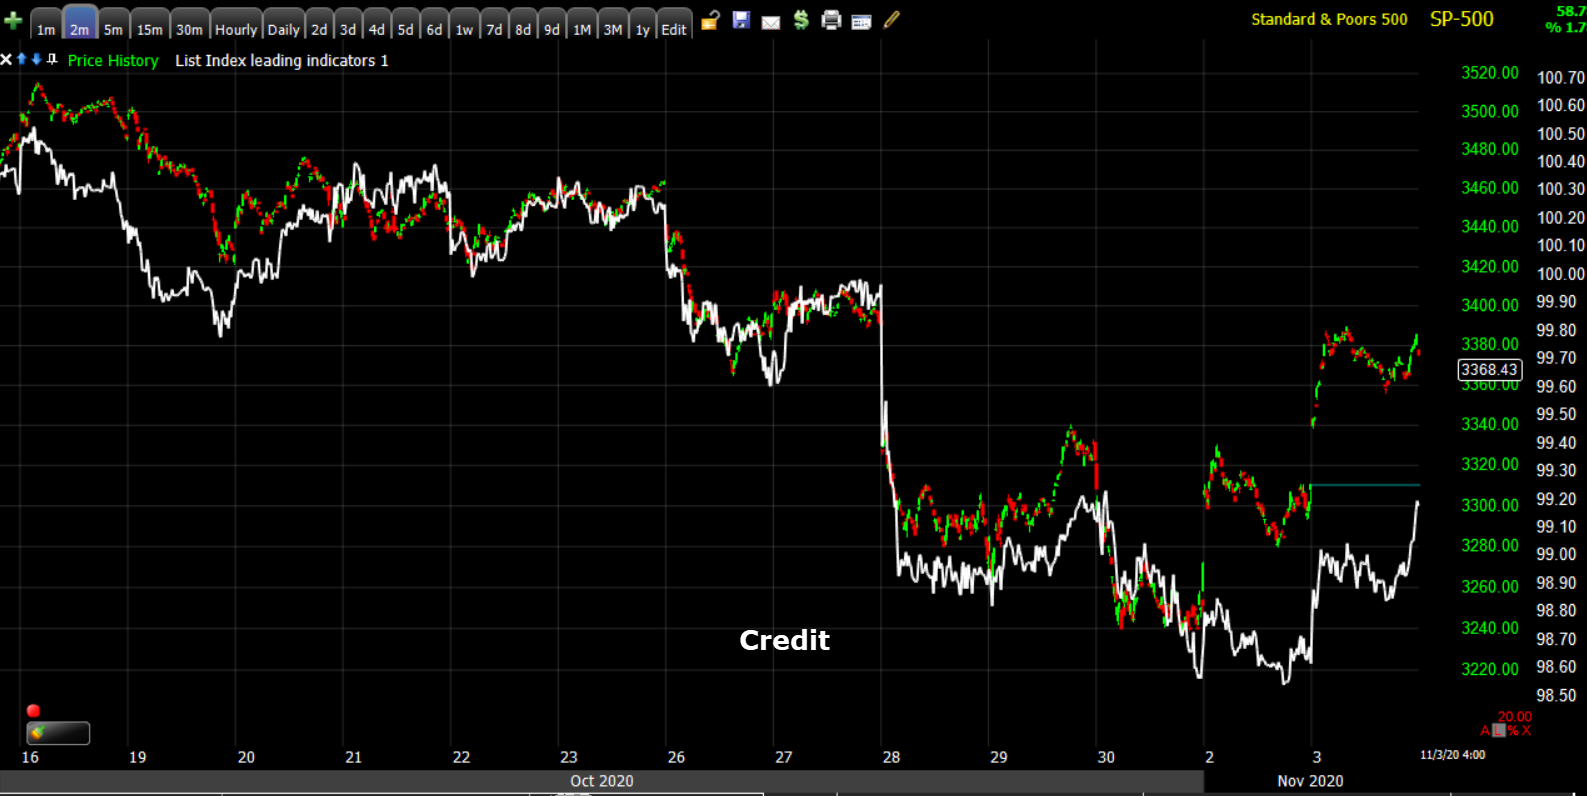 SP-500 (2m) and Credit- if you look carefully you can see where credit diverged and even led the S&P lower. It’s not leading lower (or higher) for this time scale, but it does reflect a relative negative divergence vs. the S&P.
Currencies and Commodities
The U.S. Dollar Index fell -0.7% to 93.51 and this was easily the most supportive aspect for stocks today. Even the Dollar traded in highly technical fashion.
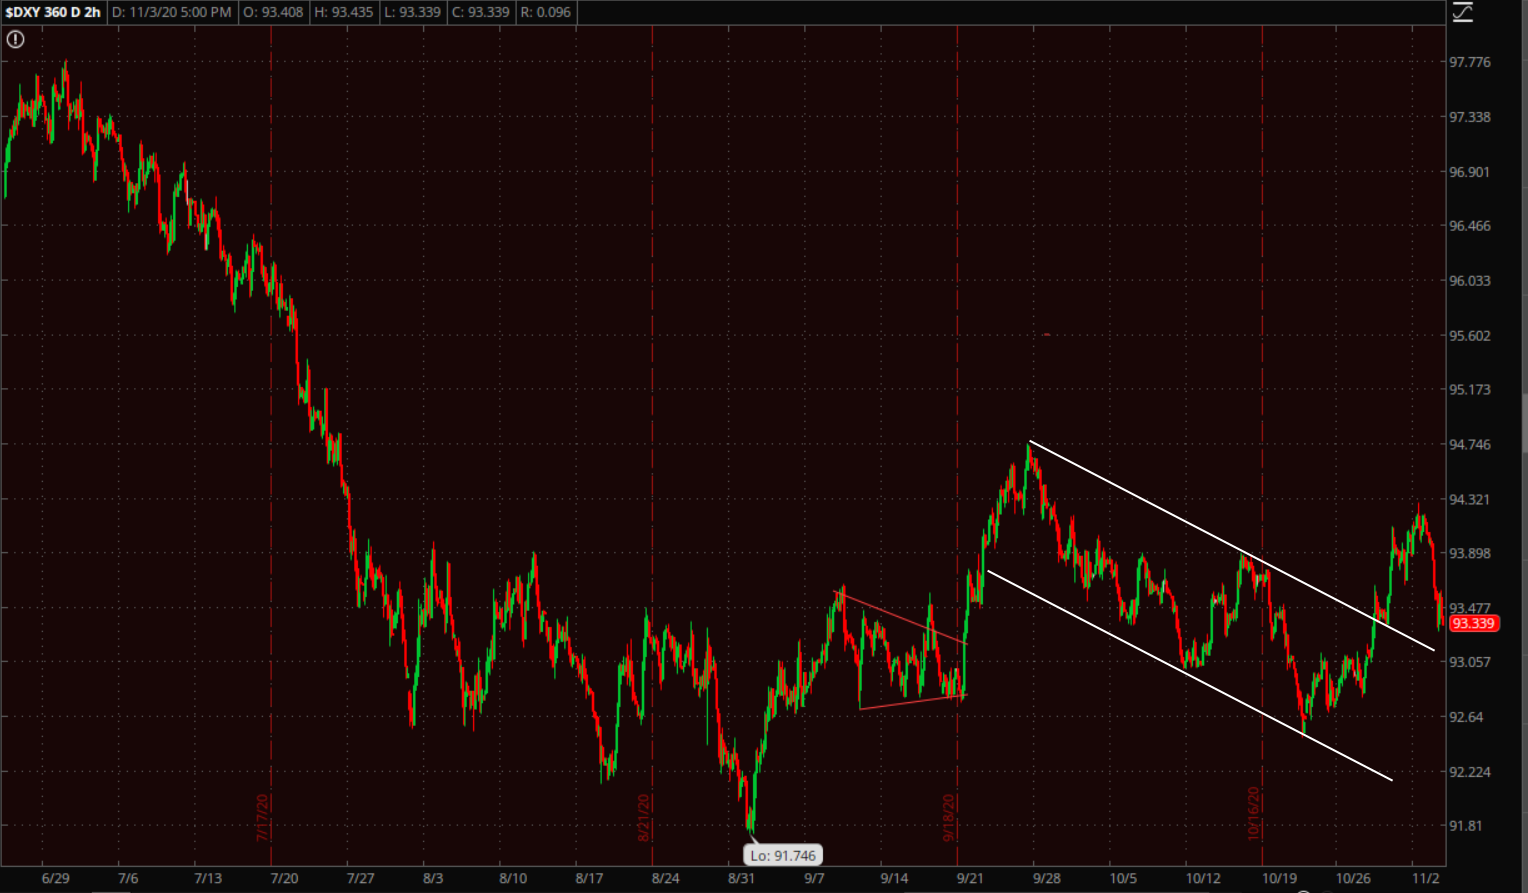 U.S. Dollar Index (2 hour) pulling back toward the breakout of the handle of a cup and handle, and…
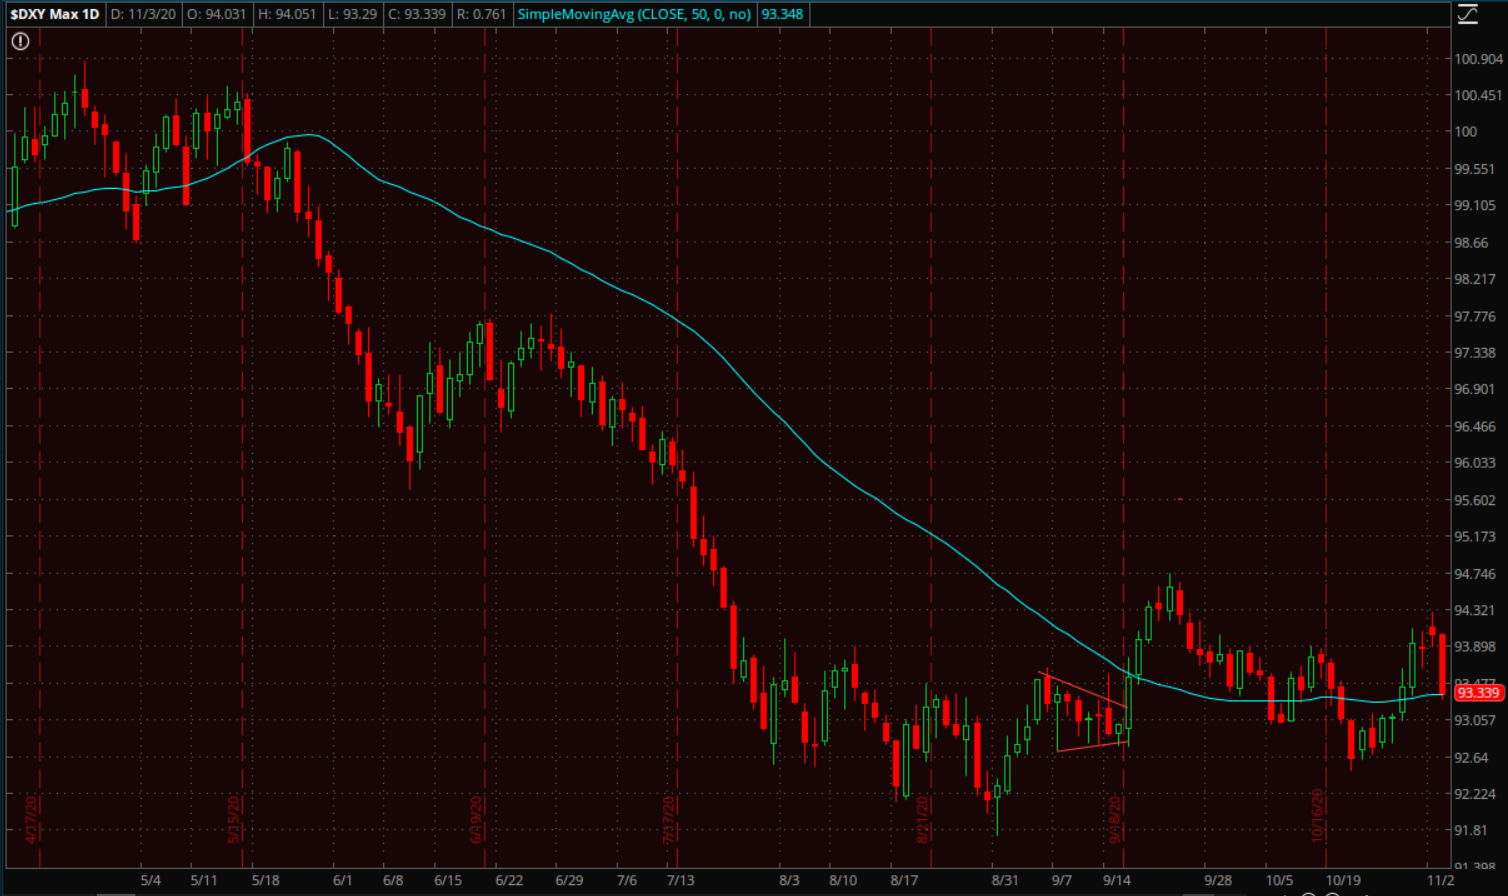 U.S. Dollar Index (daily) to its 50-day moving average. Coincidental with the S&P trading up toward its 50-day? Nope.
USD/JPY wasn’t risk-off, but had a less supportive tone than I would have expected just looking at the averages’ gains.
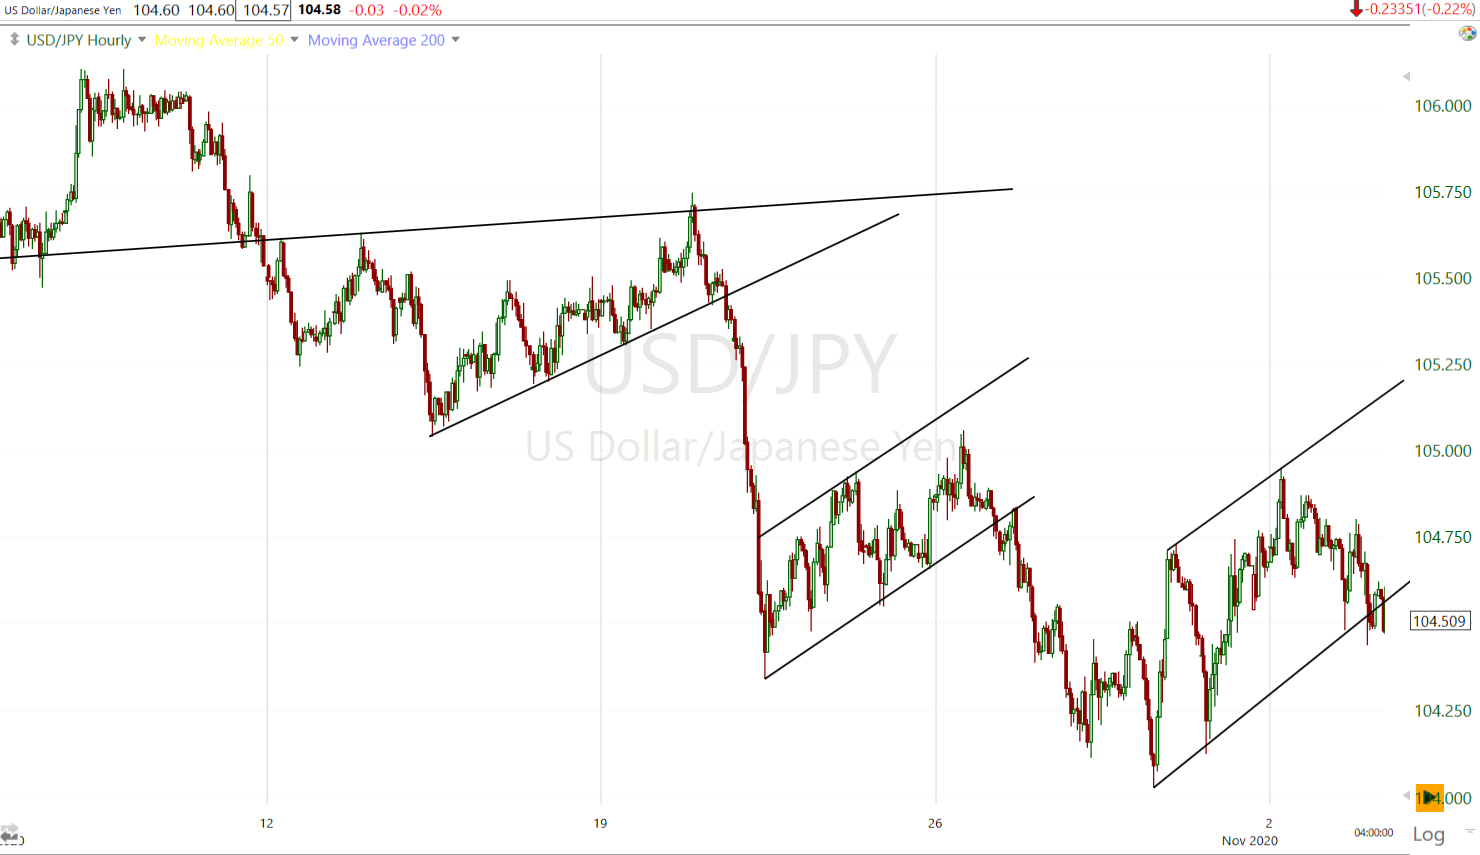
USD/JPY (60m) trading at the bottom of yet another bear flag most of the cash session.That means that the Dollar-Yen that led stocks off last week’s lows, is now negatively diverging vs. the S&P-500 this week. I posted a chart for perspective this afternoon.
WTI Crude oil gained another +2.3% to $37.62.
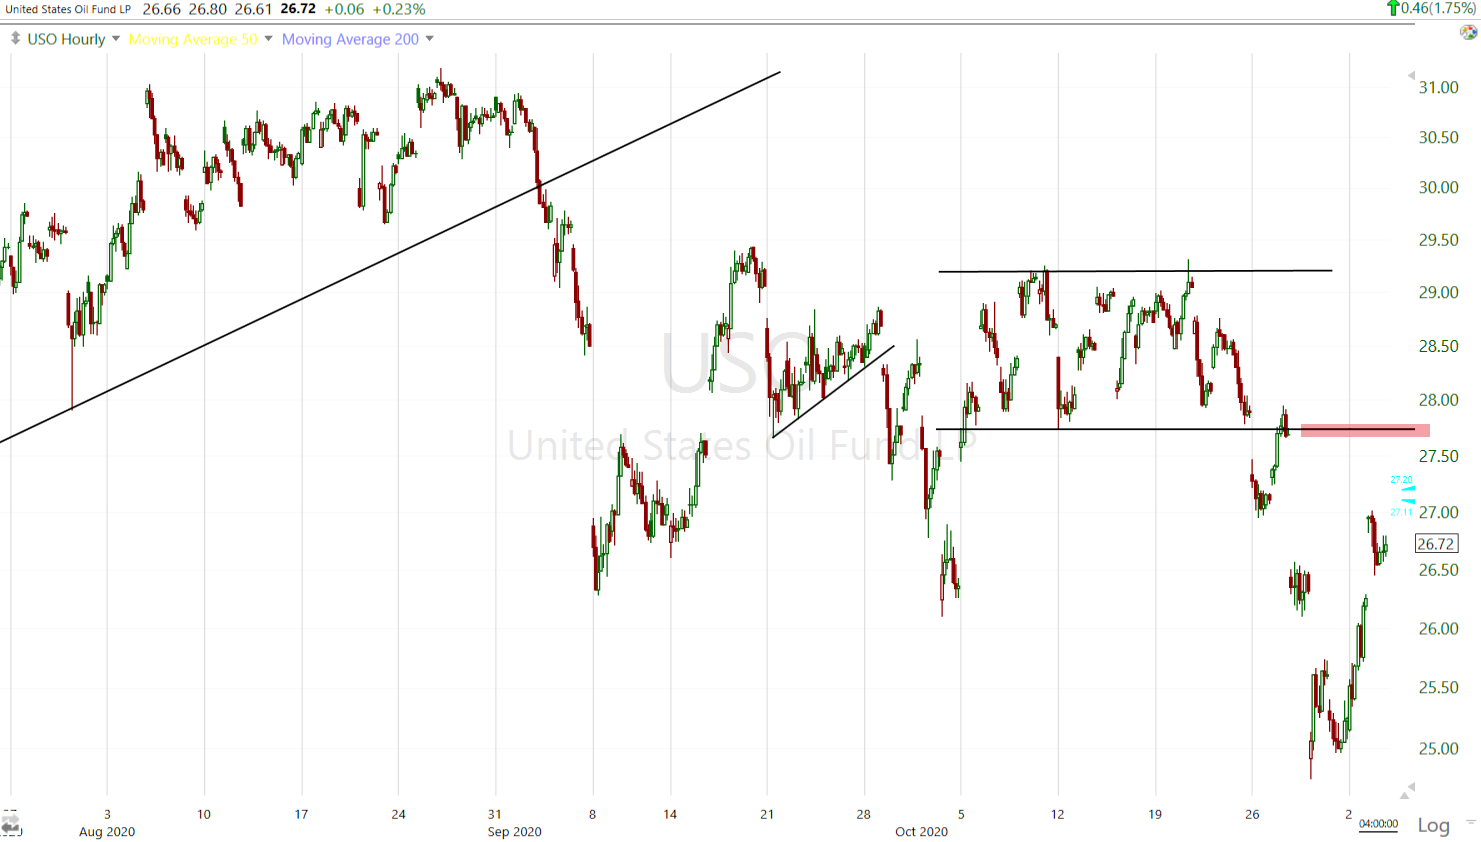 USO (60m) filling gaps from last week’s near 10% decline, but is yet to challenge key resistance at the bottom of the 3 week lateral range around USO’s $27.75 area.
Gold futures gained +1.0%, trading above $1900 to $1,910.40/oz. I’ve seen all kinds of official reasons gold gained, like “the perceived uncertainty about the timing of an official winner being declared in the U.S. presidential election.”. Lets be frank, the Dollar was down sharply and gold gained. It’s as simple as that.
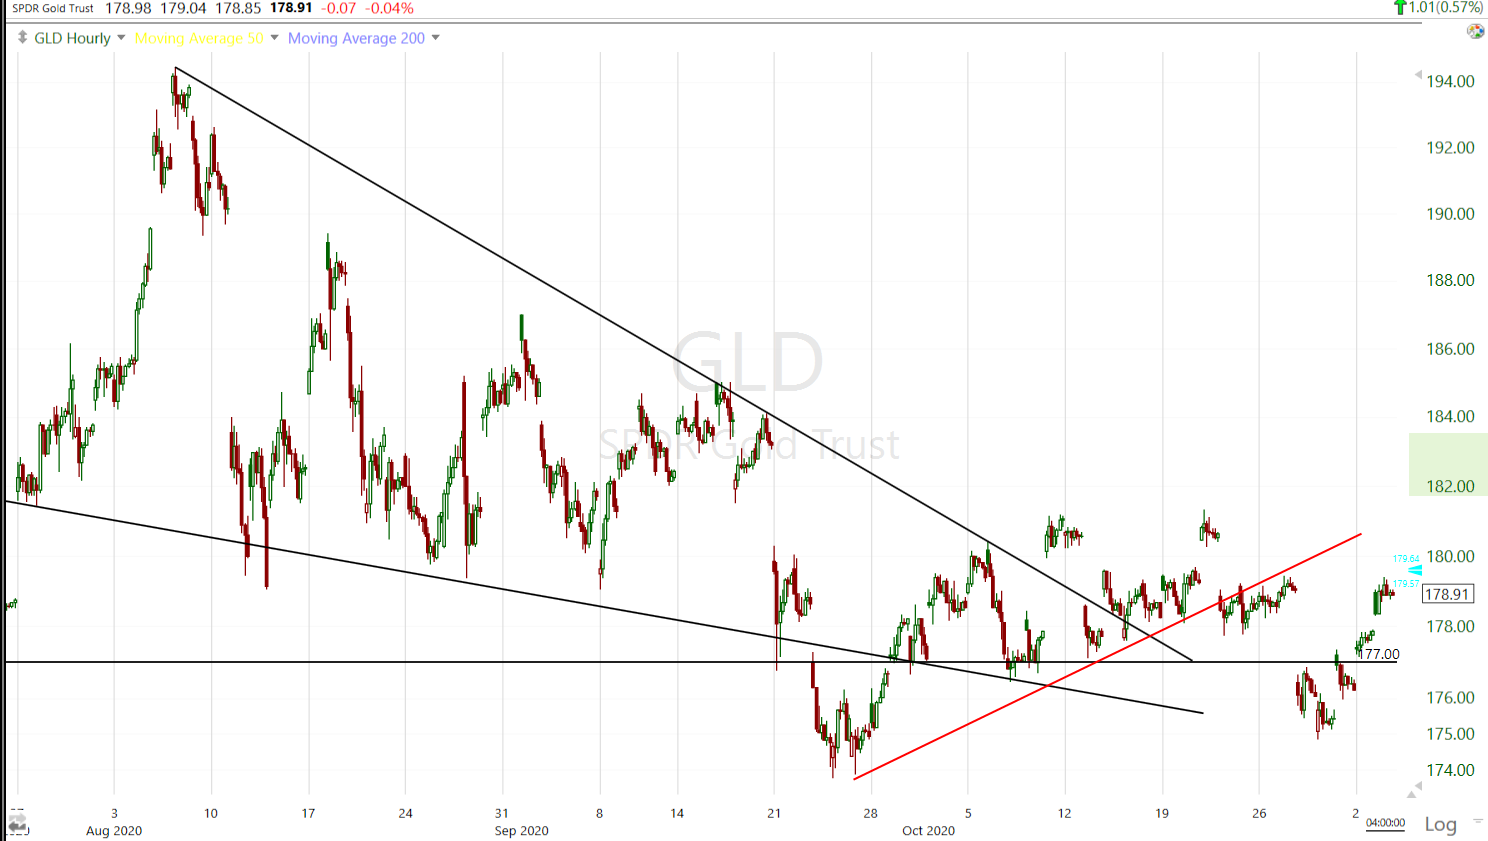 GLD (60m) I still don’t think it has made substantial technical strides toward improvement, but GLD trading above $177 is a small victory. I think GLD needs to trade above $183-$184 before we can say it’s out of the woods. I’m glad I was patient with this one because I do like gold and I did/do want to buy. I’m not so concerned with the 8% or so decline, but I don’t want to sit on dead money with open risk for 3 months.
Silver still looks worse, and as if it’s just waiting to see if the Dollar spikes higher.
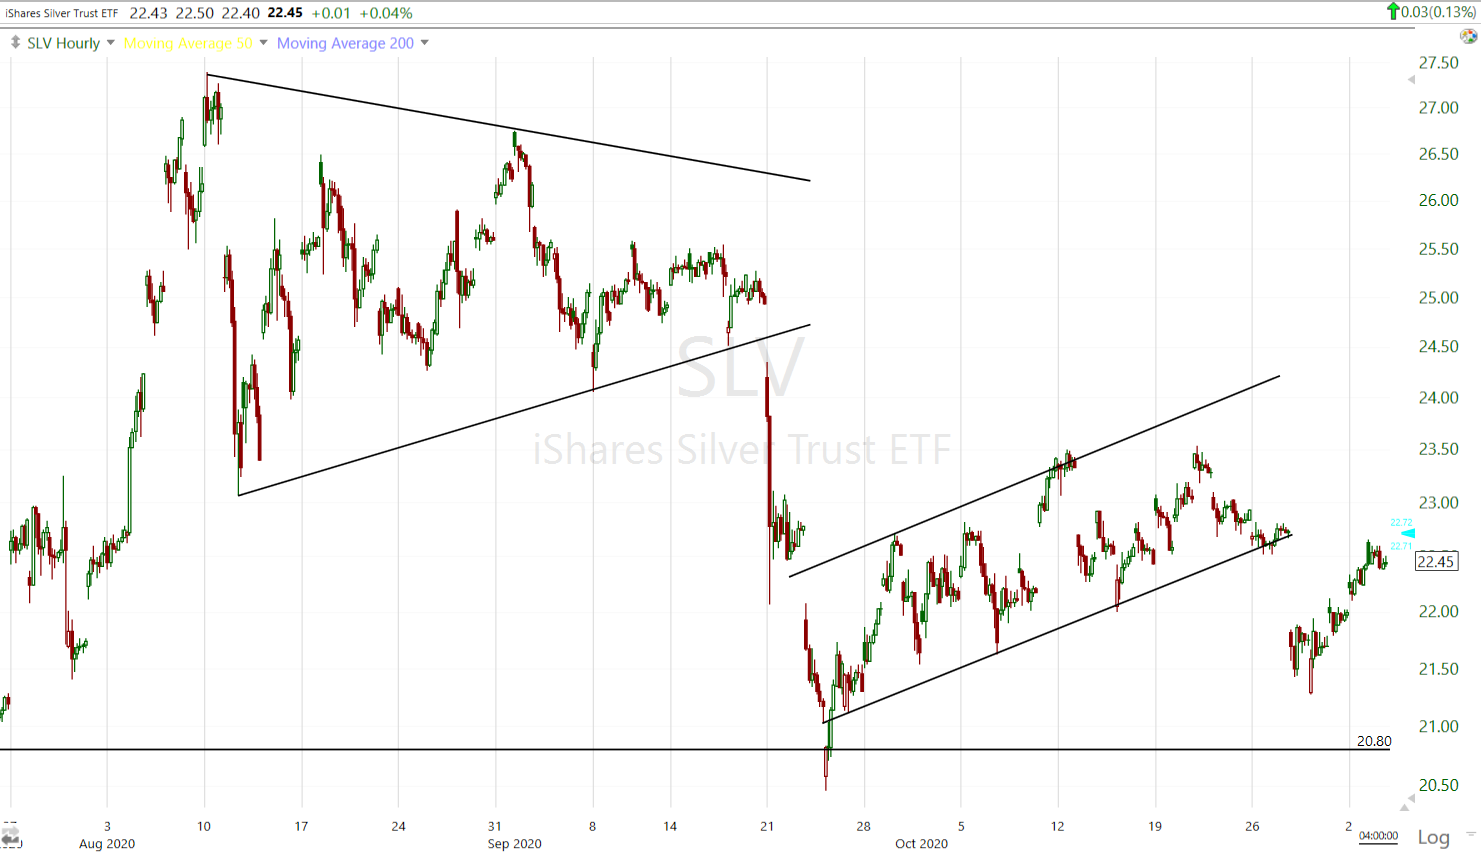 SLV (60m)- the most constructive thing I can say about this chart is that SLV didn’t make a sharp impulsive second leg lower when prices traded below the bear flag. That’s a small victory, but it’s not a bullish edge.
I updated GBTC earlier today, highlighting another tighter potential stop for those that entered last week for a short term trade (this does not apply for me as I’m in GBTC as a position trade).
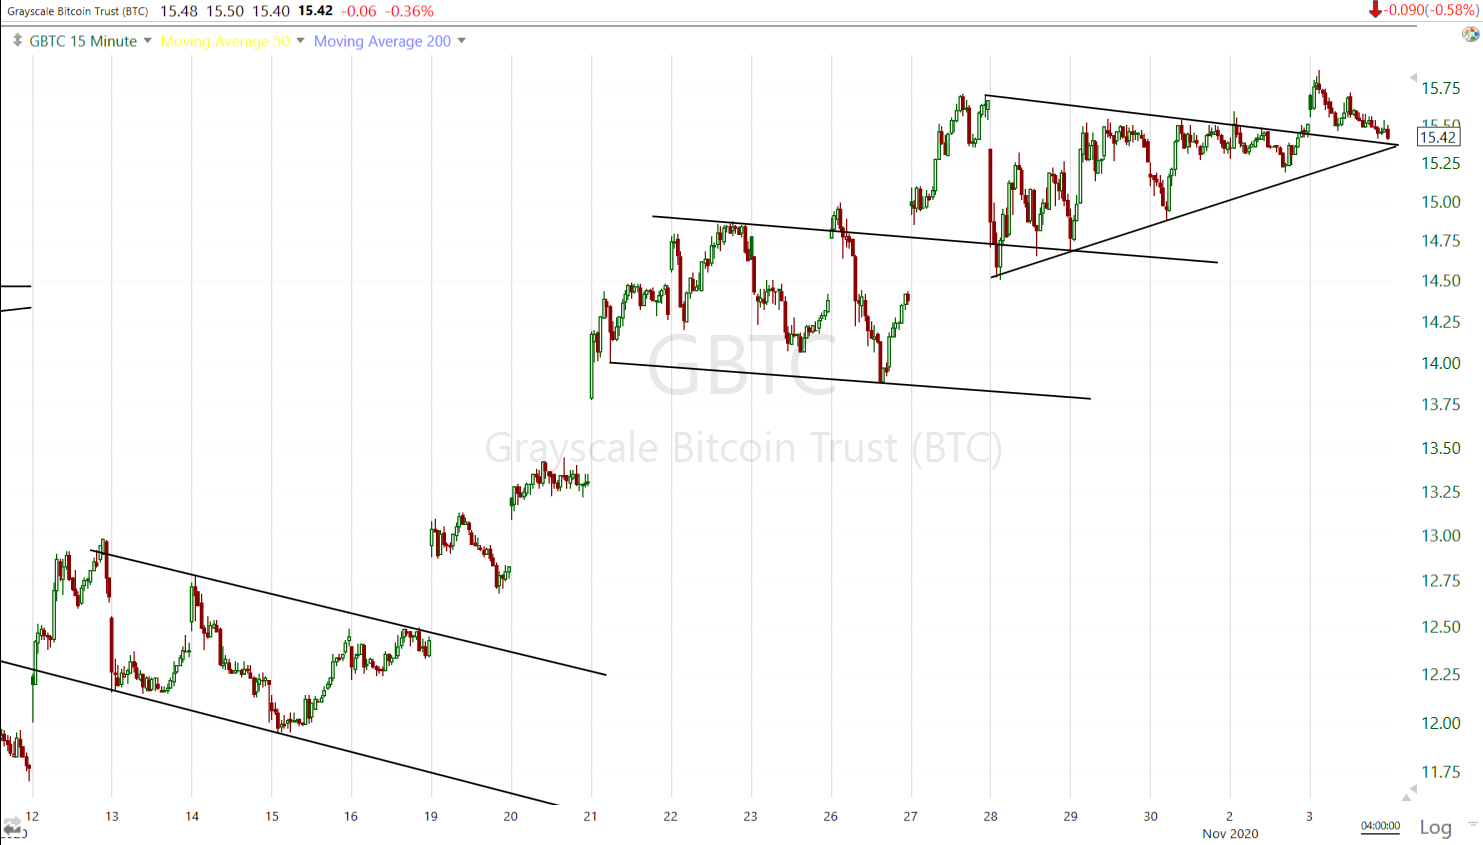 GBTC (15m) hasn’t done anything wrong here as price lingers above the last bull flag. I originally saw the triangle consolidation as an ascending triangle which would mean a flat upper resistance trend line around $15.71. I may redraw that trend line tomorrow. Any breakout above say $15,75 should be impulsive.
Bitcoin doesn’t look bad either.
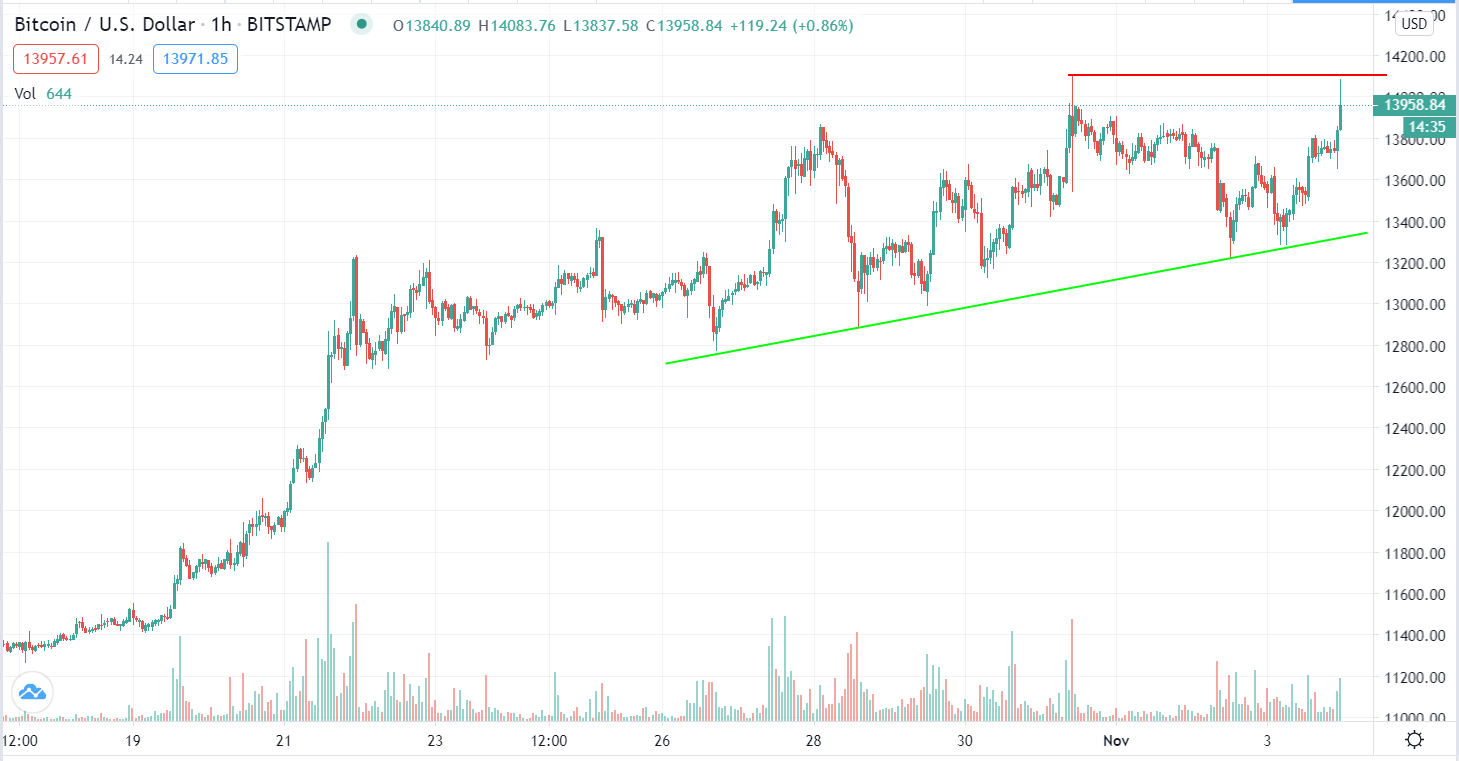 BTC/USD (60m) this is the flat topped ascending triangle I mentioned above with next resistance at $14,100 which it is probing today.
Summary
Today was a decent day for the market, it had that reflationary cyclical feel that we’ve seen so often, yet not once has it stuck. If I didn’t know today was the election I’d say the market was trading fairly normally and unsurprisingly after last week’s drubbing down to technical support.
It’s pretty amazing how similar the market is acting to 2016, but I’m not reading much into that moving forward. Speculation is mounting that Americans will get a clear election decision and that Congress will deliver a spending bill. I don’t have an opinion other than to say that the polls and the market were dead wrong in 2016. Markets hate uncertainty so a contested result – which seems plausible, just think back to Bush v. Gore and “hanging chads”circa 2000 eventually going to the Supreme court to be decided – would almost certainly be a bad outcome for stocks. I’ll base my analysis on price and market signals and not guesses as to who wins and how the market ultimately interprets that. Again, in 2016 the narrative was a Trump win would be bad for the market, and it was dead wrong.
I did mention UNG (Natural gas) earlier today and a potentially very interesting trade.
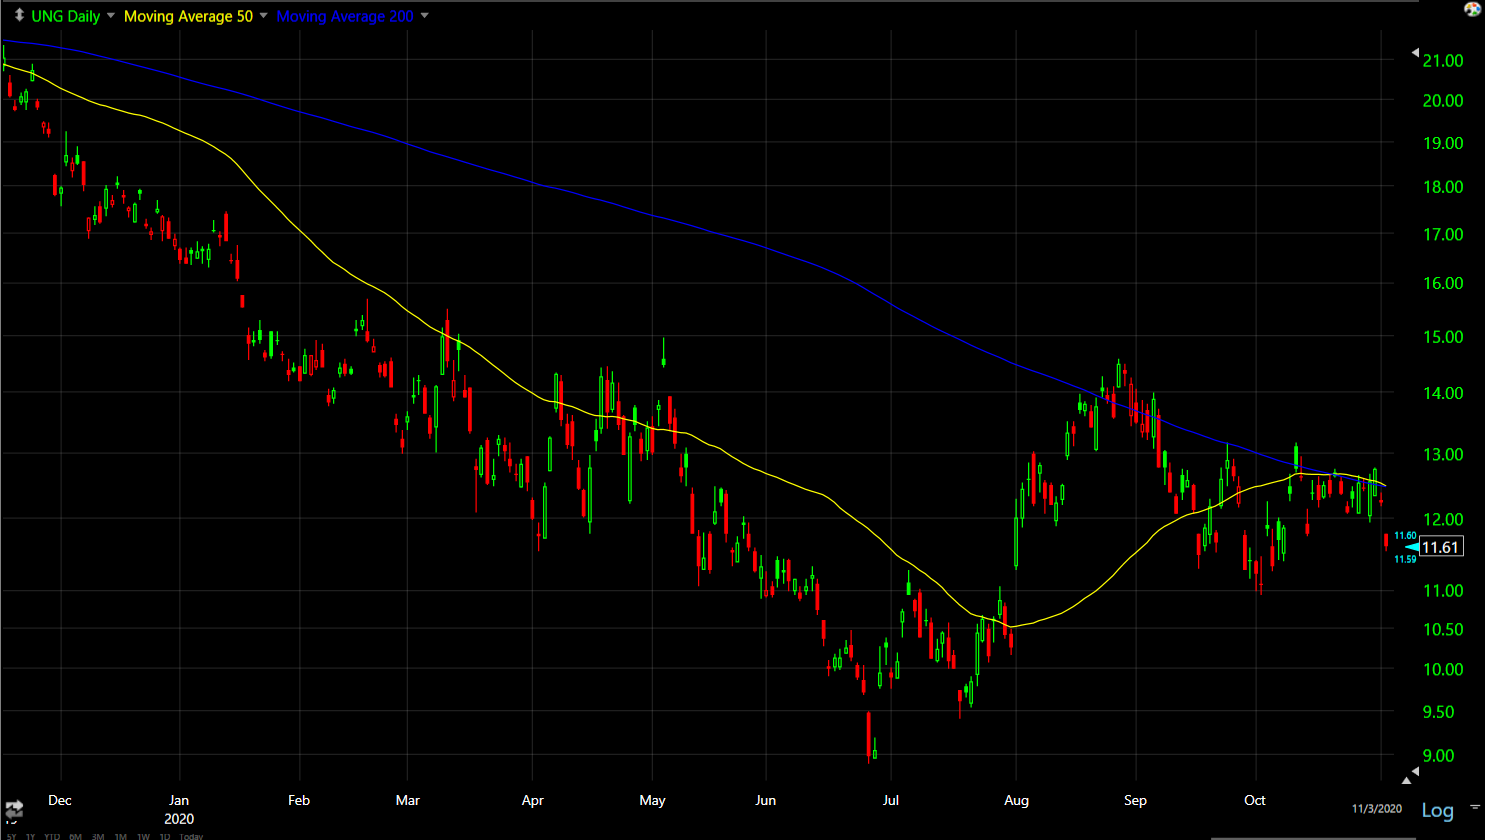 UNG (daily) w/ 50 and 200-day sma. The declining 200-day tells us that this is a primary down trend, but the recent turn up of the 50-day shows a pretty decent advance. Notice prices found resistance at the 50 and 200-day.
Let’s take a look from a price-only perspective…
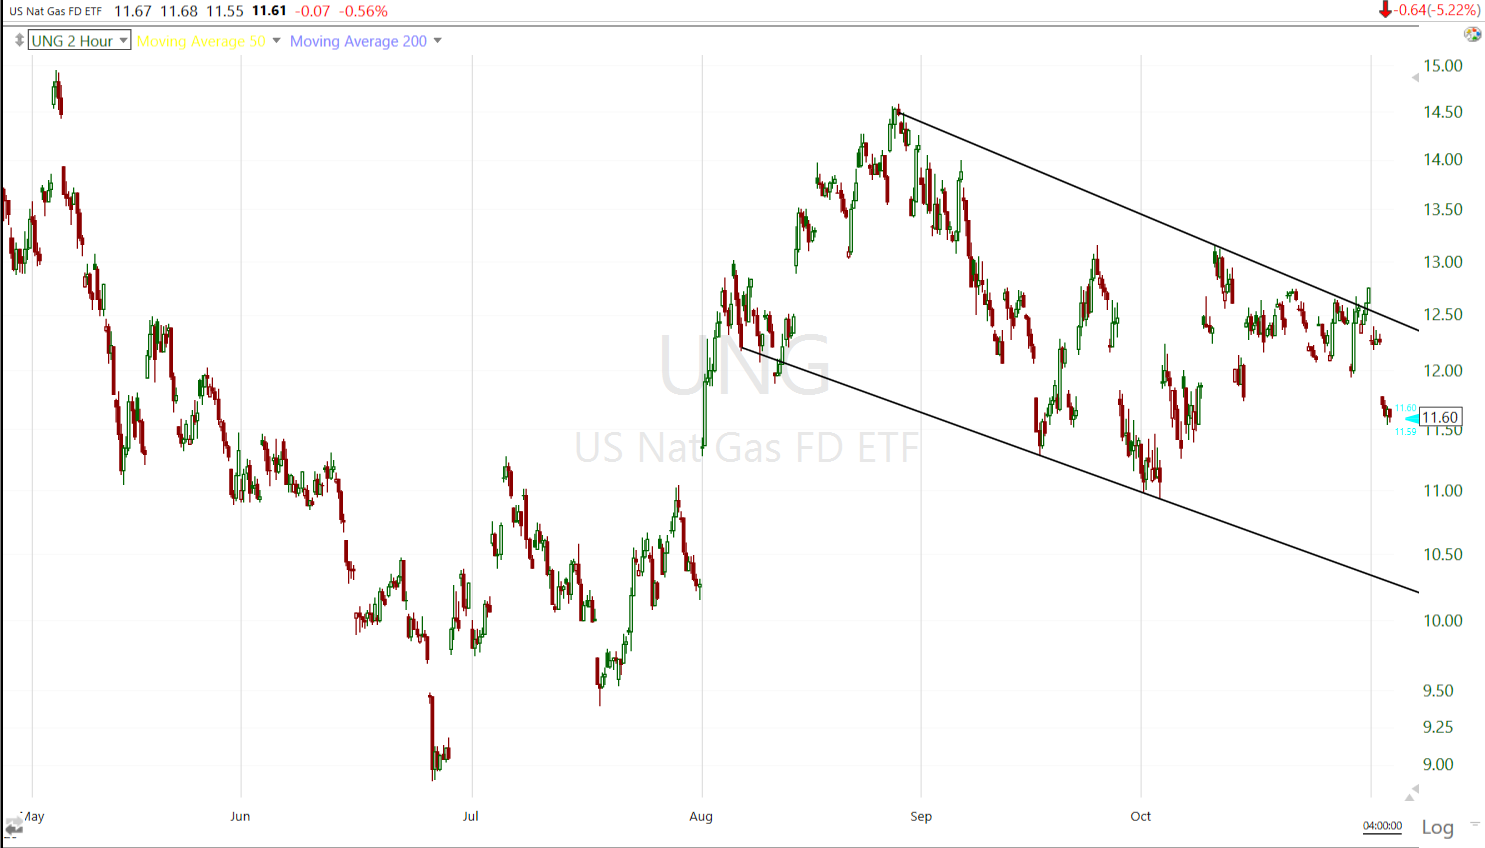 UNG (2 hour) looks like a big bull flag, which wouldn’t be surprising. If natural gas is going to make a substantial move higher and breakout above resistance at the 200-day, the more it consolidates (bullishly), the better. I look at bullish consolidations as price storing up energy like a battery or capacitor for an eventual release/ advance. If this is a bull flag as I suspect, then a test of the lower trend line would make for an excellent long entry. I extended the trend lines and estimated it could take 2-3 weeks to get there and that would be in the neighborhood of UNG $10.25, which also happens to fill the gap into early August.
A second leg measured move comes in around +50% on a breakout from the flag. Assuming the timeframe is roughly accurate, that would suggest a move up toward $18. However, if the purchase is near the flag’s support…
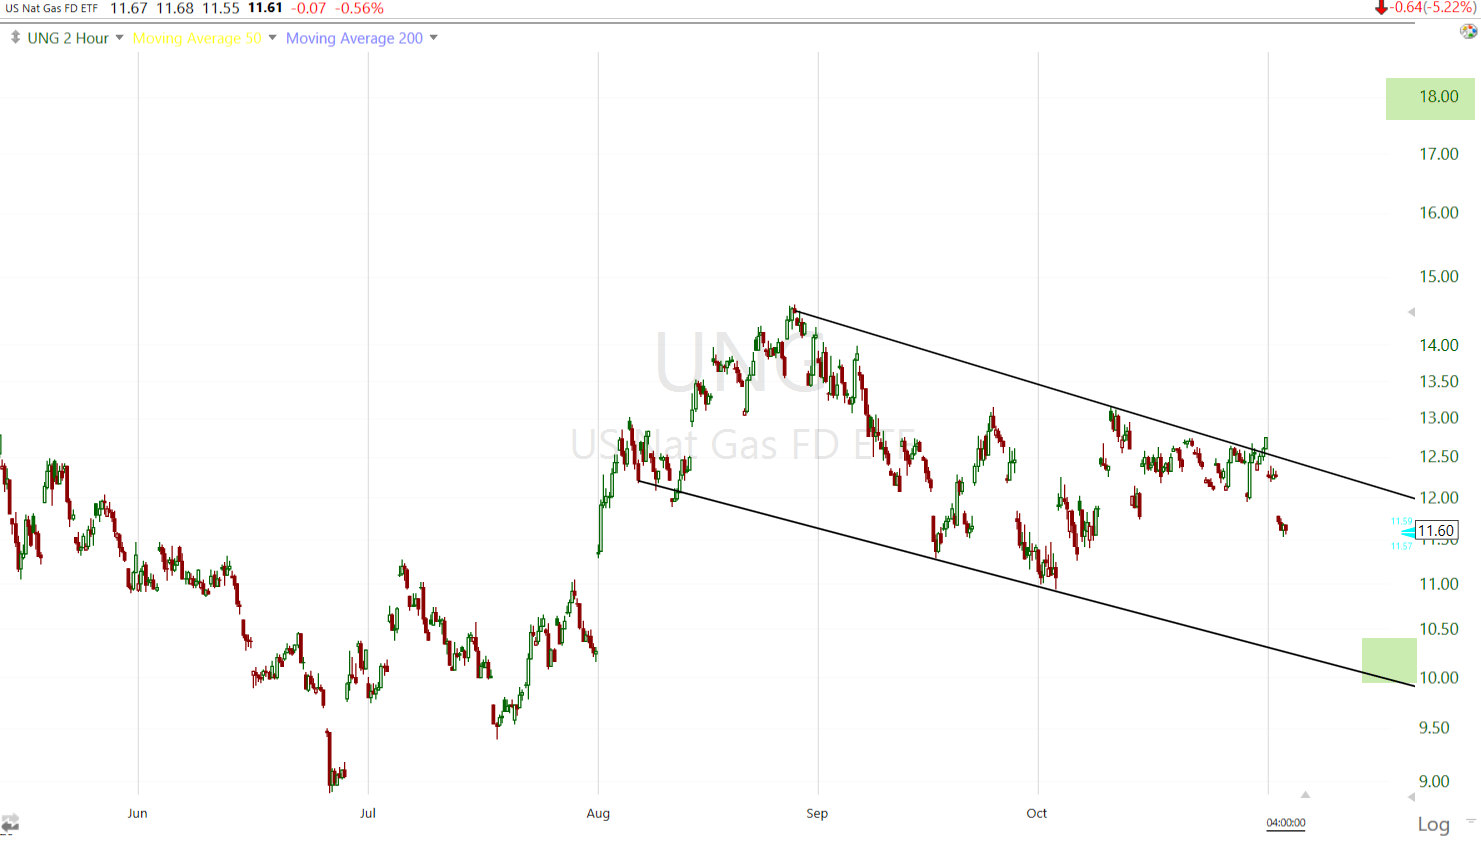 UNG (2 hour) say near $10.25, that’s a move of about 75%. Even with a stop around $9.50, that’s still a roughly 10-to-1 risk/reward profile, which is spectacular. Lets see how this develops.
Overnight
Price volatility is already getting a bit crazy with S&P futures having been up near 1% just an hour ago. They’ve since tumbled on reports that looks like Trump may win Florida. S&P futures tumbled and gave back the early overnight gains.
 ES (1m) 3C was in line with price most of the day. There was a little negative divergence at aftermarket highs.
S&P futures -0.4%. Russell 2000 futures show the divergence better.
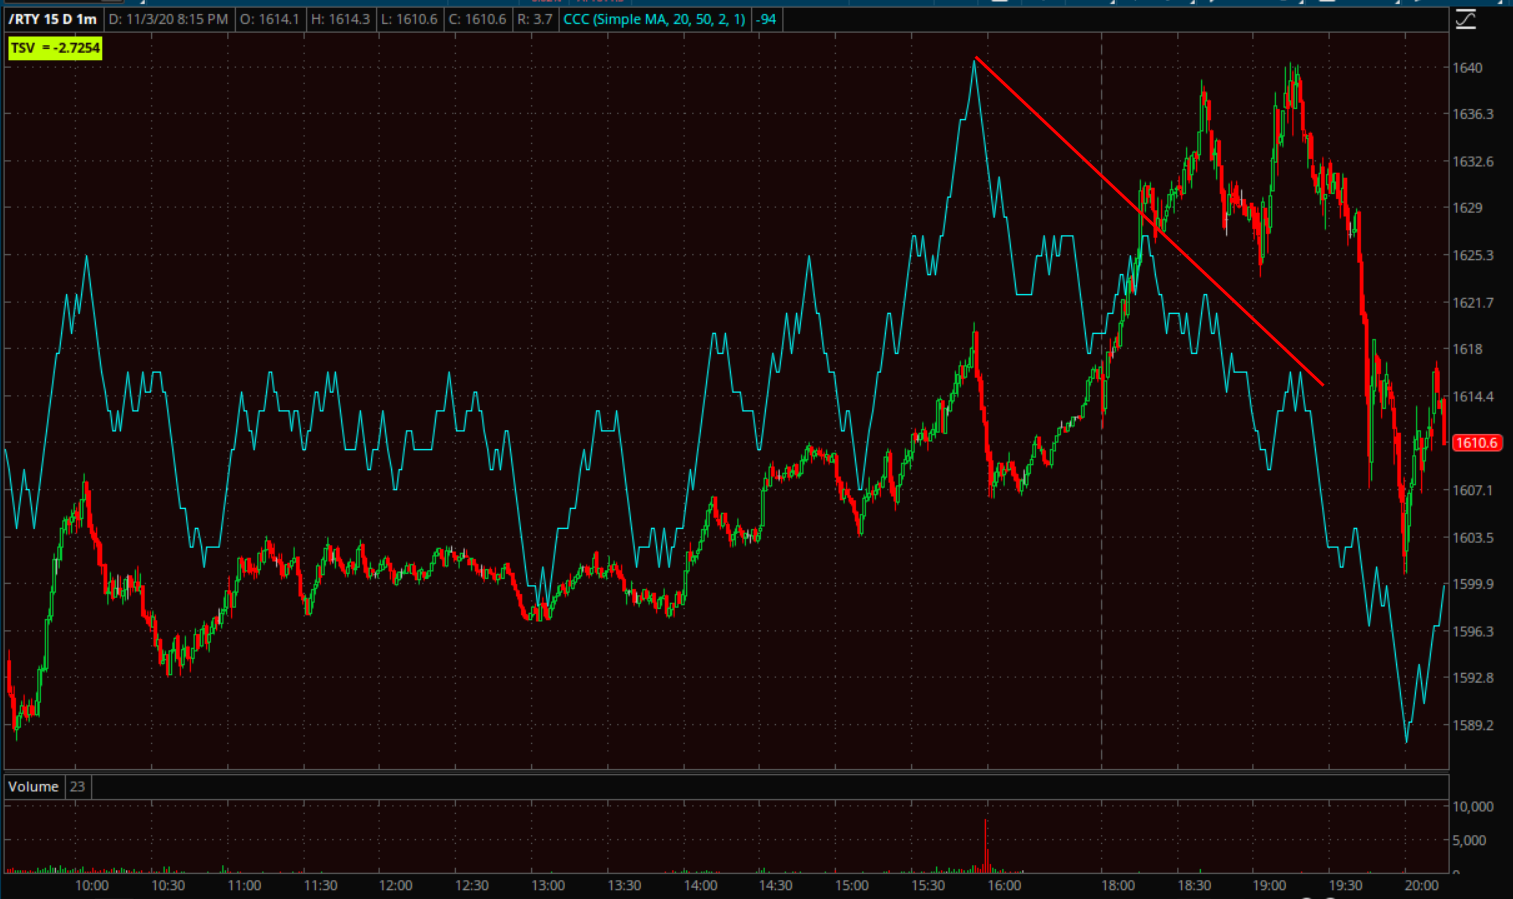 Russell 2000 futures (1m) 3C either in line or leading higher most of the day and negatively diverging into afterhours highs.
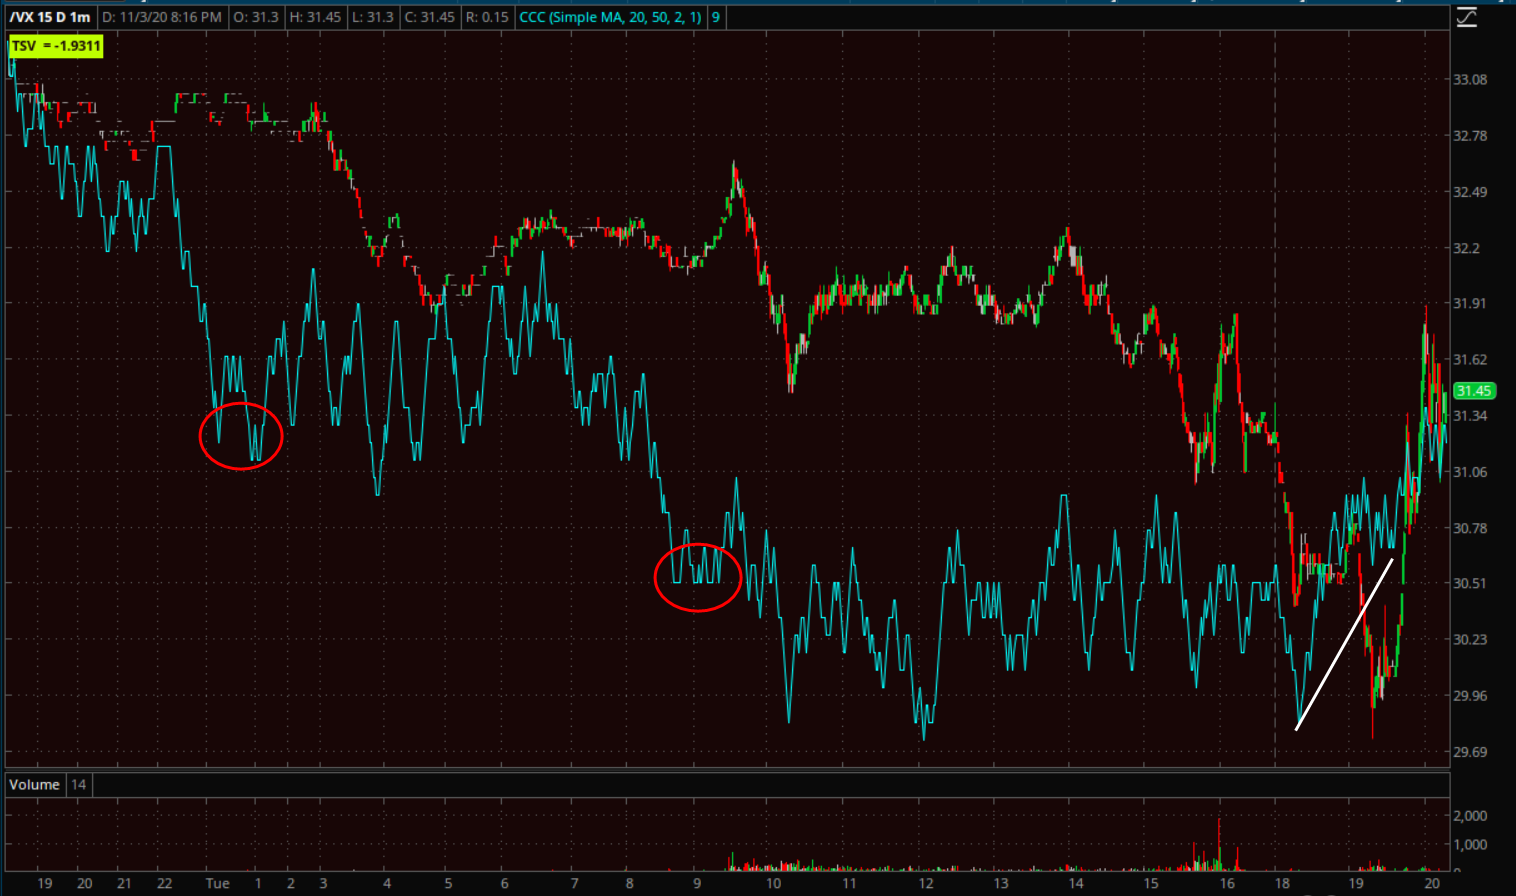 VIX futures (1m) look at the leading negative divergences (Red) last night as sellers piled on. It’s not a big divergence, but there’s a positive divergence at afterhours’ lows.
WTI Crude futures are up +1.25% after a bigger than expected Crude draw from tonight’s API oil inventories.
Treasury futures are following the Ultra T-Bond futures’ lead from this afternoon and trading higher off session lows. Again, they’re not reflecting a flight to safety, but it’s a more defensive look than earlier.
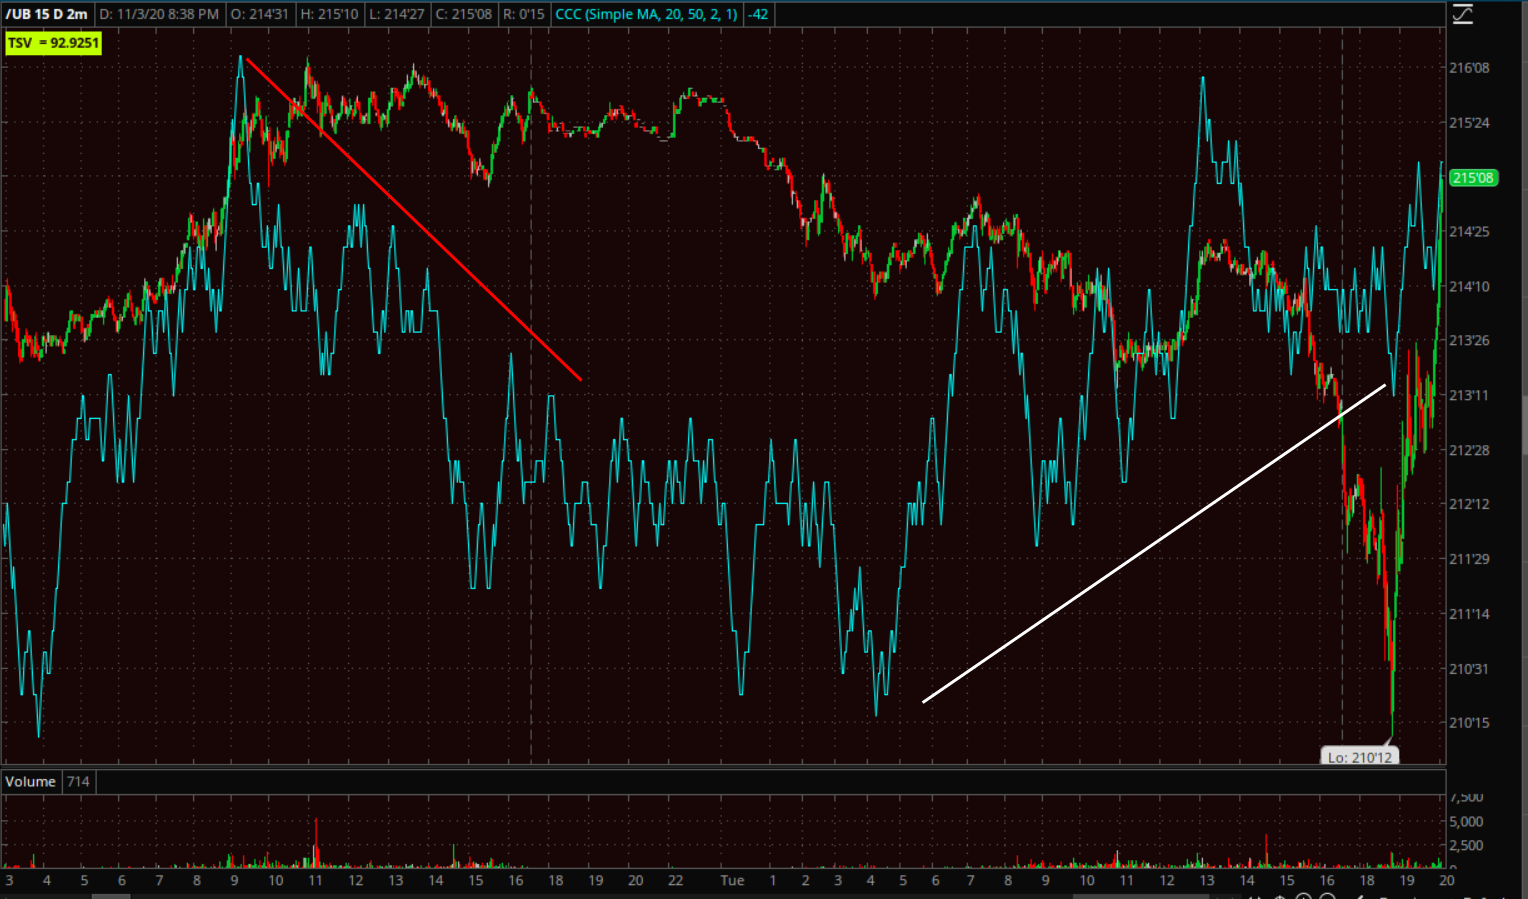 Ultra T-Bond futures (2m)
The Dollar-Yen is also getting volatile at the bottom of the flag.
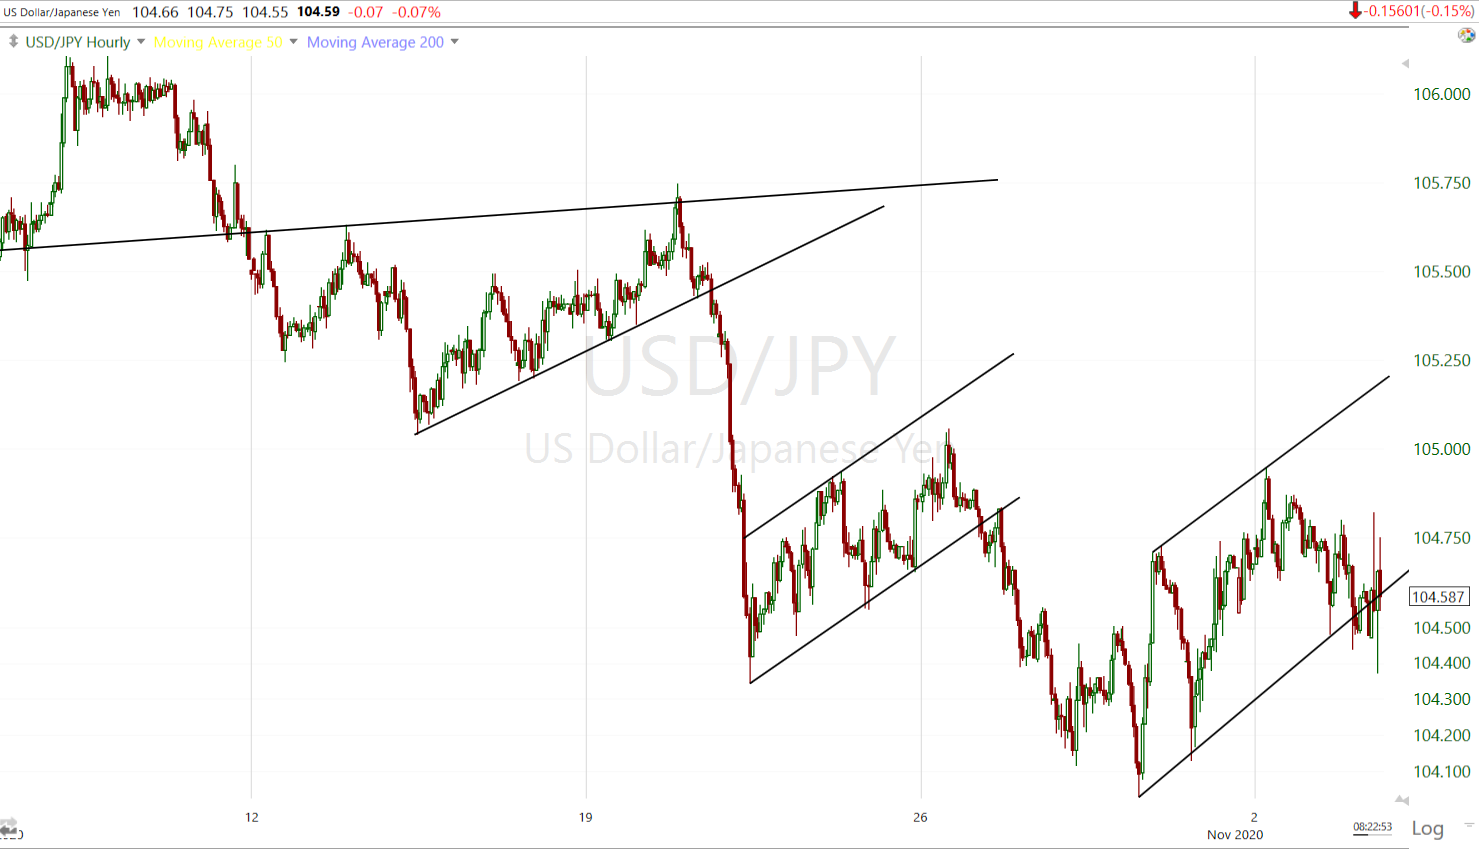 USD/JPY (60m)
And a closer look…
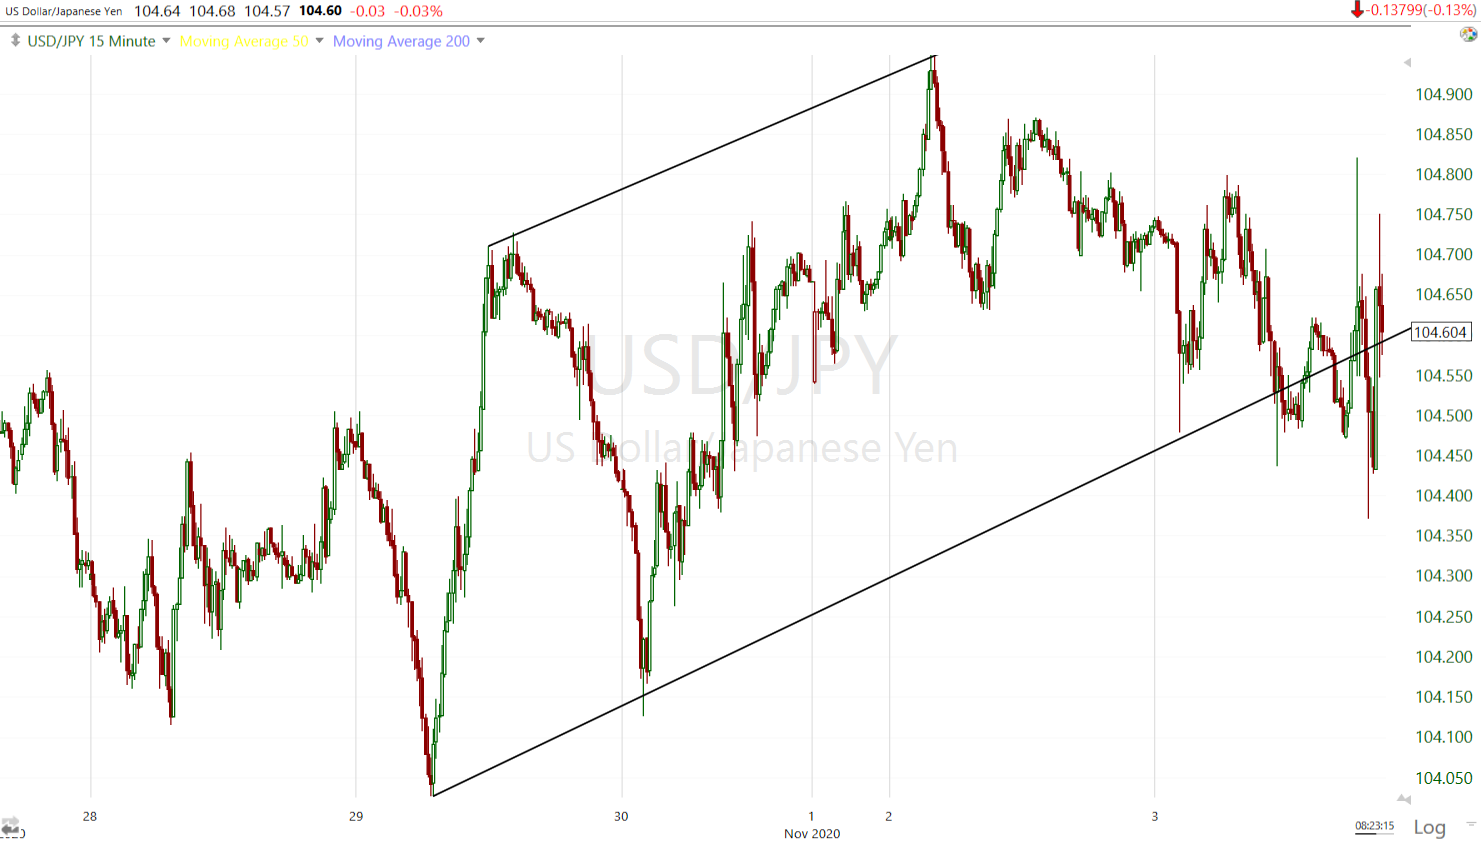 USD/JPY (15m)- note the $104.50 level I’ve been watching.
Beyond Wednesday morning election results, investors will receive the ISM Non-Manufacturing Index for October, the ADP Employment Change Report for October, the Trade Balance Report for September, the weekly MBA Mortgage Applications Index on Wednesday, the EIA Oil inventories report, and on any other week the main event would be the FOMC meeting and policy statement tomorrow at 2:00 p.m. ET with a presser at 2:30 p.m. ET.
Friday before the open we get the key and often market moving Payrolls report for October.
I’ll be watching the results tonight with my laptop. I will post updates if there’s anything really important or an edge taking shape. I’m not going to call out every little jiggle. In 2016 I called out the VIX crushing and ES accumulation in real time, I believe around 1 a.m. ET. Keep in mind S&P futures were limit down at the time and from price only, looking as if they were set to crash the next day. 3C was calling out substantial movement below the surface.