Stock Market Update- FOMC
Index futures did nothing overnight, but fell at the open after stagflationary economic data in pre-market.
Retail Sales missed big as the effect of stimulus checks on spending fades. Retail sales fell -1.6% on expectations of a -0.6% decline. The Producer Price Index (PPI) for May came in more inflationary than expected at +0.8% with consensus looking for 0.5%. The year-over-year increase in total PPI was 6.6%, this was the largest year-over-year increase in history.
This is on the heels of a hot inflationary Consumer Price Index (CPI) report last week. Industrial Production rose 0.8% m/m for May near consensus of 0.7%. Interestingly just like last week after the inflationary CPI report, the bond market had no reaction to the inflationary PPI today with the 10-year yield flat. However, 5-year breakevens rebounded higher today.
The disappointment in retail sales, combined with Empire Manufacturing’s miss, a worse than anticipated drop in homebuilder confidence, and a bigger than expected drop in business inventories sent the US macro surprise index fell to its lowest since May 2020.
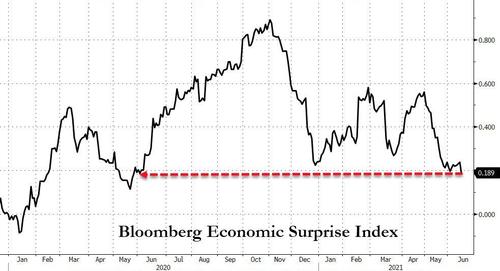 Source: Bloomberg
In other developments, the U.S. and EU agreed to suspend their tariff dispute regarding Boeing (BA +0.6%) and Airbus, and New York lifted its state-mandated COVID restrictions after the state reached its goal of 70% adult vaccinations.
There was no discernable sector bias early this morning which suggested to me that the inflationary data weighed on large-cap Tech and the stagnating data weighed on the pro-cyclical sectors. Small Caps were ugly early on as the most shorted stock squeeze in June not only lost momentum last week, but started leading lower this morning.
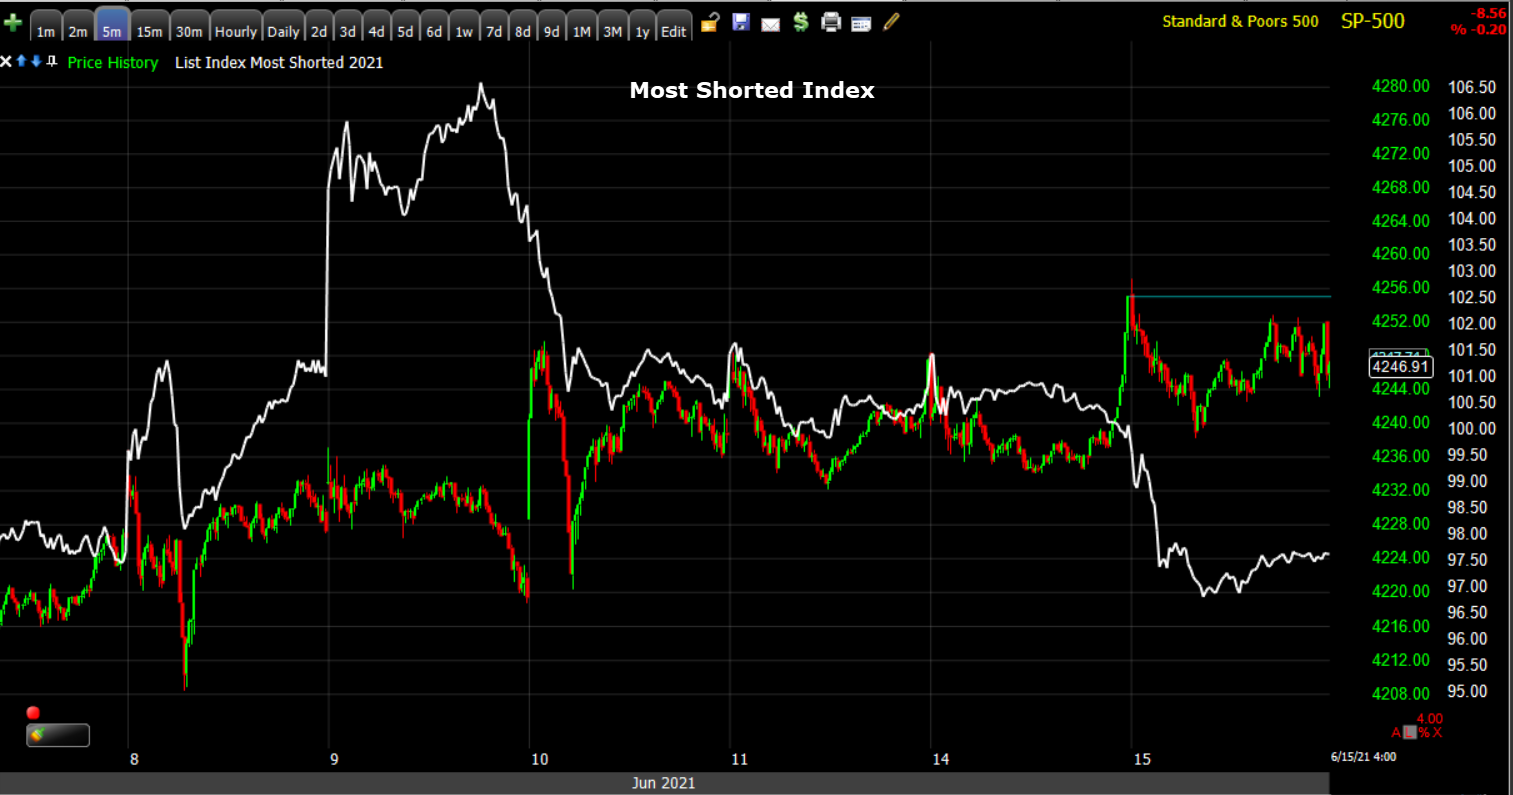 Benchmark S&P-500 (5m) and the Most Shorted Index. The short squeeze in June largely benefitted small caps, but it’s worth noting that the squeeze held in there just long enough for the S&P to make a new record high and then faded.
Small Caps did manage to hold local support and as the day wore on a cyclical bias favored Small Caps, although they too closed red for the day.
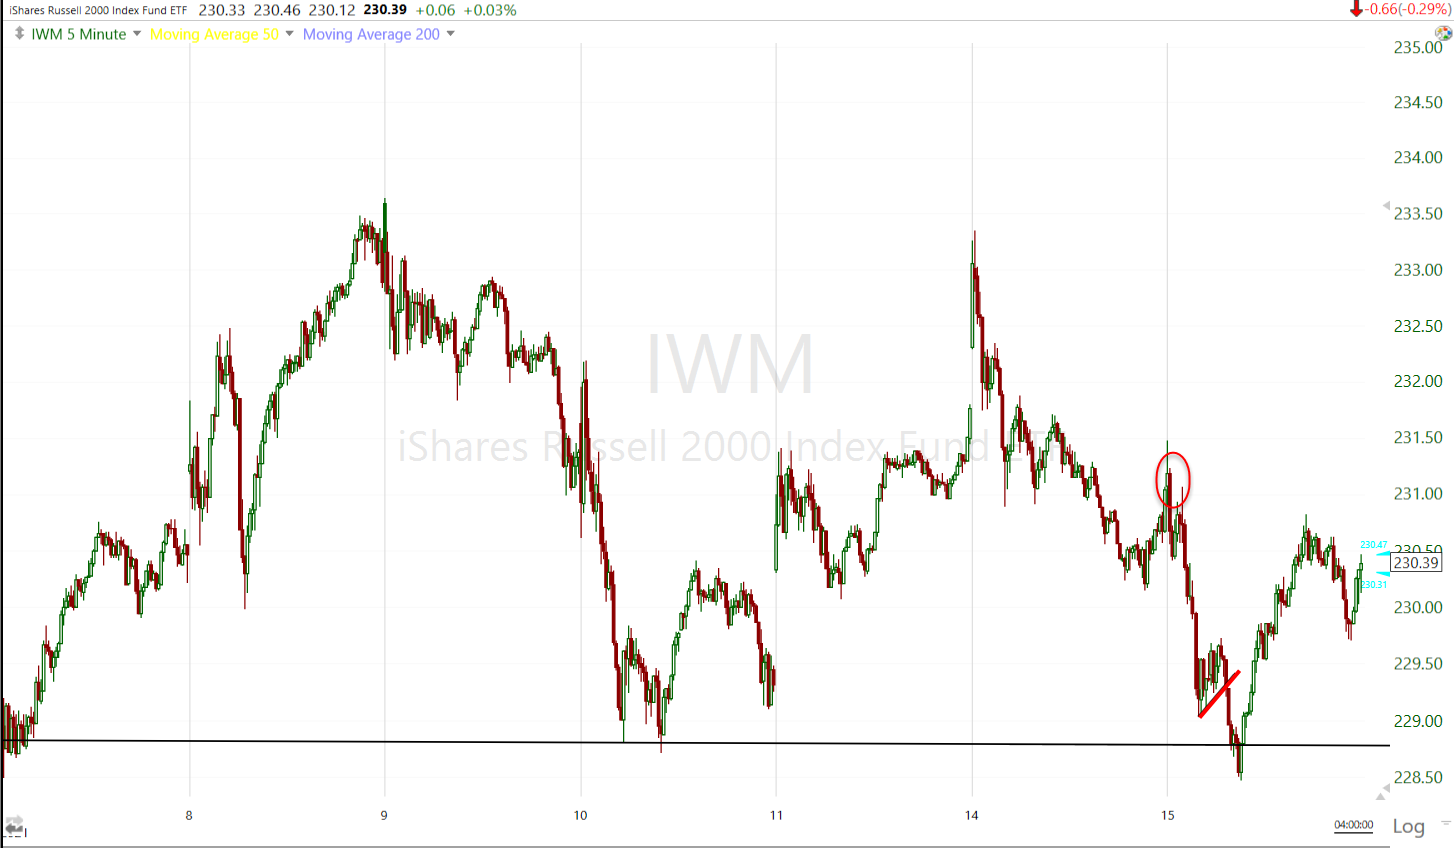 IWM (5m) with a small bearish flag this morning, but held local support and bounced after the European close.
As cyclical sectors took a leadership role, the mega-cap heavy sectors fell behind as did the NASDAQ-100. This is exactly the type of action I would have expected yesterday when yields rose, although today yields were largely flat.
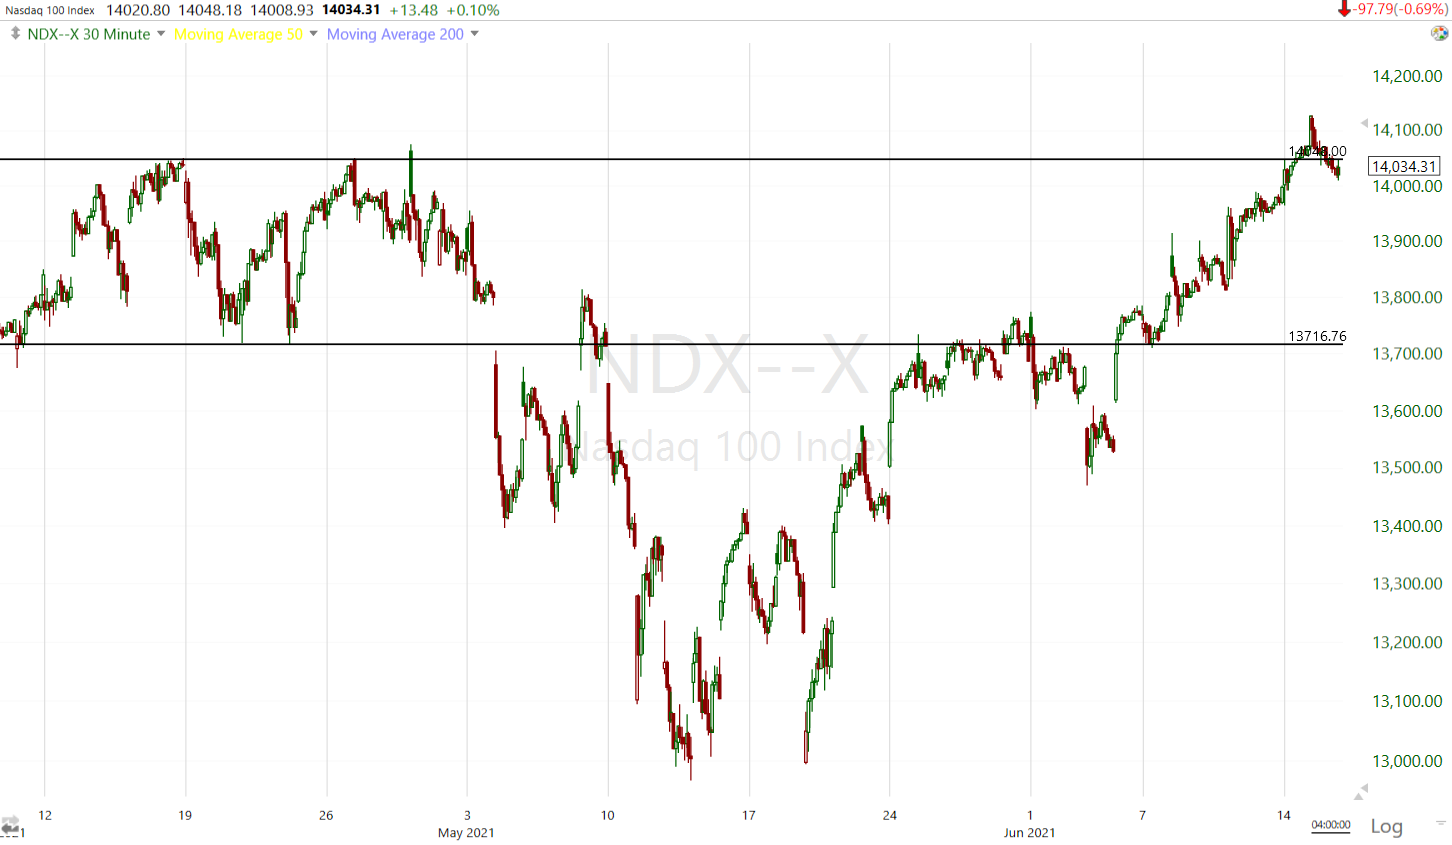 Last week when NASDAQ-100 was about 1% lower, I thought it would trade up to the top of the former range and then meet resistance. Today we saw NDX meet that resistance and close just under the range’s upper trend line.
Friday is quad-witching and with nearly $2 trillion in S&P-related options/gamma set to roll off, there’s little doubt that recent trade including yesterday’s obvious closing ramp, today’s flattish trade and 3C’s improvement last week, are all related to quad witching Friday.
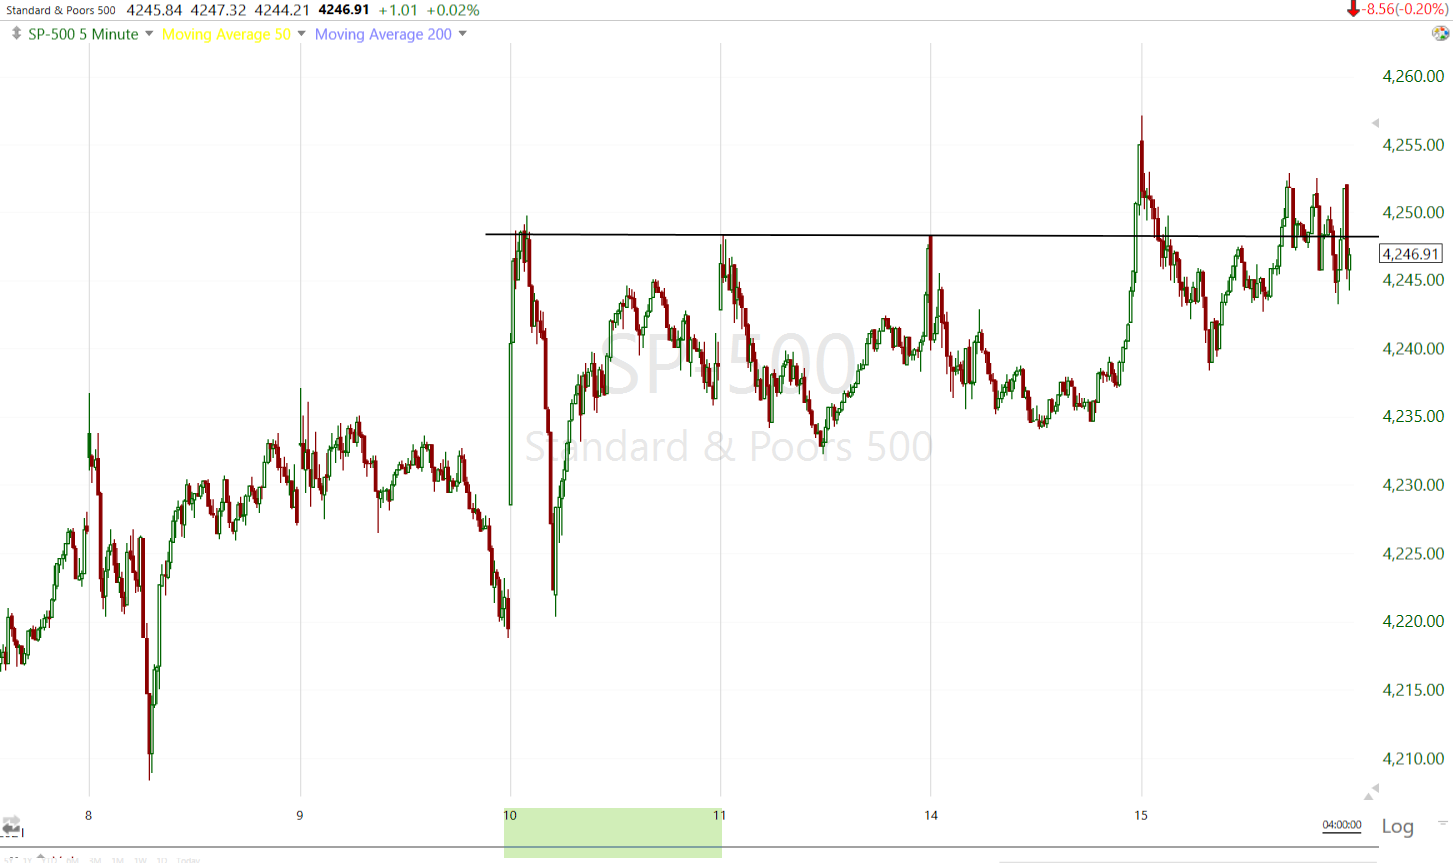 SP-500 (5m) new record closing high on the 10th, but there has been no upside follow through since. Part of this is low conviction among traders, but after yesterday’s late day ramp to get the S&P green and back near $4250, I think another component is Friday’s Quadruple witching and dealers’ related gamma positioning.
The Dow traded down toward its 50-day for a second day where it appears some technical buyers stepped in.
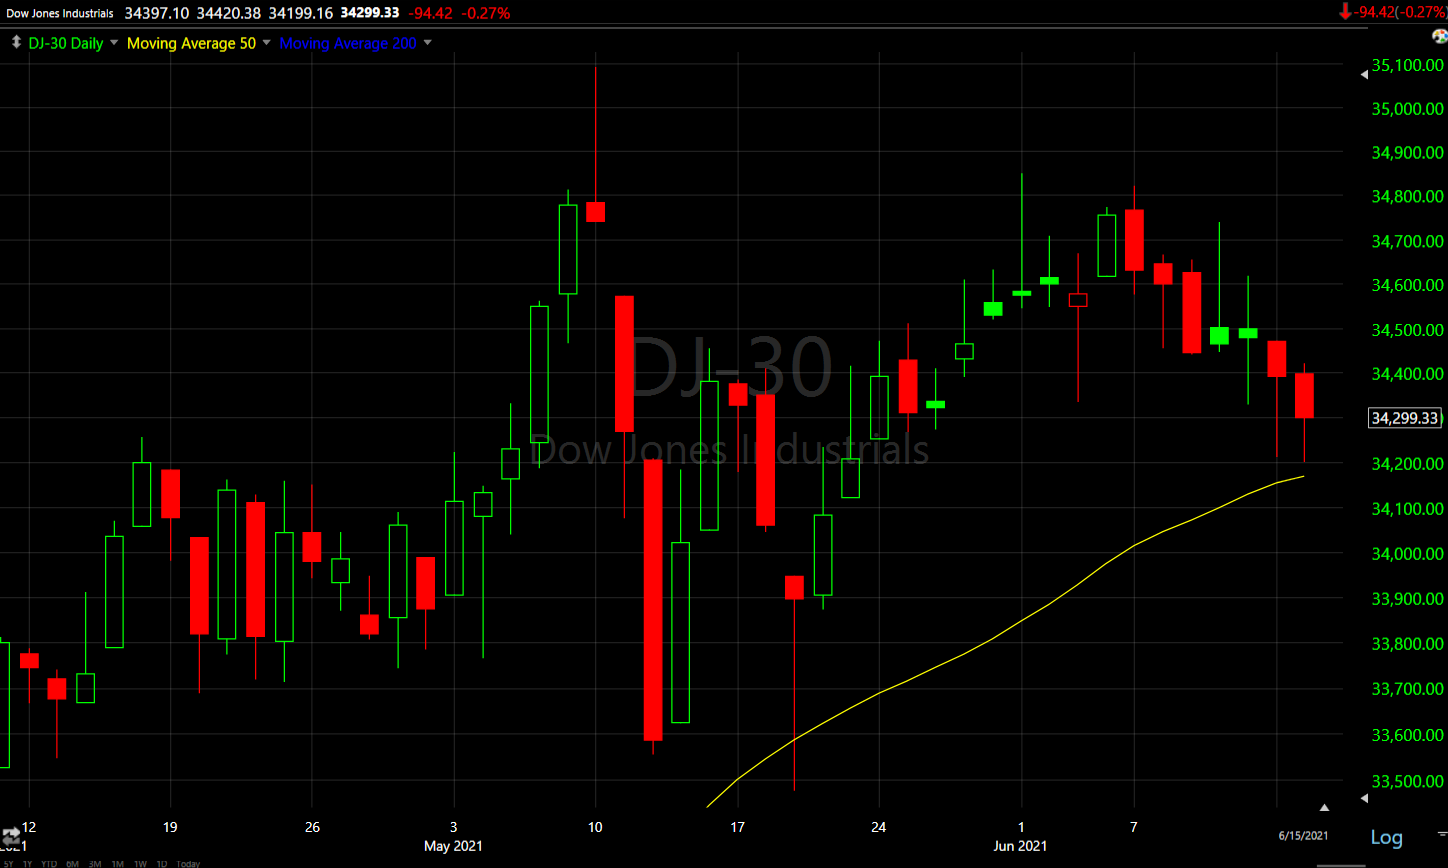 Dow (daily) after filling the May 11th gap, finding resistance and pulling back toward the 50-day, 3C showed some improvement in the area.
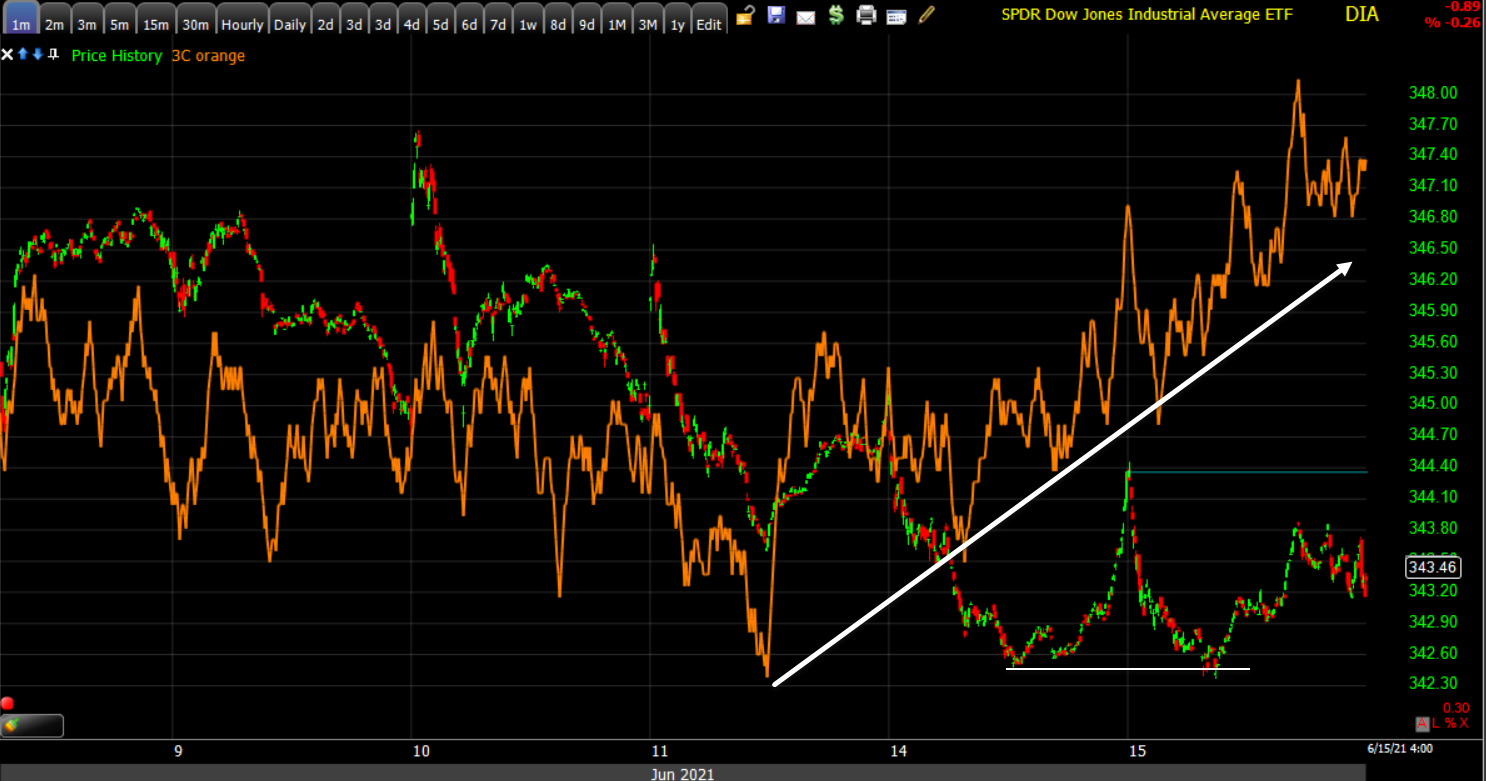 DIA (1m) 3C positively diverging near the 50-day.
Averages
The S&P-500 snapped a 3-day wins streak today with a modest loss. As mentioned in the Afternoon Update, the Dow looks the best to me right now heading into tomorrow all other things being equal, because of the technical support, 3C and Dow Transports (+0.75%) acting better and leading the Dow higher short term. However, as also noted in the Afternoon Update, Transports’ leadership is only short term. On a sub-intermediate term basis they have been, and still are, leading the Dow lower.
NASDAQ-100 underperformed as if yields had jumped today. Recall the NASDAQ-100 stangely outperformed yesterday as yields actually did jump.
S&P 500 ⇩ -0.20 %
NASDAQ ⇩ -0.69 %
DOW JONES ⇩ -0.28 %
RUSSELL 2000 ⇩ -0.26 %
 NASDAQ-100’s daily chart shows price struggling at the upper range trend line.
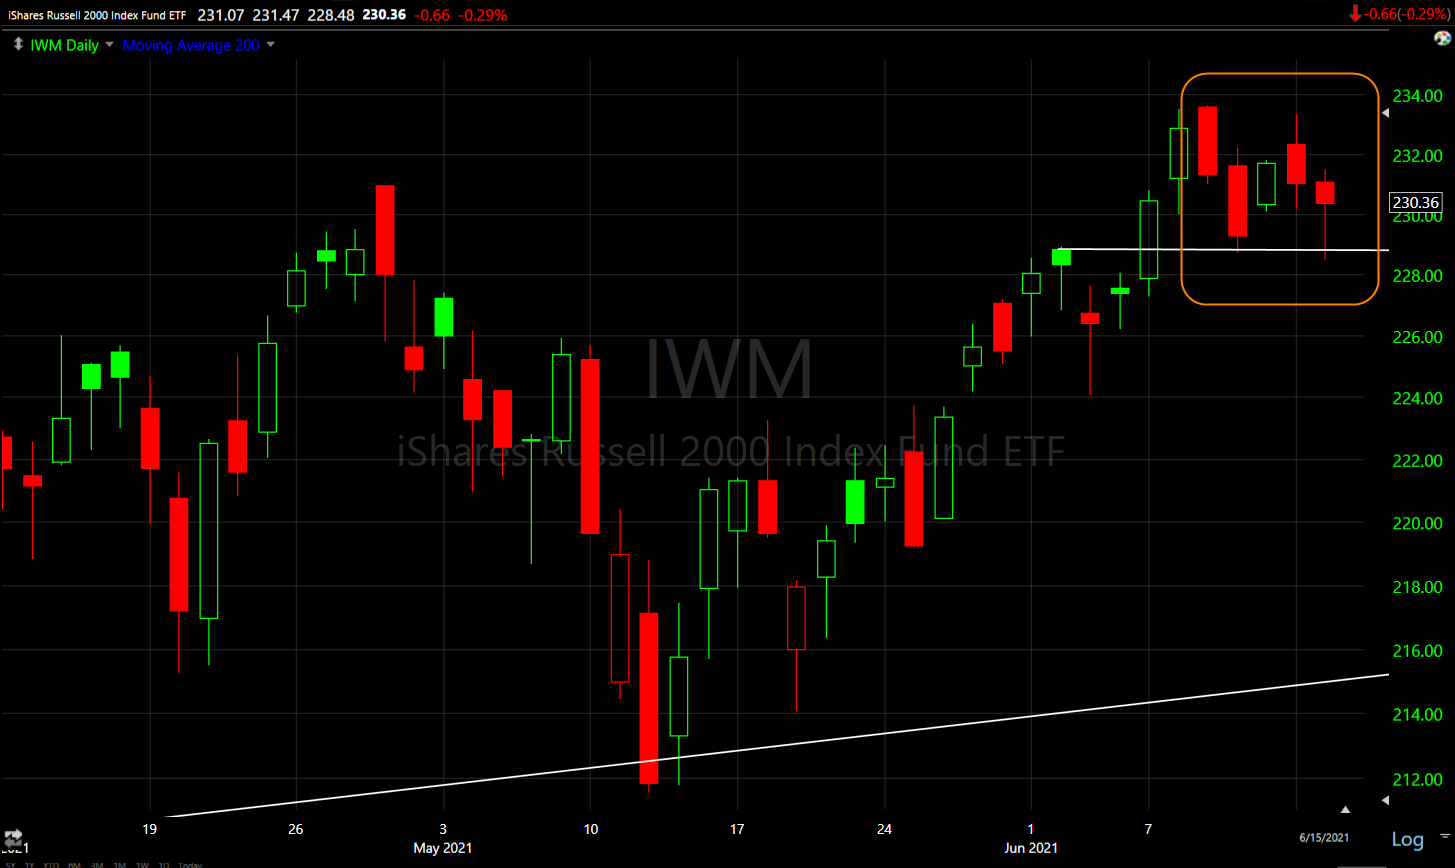 IWM’s daily chart shows weaker price action (red candles) since the most shorted stocks’ squeeze started to fade around the middle of last week.
As covered in the Afternoon Update, there’s very little change on most 3C charts, except DIA/Dow seems to be showing some technical support near its 50-day. There’s also not much change in the longer/stronger trend timeframes, they remain weak or lacking conviction.
 SPY (5m) with the May bull trap that sent the S&P down to its 50-day twice in a week. 3C confirmed the early bounce off the 50-day, but started negatively diverging around the start of June.
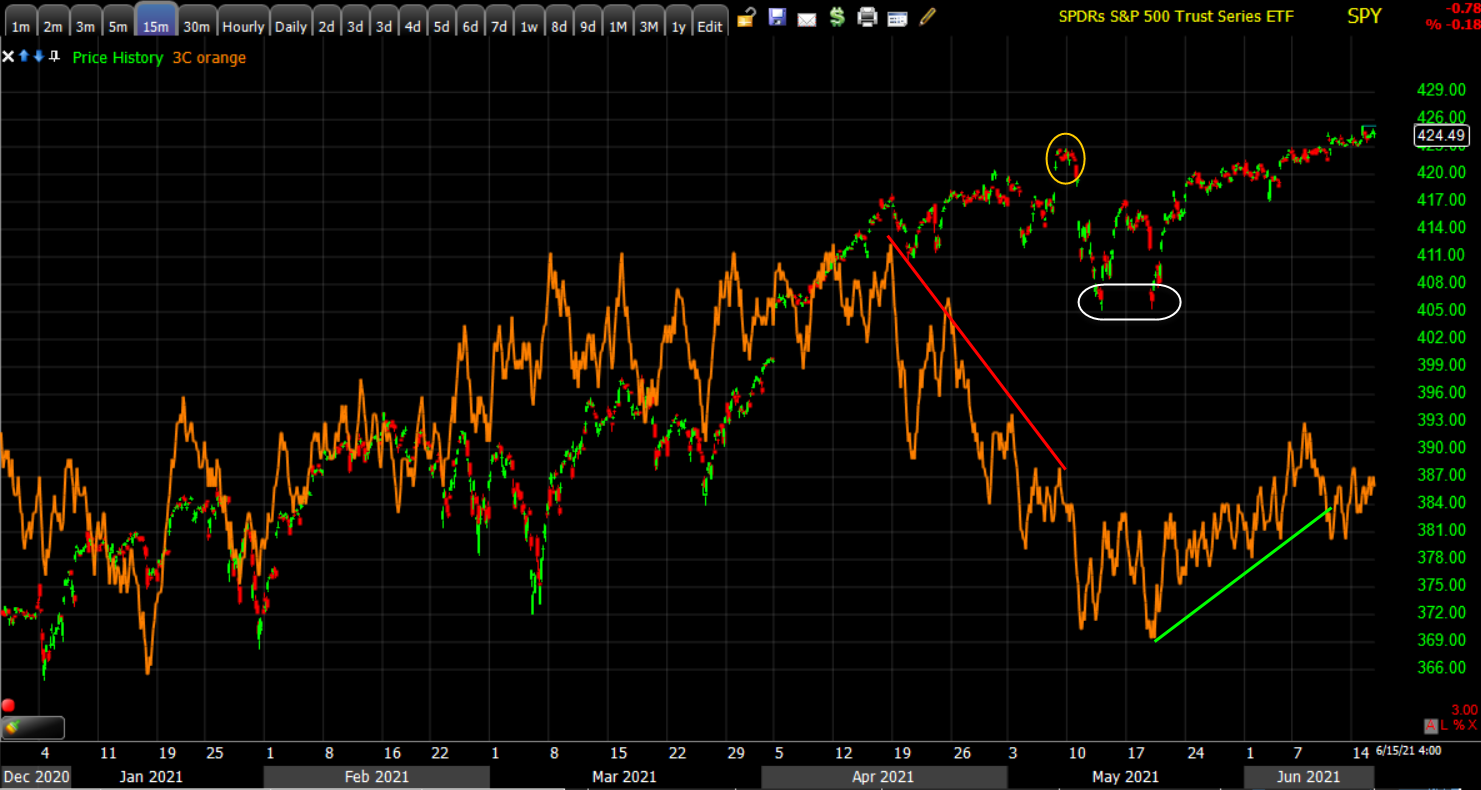 SPY (15m) is a stronger trend timeframe and doesn’t diverge easily. Here we see solid confirmation of the rally until April when 3C negatively diverged and the S&P posted a bull trap/failed breakout from a range. Here 3C shows confirmation of the bounce off its 50-day, but the damage done into April remains in the form of a relative negative divergence. 3C cracking solidly below the green trend line would be a meaningful signal (bearish) and the 5 min chart above is already negatively diverging suggesting that divergence moves to the 15 min. chart. Otherwise 3C needs to make a new high on this chart to confirm prices.
VIX (+3.85%) did display relative strength today as VVIX (+2.6%) has been leading VIX higher in recent weeks. There were other signs of investors/traders hedging, presumably ahead of the FOMC, like modest flattening in volatility’s term structure posted this morning. The Absolute Breadth Index traded lower again today down to 17 (below 15 suggests a very high probability that VIX sees a double digit percentage move over the next month) and the May 25th sub 15 print is still in effect for another 10 days.
S&P sectors
Early this morning only the Energy sector was trading higher with crude oil, but other than that there was no discernable sector bias. As the day wore on cyclicals took leadership with Energy and Industrials best. The mega-cap heavy Technology sector, Consumer Discretionary and Communications all underperformed. Defensive bond proxy sectors lagged behind too. Bond yields were basically unchanged today, but this is exactly how I expected the market to have performed yesterday as yields jumped 4 bp… it seems that there was a delayed reaction.
Materials ⇩ -0.21 %
Energy ⇧ 1.90 %
Financials ⇧ 0.19 %
Industrial ⇧ 0.43 %
Technology ⇩ -0.61 %
Consumer Staples ⇩ -0.24 %
Utilities ⇧ 0.30 %
Health Care ⇧ 0.03 %
Consumer Discretionary ⇩ -0.53 %
Real Estate ⇩ -0.92 %
Communications ⇩ -0.57 %
Several weeks back I noted that the mega-cap heavy sectors had serious overhead supply to contend with and the cyclical sectors were consolidating in large 1 month patterns, but cyclicals had the best chance to breakout of those consolidations. The take-away was that the S&P did not have any lear leadership as S&P sectors also trod water looking for economic clues and speculating how the Fed may react. Since then the Financial sector’s breakout first showed no follow through, then failed. Today the Materials’ sector almost invalidated its consolidation.
 Financial sector (60m) failed breakout
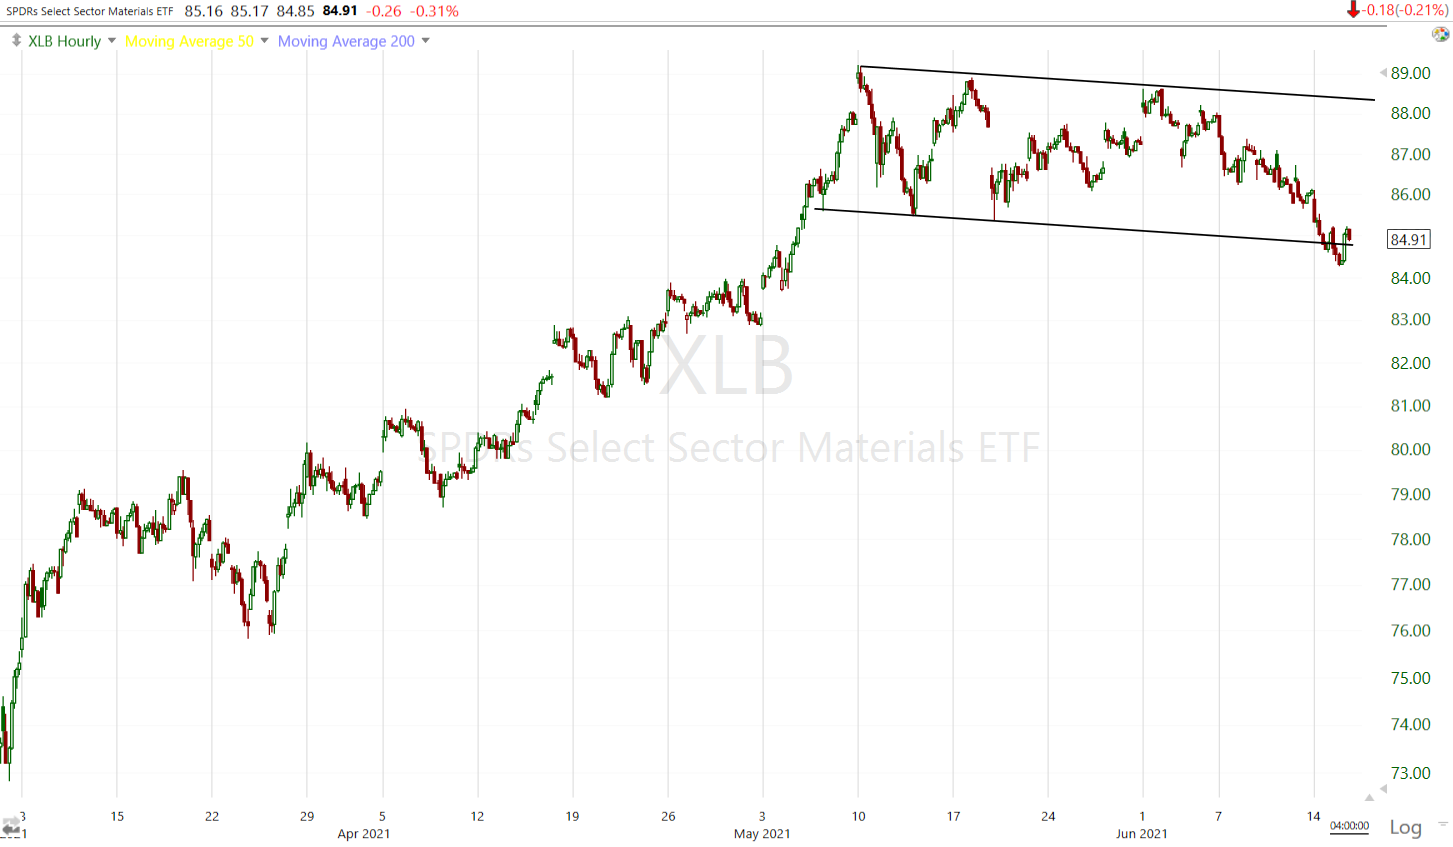 Materials sector (60m) traded below the consolidation briefly this morning and almost invalidated the consolidation, however cyclicals rebounded into a position of leadership this afternoon.
While cyclicals have been floundering the past few weeks, the Tech sector has taken up the slack…
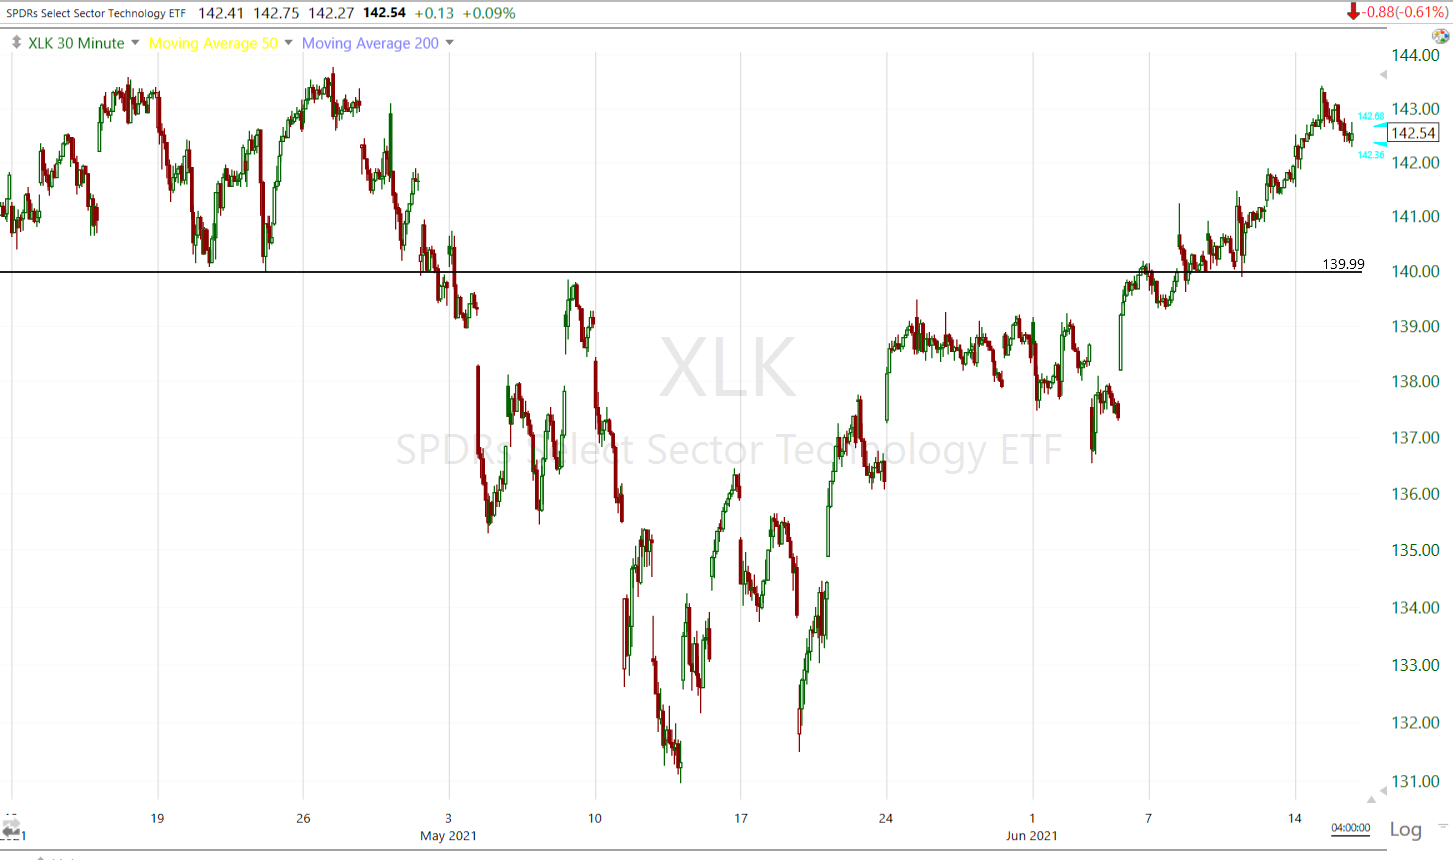 Technology sector (30m)
Yet other mega-cap heavy growth sectors like Consumer Discretionary are still stuck below overhead supply
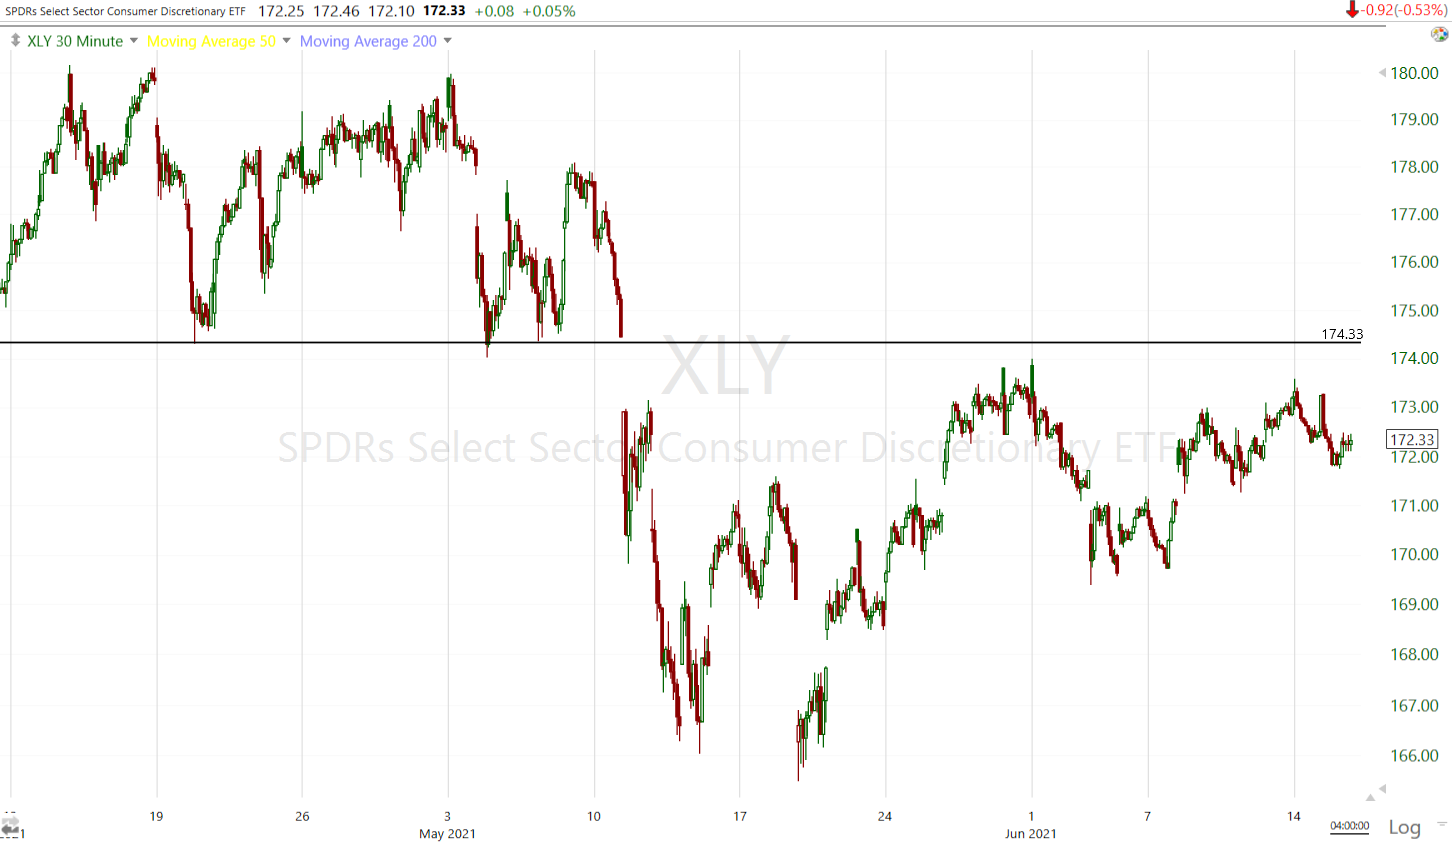 Consumer Discretionary (30m)
Internals
Once again internals were uninspired with NYSE Decliners (1705) just edging out Advancers (1532) reflecting an equilibrium, or treading water. Volume was slightly lower at 865 mln. shares.
There is no Dominant price/volume relationship and no 1-day oversold condition.
Most measures of market breadth have been uneventful in June, but did show some weakness developing today.
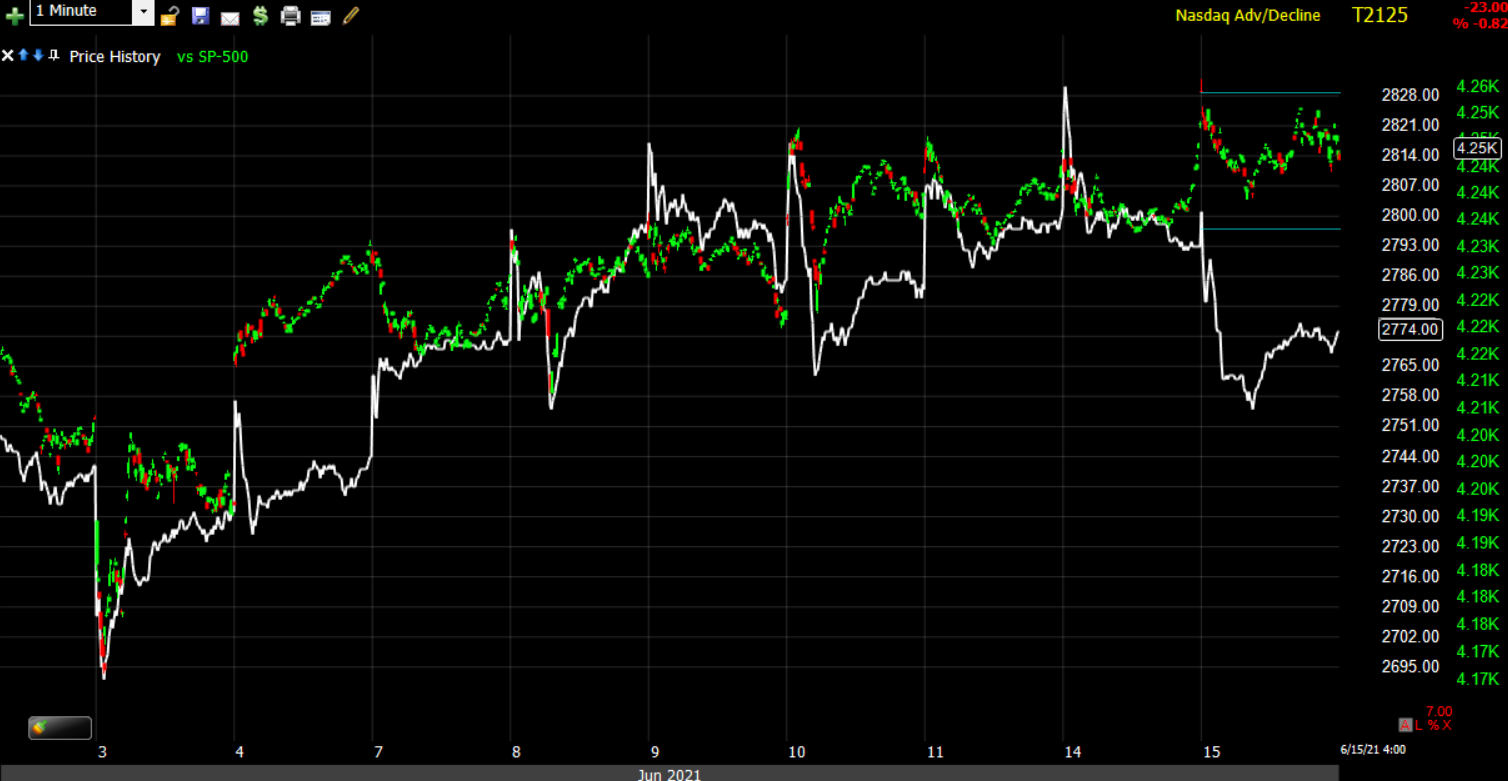 SP-500 (1m) and NASDAQ Composite Advance/Decline Line. NYSE’s showed similar weakness today, as did several other breadth indicators.
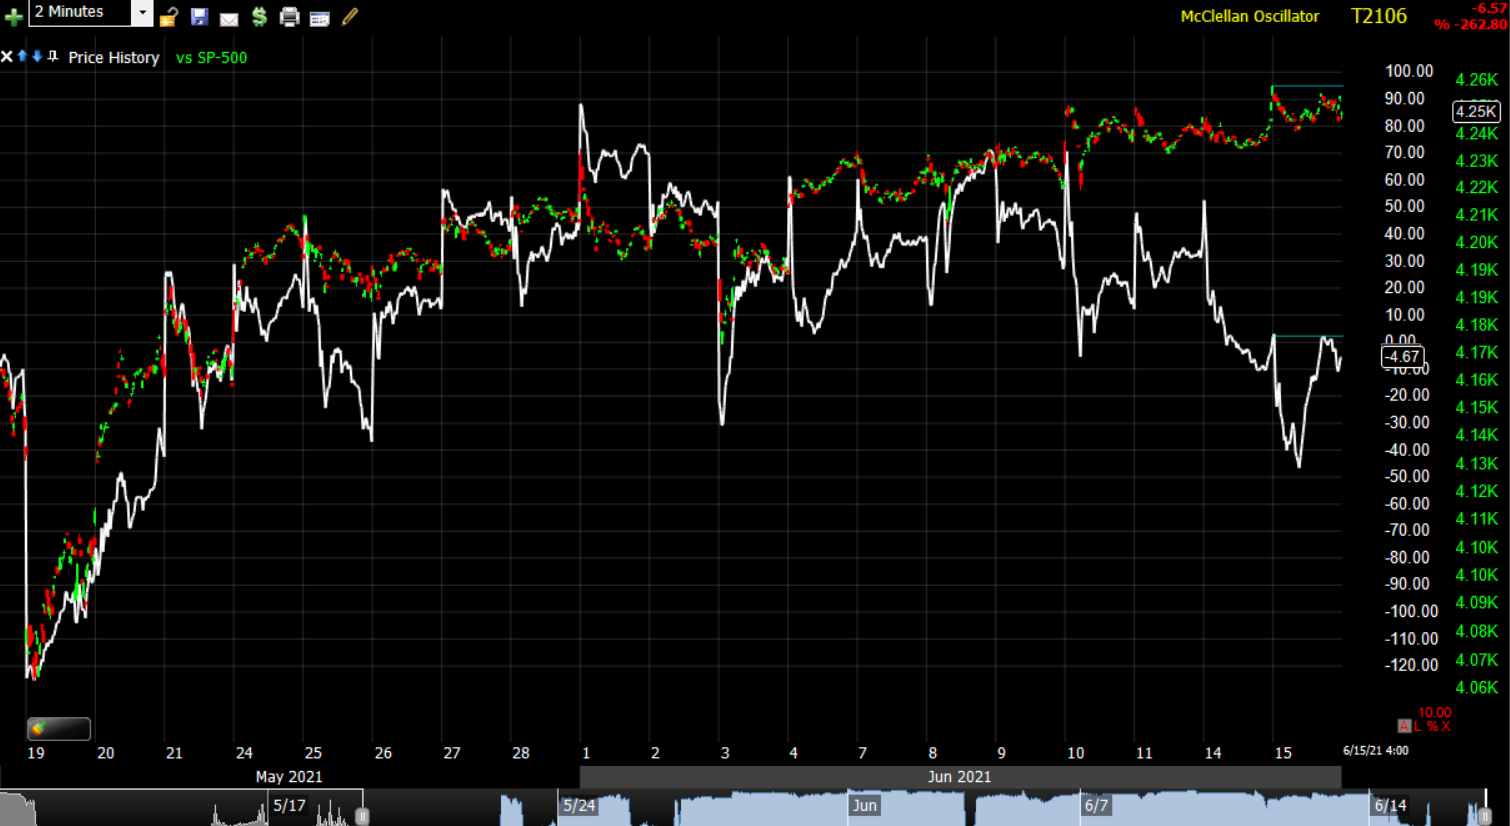 SP-500 (2m) and MCO also showing some recent deterioration as the S&P has made several modest new record highs.
Treasuries
After a strong day yesterday bond yields did next to nothing today despite the inflationary PPI this morning. The Fed sensitive 2-year yield increased one basis point to 0.16%. The inflation sensitive 10-year yield settled unchanged at 1.50%, which was below the 1.53% level it reached soon after the hot CPI report last week. The 30-year yield added 1 basis point and is up 6 bp on the week thus far.
 10-year yield (daily) considering all of the inflationary economic data, the 20-basis point plunge in the 10-year yield over the last month is a head-scratcher, but just days ahead of the FOMC yields held this large bull flag.
I noticed early this morning some relative weakness in high yield credit. The deeply liquid HYG is used by institutional traders as a proxy for S&P futures so it can sometimes be a useful leading indicator of what “smart money” is doing.
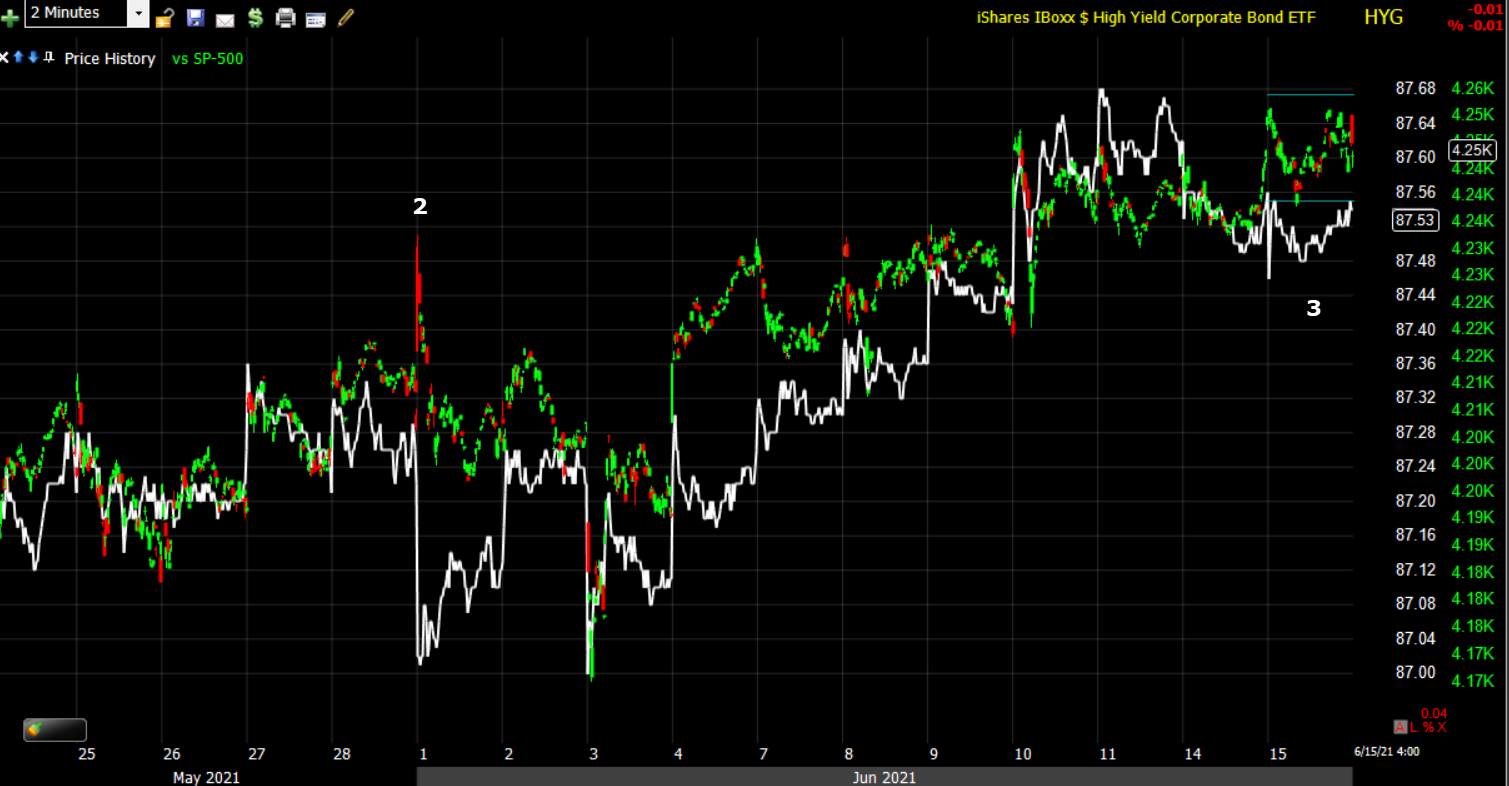 SP-500 (2m) and HYG (white)… the weakness is not jumping off the chart, but I’ve seen HY credit diverge with the S&P and a day later the market is in decline. In fact HYG was one of the signals at the early May new record high that suggested the S&P’s move was going to be a head fake, which it was…
 SP-500 (5m) with the failed breakout/head fake from early May at #1. It’s worth keeping tabs on as the signals can come quickly. It’s reasonable to assume that they are a little nervous ahead of the FOMC tomorrow, but there are other odd developments in smart money land to consider like the extremely elevated SKEW.
Currencies and Commodities
The U.S. Dollar Index was unchanged at 90.52.
I’ve been watching commodities and commodity currencies like the Australian Dollar and the last month or so they’ve been lagging and coming down almost as if they’ve been following the lead in yields. Copper futures fell 4.2% for the biggest 1-day drop since October leaving it down -7% this month.
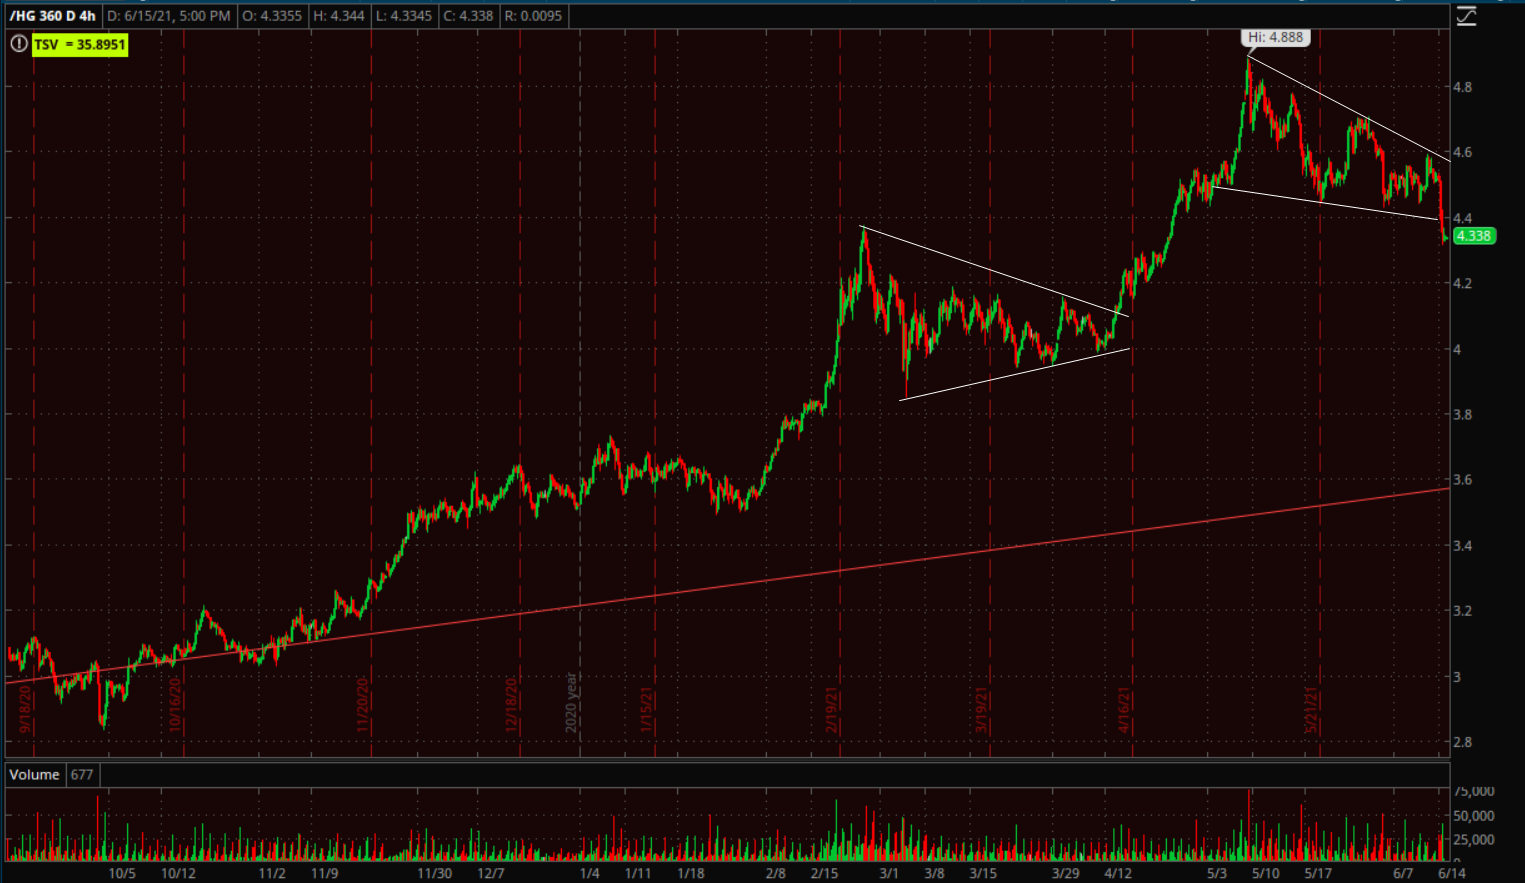
Copper (4h) is a very good macro signal (known as Dr. Copper for this reason) and it has been reflecting inflation. Yet at the same time we are seeing economic data showing stagnating growth. I will be watching copper very closely from here. Today’s price action didn’t decisively break this latest bullish consolidation, but it wouldn’t take much more downside to do so. At which point the question becomes whether it’s a disinflationary signal (inflation slowing, but not deflation), or an economic stagnation signal. I think it’s pretty hard to ignore that economic data has been coming in both stagnating in growth and inflating in prices (both producer and consumer prices), which is a stagflationary environment. The next question and far more important, is what does the Fed do? Once the inflationary genie gets out of the bottle it’s very hard to get back in and typically causes a recession in the process.
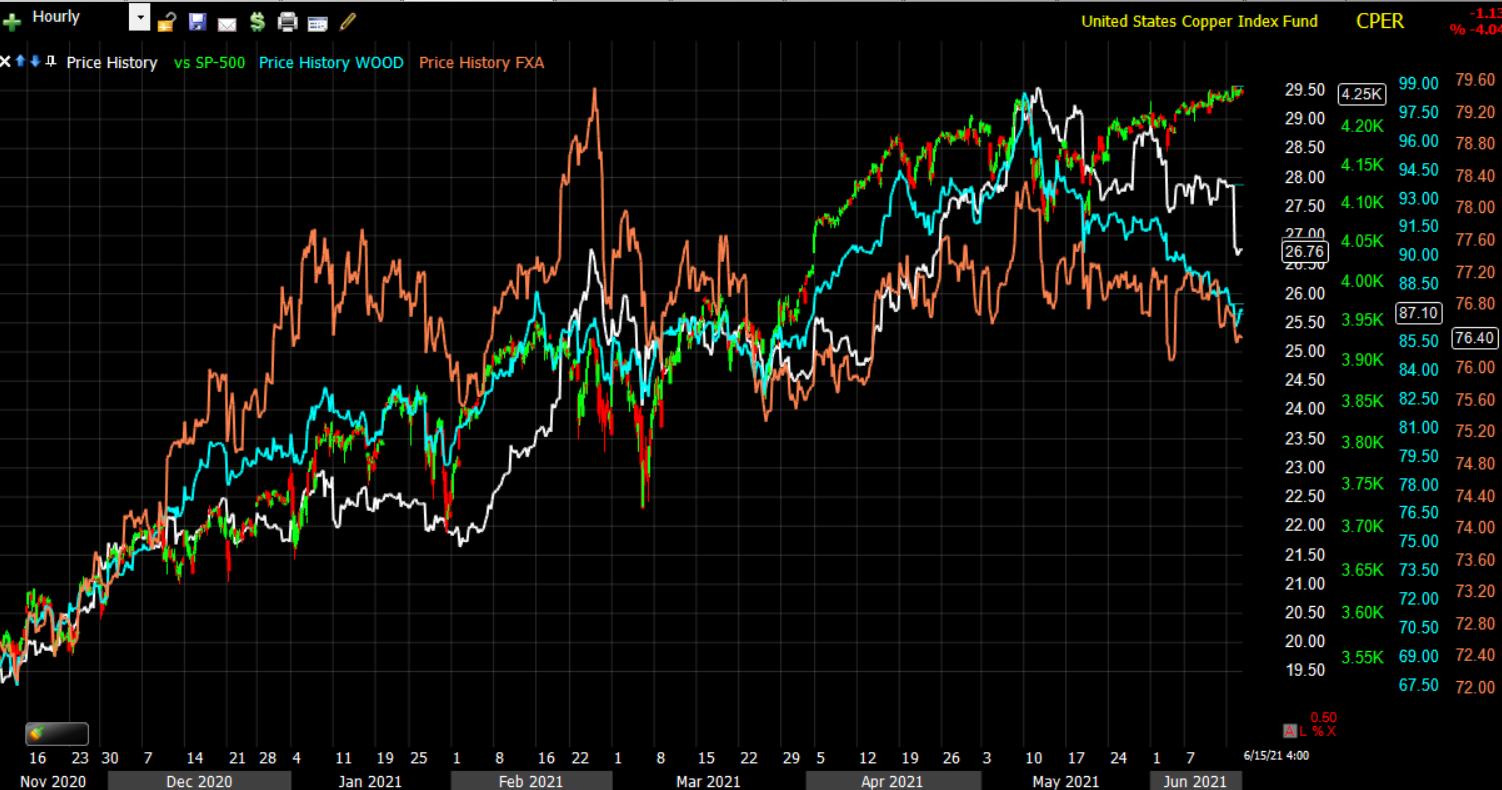 SP-500 (60m) with proxies for Lumber (blue), Copper (white), and the Australian Dollar (orange). These assets gave serious deflationary macro signals before the COVID crash. They’re not giving those kinds of signals here, but they do seem more disinflationary (not deflationary), meaning a slower pace of inflation, although that’s at odds with the economic data that’s been coming in with very hot pricing pressures. This is another set of macro signals to be aware of and check in on
The Australian Dollar is another excellent macro signal. It was one of the earliest macro signals of an inflationary environment and actually led the cyclical/value trade that benefitted small caps so much.
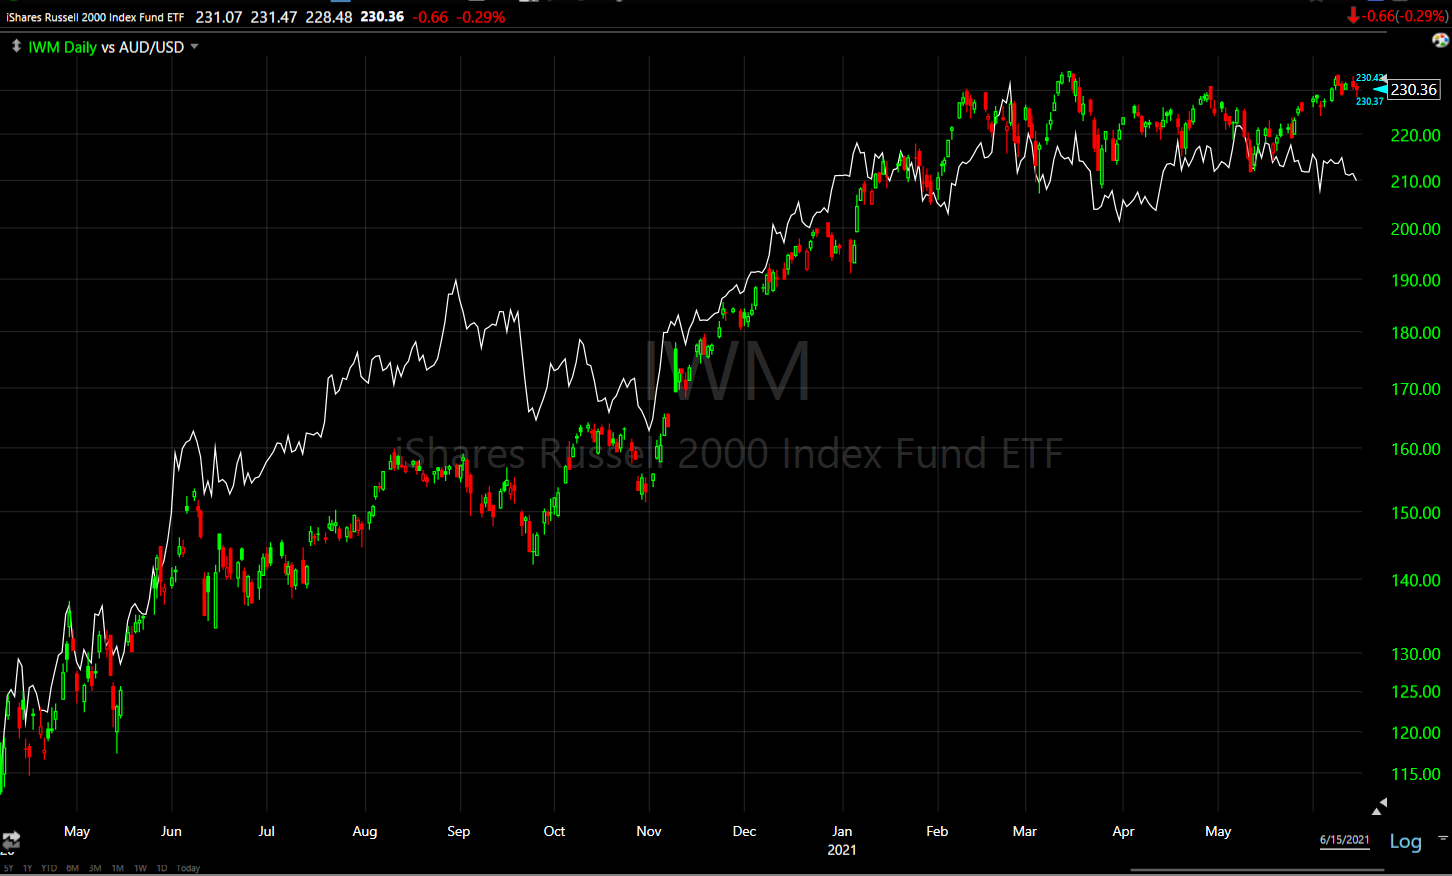 IWM/Small Caps (daily) and AUD/USD (white). The Aussie was reflecting reflation early on around last June and Small Caps didn’t really get the message until November. However, if you look at the IWM daily chart you’ll notice it has been trending virtually sideways for most of 2021, so has AUD/USD. The latter is even a bit weaker on a relative basis now.
WTI Crude oil not only managed gains, but traded to the highest level since 2018, closing up +1.6% to $72.07/bbl. ahead of tomorrow’s oil inventories report.
Gold futures settled lower again, down -0.5% to $1,856.40/oz, lower for a third-straight session.
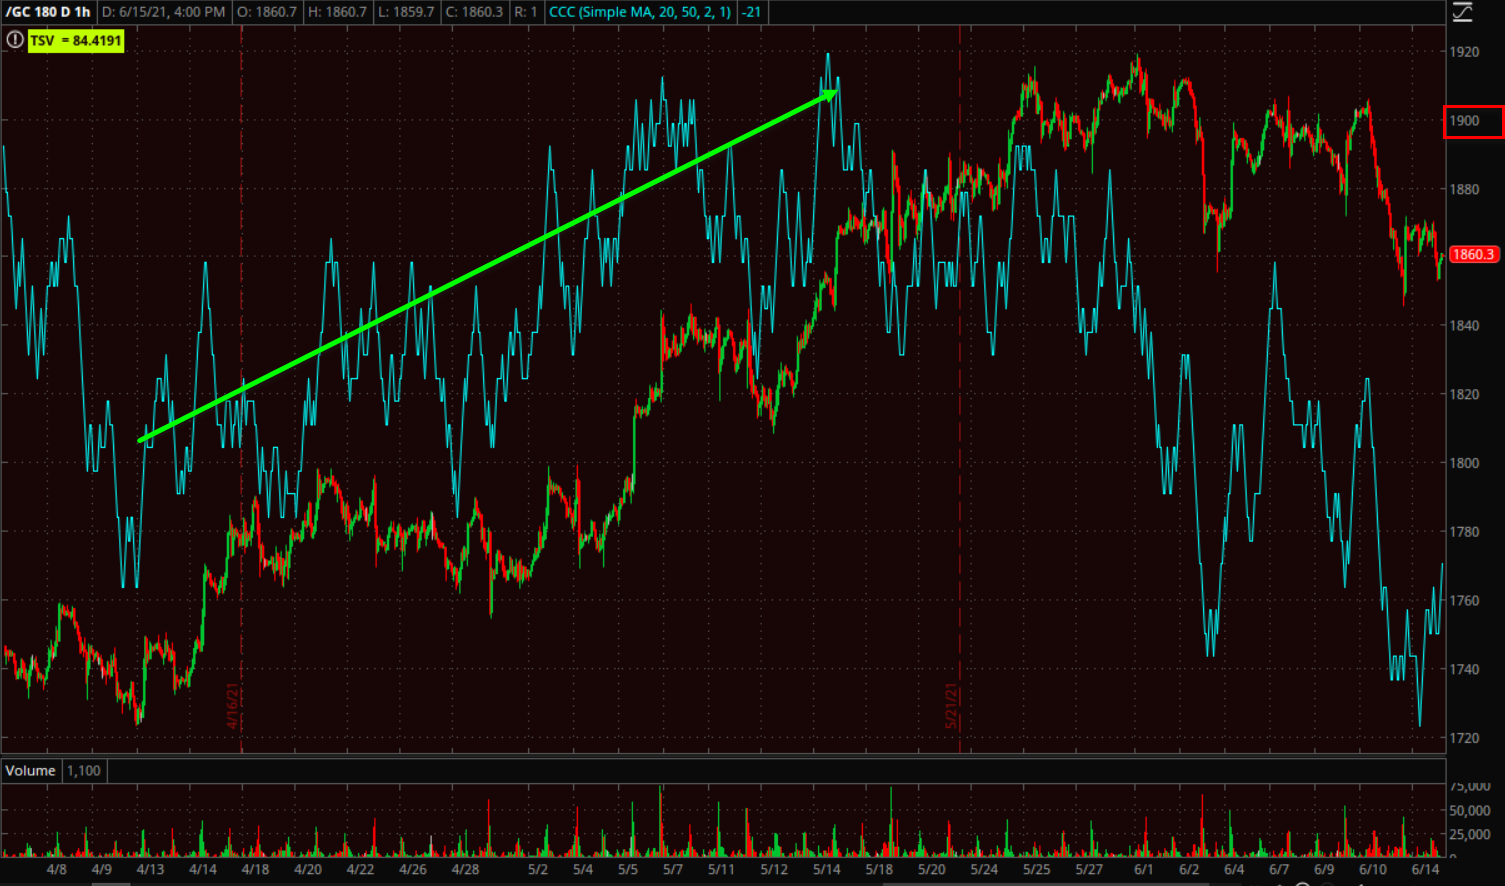 Gold futures (60m) 3C had been confirming what was very constructive/bullish price action from April until gold reached the $1900 area. This is the area I expected resistance well over a month ago. I’m not convinced that gold is turning down, but rather I lean toward it’s starting a larger consolidation under overhead supply. Gold miners (GDX -1.2%) displayed relative weakness today and still have not filled the June 3rd gap down, but nor has GLD for that matter.
Cryptos managed gains today with Bitcoin leading once again and trading back above $41k.
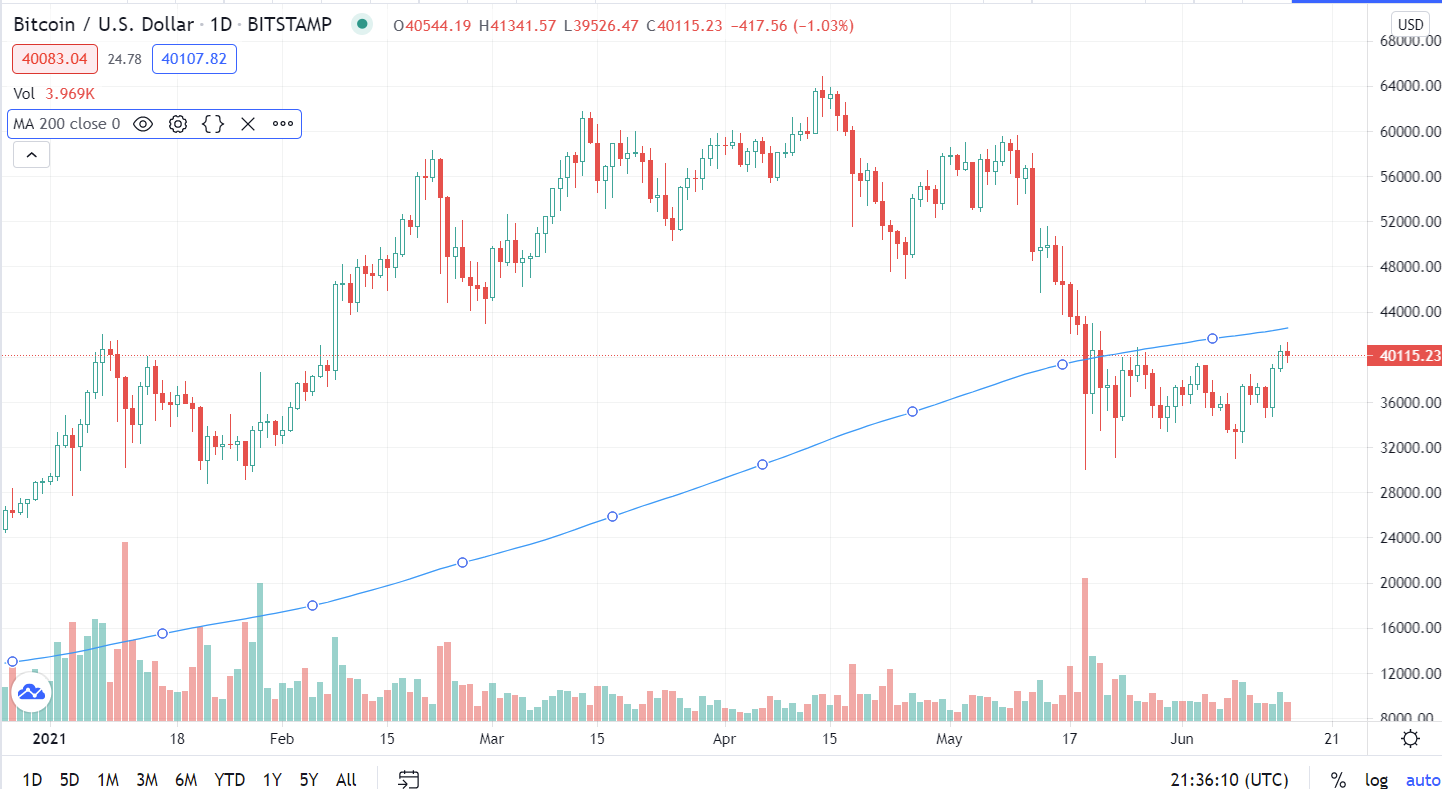 BTC/USD (daily) with 200-day – this is looking more like a short-term bottom, but there’s still a lot of work to be done.
I still prefer Ethereum over Bitcoin presently and ETCG gained +8%, trading in another large bullish wedge.
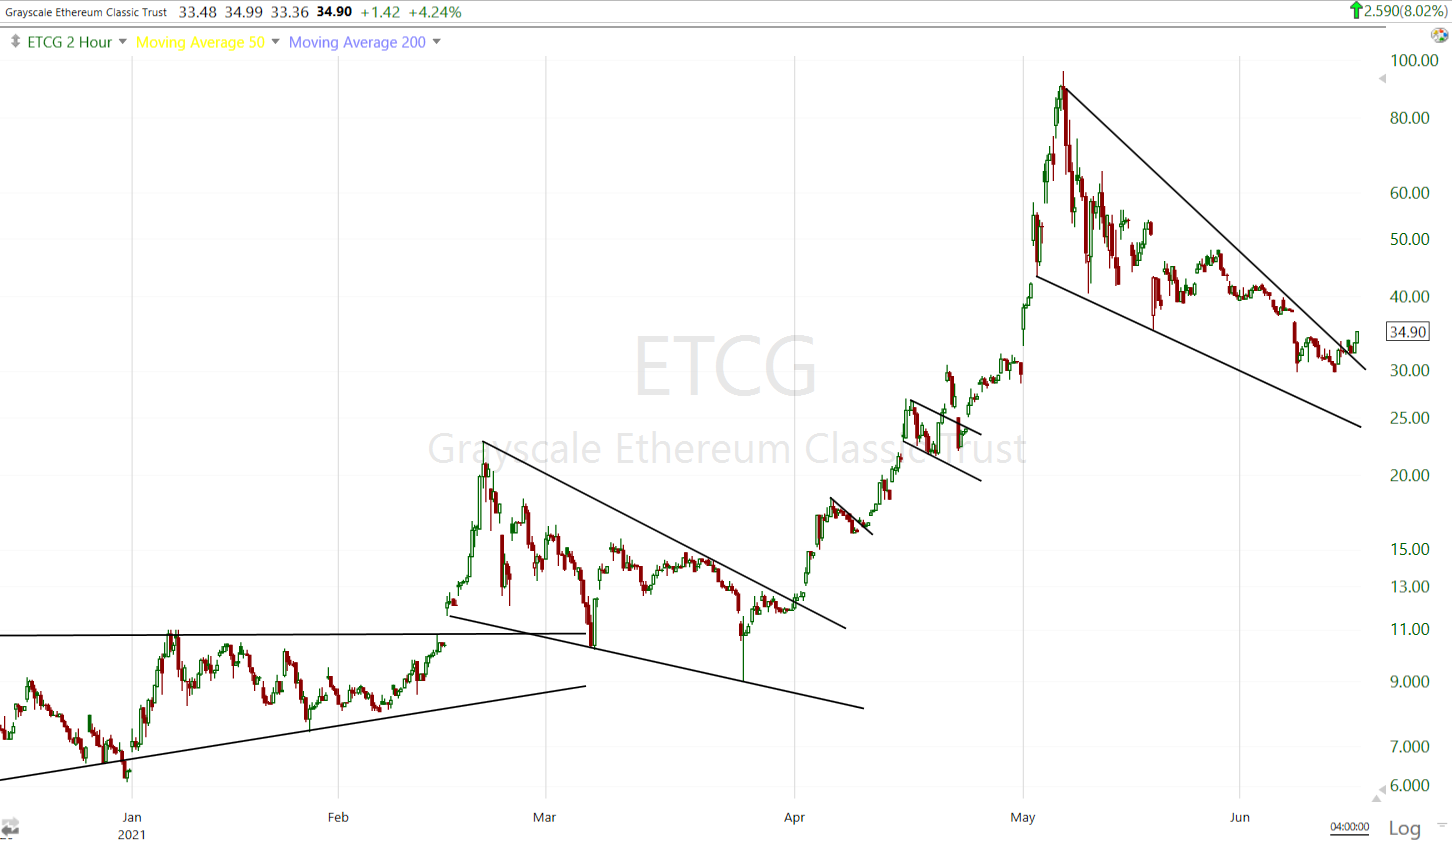 ETCG (2h)
Summary
Investor conviction could be said to be lacking today ahead of the FOMC tomorrow, but conviction has been lacking for well over a month and notably the last couple of weeks. That’s on the part of both bulls and bears as the market treads water looking for economic cues and what those cues mean for Fed policy. On the latter point, tomorrow could be a big day with the FOMC policy statement at 2 p.m. ET followed by Powell’s press conference at 2:30 p.m. ET.
As this Bank of America research shows, nobody expects the Fed to signal tapering of asset purchases tomorrow, or even in July.
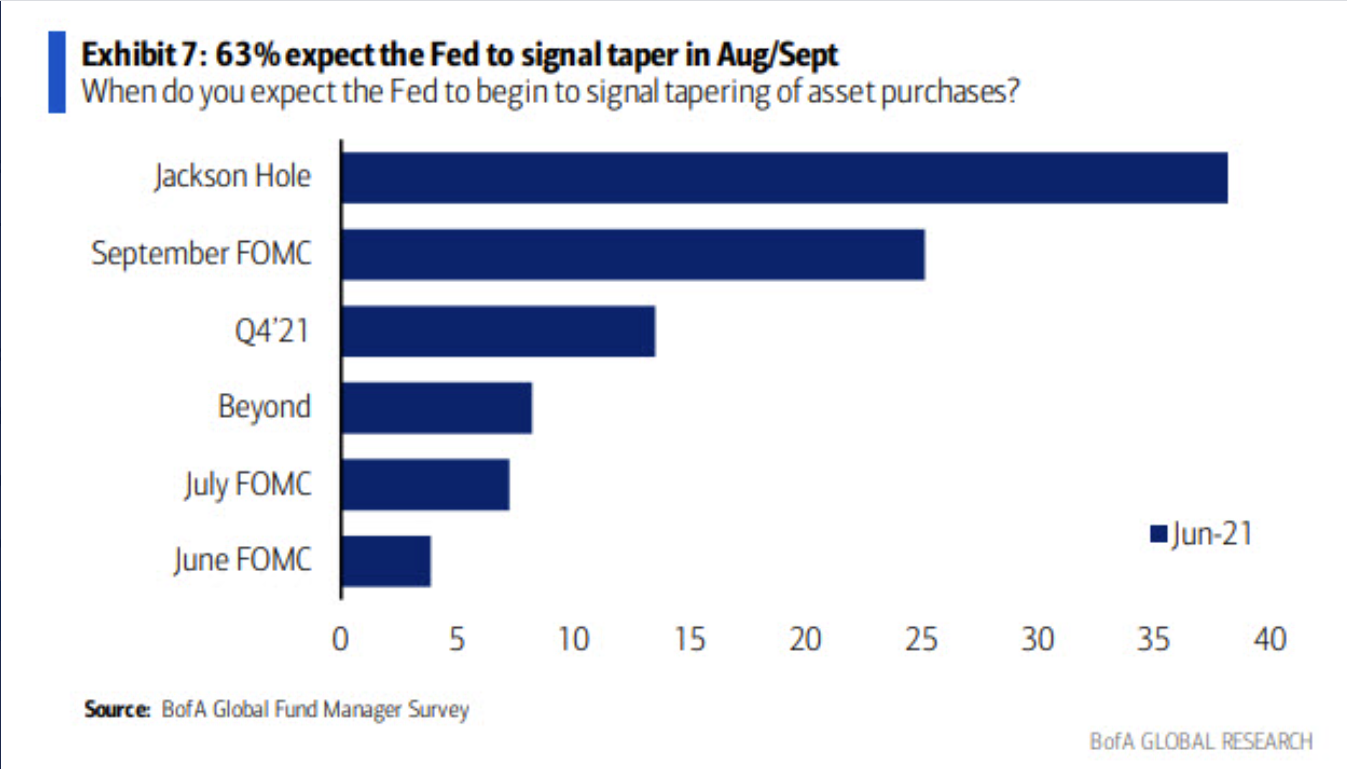
Yet, an increasing number of Fed presidents and FOMC participants have been making noises about starting the asset purchase tapering discussions sooner than later. Hot inflation could very well force them into taking action to taper asset purchases. While it’s not expected, tomorrow’s meeting has the potential to move markets because it could start the process of the Fed communicating tapering of this historic accommodation of $120 bln. a month.
Otherwise, investors will be looking for hints about when the central bank will slow the pace of emergency asset purchases. The statement is set to include updated forecasts, and expectations are that officials would broadcast any taper plans well in advance. As I always warn, beware of the knee jerk reaction on the policy statement at 2:00 p.m. ET, and then Powell’s press conference at 2:30 p.m. ET. Frequently the initial reaction is faded.
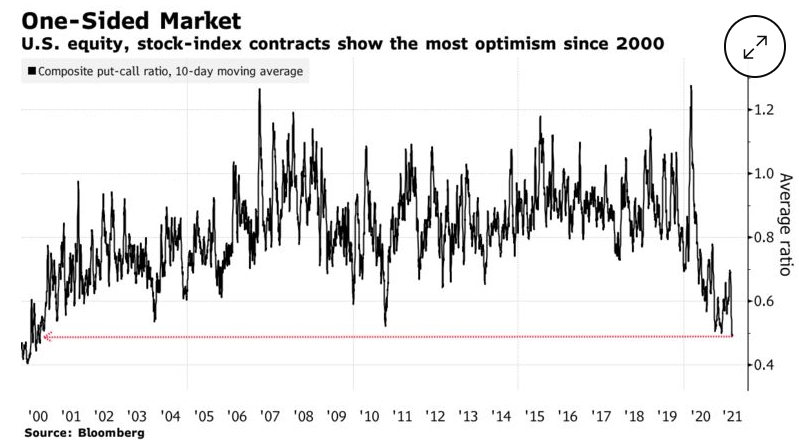
Finally I have an interesting dichotomy… On one side, historic investor complacency.
On the other side, the CBOE SKEW Index just printed another all-time record high today indicating aggressive hedging of tail risk.
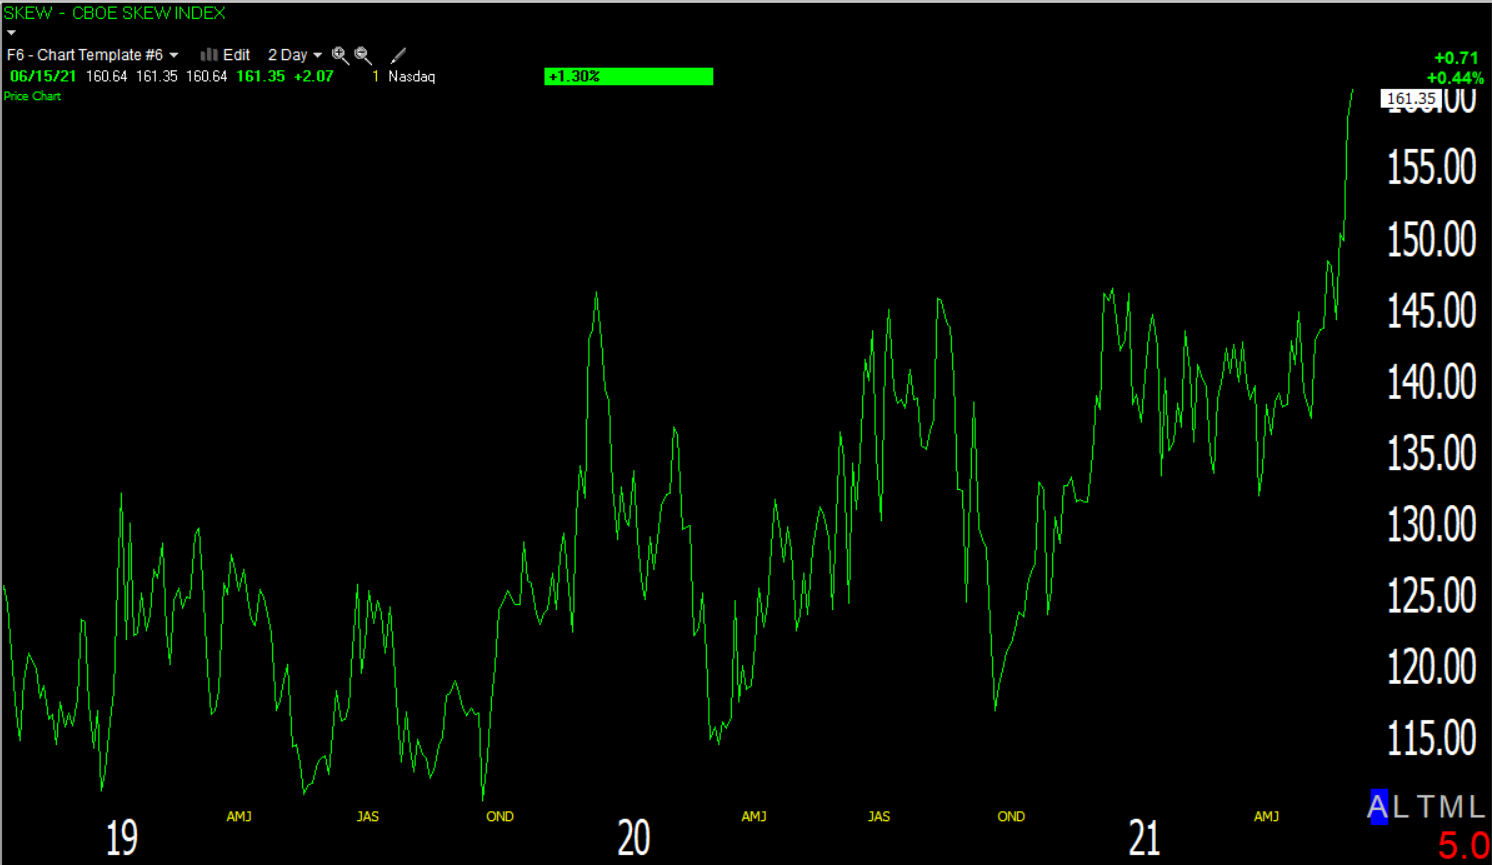 SKEW Index (daily) printed 161.35 today. Yesterday and today’s prints are the highest ever.
My interpretation of these two charts is that the masses are extremely complacent, but institutional or smart money is very worried. Retail traders don’t typically use sophisticated hedging like what we’re seeing in the SKEW Index. The spike in SKEW just before the FOMC suggests hedging for a surprise like the Fed announcing a date for tapering of asset purchases, but it could be something else that’s just not on our radar right now. There’s no doubt these investors have access to inside information. For 6 weeks before the 2020 market crash I was pounding the desk about macro signals like plunging yields, copper, the Aussie, crude oil, all pointing to a massive deflationary event, but at that point there were no known or disclosed cases of COVID in the U.S. and no one was paying it much attention. The S&P made a new record high in mid-January 2020. Over the next 2 weeks the S&P dropped 3% to test down to its 50-day. No one thought much of it at the time and the S&P went on to make a new record high in February just before the 35% crash. Later we found out that Congressional representatives had been briefed on the risk COVID presented just a day before that January decline started and at least 4 senators were under investigation for selling stocks after that briefing. I can tell you with 100% certainty that the selling of 4 senators was not behind the 3% S&P decline, I’m quite sure they let some close friends in high places within the financial community in on the briefing. And I’m quite sure by the action in commodities, bonds and currencies, that powerful players were in the know well before that. By the way, the SKEW index hit 150 in December so someone was hedging tail risk (black swan risk) back then too. COVID ended up being a perfect example of tail risk.
Overnight
S&P futures are unchanged, but 3C is pushing lower early in the overnight session.
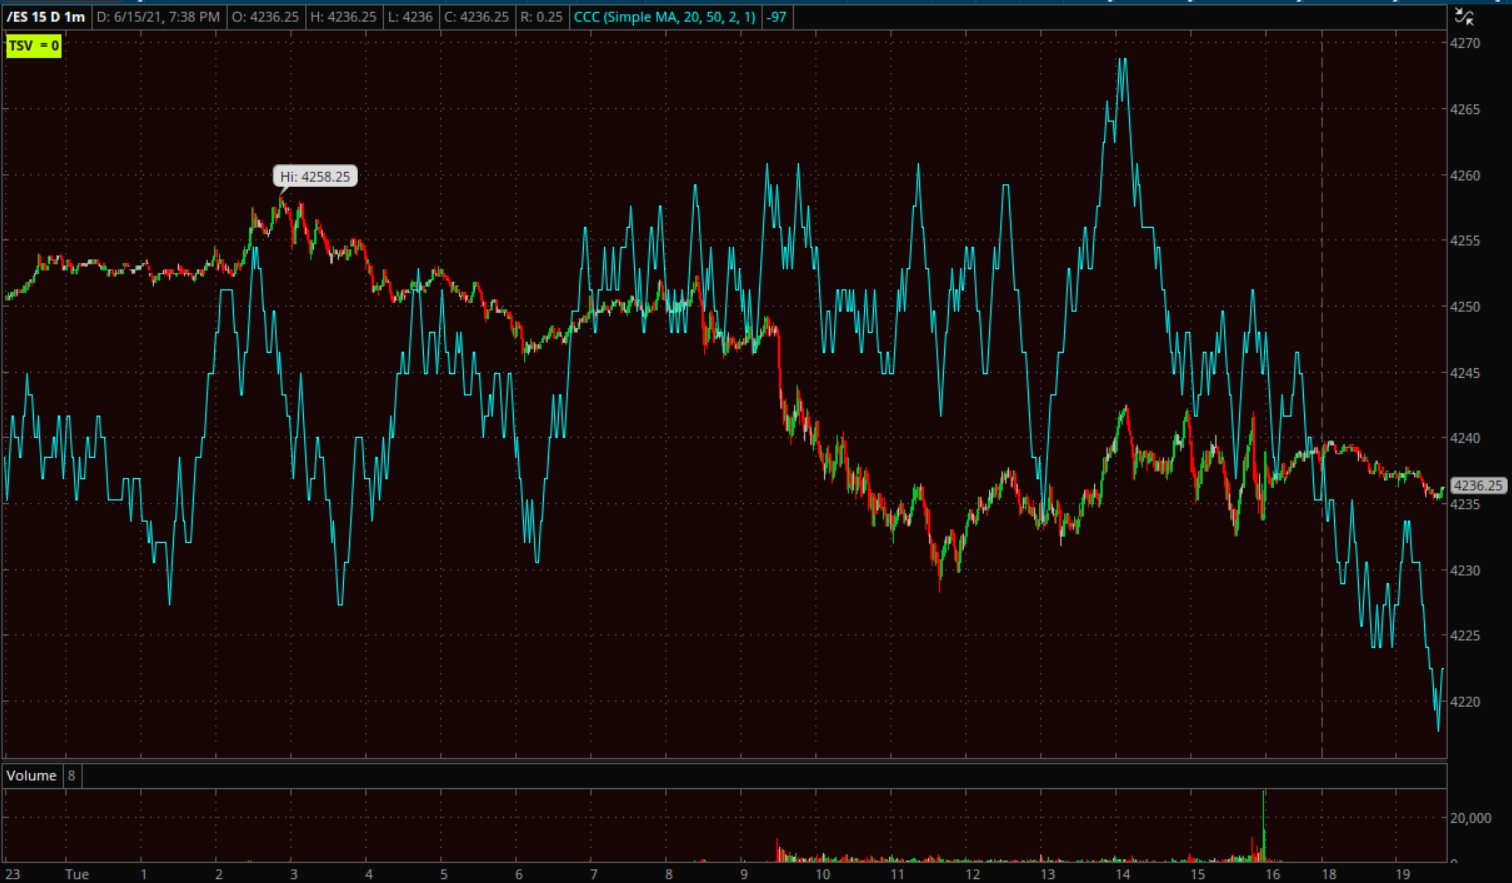 S&P futures (1m)
Russell 2000 futures are the next weakest on 3C, while Dow futures look better and NASDAQ-100 look the best tonight.
WTI Crude futures are up a half percent after the API oil inventories showed the biggest draw down in crude inventories in 5 months. Gold futures are up +0.15%, but look like a small bearish consolidation and lok likely to test today’s lows around $1853.
Looking ahead, investors will receive the FOMC Rate Decision, Housing Starts and Building Permits for May, Export and Import Prices for May, and the weekly MBA Mortgage Applications Index on Wednesday.
Here are some key events to watch this week:
- U.S. President Joe Biden and Russia’s Vladimir Putin meet Wednesday in Geneva
- U.S. Treasury Secretary Janet Yellen testifies before a House panel Thursday on the federal budget
- Rate decisions come from Switzerland and Norway on Thursday.
Things are finally getting interesting.