Daily Wrap – Higher Rates Hit Stocks
This isn’t turning out to be the January that many investors hoped for after Santa refused to visit Wall Street.
For quite some time I’ve advised to keep an eye on WTI Crude Oil and the effect it has on rates. Rates will have an effect on stock multiples, and the Fed – in the latter’s case, leaning “higher for longer”, which doesn’t help stocks. Today we got a great example of higher rates hitting stock valuations.
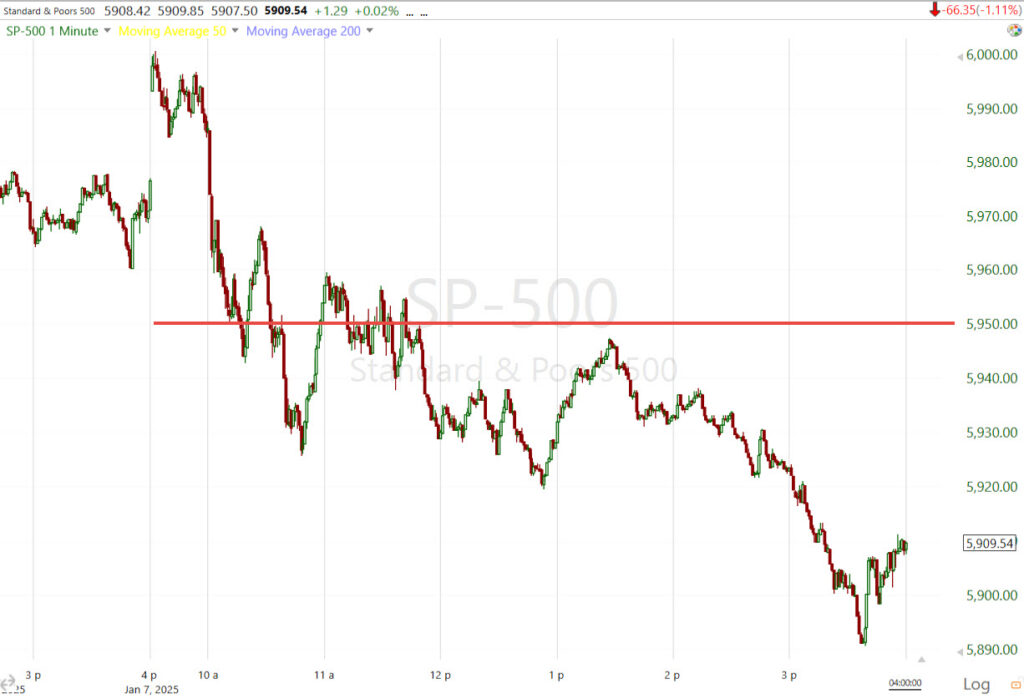
The stock market initially traded higher, but gains faded quickly, responding to the economic releases at 10:00 ET. Treasury yields shot higher as stocks declined in response to a stronger-than-expected JOLTs Job opening report and the ISM Services PMI reading for December. While both 10 a.m. data came in better than expected, the jump in yields was more a function of the Prices Paid component of ISM which shot above 60 (to 64.4% from 58.2%), screaming higher and dragging yields higher. Stocks slid after 10-yr yield jumped to 4.68%.
From yesterday’s Market Update,
“A challenge for Small Caps and the rest of the broader market, including mega caps, is high yields and oil’s recent run above $71 that’s likely to put more pressure on Treasuries, sending yields higher.
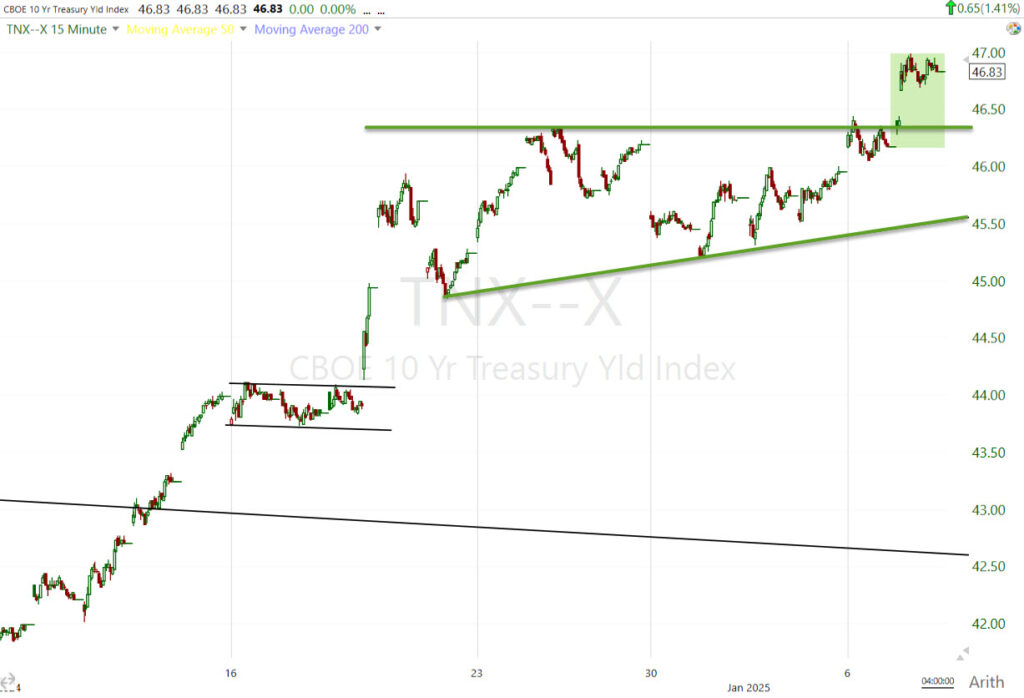
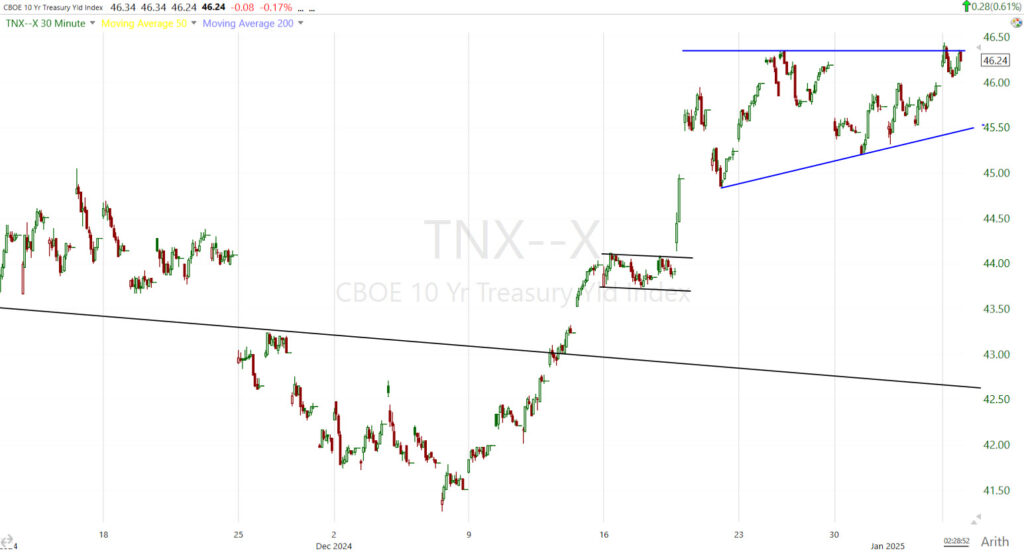 10-yr yield’s price action above the danger zone (trend line) is looking more and more bullish with an ascending triangle forming.
The 10-yr yield broke out of that bullish Ascending Triangle today…
A decent portion of the move higher in yields was driven by Crude Oil’s gains since WTI broke out above $71. This is exactly why I’ve been so keen to watch oil price action closely, even when it “was” one of the dullest assets over recent months.
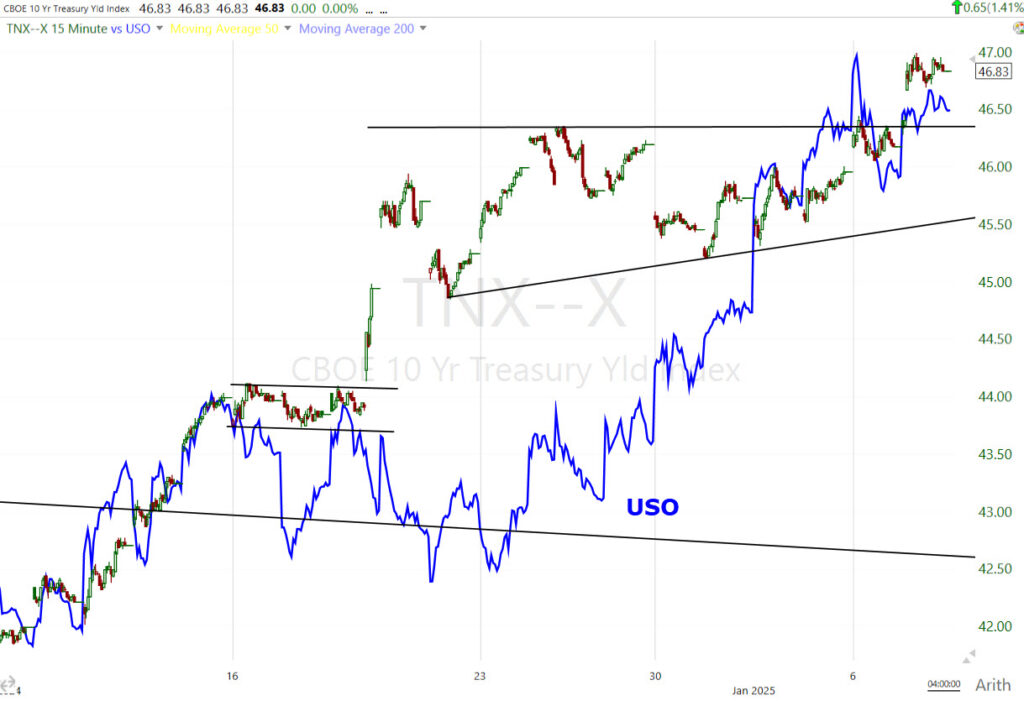 10-yr yield (15m) and USO (blue).
Comments from president-elect Trump added some volatility to the mix. I can’t cover every bullet point of the presser, but some of the more memorable comments included…
- Interest rates are far too high (I knew this fight with the Fed was coming)
- Trump wants to see Federal debt ceiling extension
- Would not rule out military and/or economic tools to regain control over the Panama canal and acquire Greenland
- Threatened Denmark with tariffs to try to force a sale of Greenland
- “Something will have to be done with Canada/Mexico trade”
Averages
Notice that the two cap-weighted averages with the most exposure to mega caps were the worst performing today. Nasdaq-100 had its second worst day in 2 months, followed by the S&P-500.
S&P-500 ⇩ -1.11 %
NASDAQ ⇩ -1.79 %
DOW JONES ⇩ -0.42 %
RUSSELL 2000 ⇩ -0.74 %
As I’ve been pointing out nearly every day for the last several weeks, 3C’s short-term trend has been very clear… LOWER.
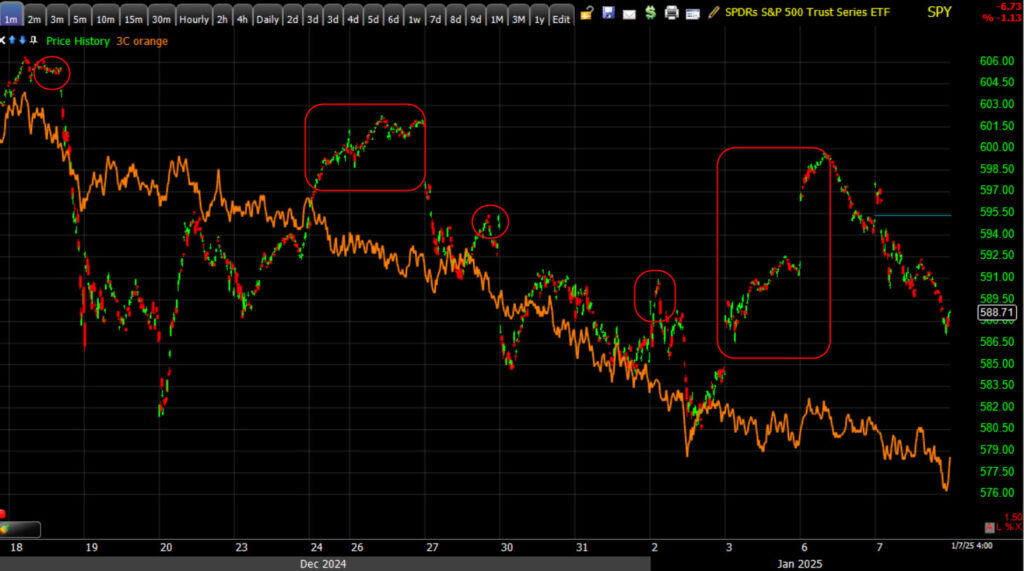 SPY (1m) – Of special note, 3C’s downtrend since the latter part of December through the new year looks the worst in the two cap-weighted averages that are influenced by mega caps more than any others. There’s a certain irony considering mega caps were the only game in town most of December amid window dressing.
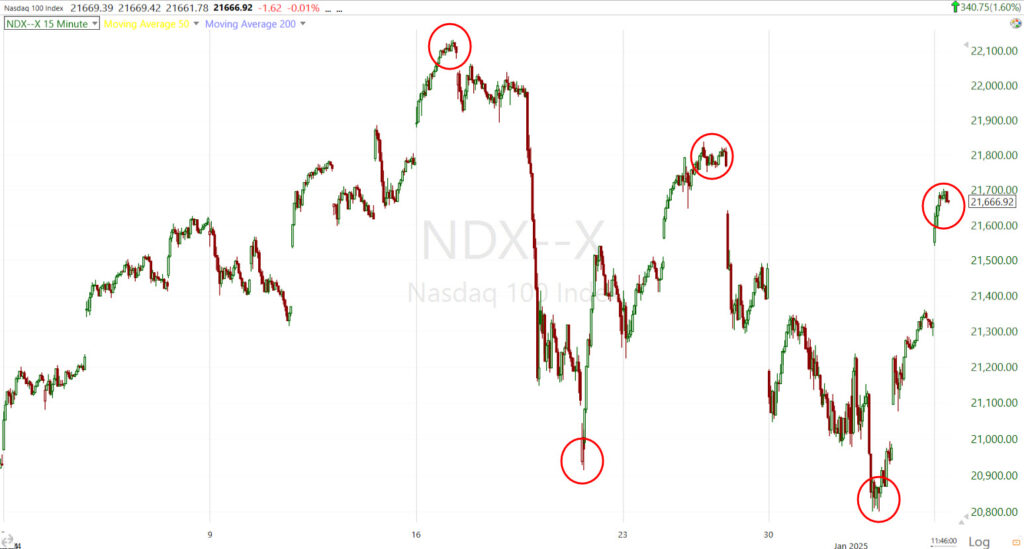
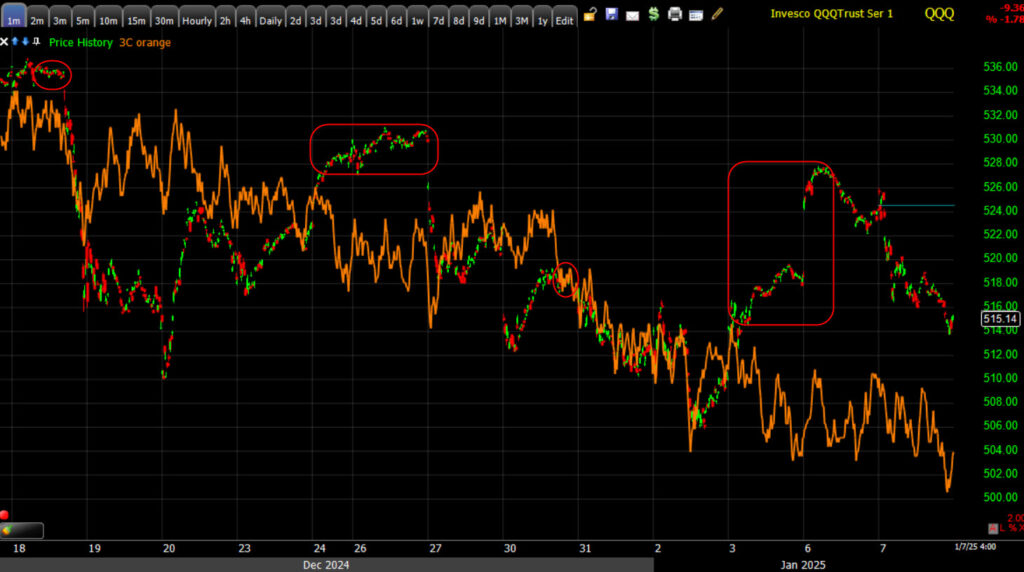 QQQ (1m) – There have been bounces in price along the way, but 3C hasn’t confirmed any of them, then prices trend lower following 3C’s lead. The Nasdaq-100 is already in a sub-intermediate down trend of lower highs/lower lows since the December FOMC, for which we get the release of the meeting’s Minutes tomorrow.
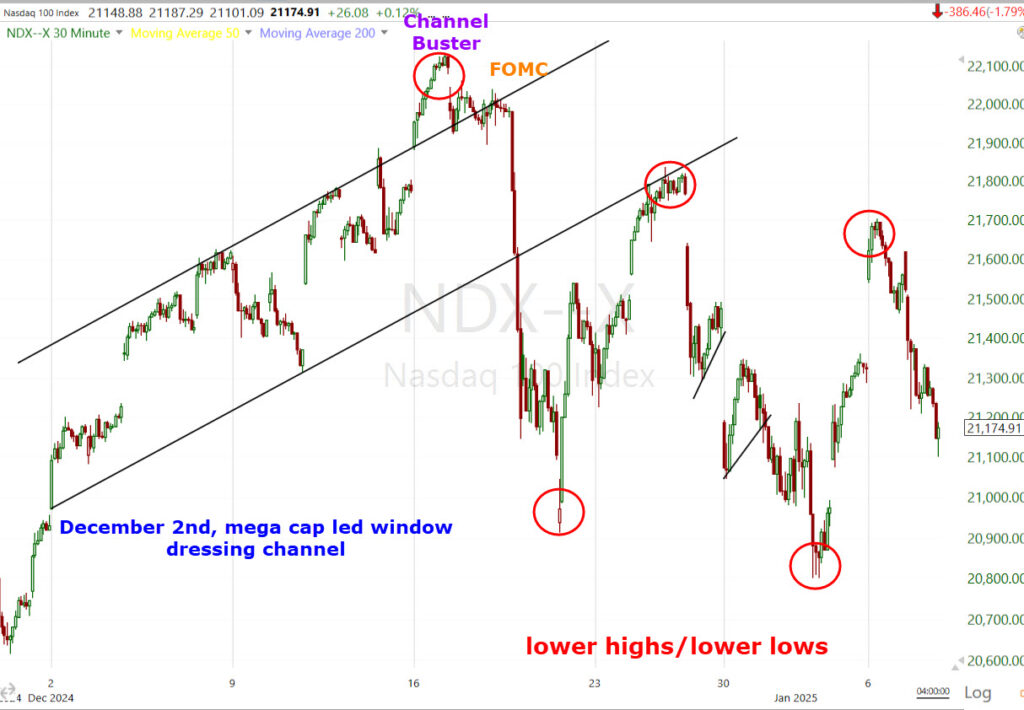 NDX (30m) – Price making another lower low in the NDX from here would be a big deal as it would break the 50-day SMA that the NDX has held as support since September, following July’s sharp sell-off and massive move in VIX.
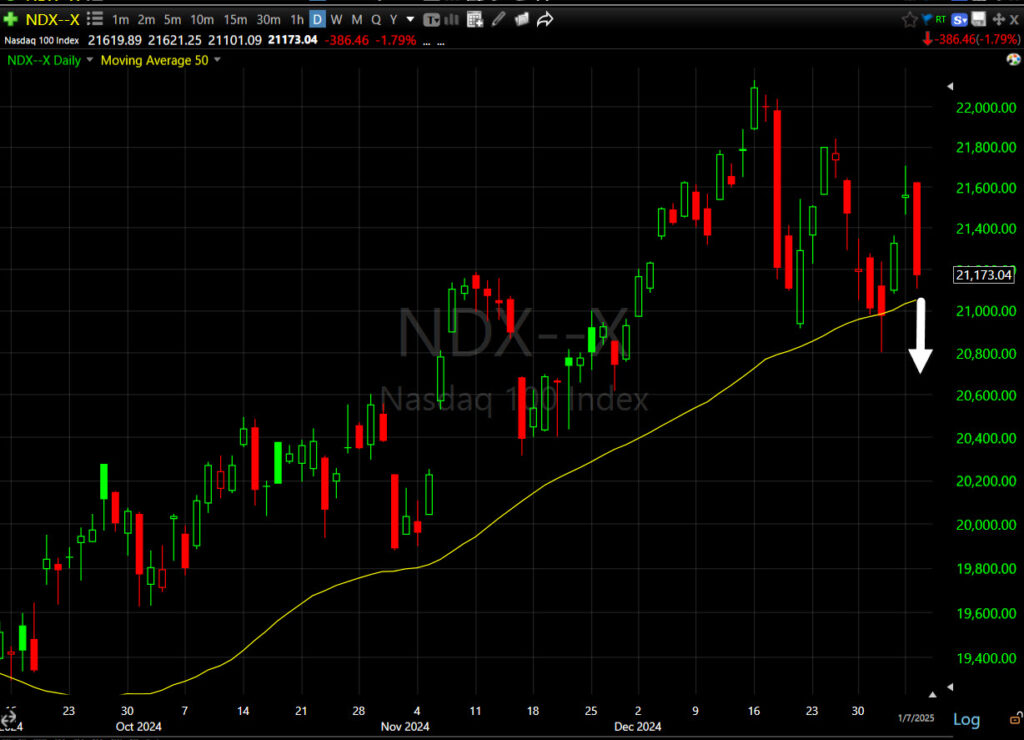 NDX (daily) w/ 50-Day SMA – Here’s an example of even a modest lower low (white). Any lower low would break the 50-day SMA.
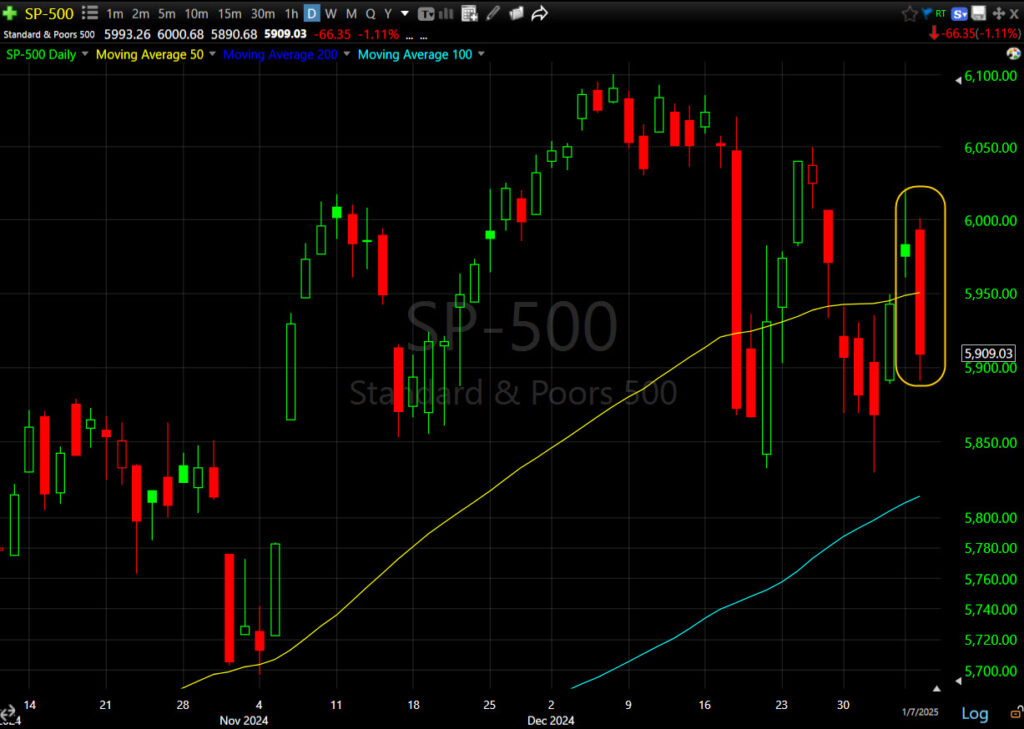
Losses in the major indices were fairly muted until the S&P 500 slid below its 50-day moving average (5,950), causing a pick-up in selling interest…
SPX (daily) w/ 50 and 100-day SMAs. Price not only broke down below the 50-day and closed near session lows, but also bearishly engulfed yesterday’s Star (loss of momentum) candle that I talked about yesterday.
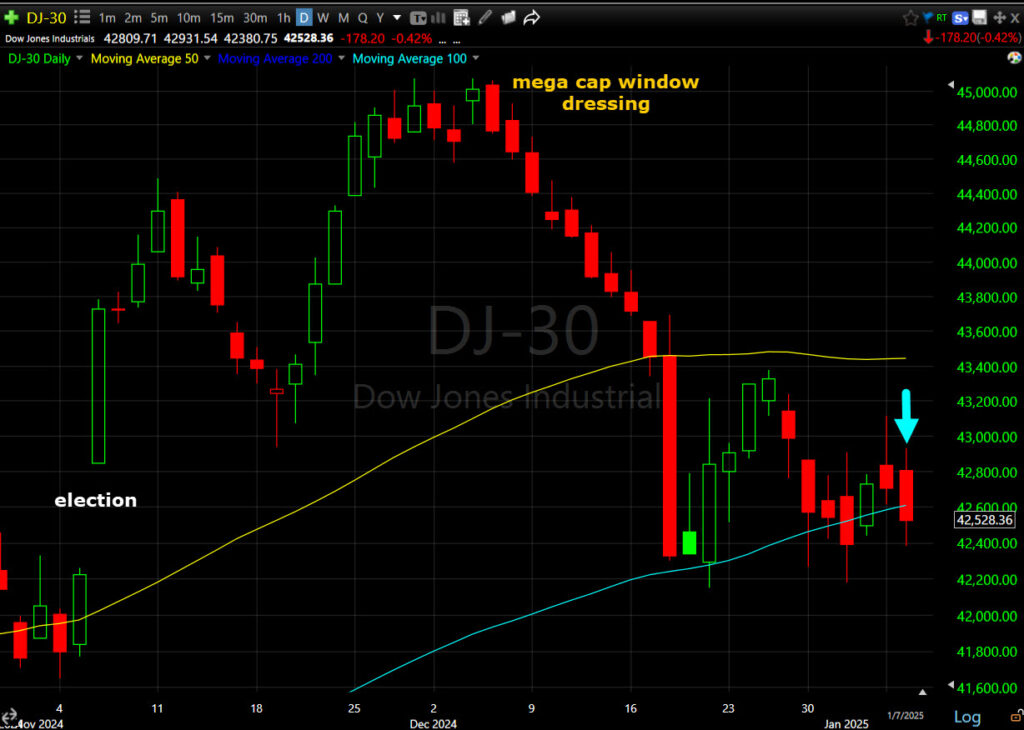 DJIA (daily) closed just under the 100-day SMA that’s been acting as technical support since December 18th.
Earlier today I wrote that it’s now becoming more probable that the averages re-test what was a small double bottom , which was enough support to give the averages a chance at a decent bounce Monday. However, since I’ve seen very little in the way of rotation in the new year, we may have to consider more ominous price action developing.
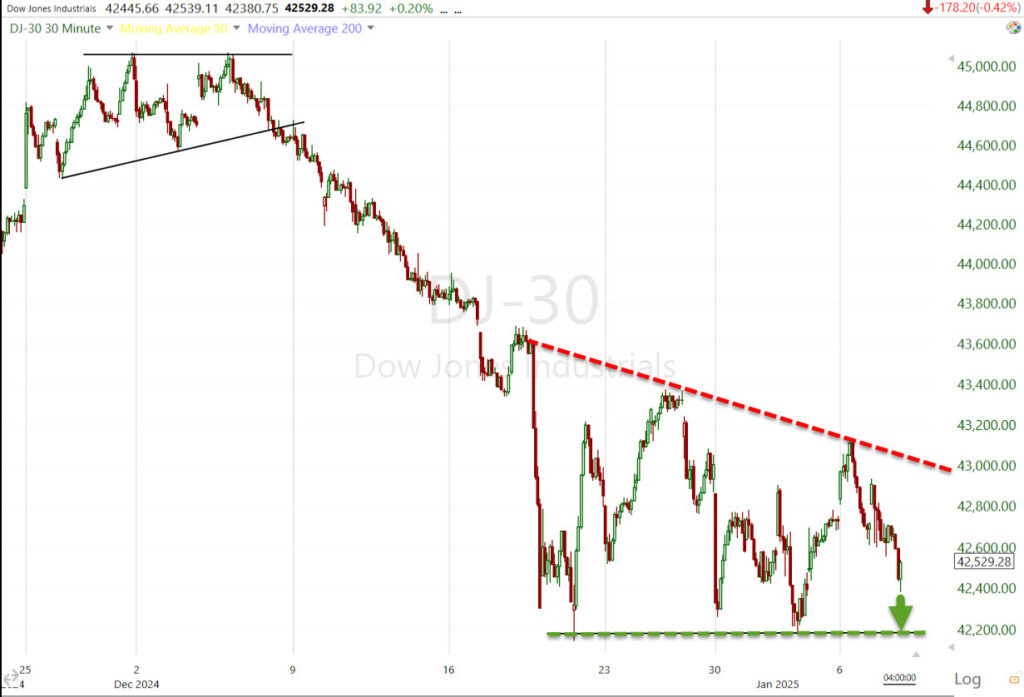 DJIA (30m) – Earlier I mentioned the re-test (green arrow) of the small double base. However, since the Dow failed to make an equal or higher high on Monday and today’s bounce, we must consider the increasing probability that this price pattern is a bearish Descending Triangle (red deashed line), which is a bearish consolidation/continuation pattern, continuing the immediate preceding trend… down.
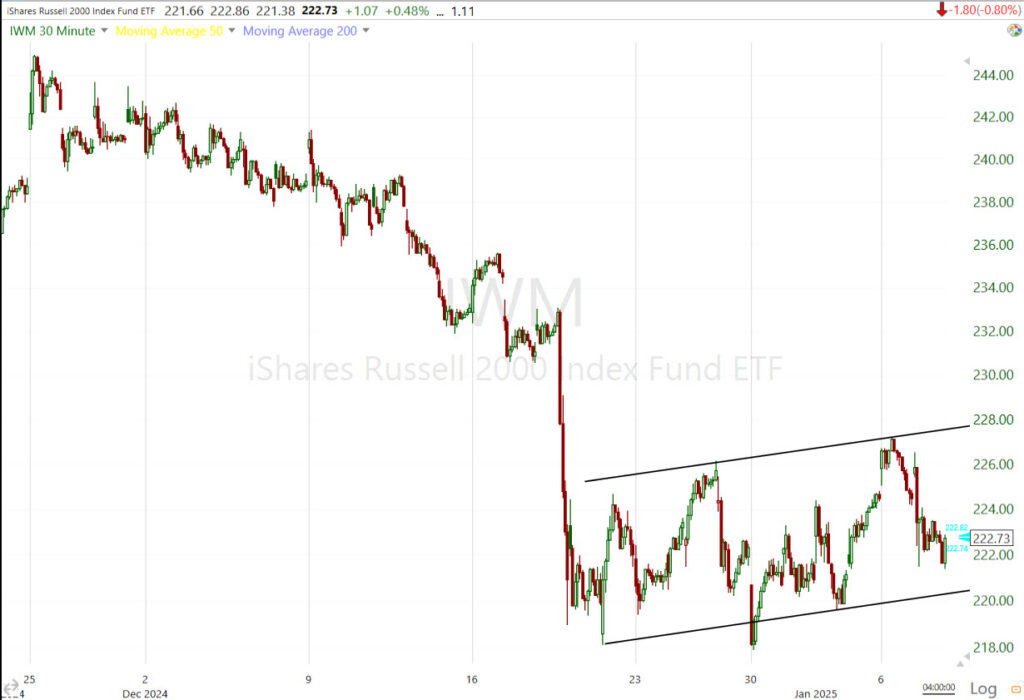
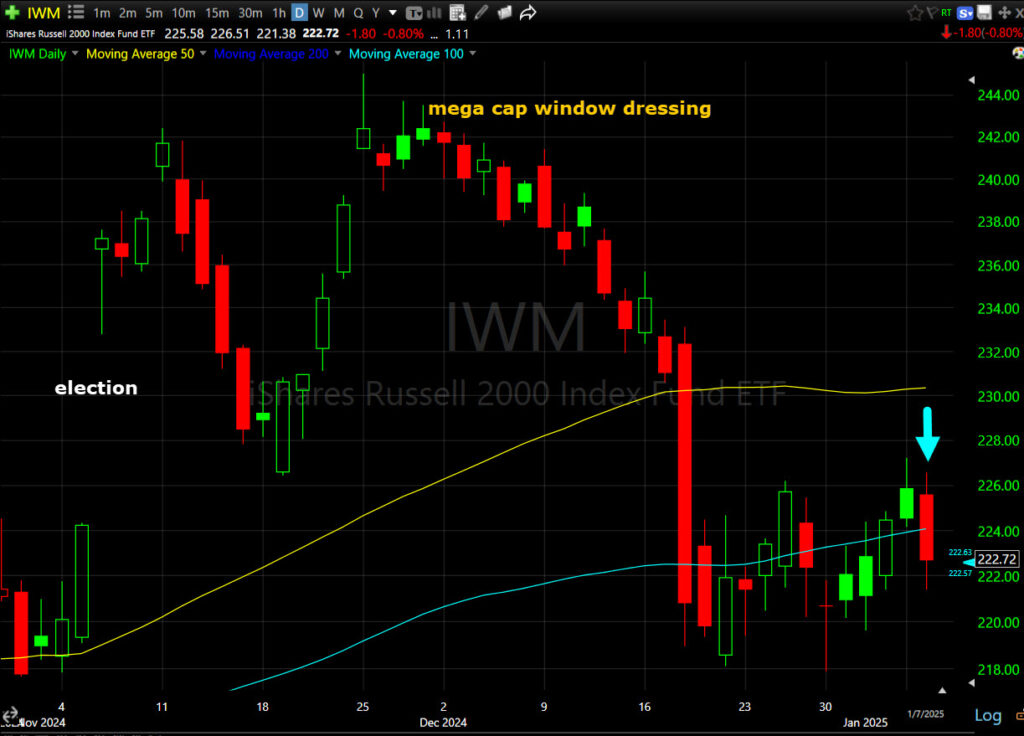 Small Cap IWM (daily) is similar to the Dow, breaking its 100-day SMA by the close. Like the Dow, the more price action we get from Small Caps, the more the picture develops. Even on a daily chart this is starting to look like a bear flag along the 100-day.
Or intraday…
IWM (30m) The measured move for a second leg down would be -6.25%. If I were seeing clear signs of improvement in 3C, I’d shy away from this interpretation, but other than Regional Banks seeing some improvement in 3C, there’s just not much there. Never torture the charts for an answer. More often than not the answer will manifest as we move forward. We’ve already seen a lot of change in tone since late last week when a bounce to start this week was becoming a high probability.
In yesterday’s Market Update, Gap Fills and Hints, I wrote,
“If the S&P just fills the gap and Tech/Mega Caps don’t have the support to take the averages higher, establishing some leadership, then the Nasdaq-100 could solidify what will be a sub-intermediate down trend with another lower high.
NDX (15m)
I think there’s a decent chance of that. One reason is how low volatility VIX (-1.85%) and VVIX (-0.75%) are. The ABI is at 31.”
VIX (+11.1%) briefly traded above $18. VVIX gained a similar +10.9%. VIX has its own seasonal dynamics with volatility historically picking up from mid-January to mid-March.
VIX has also had a recent correlation with steepening of yield curves…
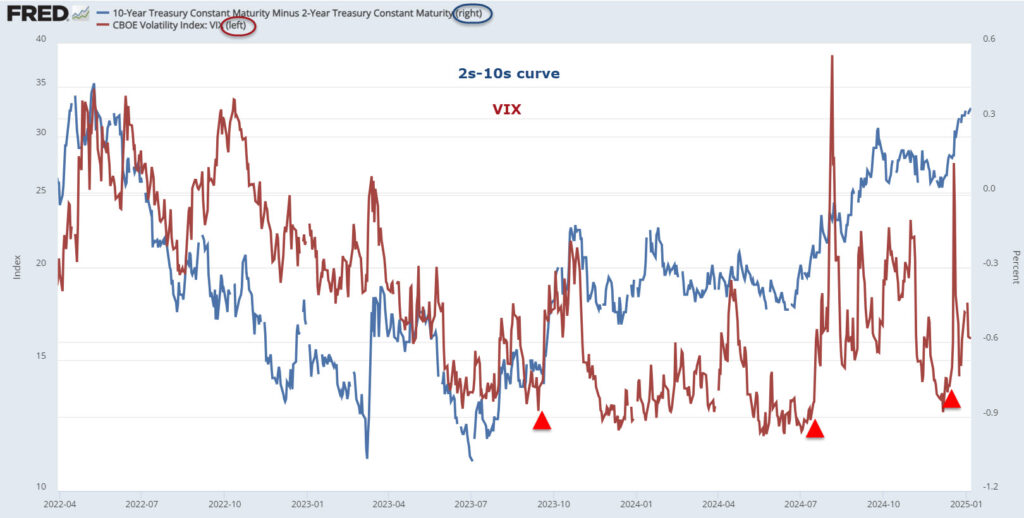 2s-10s yield curve (blue) and VIX (red).
The Absolute Breadth Index is falling quickly, ending at 22 today. My long volatility signal is triggered when ABI closes below 14.
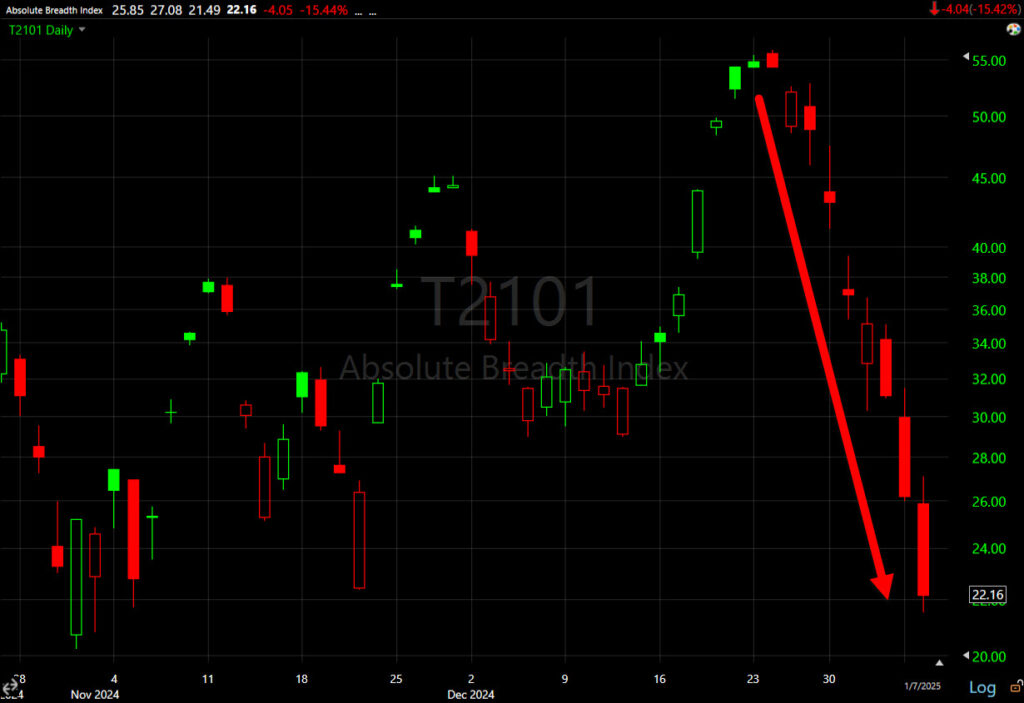 ABI (daily) – Over the years I’ve noticed that when the ABI falls fast like we’re seeing now it often precedes a sub-14 close, or signal.
S&P sectors
The only S&P 500 sectors that closed higher were Energy and Health Care. The three weakest sectors were among yesterday’s top performers – the three mega cap heavy sectors.
The mega cap growth index (MGK -2.1%) lagged the EW S&P (-0.35%) by 175 basis points, more than retracing mega caps’ 120 basis point edge from yesterday. Translation – mega caps’ price action is not indicative of leadership that many may have assumed with their better relative performance of December amid window dressing.
 SPX (2m) and my Equal Weight Index of the three mega cap heavy sectors (Tech, Discretionary and Coms). You might notice that after a strong first half of December (window dressing), the group has shown relative weakness (yellow arrows) at the top of market bounces, and has its own trend of lower highs/lower lows (red circles) like the Nasdaq-100. A lot has changed since this time a month ago.
Large losses in mega cap names had an outsized impact on index losses. Apple (AAPL -1.1%), which was downgraded to Sell from Neutral at MoffettNathanson, and Tesla (TSLA -4.1%) was downgraded to Neutral from Buy at BofA Securities. NVIDIA (NVDA -6.2%) was another influential loser after trading up as much as +2.5% at its high following Jensen Huang’s keynote address last night at the Consumer Electronics Show (CES). Nvidia’s price action seemed to be more a “Buy the rumor, Sell the news” event, leaving a massive bearish engulfing candle on heavy volume one day after making a new record high.
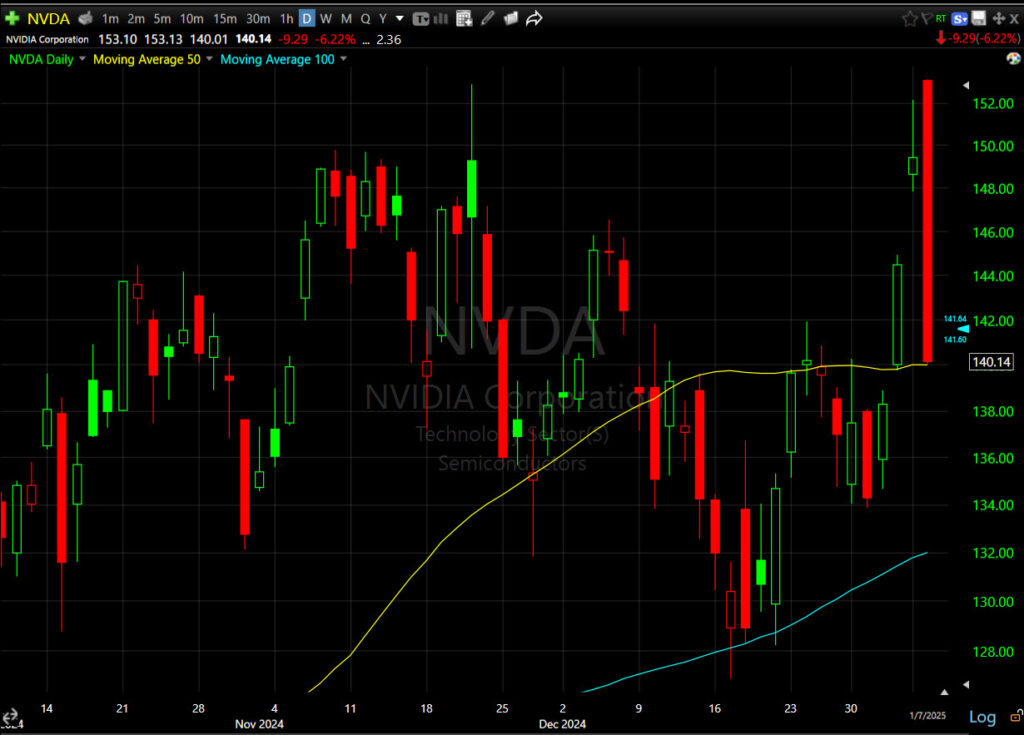 NVDA (daily) – Price did manage to close at the 50-day SMA, but also at session lows, which is never good.
Tesla (TSLA -4.05%) shares weighed down the Consumer Discretionary sector, along with the move in Amazon.com (AMZN -2.4%).
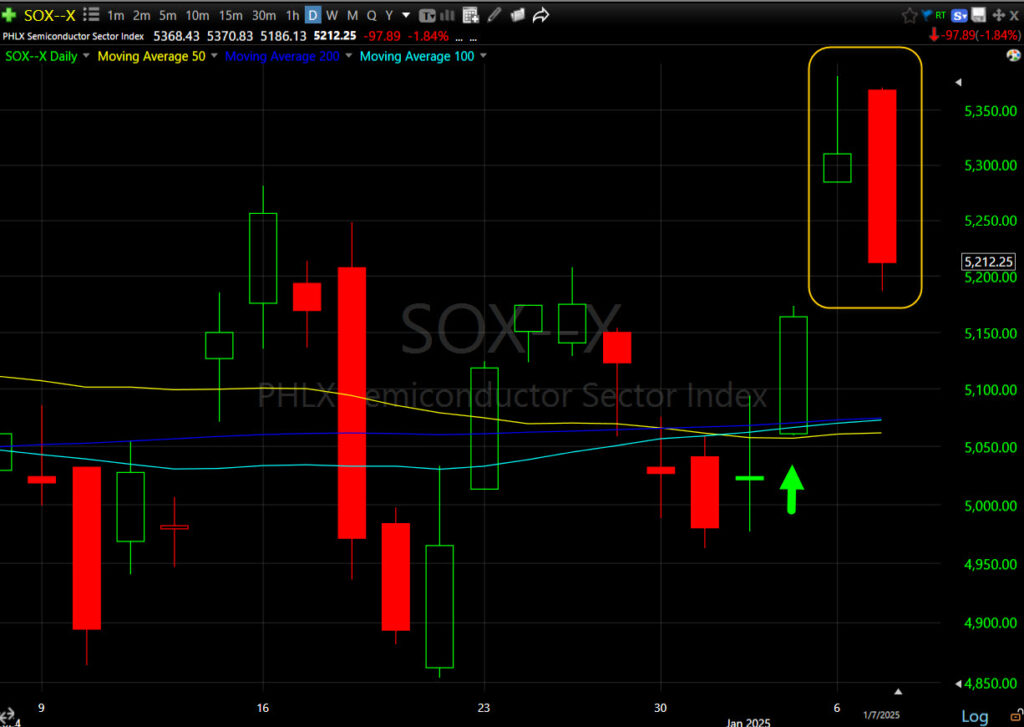
Semiconductors (SOX -1.85%) bearishly engulfed yesterday’s daily candle (bearish Shooting Star) at what’s still the right shoulder of a H&S top pattern.
Materials ⇩ -0.06 %
Energy ⇧ 1.00 %
Financials ⇩ -0.23 %
Industrial ⇩ -0.10 %
Technology ⇩ -2.01 %
Consumer Staples ⇩ -0.35 %
Utilities ⇩ -0.25 %
Health Care ⇧ 0.50 %
Consumer Discretionary ⇩ -1.94 %
Real Estate ⇩ -0.74 %
Communications ⇩ -1.11 %
The one aspect that stood out today in terms of rotation in the new year was Value style factors (-0.15%) way outperformed Growth style factors (-2%) by 185 basis points, but that is similar to the margin between mega caps and the Equal Weighted S&P at 170 basis points.
Internals
NYSE Decliners (1826) outpaced Advancers (904) by a 2-to-1 margin on decent volume of 1 bln shares.
There is no Dominant price/volume relationship and no 1-day oversold internals signal.
Treasuries
The 10-yr yield was at 4.63% ahead of the data and settled at 4.68%, seven basis points higher than yesterday. The 2-yr yield closed up +2 bp to 4.29%.
A $39 bln 10-yr note reopening didn’t help as it was met with demand that was on the softer side. The U.S. Treasury will cap this week’s note and bond auction slate with a $22 bln 30-yr bond reopening tomorrow.
Historically speaking, stocks tend to struggle when yields rise by 2 standard deviations (or more) in a month. In today’s terms, that’s 60 basis points for the 10-yr yield and exactly what we’ve seen over the last month. We already have a wide divergence between yields and stocks that has up until this week, been largely ignored by investors with more pressing matters for fund managers like protecting YTD gains for 2024 and year-end window dressing.
The divergence is still there and quite wide…
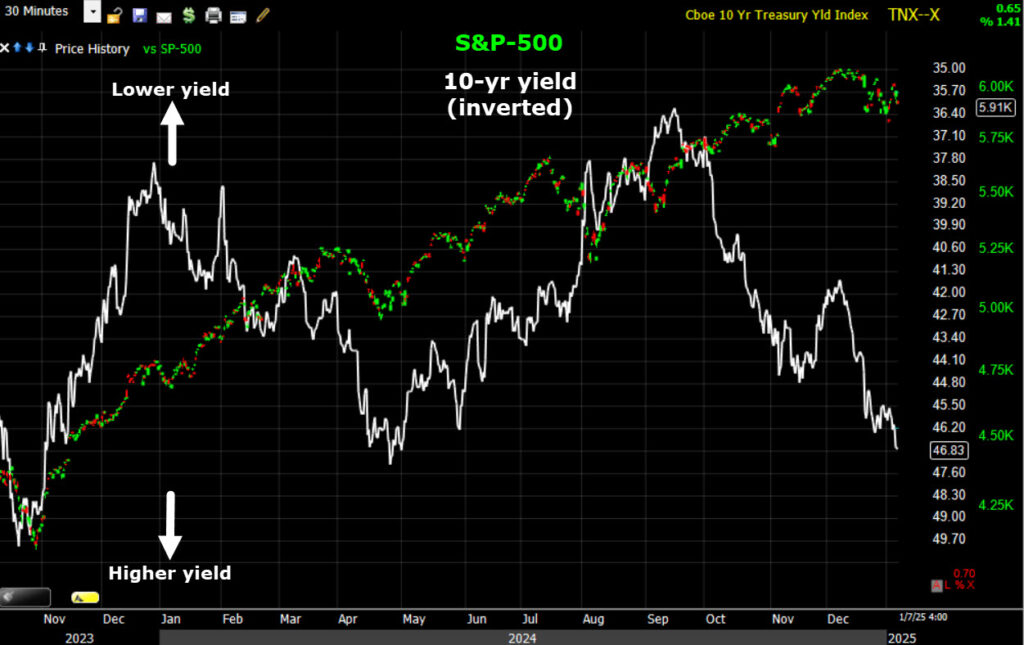 SPX (10m) and 10-yr yield (inverted) – The higher yields move, the more pressure they put on equity valuations. A perfect example was 2022’s bear market, as the Fed hiked rates, that hit the richly valued mega caps the most. It seemed as if no one wanted to own mega caps for most of 2022, or what I call, “The most hated group of stocks.” And today they got hit as yields broke out higher.
We can already see that SPX multiples moved lower as the 10-yr crossed above 4.50%.
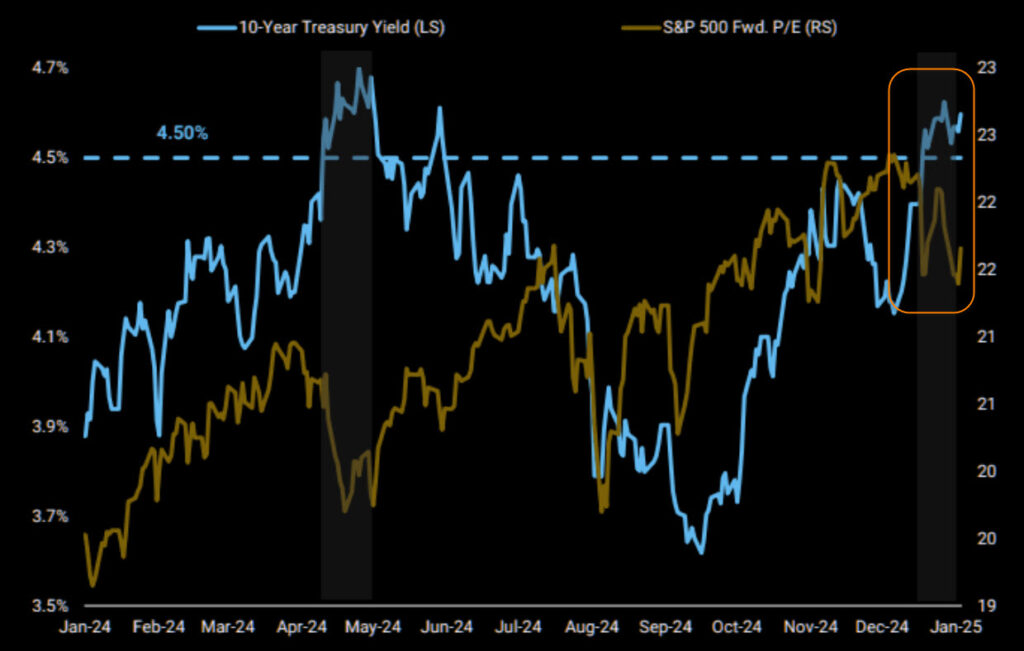 10-yr yield (blue) and S&P forward P/E (brown)
Currencies and Commodities
The U.S. Dollar Index retraced some of yesterday’s losses after this morning’s hot 10 a.m. data sent it higher to close up +0.35%.
WTI Crude oil closed up +1.35% to $74.42/bbl. It’s still early, but price seems to be consolidating around $74 and a key down trend line as would be a reasonable expectation.
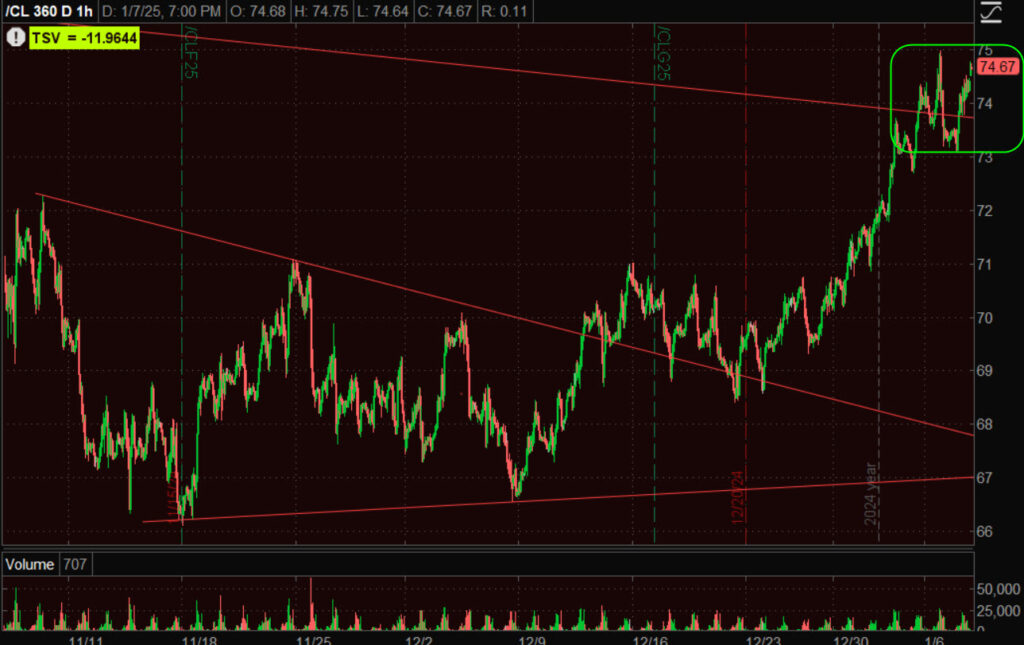 (60m) – So far, so good for WTI’s price action. I see no problems there. Further gains in oil will increase inflationary pressures and likely pull yields higher. As we saw today, stocks don’t like that.
Gold futures settled +0.7% higher to $2,665.40/oz, easing back slightly from earlier gains as price tested the 50-day SMA from below and found resistance there.
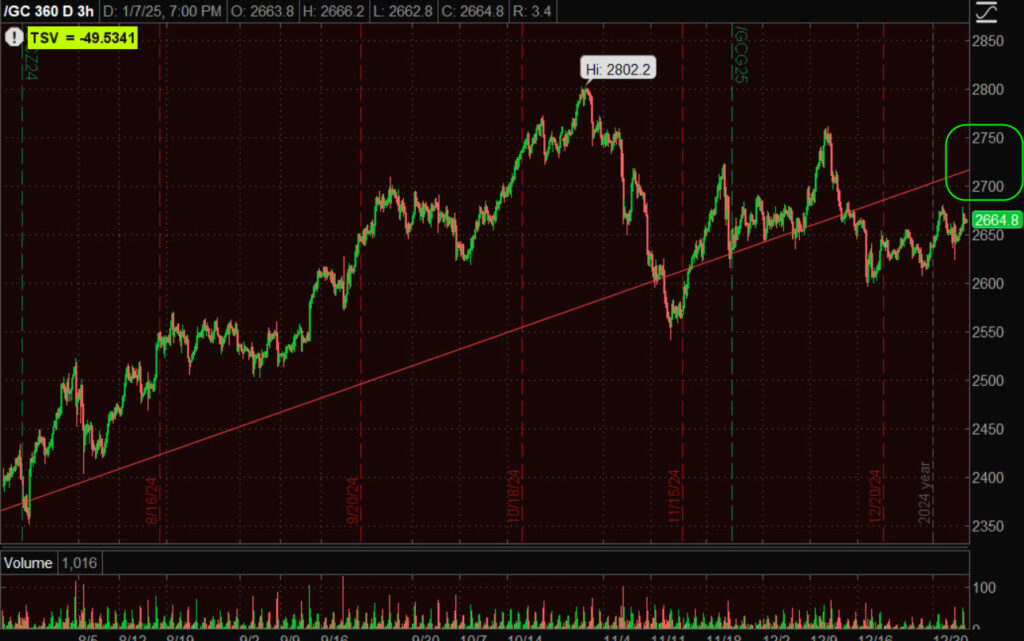 (3H) Gold still has work to do, at least getting above $2700 and now the trend line higher near $2720.
If we clean up futures price action and use GLD instead, a large symmetrical triangle is forming.
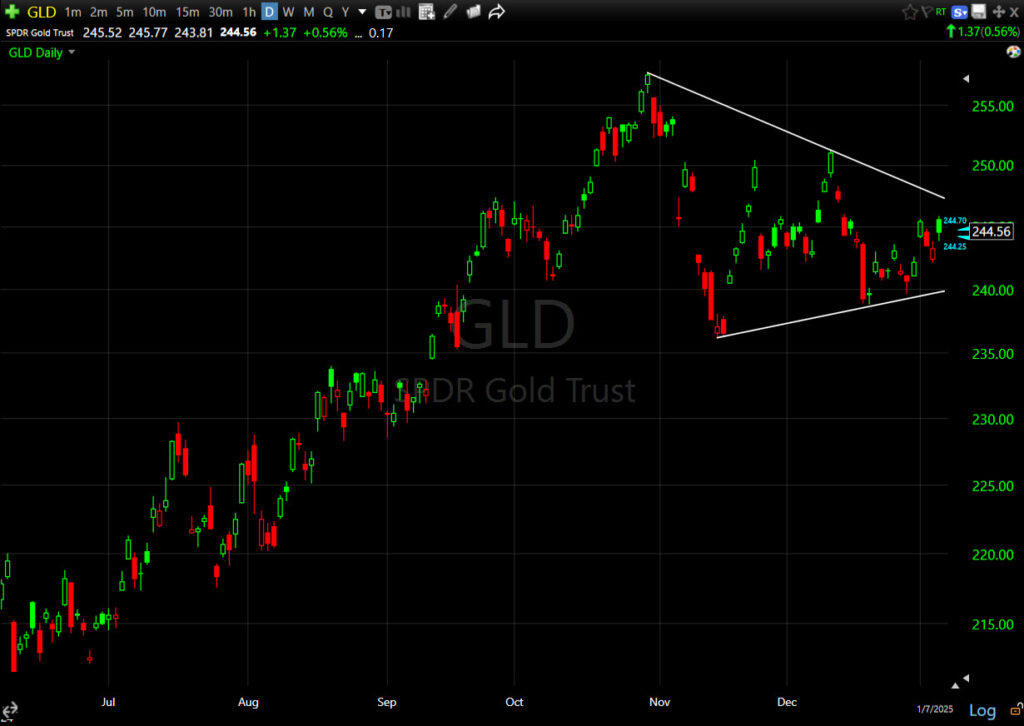 GLD (daily) – By the book, a symmetrical triangle has no inherent bias like a flag or ascending/descending triangle. The consolidation depends on the preceding trend for its bias, which was up. From years of observation, I’ve found that large symmetrical triangles have just as good of a chance of acting as a top. I still have high hopes for gold this year, but I don’t like this large triangle, unless of course, price breaks out definitively.
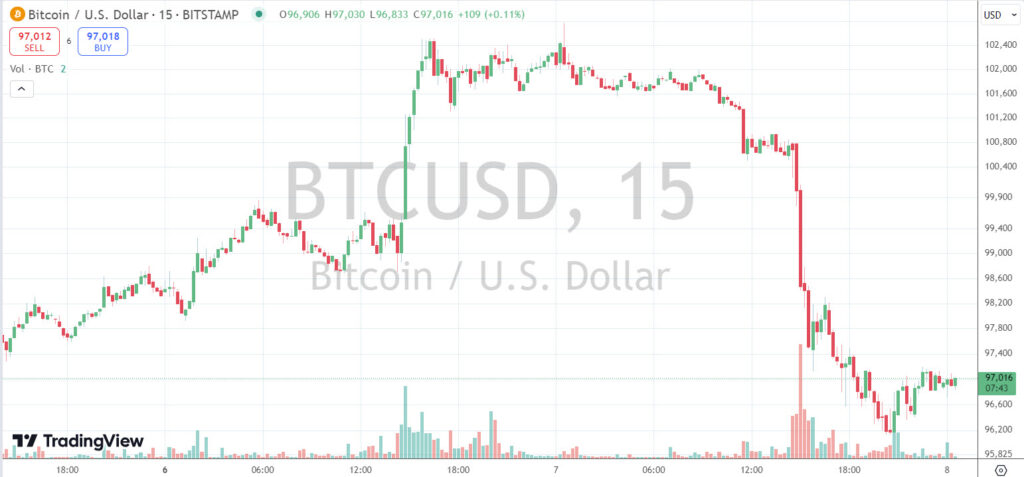
Bitcoin’s outperformance was short lived as the crypto came down with Tech, and seemingly more specifically, with Nvidia. Bitcoin went from 102,760 earlier, to $96,946 for its worst day in 4 months.
BTC (15m)
Summary
The day can be summed up with the title of my first cash market post, Surging Yields Smack Small and Mega Caps. I anticipated seeing some rotation in the first week or so of January and my gut feeling was that cyclicals, value style factors and Small/Mid Cap stocks would be the likely benficiary. Instead, it seems more like the mega caps that led 2024 gains, are seeing selling above and beyond the opportunistic profit taking observed since this summer.
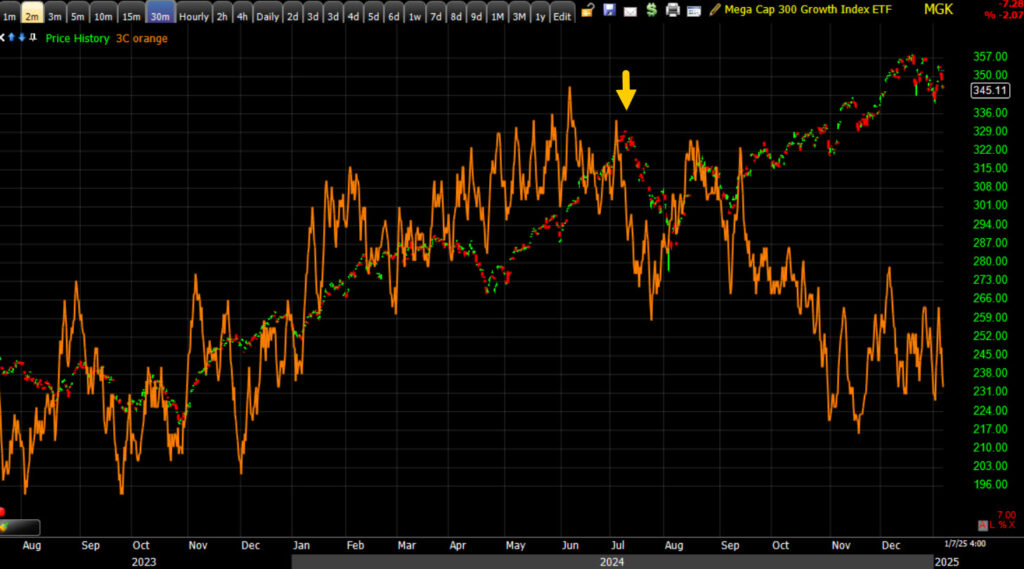 MGK/Mega Cap Growth Index (30m) – Since the Tech meltdown in July, the underlying support for mega caps (via 3C) hasn’t been the same. In doing research, I saw a chart o investors’ allocation to mega caps (much lighter than normal) and it looked nearly the same as 3C does relative to price. That’s two very different sources of information with the same message.
Certainly January’s tone in mega caps is not at all reminiscent of the first half of December’s tone that was only interrupted by the hawkish December FOMC rate cut. I’m curious if this was pre-planned, as in part of portfolio rebalancing, or if it’s in reaction to higher yields. In today’s case, the answer is easily, “Higher Yields.”
On the rates front, I don’t think it’s worth the time to speculate above and beyond about what Trump will do, when he’ll do it, if he can get his agenda through Congress, and then the second order effects. What may be a simulative growth policy that typically helps the economy, could very well exacerbate inflation, send rates higher and tie the Fed’s hands to do anything about it. If the same policy was passed a year later, with the assumption that the renewed inflationary impulse from September, ended and moved back to disinflation, the exact same policy could have vastly different, more supportive effects. When I think about Trump’s policy agenda, there are a lot of potential clashes between policies, and then there’s the economy’s timing and Washington D.C.’s timing. I think for many policies to work best, the two will have to align and in the former’s case, that’s on its own course. It couldn’t be changed any easier than trying to turn a ULCC or Ultra large crude carrier, with an oar.
As I’ve been saying almost every week for 2 years, even if you have no interest in trading crude oil, keep a very close eye on prices. They’re going to lead yields and if the 10-yr yield (at 4.68%) hits 5%, I think we can call that game over for the equity rally. Rates are the most important variable to watch in early 2025.
In the meantime, I’m still hopeful that 3C will show us some rotation into leadership stocks, or more notable distribution elsewhere. Tonight mega caps seem like a price target, but just look at the change from yesterday with mega caps outperforming by a massive 120 basis points, and today with them underperforming by a staggering 170 basis points. Near term, keep an eye out for those tests in the averages toward the December FOMC low. They’re important. Especially for Tech and the Nasdaq-100.
2025 is already shaping up to be a more interesting year, likely filled with far more trading opportunities.
Overnight
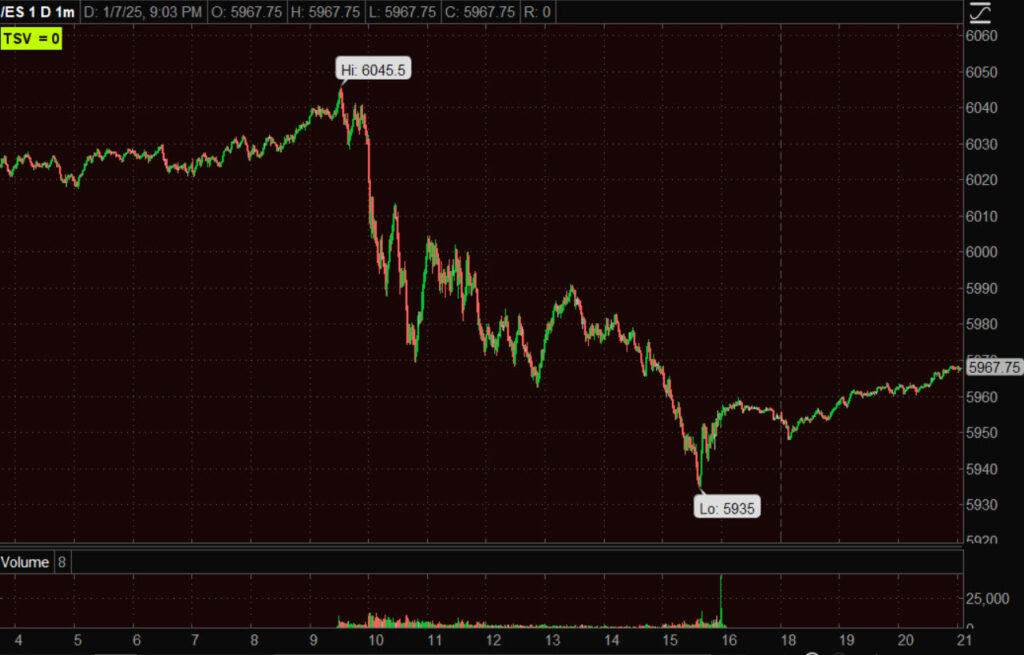
S&P futures are futures +0.2% in what is thus far a bearish consolidation of cash session losses.
The Dollar Index is nearly flat (-0.05%).
WTI Crude Oil futures are up +0.4% to $74.70/bbl.
Gold futures are little changed (-0.05%).
Bitcoin is little changed (-0.05%) at $96,900
Yields are down 1 basis point.
Looking ahead, market participants receive the following economic data on Wednesday:
- 7:00 ET: Weekly MBA Mortgage Index (prior -21.9%)
- 8:15 ET: December ADP Employment Change (prior 146,000)
- 8:30 ET: Weekly Initial Claims (prior 211,000) and Continuing Claims (prior 1.844 mln)
- 10:00 ET: November Wholesale Inventories (prior 0.2%)
- 10:30 ET: Weekly crude oil inventories (prior -1.18 mln)
- 12:00 ET: Weekly natural gas inventories (prior -116 bcf)
- 14:00 ET: December FOMC Minutes
- 15:00 ET: November Consumer Credit (prior $19.2 bln)


