Daily Wrap – 11 Points Off Low End of SPX’s Measured Move
Other than another day of 1-day oversold internals and the market acting consistently with that, today was a great example of rumors and news driving investors. Like recent sessions, headlines around US trade policy engrossed the equity market. Tariffs kicked off at the start of the month. Today Commerce Secretary Lutnick told CNBC that all USMCA compliant goods and services will be exempt from new tariffs for one month, but only mentioned Mexico, not Canada. Later the President Trump paused tariffs on both Mexico and Canada for 30 days, for goods covered under USMCA.
Around 62% of Canadian goods and around 50% of Mexican goods are still subject to the tariffs and goods that are exempt will face tariffs again starting April 2. Trump decided to pull back the tariffs after speaking to Mexican President Claudia Sheinbaum, Canadian Prime Minister Justin Trudeau and auto company executives.
Fallout in mega caps and chipmakers also impacted the equity market today, reflecting ongoing unwinding of momentum trades, likely in some part, CTA driven.
The S&P did hold its 2000-day, and 3C did show a response to the tariff news, but for those of you who have seen the kind of divergences that jump off the chart and point to a high probability event, I think you’ll agree that we’re not seeing that today…
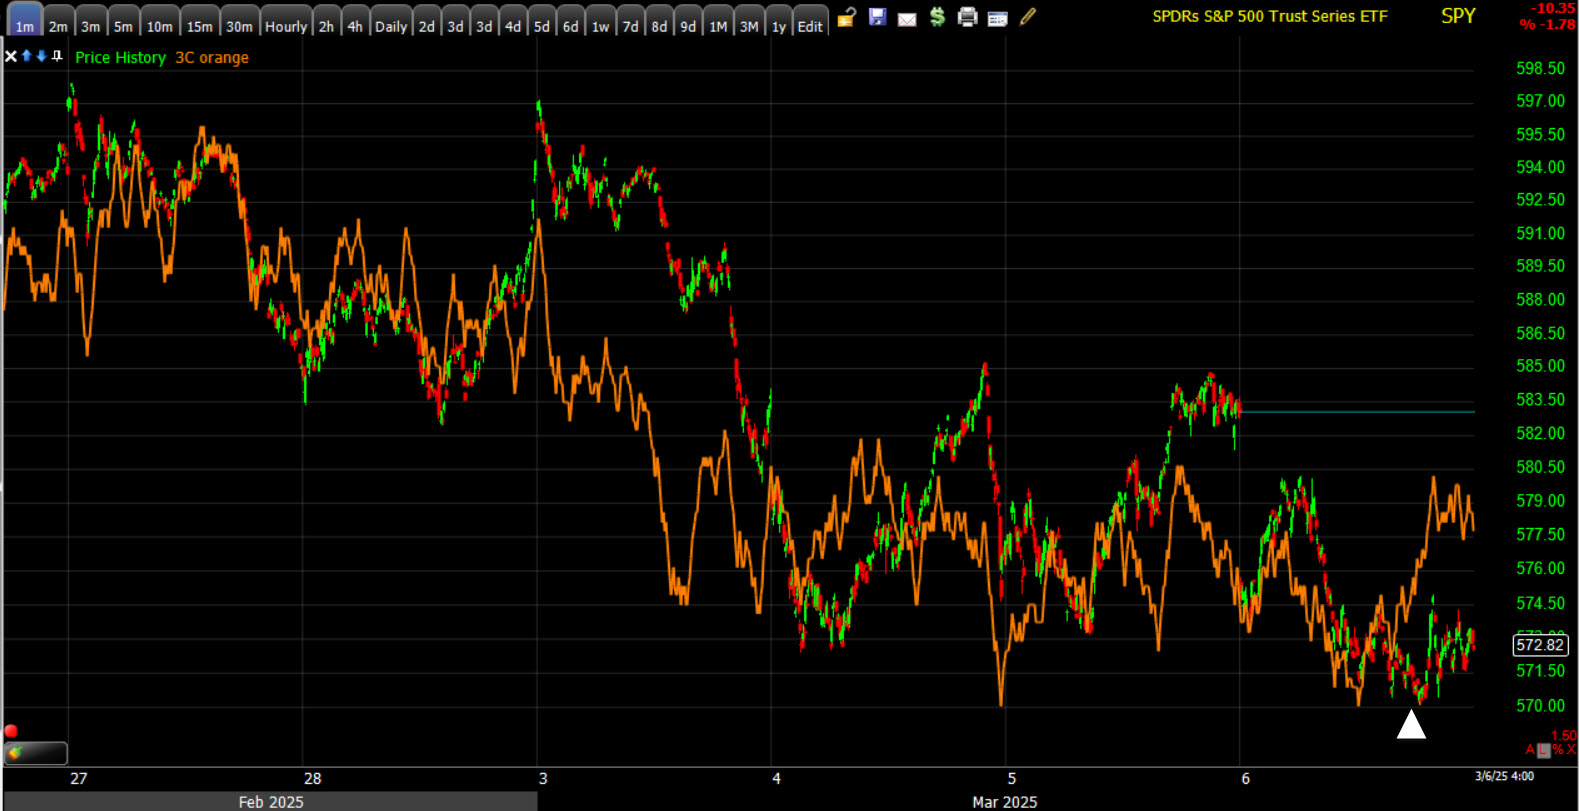 SPY (1m) – When they show up, there’s no second guessing them or what you’re seeing. They stand out like a sore thumb. Today was not that.
It’s not just the U.S. facing tectonic shifts in policy. We just saw Germany, a country that’s been among the most fiscally responsible as they’ve been haunted by hyperinflation of the Weimar Republic nearly a century ago, have a “Whatever it takes” moment, allocating nearly a trillion dollars to infrastructure and defense.
Deutsche Bank’s, Jim Reed, described Germany’s fiscal policy shift as, “a once-in-a-generation policy regime shift,”
Bloomberg’s, John Authers, wrote, “this is the biggest turning point for German economic policy at least since reunification, and possibly much longer.
A few months ago the Euro area wasn’t exactly attractive as an investment from a growth standpoint. Now, there’s objective evidence that gives us reason to ask who really may benefit from tariffs and the new U.S. administration’s policies in a weird sort of way?
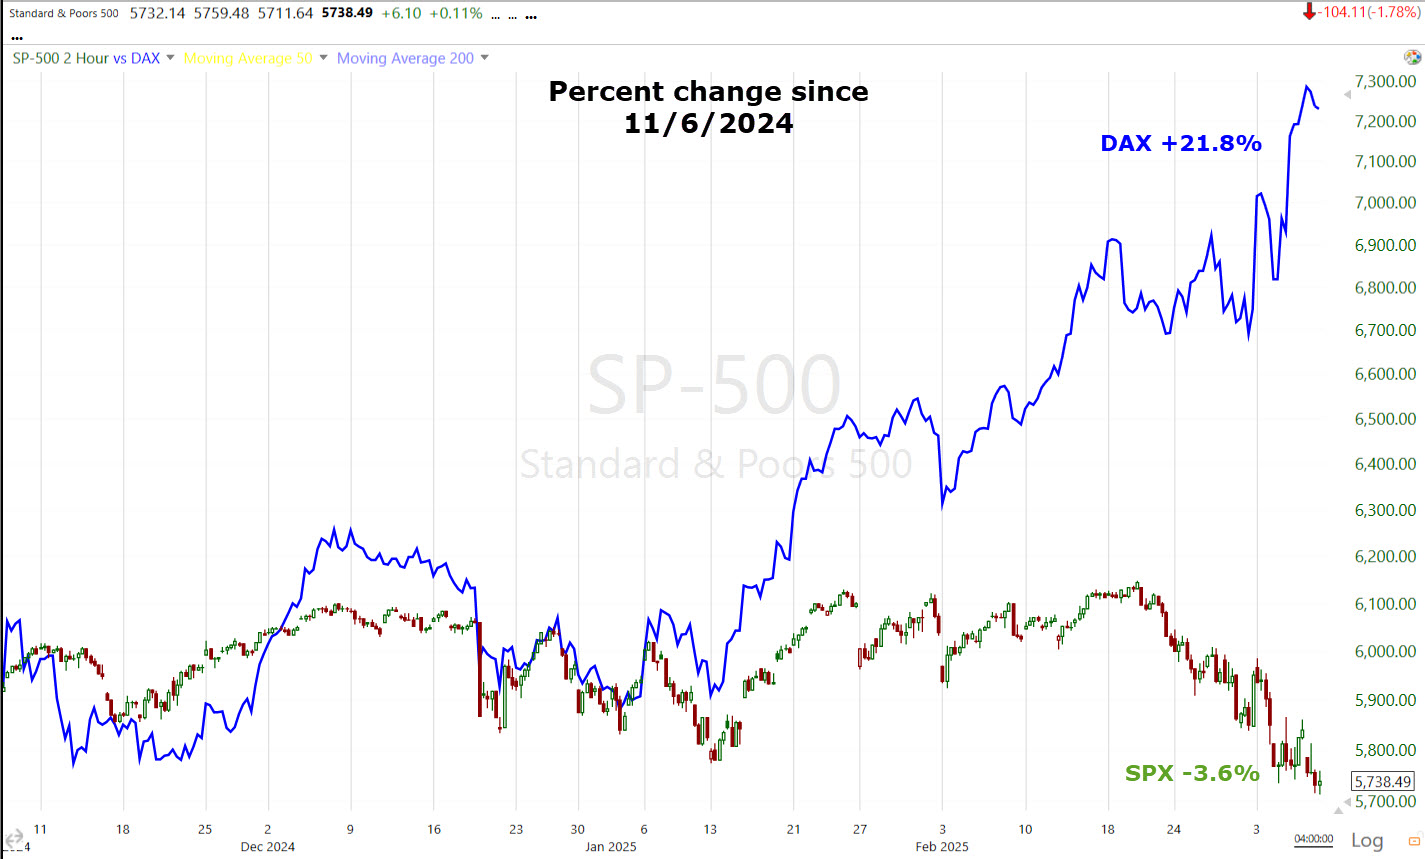 SP-500 (2H) and the DAX ETF, tracking Germany’s DAX Index (normalized) with percent changes from November 6th, 2024’s close.
Then there’s China, adding +7.6% to its defense budget and making clear that there’s additional room to ease. My, and many others’ view has been that China will wait out the shape and scope of tariffs before unleashing a fiscal bazooka. The global political and economic landscape is shifting in ways that haven’t been seen in decades, and in some cases in more than a generation. Yep, it’s going to be an interesting year.
The market “should be entering a seasonally better period next week after coming out of the last 2 weeks of February, which are seasonally the second weakest 2 week period of the year. The last 3 weeks have been the worst 3 week period since the bear market in September 2022.
Economic data…
- January Trade Balance -$131.4 bln (consensus -$93.5 bln); Prior was revised to -$98.1 bln from -$98.4 bln. The key takeaway from the report is that front-running expected tariff actions drove the huge increase in imports, which will be a drag on Q1 GDP forecasts.
- Weekly Initial Claims 221K (consensus 234k); Prior 242K, Weekly Continuing Claims 1.897 mln; Prior was revised to 1.855 mln from 1.862 mln. The takeaway from the report is that the reduced level of initial claims will temper concerns for the time being about the labor market showing more pronounced signs of weakening, although tomorrow morning’s Payrolls report will be a more definitive measure.
- Q4 Productivity-Rev. 1.5% (consensus 1.2%); Prior 1.2%, Q4 Unit Labor Costs – Rev. 2.2% (consensus 3.0%); Prior 3.0%. The takeaway from the report is that both components had the right skew for market sentiment in that productivity was higher than previously reported while unit labor costs (an inflation gauge) were lower than previously reported, aided by the improved productivity.
- January Wholesale Inventories 0.8% (consensus 0.7%); Prior was revised to -0.4% from -0.5%
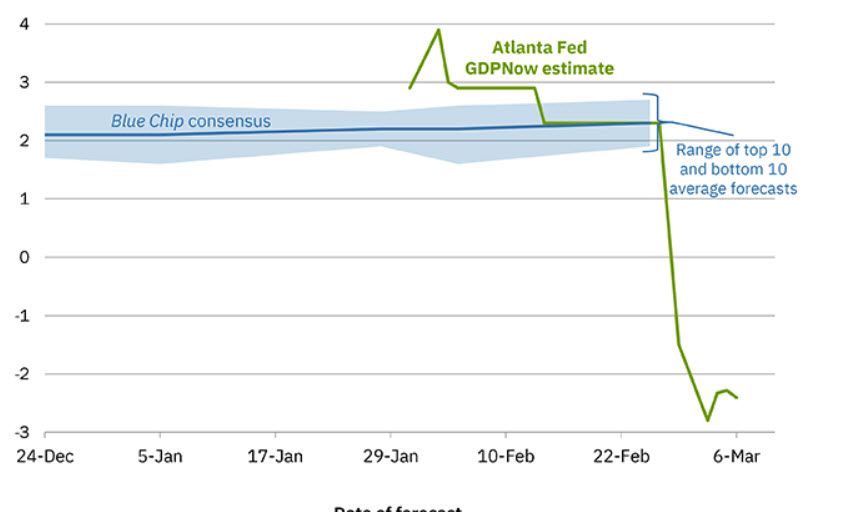
The Atlanta Fed’s GDPNow Q1/2025 model moderated from -2.8% GDP to -2.4% GDP with today’s update.
Averages
The S&P 500 briefly dropped below its 200-day moving average (5,730), reaching 5,711 at its session low, or 11 points from the low end of the measured move ($5700). The index managed to close just above that key technical level, while the Nasdaq Composite (-2.6%) and Russell 2000 (-1.6%) dropped further below their respective 200-day moving averages. The Nasaq-100 opened at its 200-day SMA and closed -1% below it with the worst performance as Tech came under renewed selling pressure.
S&P-500 ⇩ -1.78 %
NASDAQ ⇩ -2.79 %
DOW JONES ⇩ -1.00 %
RUSSELL 2000 ⇩ -1.63 %
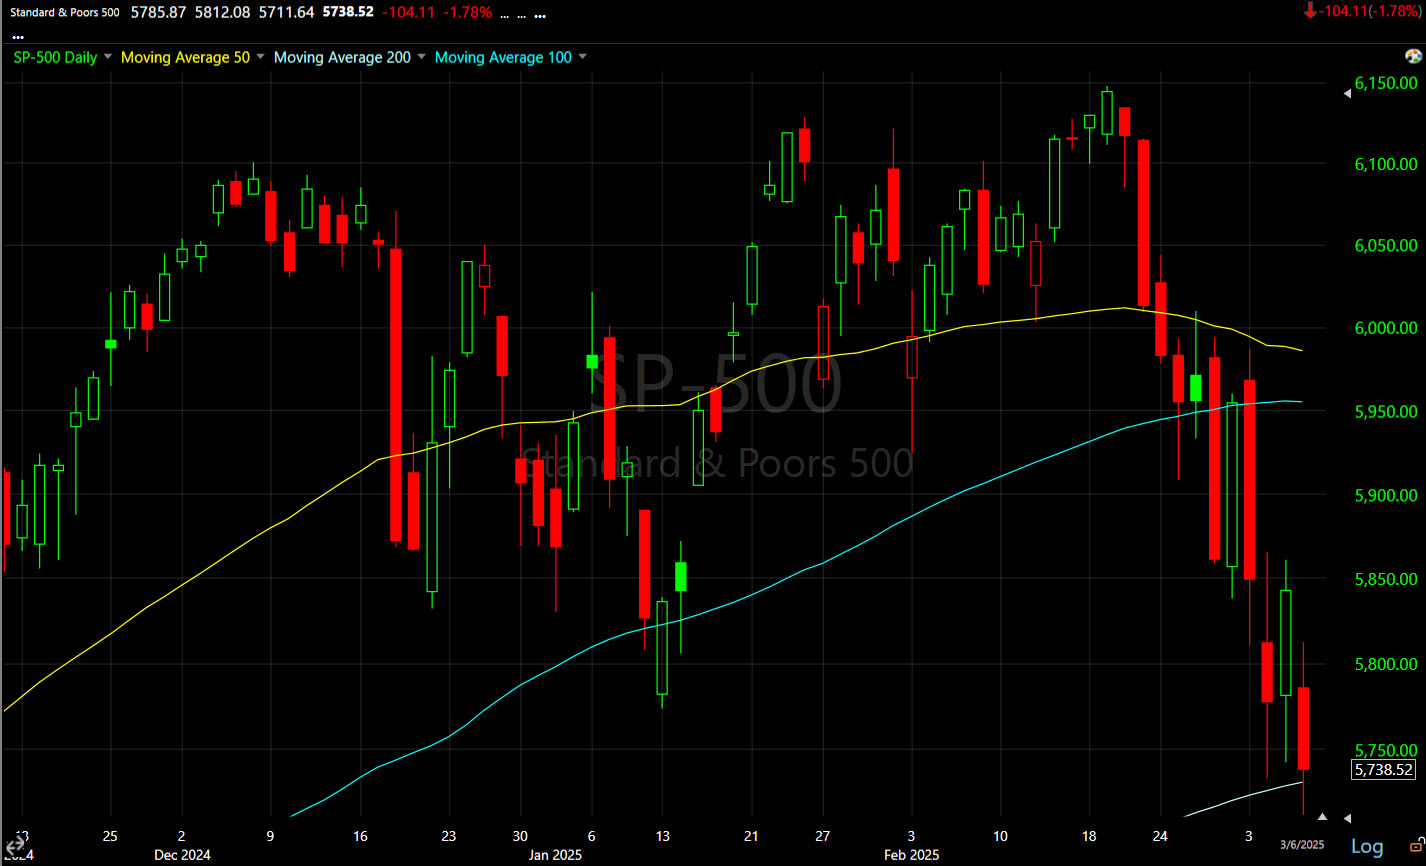 SPX (daily) just holding its 200-day.
Nasdaq-100…
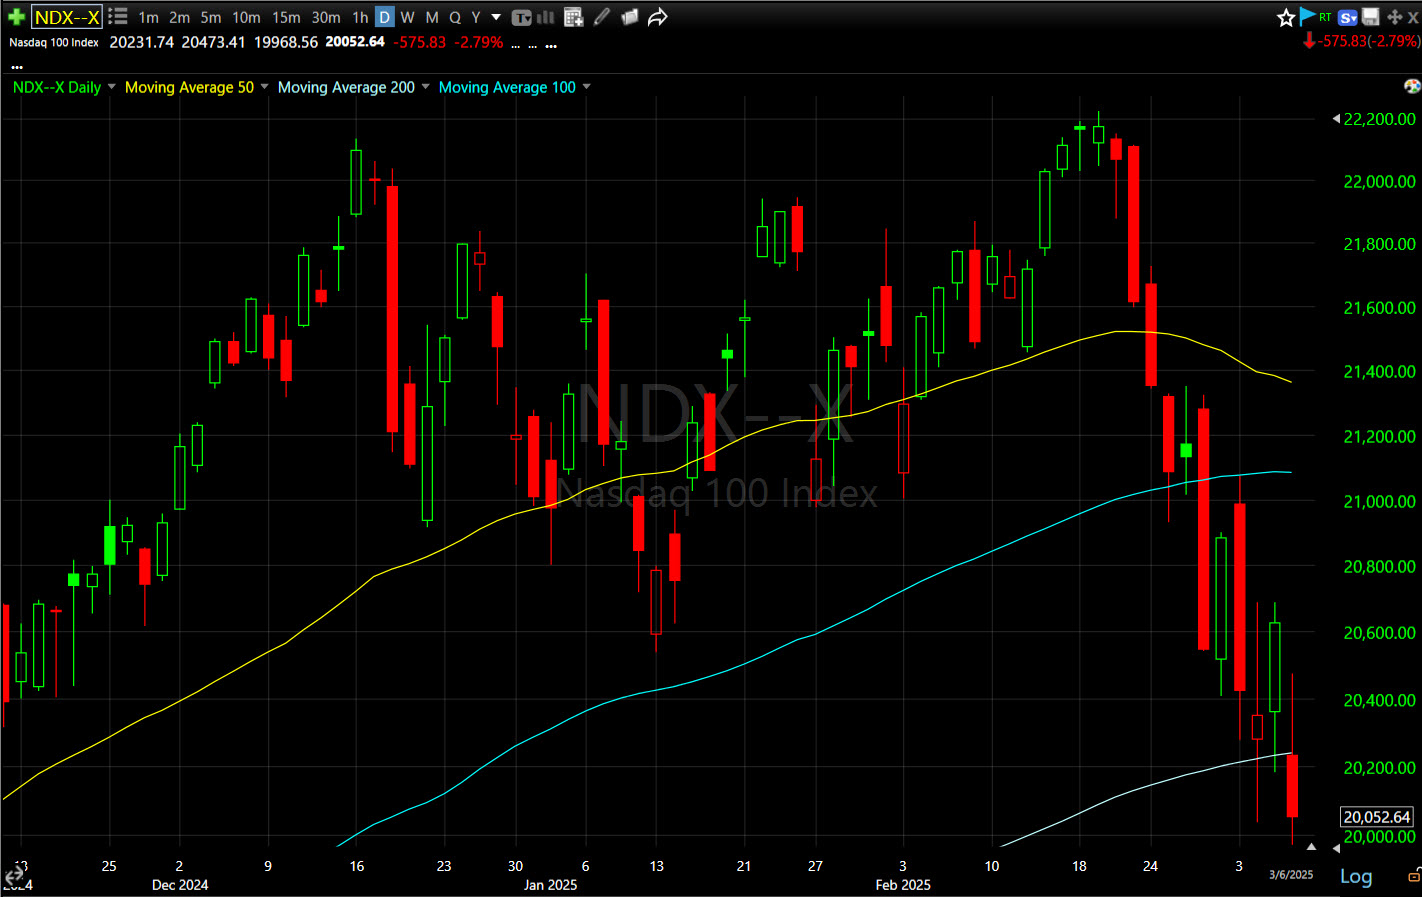 NDX (daily) – Just below its 200-day.
The Dow is holding up near $42,400…
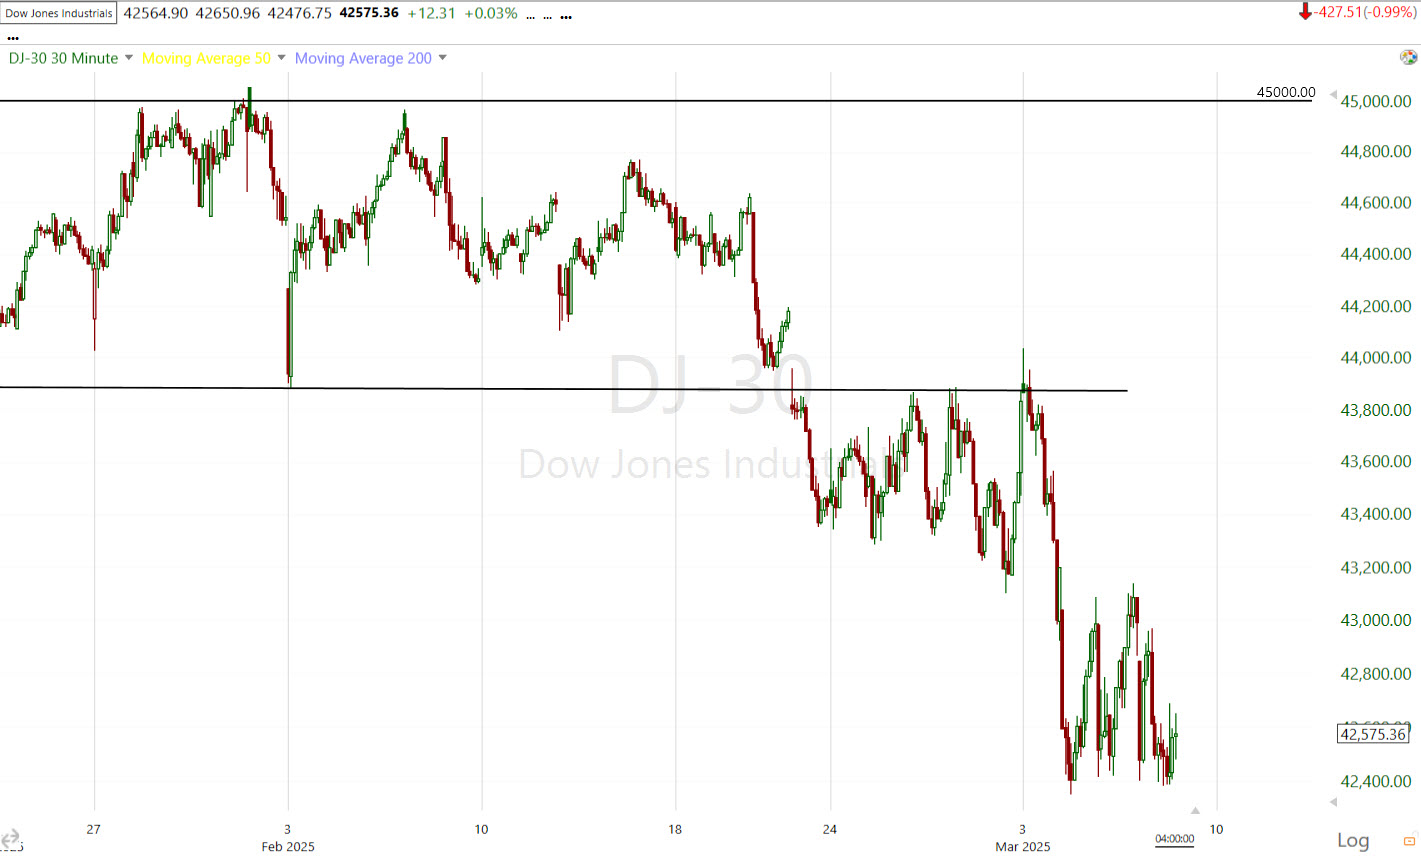 DJIA (30m) – This is a rectangle at best, an has a bearish bias due the preceding trend, but it is the least bearish of the consolidations,
There is no evidence has emerged yet that this is anything more than another bearishly biased consolidation.
 DIA (3m) 3C.
Small Caps are in a similar boat as price consolidates bearishly within a short-term down trend…
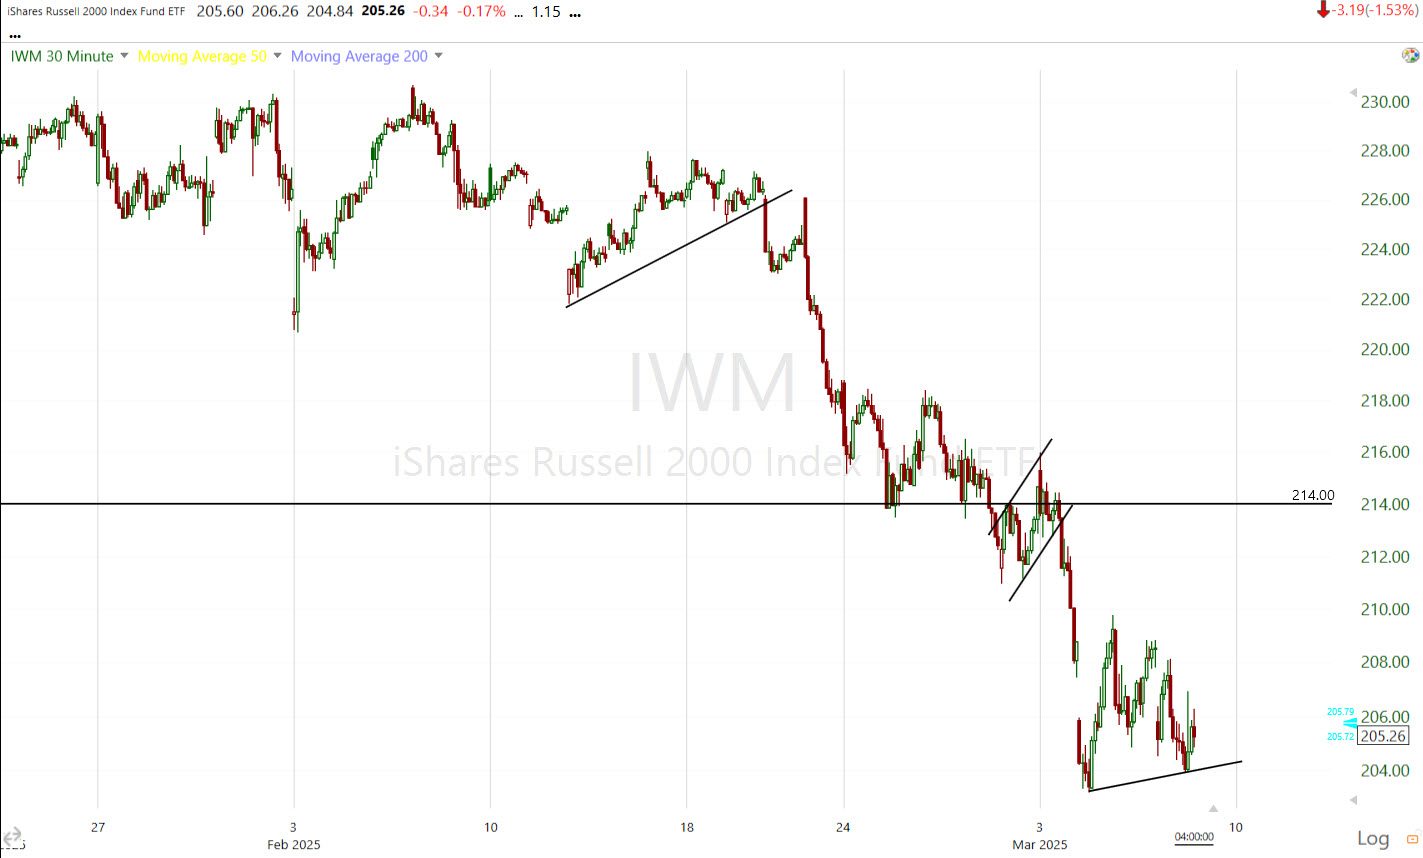
IWM (30m)
Other than a day or two of some short covering that appears to be profit taking along the same lines of 3C charts in leveraged short ETFs, there hasn’t been any notable short covering in my Most Shorted index.
VIX (+13.4%) is acting fairly normally for the day closing at its highest since the spike in August of 2024. There’s a little relative weakness, some of that was pared back this afternoon. The rise has been orderly, now up 68% on a closing basis since our first ABI signal. It’s acting as it should given the ABI signals, it’s just not seeing the kind of insanity we saw in volatility in July, as brief as it was. I don’t see a high probability signal in VIX’s relative performance that we’re at an imminent market pivot. Rather, the environment has been one of steady deleveraging of risk assets an fairly orderly.
VVIX (+10.2%) does display a little more relative weakness since Tuesday’s market low.
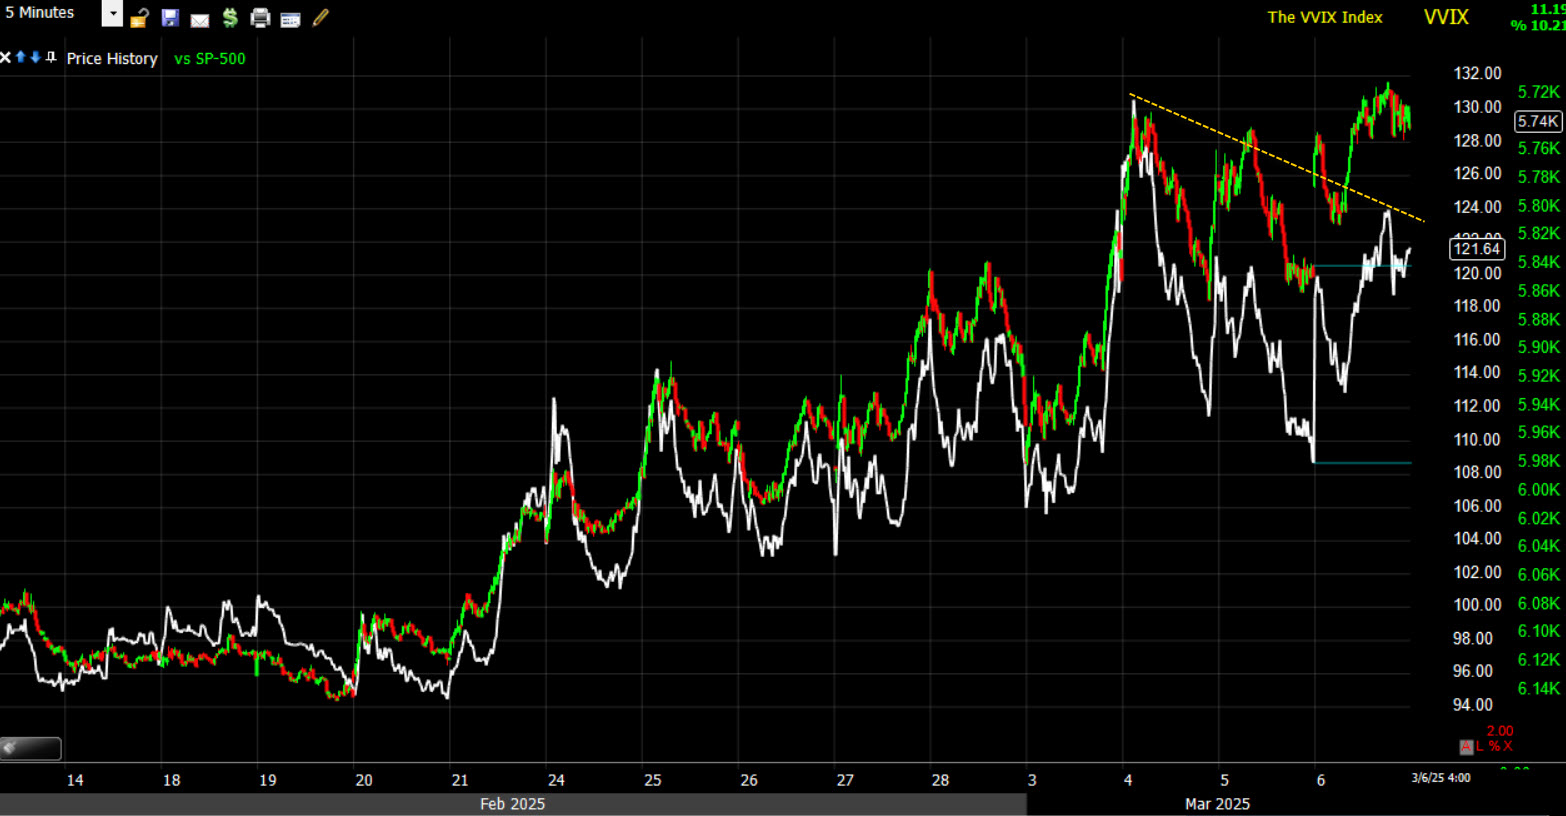 SPX inverted for context (5m) and VVIX (white). I’d think VVIX is in the process of giving a signal, but we typically see it bleed over to VIX first before the stock market makes a major pivot.
Volatility’s Term Structure remains at the same level of backwardation as poste earlier.
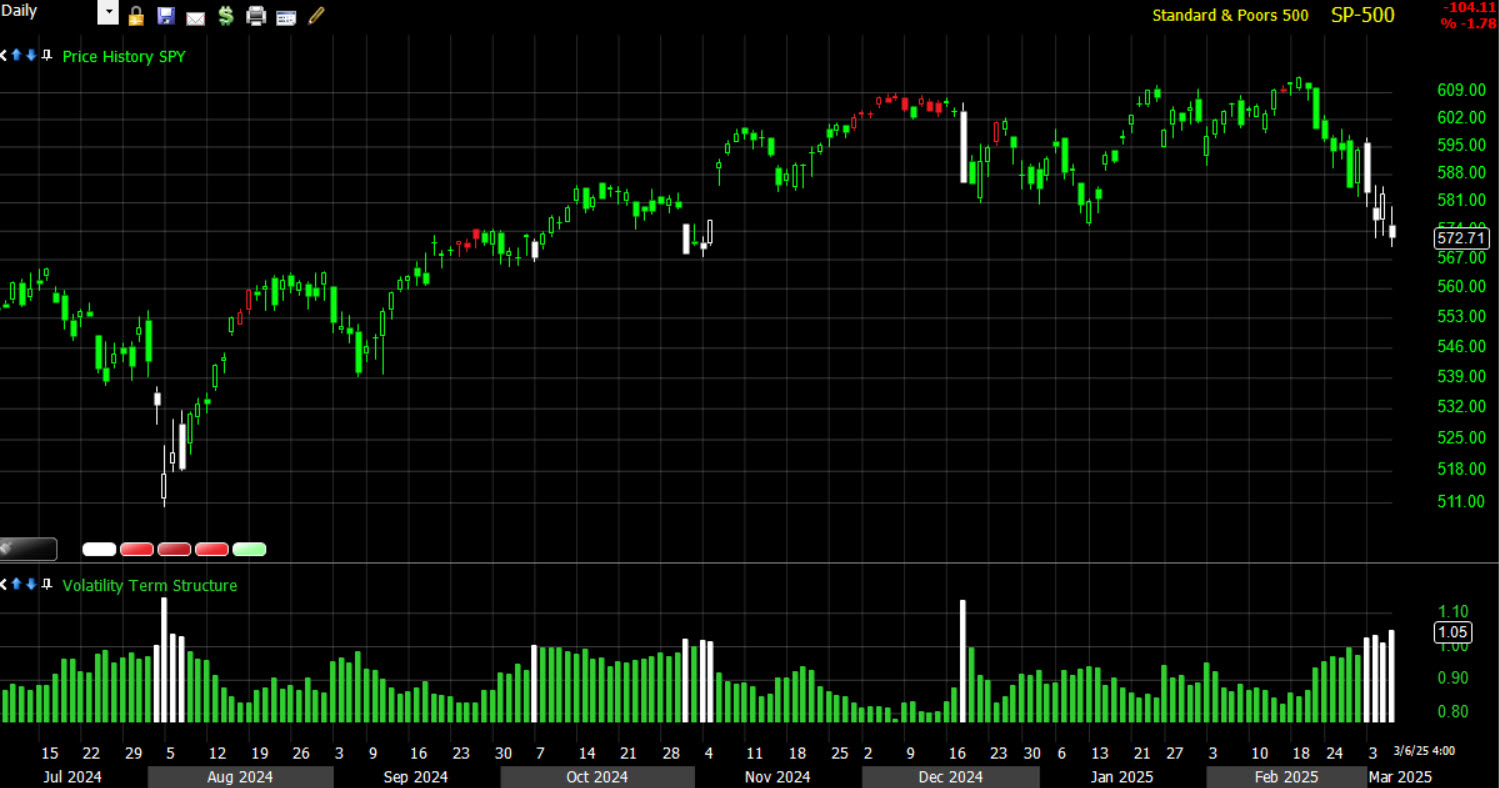
That’s 4 days now.
S&P sectors
Nine of 11 sectors closed lower. Only Energy and Consumer Staples eked out modest gains. Six sectors closed with losses of -1.65% or more. At the bottom of the leaderboard were the mega cap-heavy Technology and Consumer Discretionary sectors, along with Real Estate.
Mega Caps (MGK -2.95%) underperformed the Equal Weight S&P (-1.1%) by nearly 200 basis points (185), which again speaks to their loss of leadership.
Weakness in the Tech and Semiconductor space was due in part to guidance from Marvell Technology (MRVL -19.8%) failing to meet expectations. NVIDIA (NVDA -5.7%) was another influential decliner in Semi space.
The SOX Index closed -4.5% lower with 26 of the SOX’s 27 component stocks closing lower. The SOX index does have a “potential” near term area of price support coming up to test in the $4470-$4475 area…
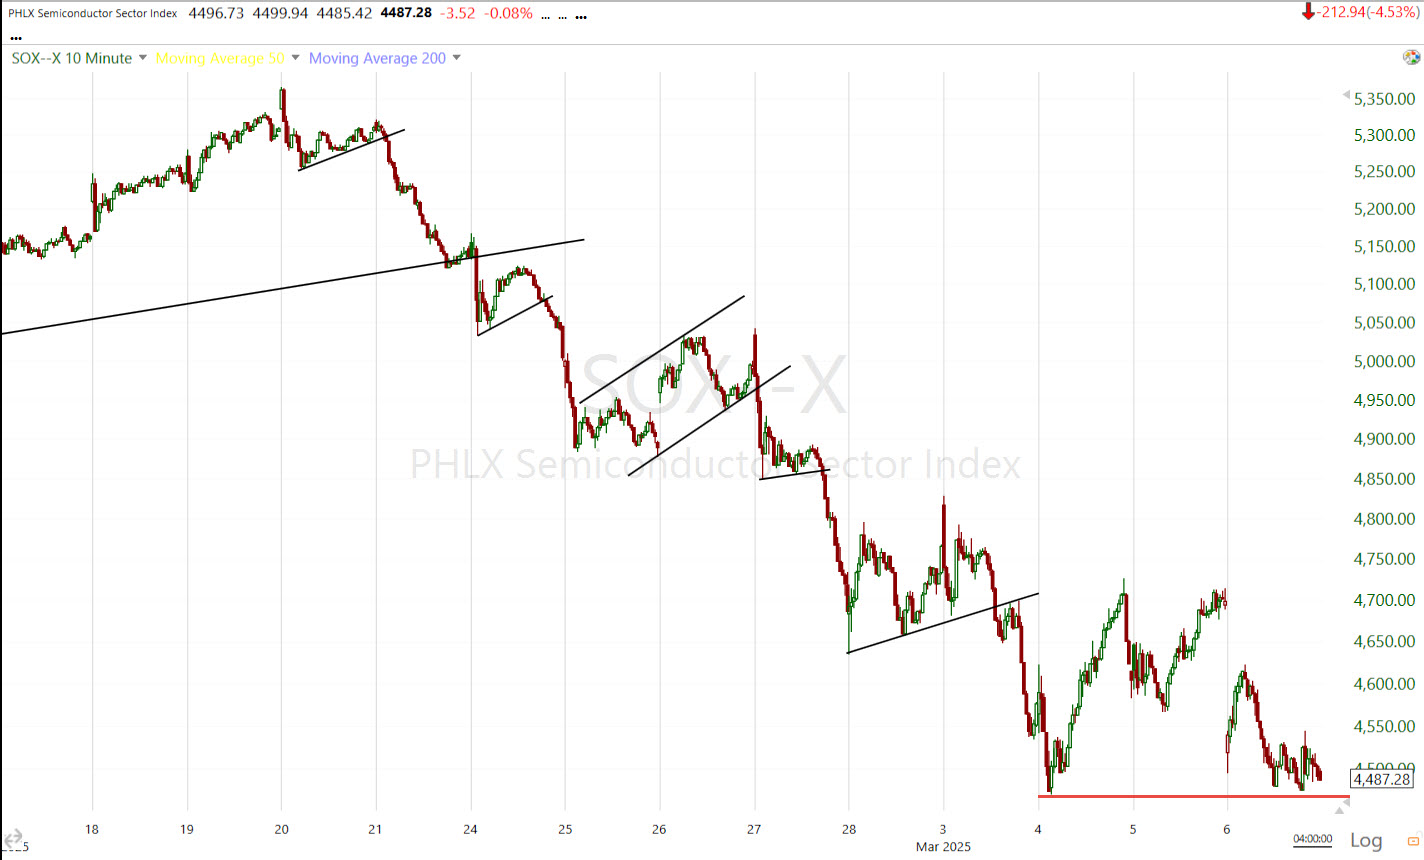 SOX (10m) – although the price trend and 3C charts remains ugly. Like SOX, Nvidia has a nearby level almost identical at $110, so keep an eye on whether or not price can hold support here. This is an opportunity to test of buyers appetite and sellers’ conviction.
SMH’s 3C chart isn’t giving anything away, in line with price action…
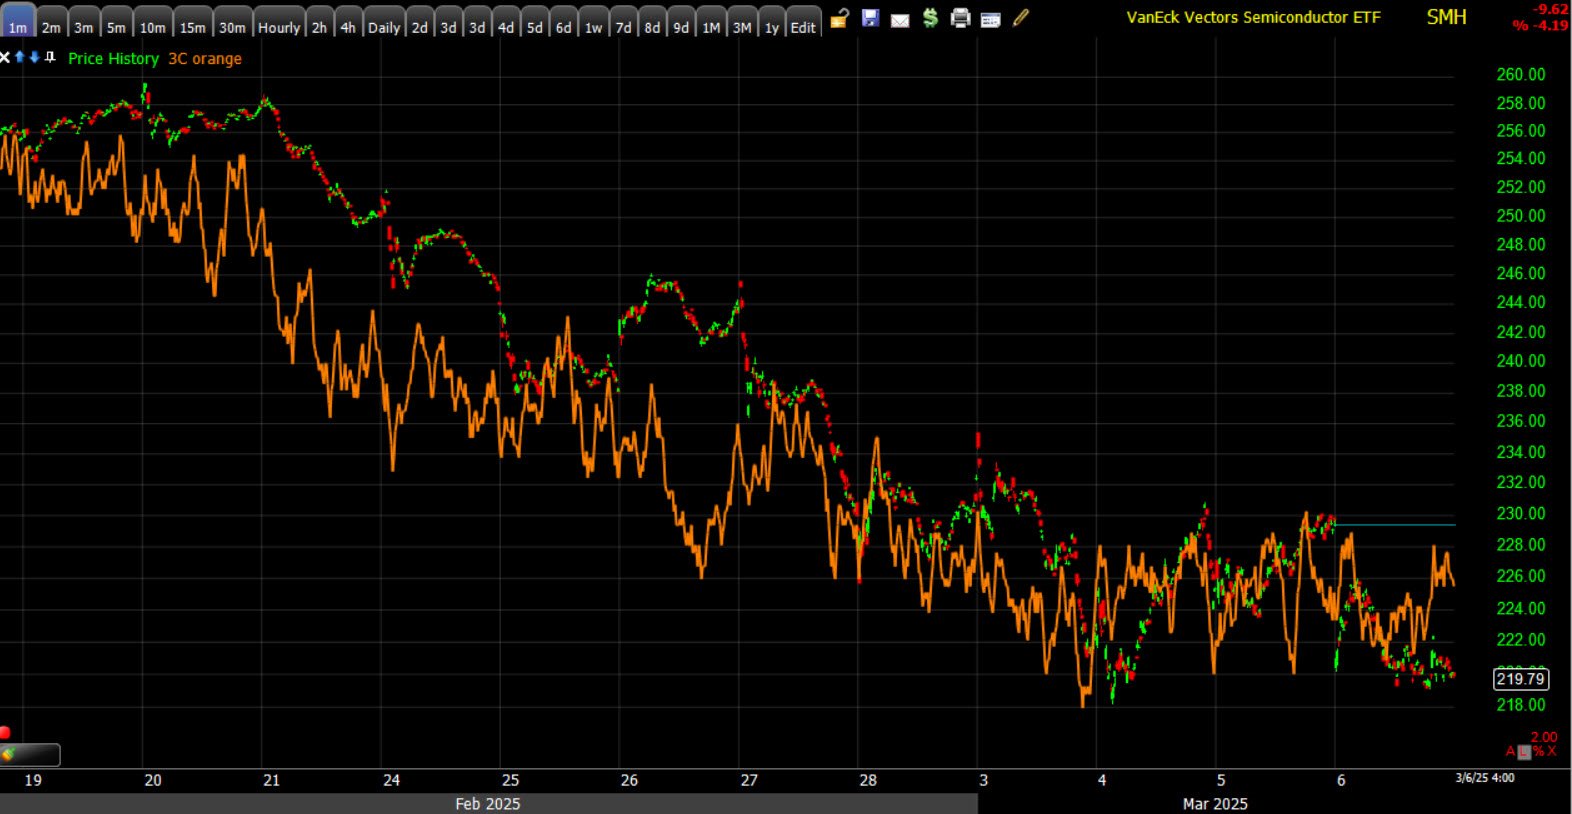 SMH (1m)- Said another way, buyers are not showing up.
Nvidia looks a little better…
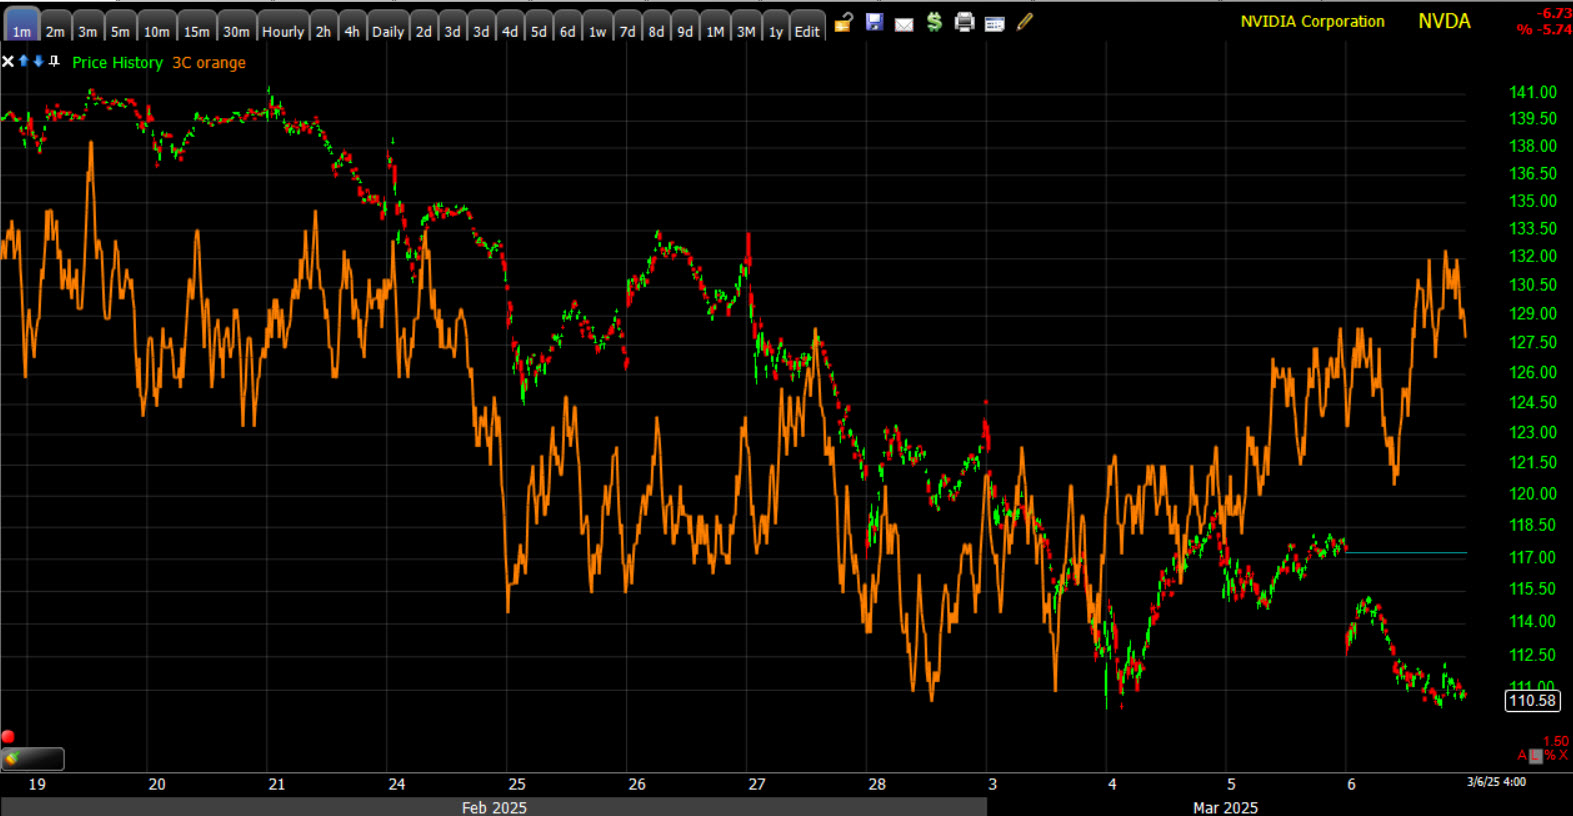 NVDA (1m) – That’s a start, it’s not jumping off the chart. Selling pressure has lightened up at the test of the area relative to the first time price traded there.
More broadly, the right shoulder of a H&S top seems to have finally broken in SOX.
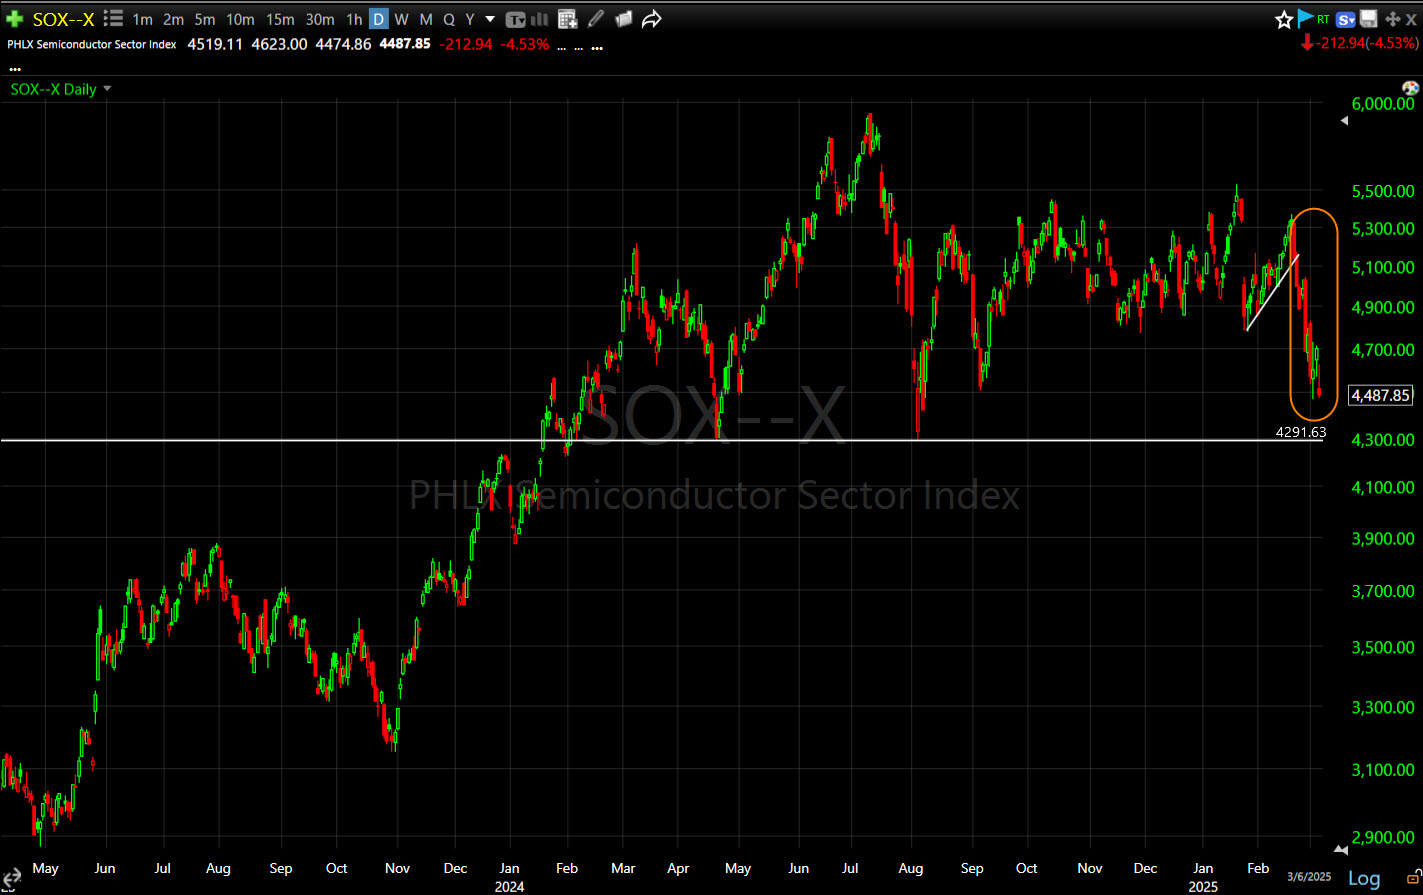 SOX (daily) and seems to be heading toward the next major stop of the neck line.
Materials ⇩ -0.52 %
Energy ⇧ 0.30 %
Financials ⇩ -1.65 %
Industrial ⇩ -0.86 %
Technology ⇩ -2.78 %
Consumer Staples ⇧ 0.18 %
Utilities ⇩ -2.08 %
Health Care ⇩ -0.27 %
Consumer Discretionary ⇩ -2.54 %
Real Estate ⇩ -2.74 %
Communications ⇩ -1.79 %
Internals
Decliners held a solid 2-to-1 lead over Advancers on Volume of 1.2 bln shares.
Dominant price/volume relationship was dominant, But not extremely so except in the NASDAQ 100 period it came in at Close Down/Volume Up, which rounds out the necessary conditions for one day oversold internals. We hadn’t gotten these signals for over a month and now we’re getting them every day.
Breath oscillators remain in oversold territory at six.
Treasuries
Treasuries settled in mixed fashion. The 10-yr yield rose two basis points to 4.29% and the 2-yr yield dropped two basis points to 3.97%.
The market continues to price in around 3 rate cuts this year.
Currencies and Commodities
The U.S. Dollar Index’s decline started to moderate, losing -0.15% today.
WTI Crude oil closed lower by -0.2% to $66.27/bbl. with apparent resistance at former support around $66.85.
Gold futures settled less than $1 higher to $2,626.60/oz, trading in a narrow range today.
Bitcoin slipped back below $90,000 today ahead of tomorrow’s White House crypto summit. Tonight President Trump signed an executive order creating a Strategic Bitcoin Reserve. Price fell in reaction…
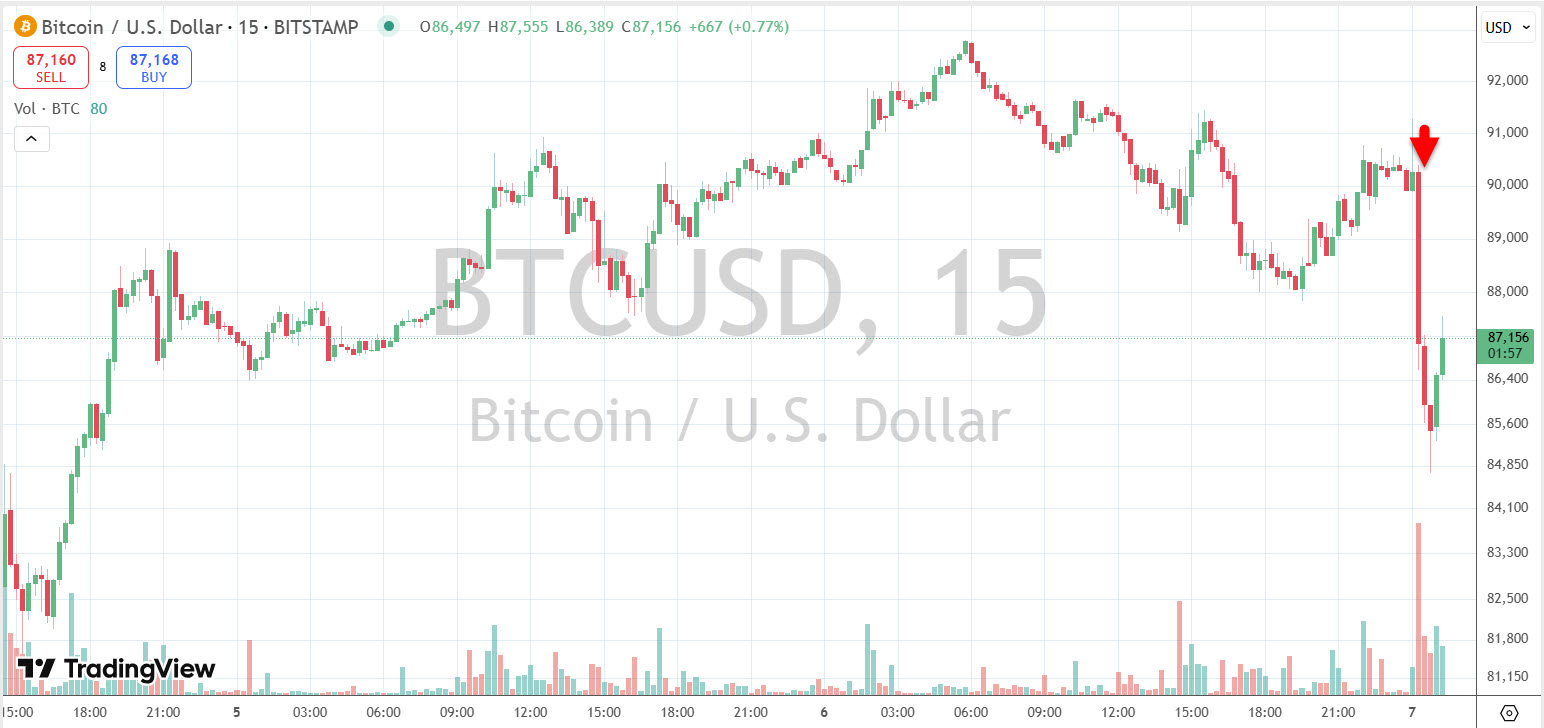 (15m) – What gives? Why did price fall?
White House Crypto and AI Czar David Sacks, wrote on X that, “The Reserve will be capitalized with Bitcoin owned by the federal government that was forfeited as part of criminal or civil asset forfeiture proceedings. This means it will not cost taxpayers a dime.”
Adding,
“The government will not acquire additional assets for the Stockpile beyond those obtained through forfeiture proceedings.”
That’s pretty much what he said he’d do at a July 27, 2024 keynote speech at the Bitcoin 2024 conference in Nashville, Tennessee. At the event, he expressed his intention to create a “strategic national Bitcoin reserve,” suggesting that the U.S. government should retain its existing Bitcoin holdings—primarily seized from criminal activities—rather than selling them off, to establish a permanent national asset.
All of the hopes and dreams of crypto investors, that the government would be purchasing Bitcoin hand over first for the reserve, just went up in an almost comical smoke. The silver lining is that the government won’t be dumping an estimated 200,000 Bitcoin in its possession. Done deal. Now lets see what BTC does of its ow accord.
Summary
It’s pretty difficult for investors to commit money to a theme or idea when the economic and policy backdrop is so fluid. I think we saw an example of that today with the S&P and Nasdaq-100 both in the area of their 200-day moving averages, an area that in the past that has drawn in a lot of money from technical buyers, but barely a few drips according to the 3C charts today.
While I don’t know what tomorrow’s payrolls report is going to look like, my take on price action should payrolls come in ugly, is the same. I think the market could sell off initially on an ugly report (creating even deeper oversold conditions) and then rally on hopes that the Fed will restart its rate cutting cycle. I’m looking forward to tomorrow morning.
Then what I’m looing forward to, if the market rallies on oversold conditions as I favor, is the strength and tone of the rally. We may be visiting the 200-day again in not too long a period of time with more definitive results as the broadening formation, or broadening top, takes shape.
Overnight
S&P futures are up 0.45% tonight.
The US Dollar index (+0.05%) is little changed.
WTI crude oil futures are up 0.15%.
Gold futures are down half a percent.
Bitcoin trades at $87,900.
The 2 and 10 year yields are down to basis points each.
Looking ahead, market participants receive the Employment Situation Report for February at 8:30 ET. Other data includes the January Consumer Credit report at 3:00 ET.