3C Signals Big Move Up On An Ugly Day Down
I have an outlook for the market near-term and longer term. The two aren’t nessecarily the same, but short-term probabilities are the imediate concern, and then how we can use them to set up longer term trades and portfolio realignment.
On Monday when the S&P-500 fell -2.35% with very ugly trade, 3C did what it does best, sniffs out underlying money flow. That’s the beauty of my proprietary indicator, 3C, it has the ability to contradict price, and when it does, it’s a powerful signal.
An excerpt from Monday’s, April 21, 2025, subscriber analysis (S&P down -2.35%)…
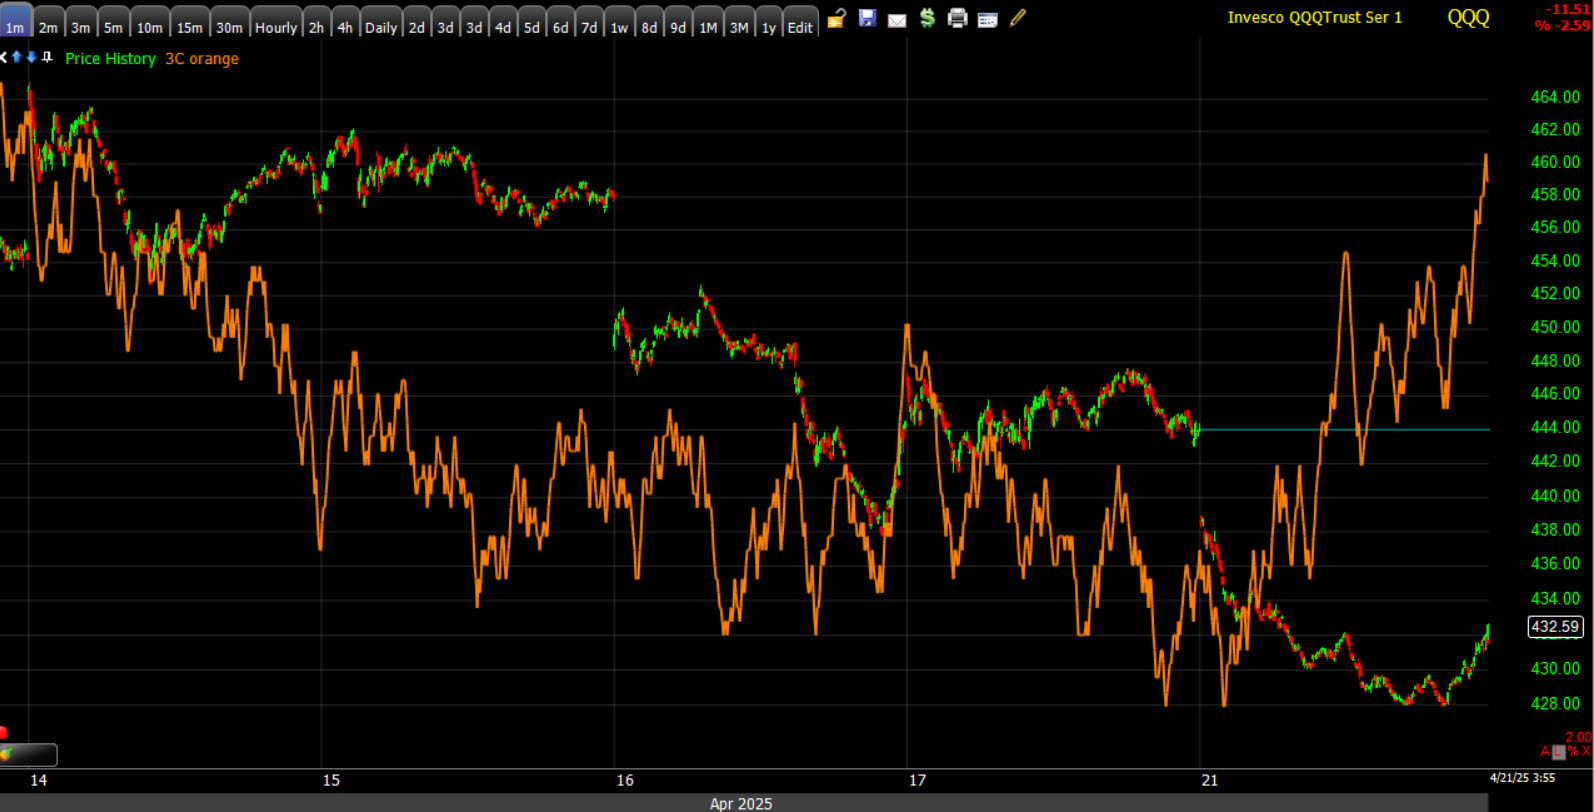
In my last post I mentioned QQQ’s 3C chart was looking like last Wednesday’s starting with a relative positive divergence. Now it’s following even more in the footsteps of last Wednesday with a leading positive divergence this afternoon. At this point, what we have now is dwarfing last Wednesday.
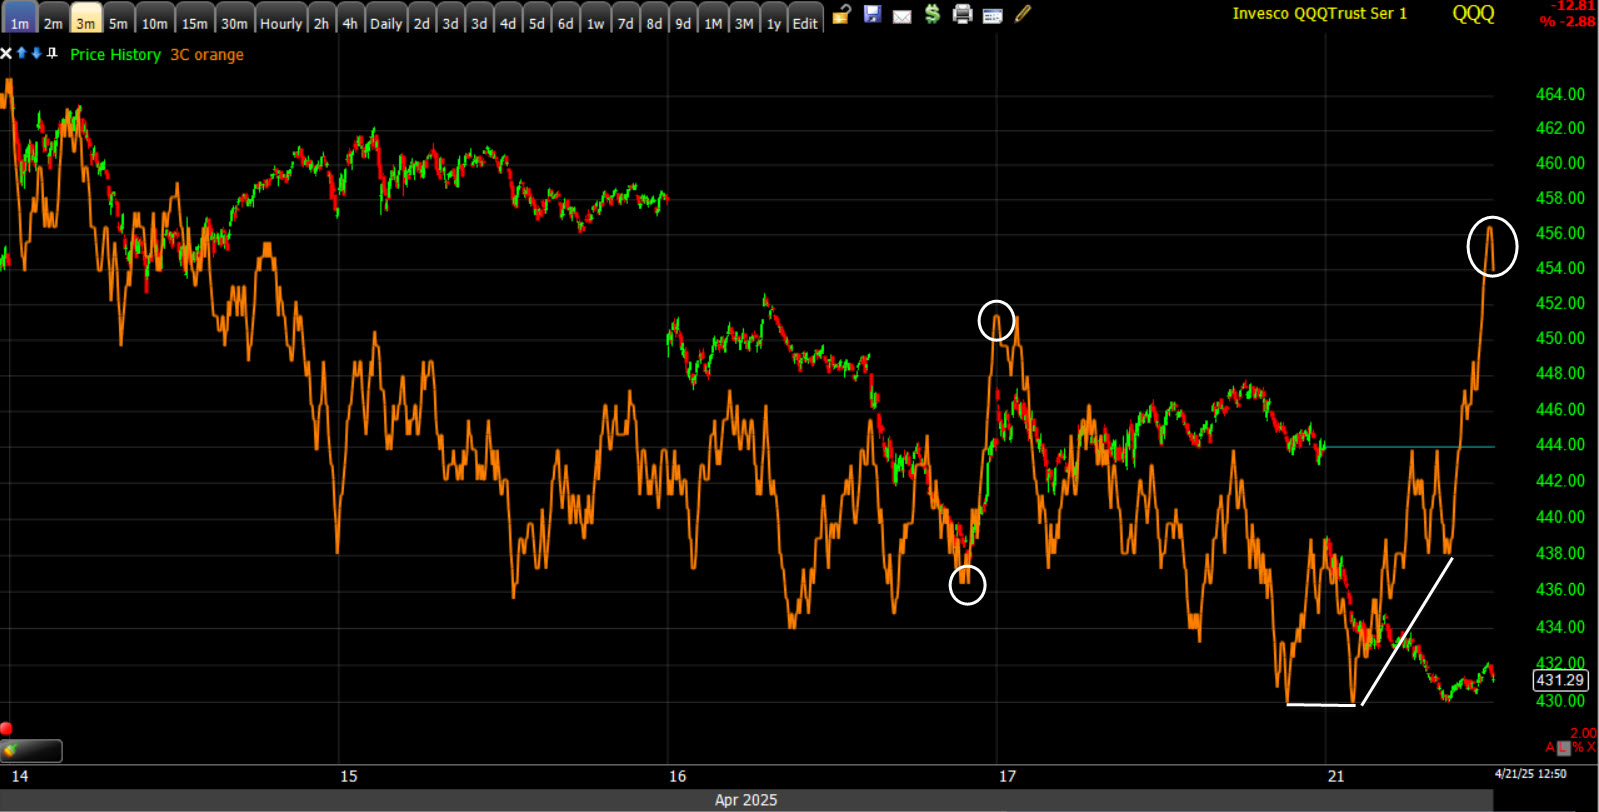 QQQ (1m) today from relative positive to leading positive, dwarfing last Wednesday’s closing leading divergence.
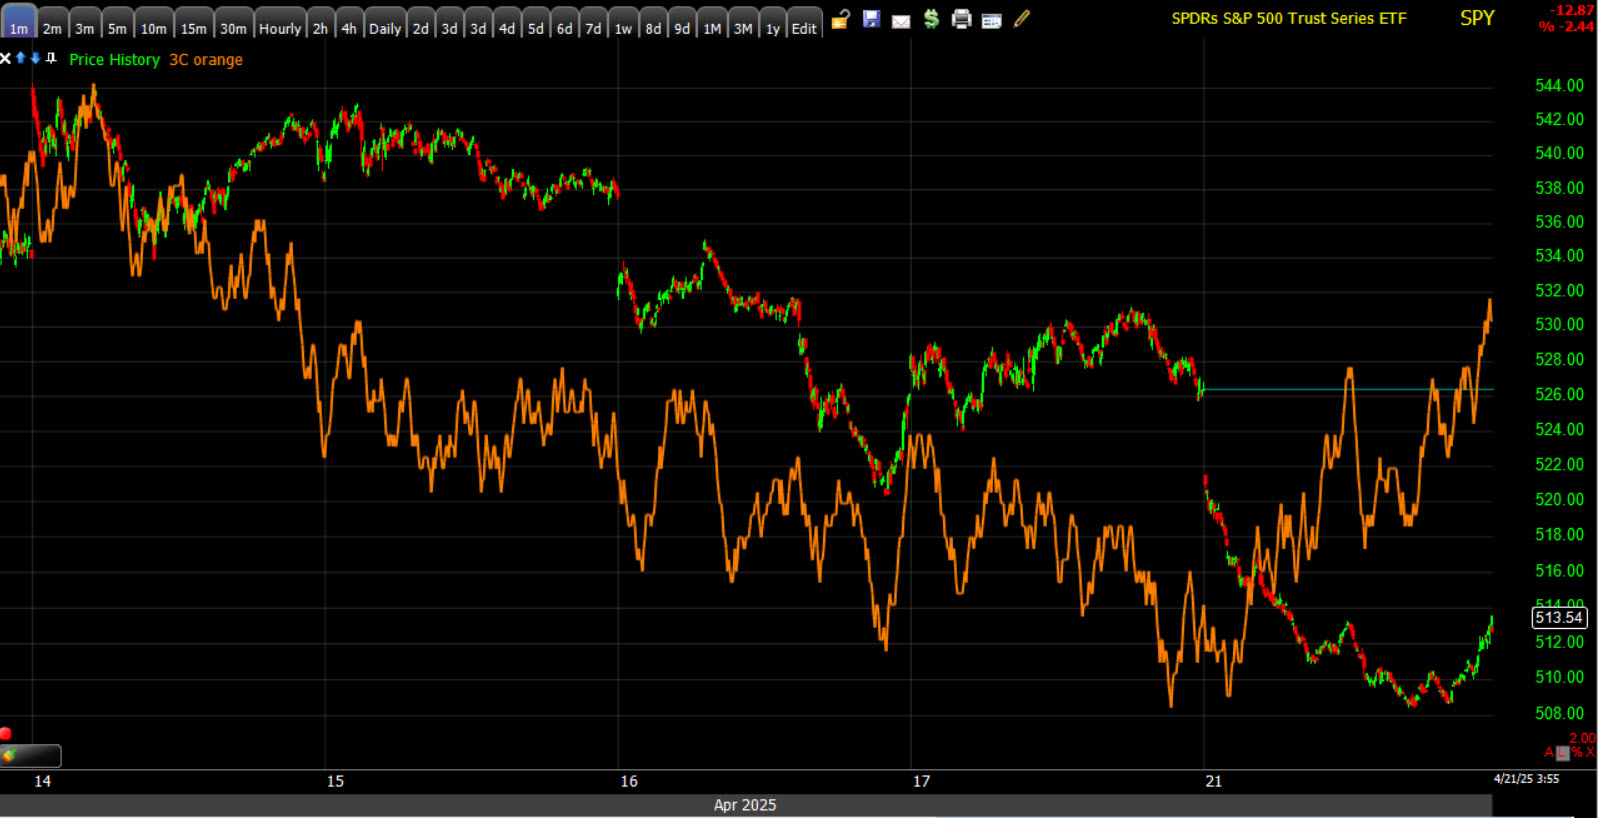
Now SPY is joining in (not to the same degree), which it wasn’t earlier.
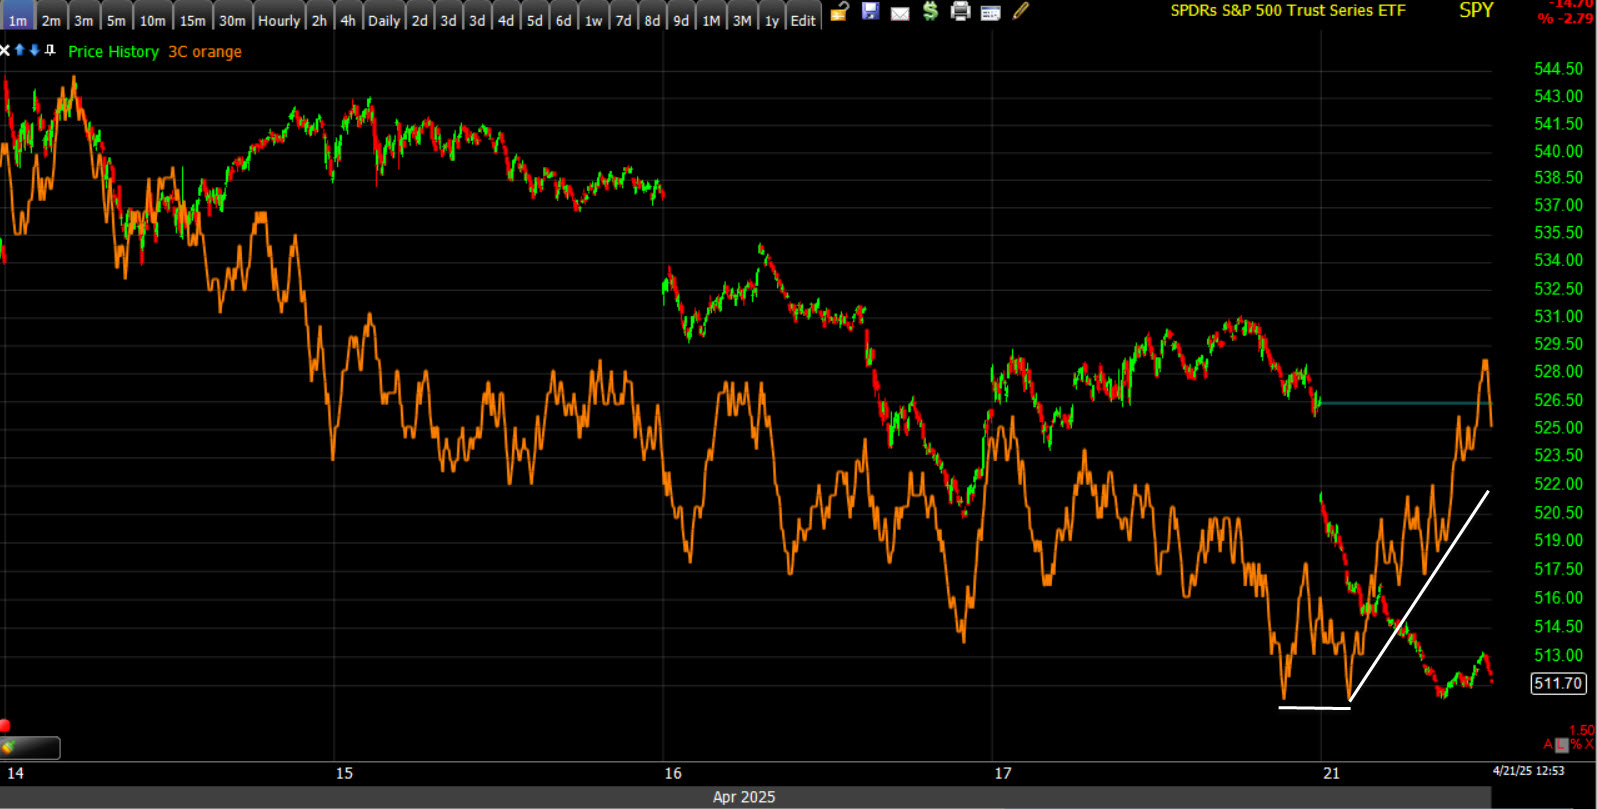 SPY (1m)
A few sectors have like Financials, and more importantly, the most heavily weighted Technology sector…
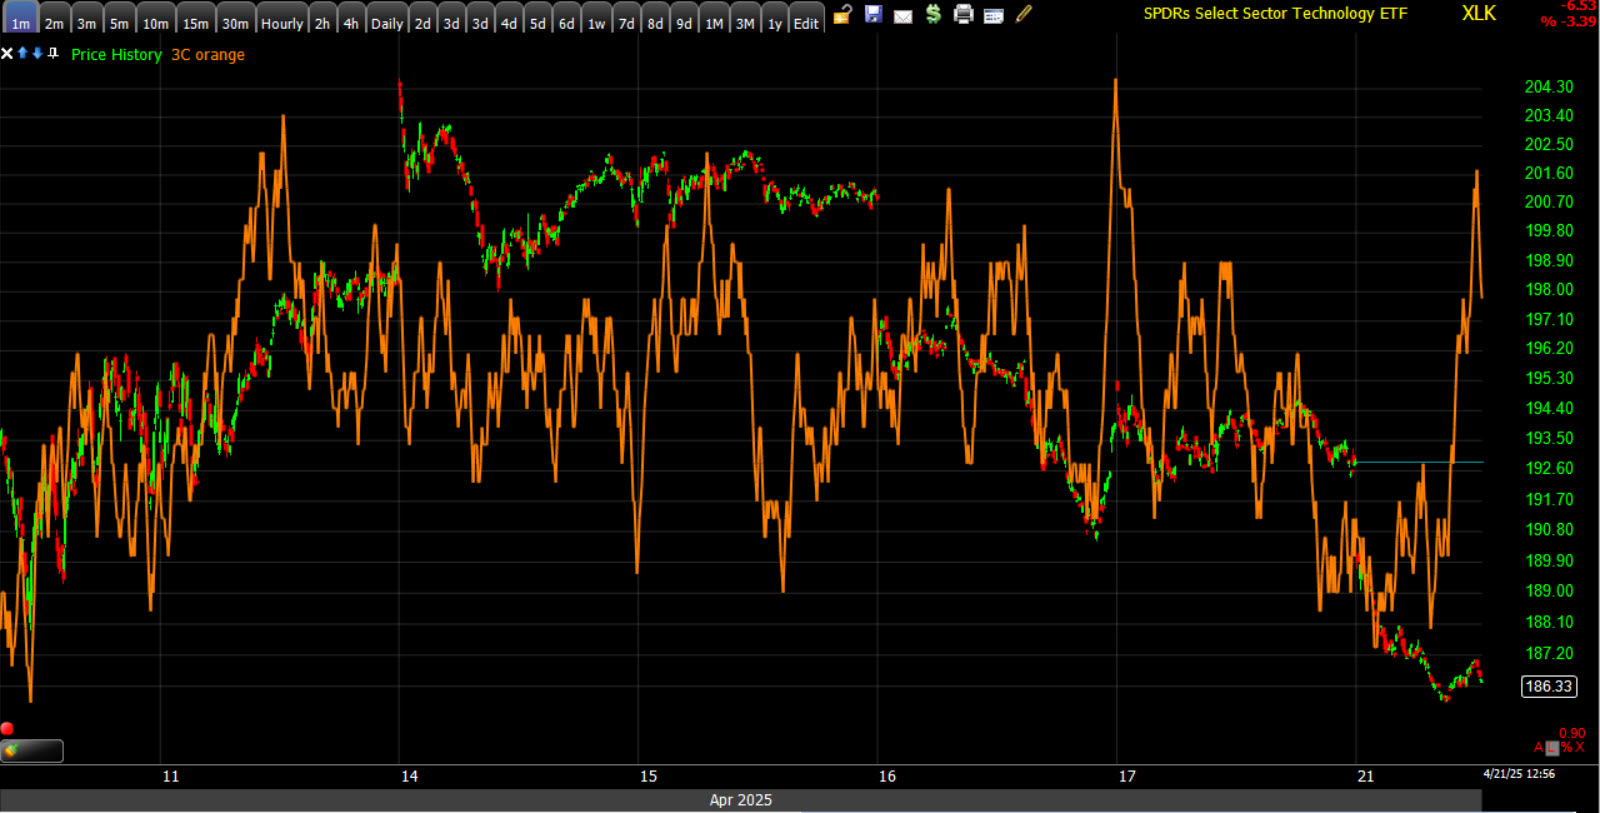
Tech sector (1m)
The Dollar’s break down today isn’t small potatoes, it’s an important development signifying less trust in U.S. assets…
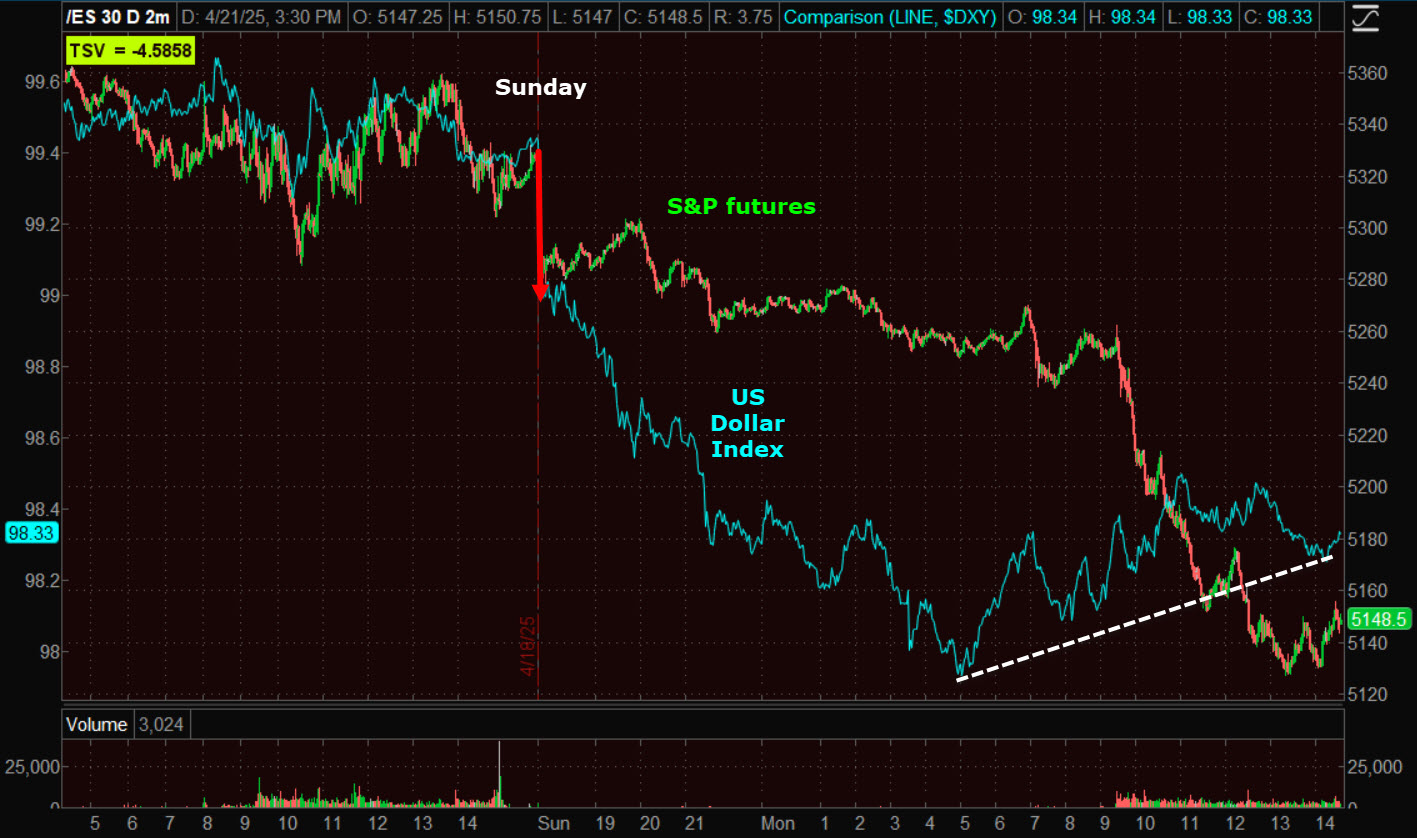 From Friday’s close the U.S. Dollar Index (blue) leads S&P futures lower, but the Dollar is off morning lows and correcting.
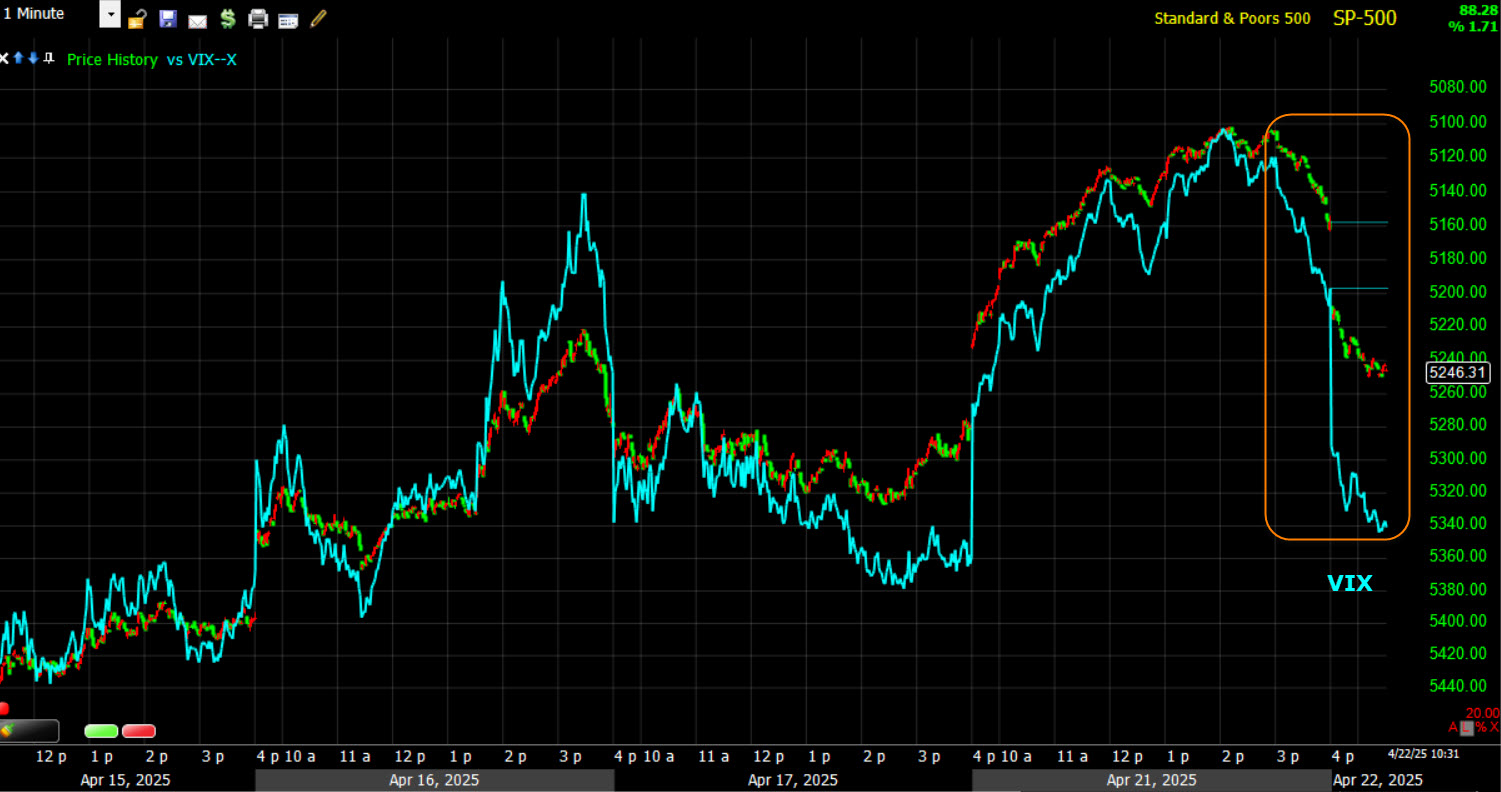
VIX’s relative weakness is becoming more pronounced…
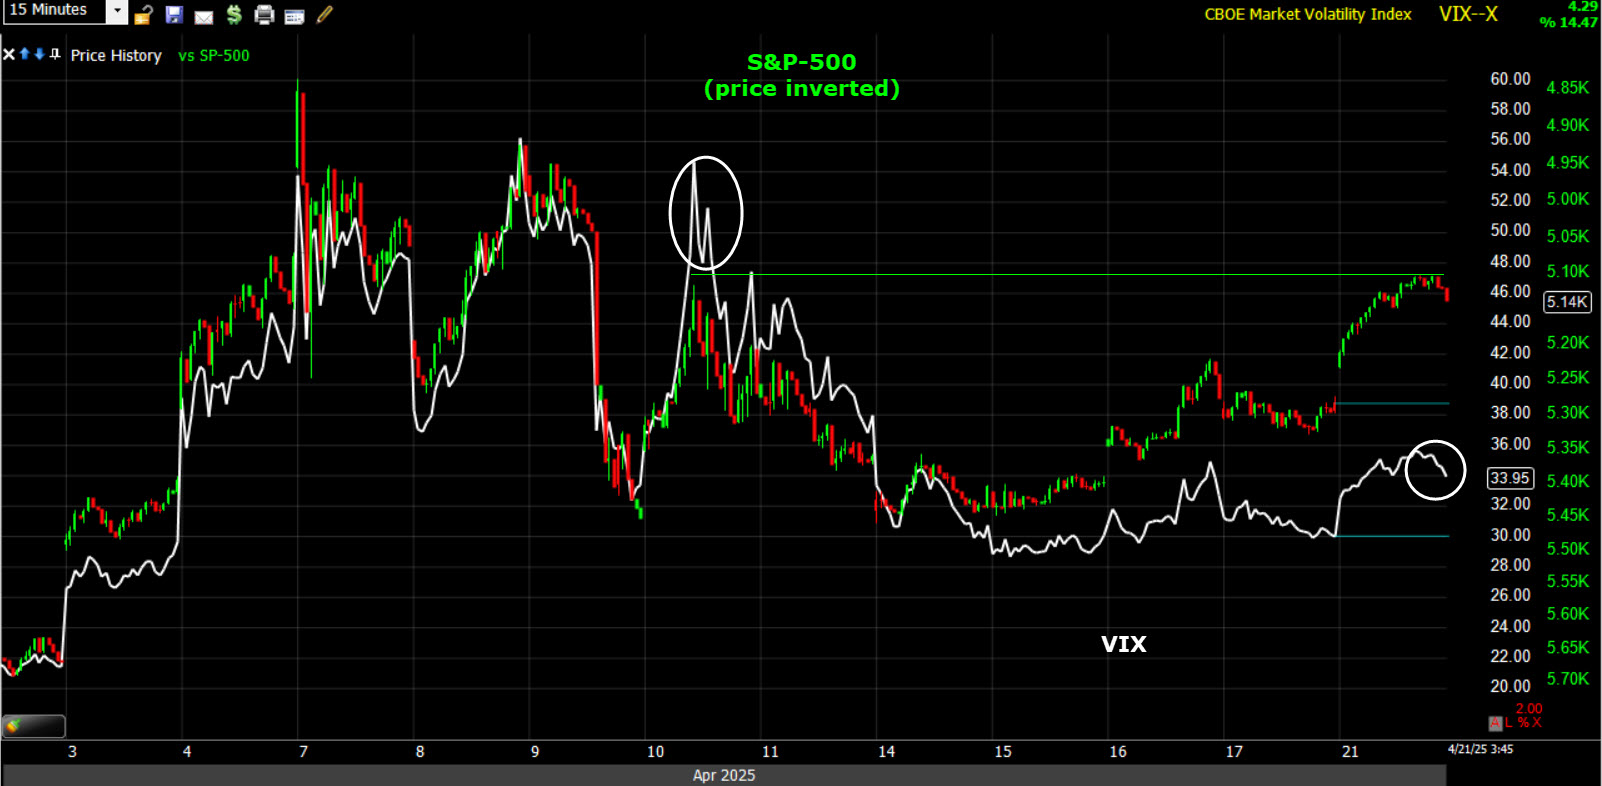 SPX (15m w/ price inverted for context) and VIX (white).
High Yield Credit continues to act better than it should be…
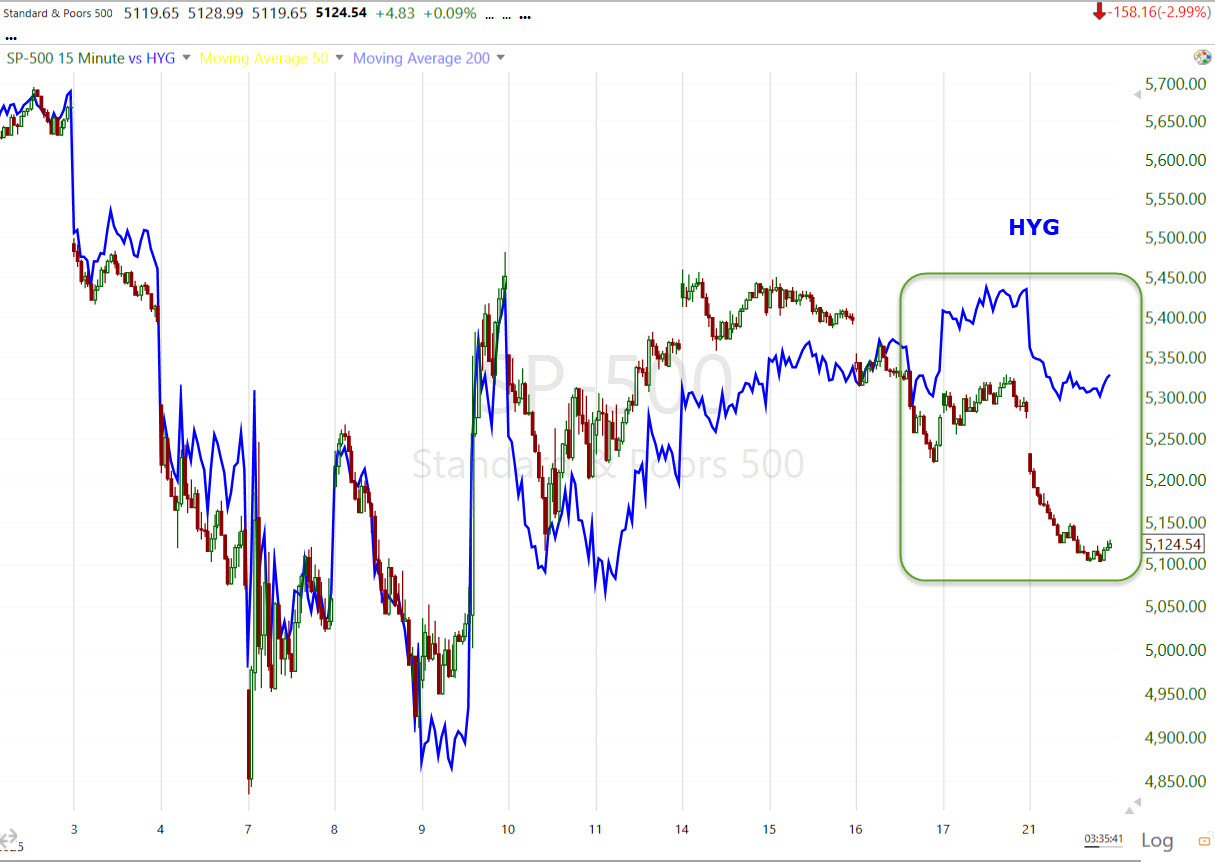 SPX/HYG (15m) – HY Credit has long been one of my favorite leading market signals.
Later that day in the cash session…
The averages are looking better though, as if they are finding a low.
 SPY (1m)
 QQQ (1m)
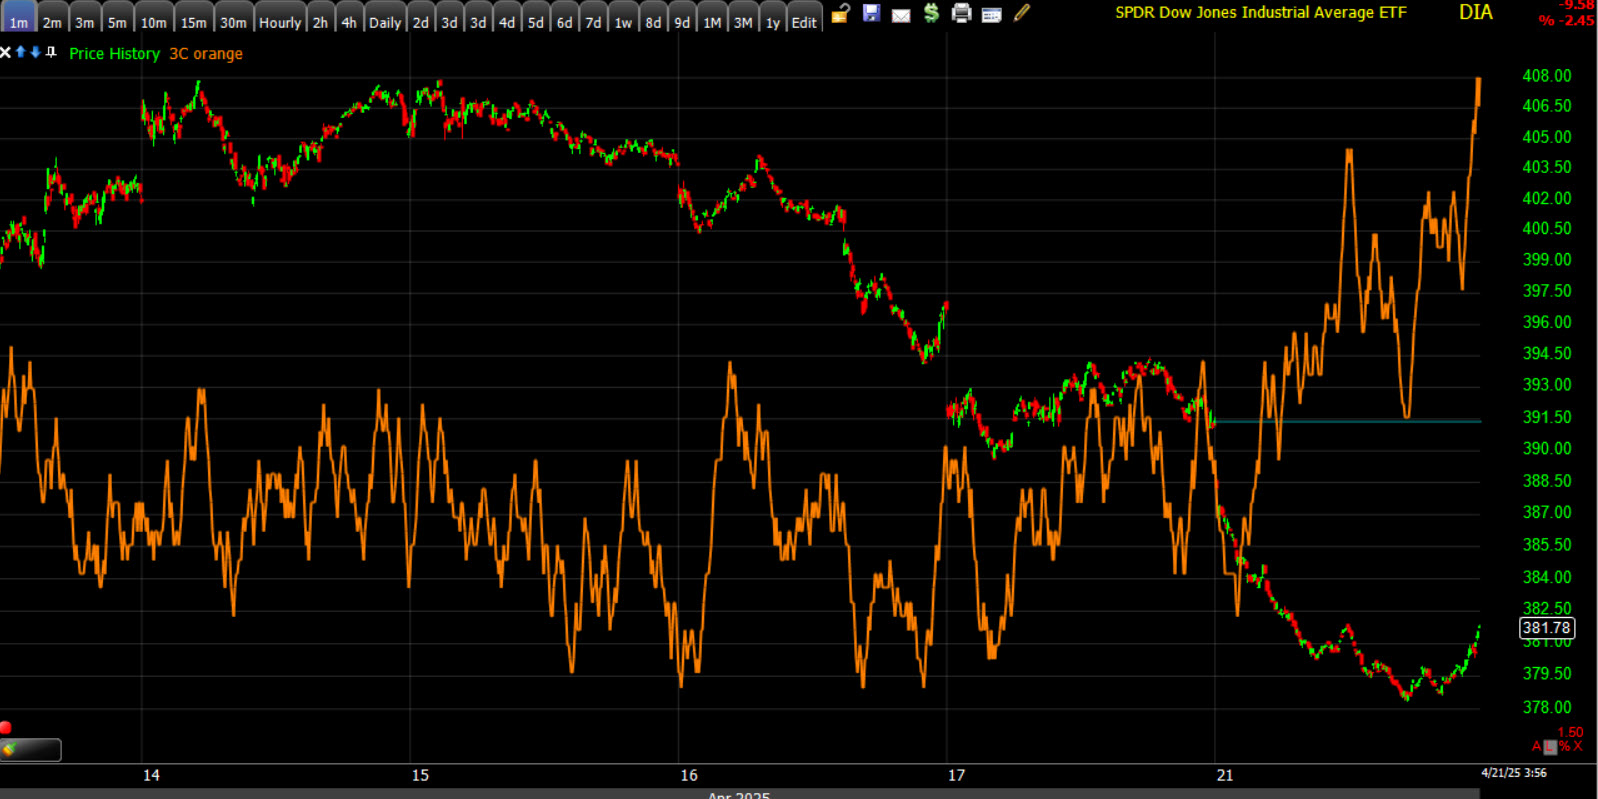 DIA (1m)
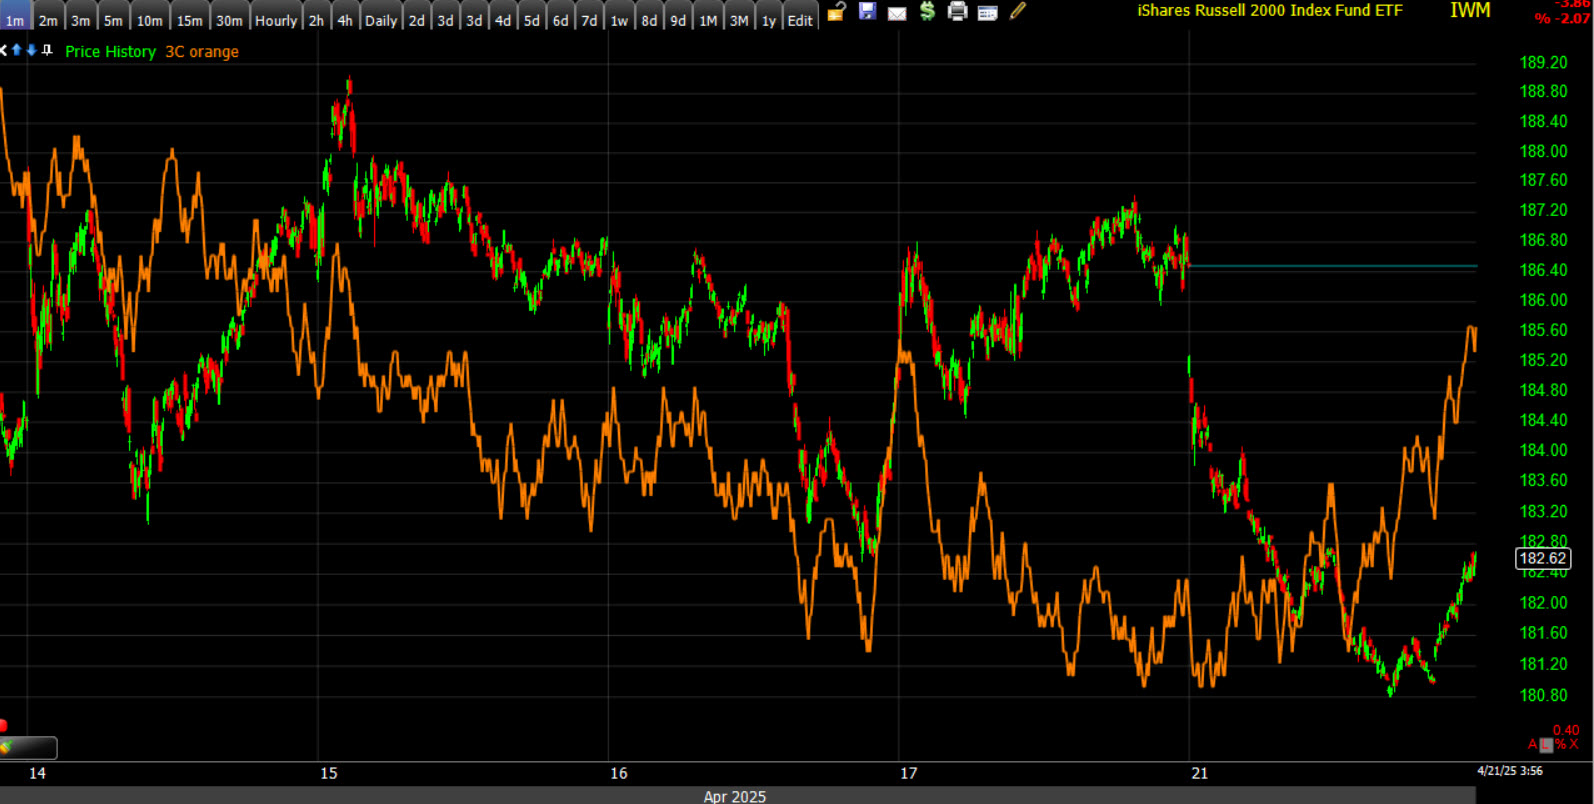 IWM (1m)
And after Monday’s close…
Rising global liquidity (M2 – with a 10-week lead) is another factor and it should start to kick in right about now…
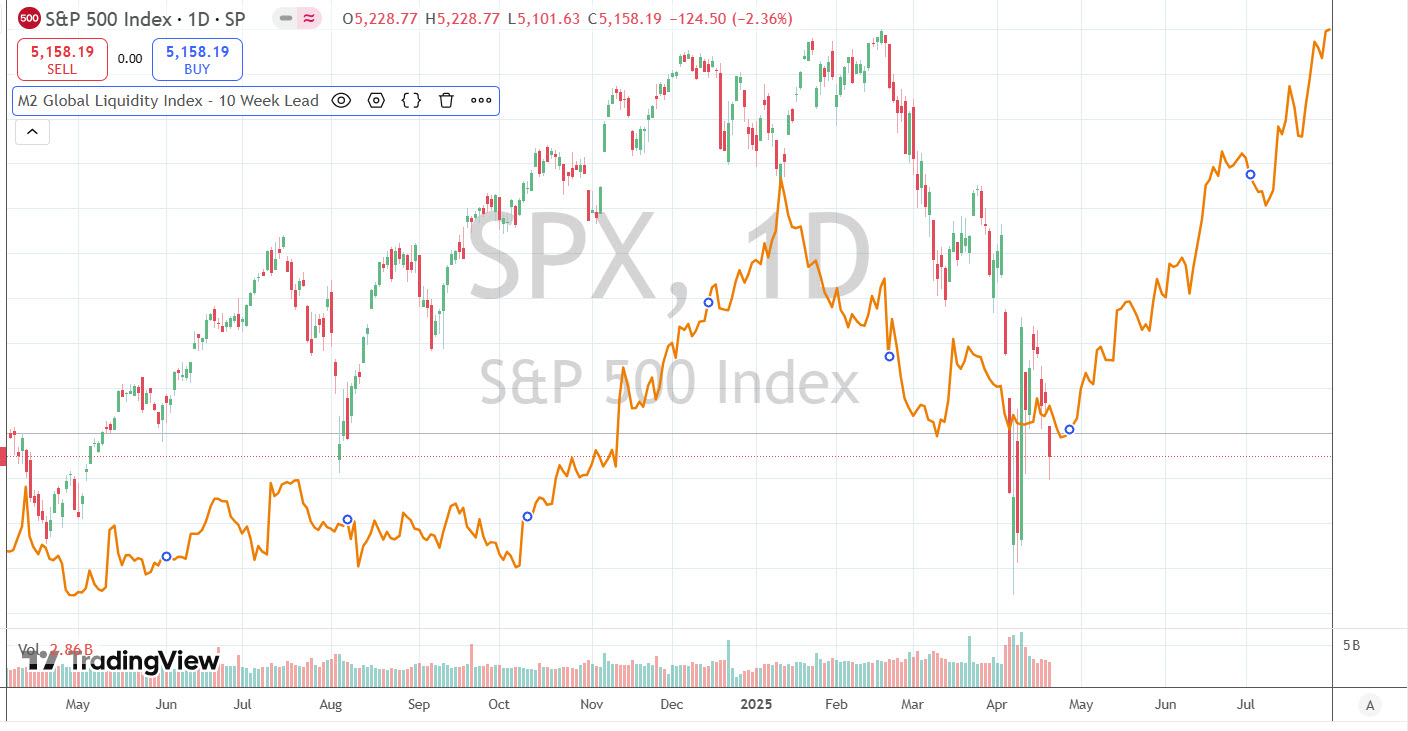 SPX (daily) and global liquidity (M2) with a 10-week lead (orange).
Despite the price-percentage losses and the extent of selling, I think today’s 3C charts ended pretty strongly. We also have 1-day oversold conditions and a quite strong signal. I’d think we start seeing some better price action this week.
While a day is not a trend, it [3C] was some of the most positive movement in weeks.
Consideing Monday’s ugliness, it now appears that “insiders” had foreknoewledge that President Trump was going to dial back the rhetoric regarding removing Fed chair, Powell. And also deescalate trade rhetoric toward China. And they knew days in advance, using Monday’s price weakness to accumulate shares on the cheap. 3C picked up on this with a leading positive divgerennce Monday, even as markets looked like they were headed lower from price only…
QQQ (1m) Monday, April 21st with a leading positive 3C divegrence, contradicting price action, and signalling institutional level accumulation of price weakness… “Buying the Dip” so to speak, but with apparent insider informaton of what was coming.
3C doesn’t tell us what the catalyst will be, but it can reveal the footprints in the sand of what “Smart Money” is doing. That’s exactly what happened Monday.
Since then, the next day, the averages were up around +2.5% to +2.6%, retracing all of Monday’s weakness and then some.
As of this writing on Wednesday, April 23rd, 2025 the SPX has gained as much as +7.2% since 3C started alerting us Monday. The Nasdaq-100 has gained as much as +8.2% over the same 2-day period and Small Caps over 8%.
3C is not the only tool though. Volatility’s (VIX and VVIX’s) relative performance factored in.
“On the day, or more precisely, since the last hour of trade yesterday, VIX is displaying some relative weakness.
 SPX (1m) with price inverted or context and VIX (blue).
VVIX (-8.75%) is displaying even more…
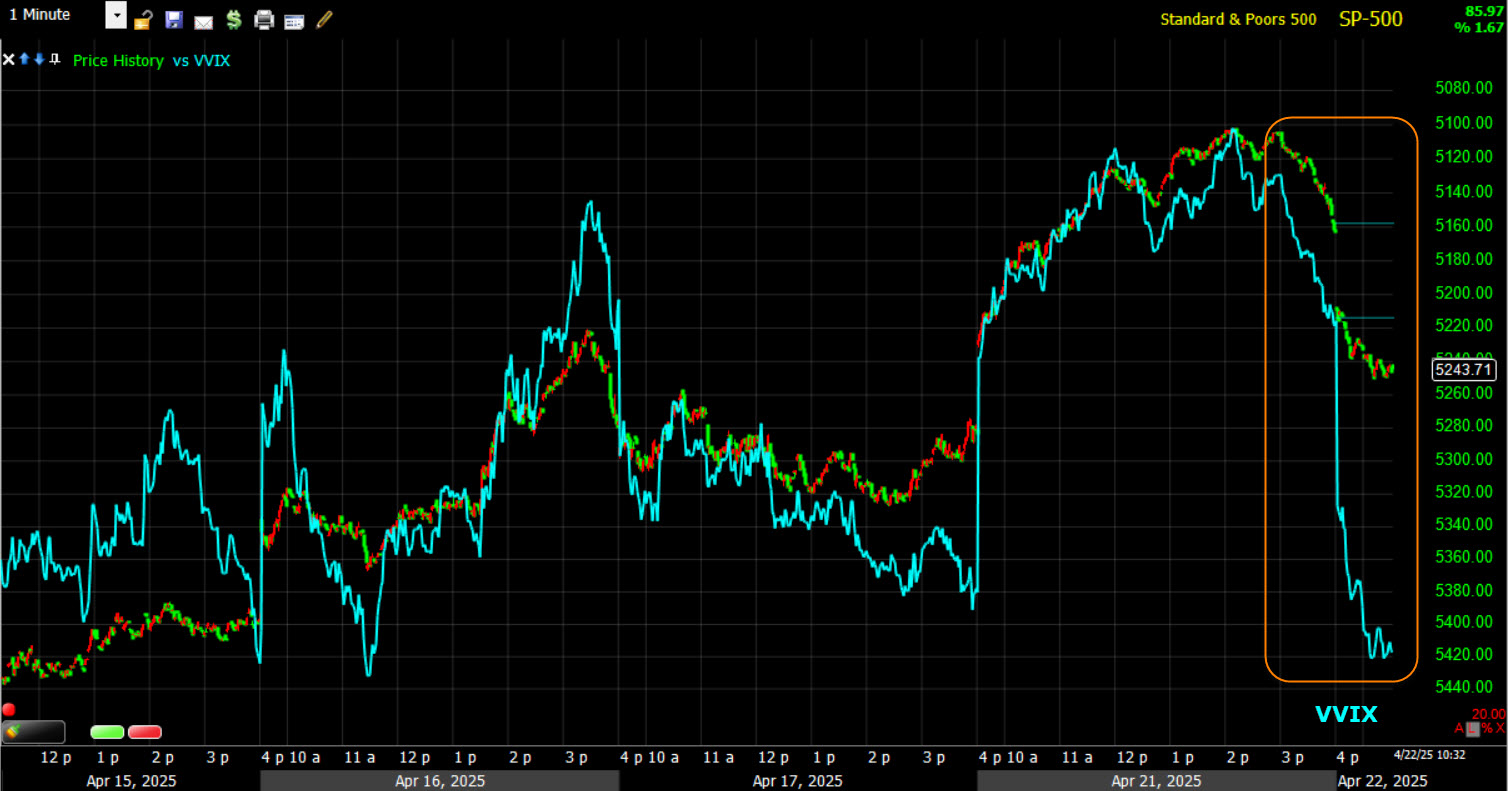 SPX (1m) with price inverted or context and VVIX (blue).
The U.S. Dollar Index which was reflecting, “Sell America,” positiely diverged from S&P futures Monday and factored in…
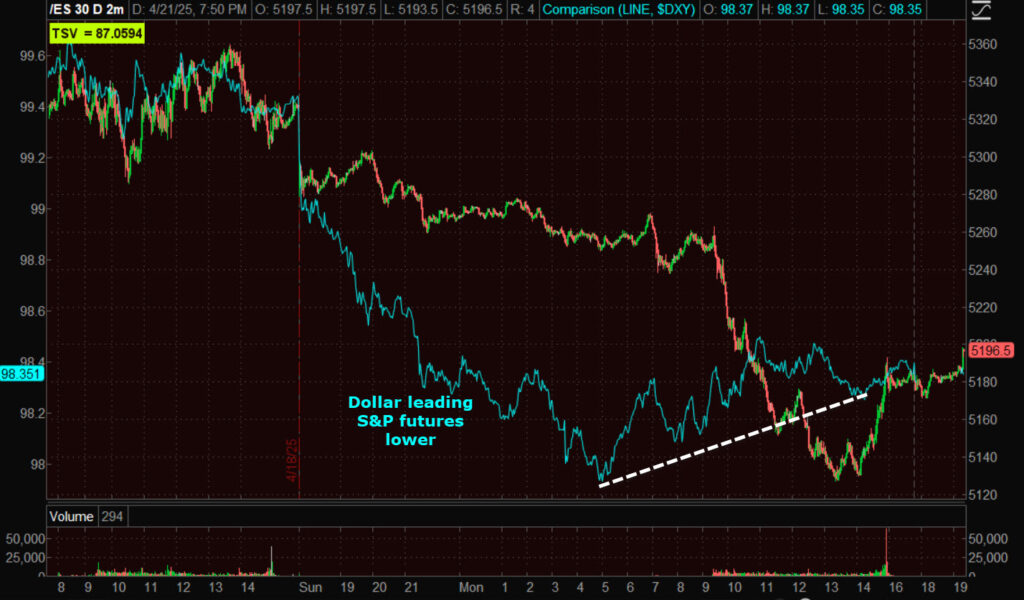
S&P futures and U.S. Dollar Index (blue).
High Yield Credit factored in…
High yield Credit, one of my favorite leading market indicators, continues to offer a more supportive picture for stocks/risk assets…
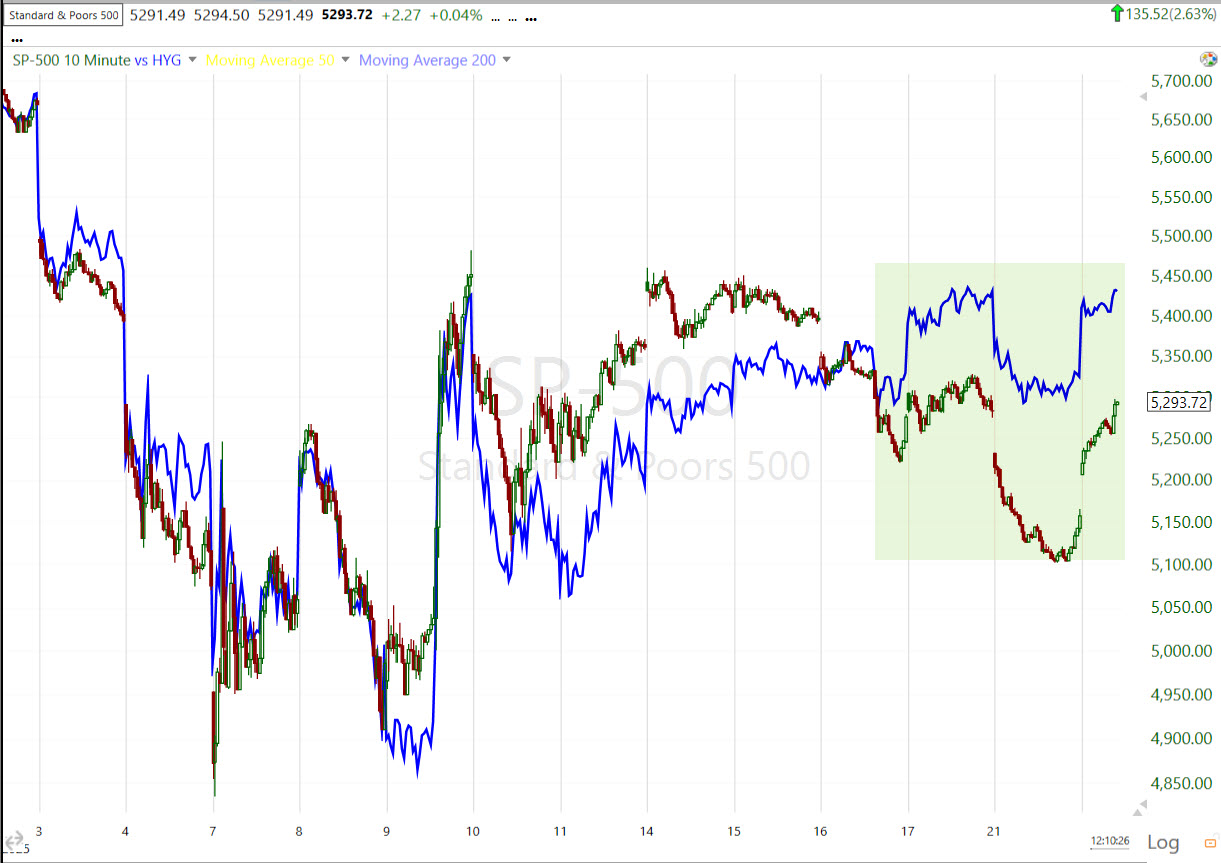 SPX/HYG (10m) relative performance – and this despite some pretty volatile action in yields.
These all helped asses the envirinoment and probabilities, but nothing jumped off the chart like underlying money flow in real time, depicted by 3C, and well in advance of the move higher…
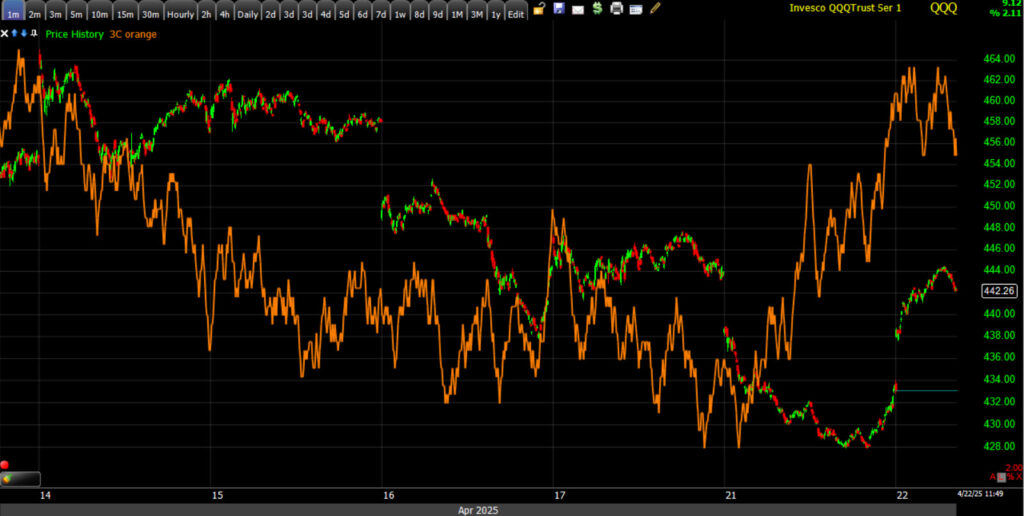
QQQ (1m)
Smart Money knows. We can’t know what they now, but we can see their footprints in the sand and which direction they are heading. That’s powerful information.