
Daily Wrap – 3C Caught Them. The Financial Times Confirms.
This is the May 13th subscriber post for Wolf on Wall Street-Trade, soon to be moving to the Technical Take.
I’ve said quite a few times over recent weeks that someone with some deep pockets and well connected, knew something long before Wall Street, and certainly before the general public. Remember our 3C signal that, “jumped off the chart” the day before the S&P-500’s near-record 9 consecutive day rally? Well, it seems 3C did sniff out something big. We may not know what they know in situations like this, but we can see the direction of their footprints in the sand.
Just Friday in the Afternoon Update I wrote,
“As far as this weekend’s US -China meeting, I think there is a lot more going on behind the scenes than is being reported, and that in large part, has been reflected in price action over recent weeks. Remember the pictures of Chinese diplomats with badges to enter the US Treasury building, I believe last week maybe a little bit longer than that? The Chinese wanted those pictures deleted from a South Korean newspaper because they have one hardline message for domestic consumption and it appears a different covert message to the United States. I’m guessing this weekend will produce some favorable results and we will see the averages continue higher. I don’t see anything on the charts that suggests otherwise at this point.
There is no change to my short term outlook which is the S&P moving up to the 5900 to 6000 level in the near term.”
 This photo from a SoUth Korean newspaper was taken on the 24th, of a high-ranking official from the Chinese Ministry of Finance entering the U.S. Treasury building located right next to the White House in Washington D.C., accompanied by about 10 attendants.
Today, the Financial Times writes,
“The first meeting to break the US-China trade deadlock was held almost three weeks ago in the basement of the IMF headquarters, arranged under cover of secrecy.
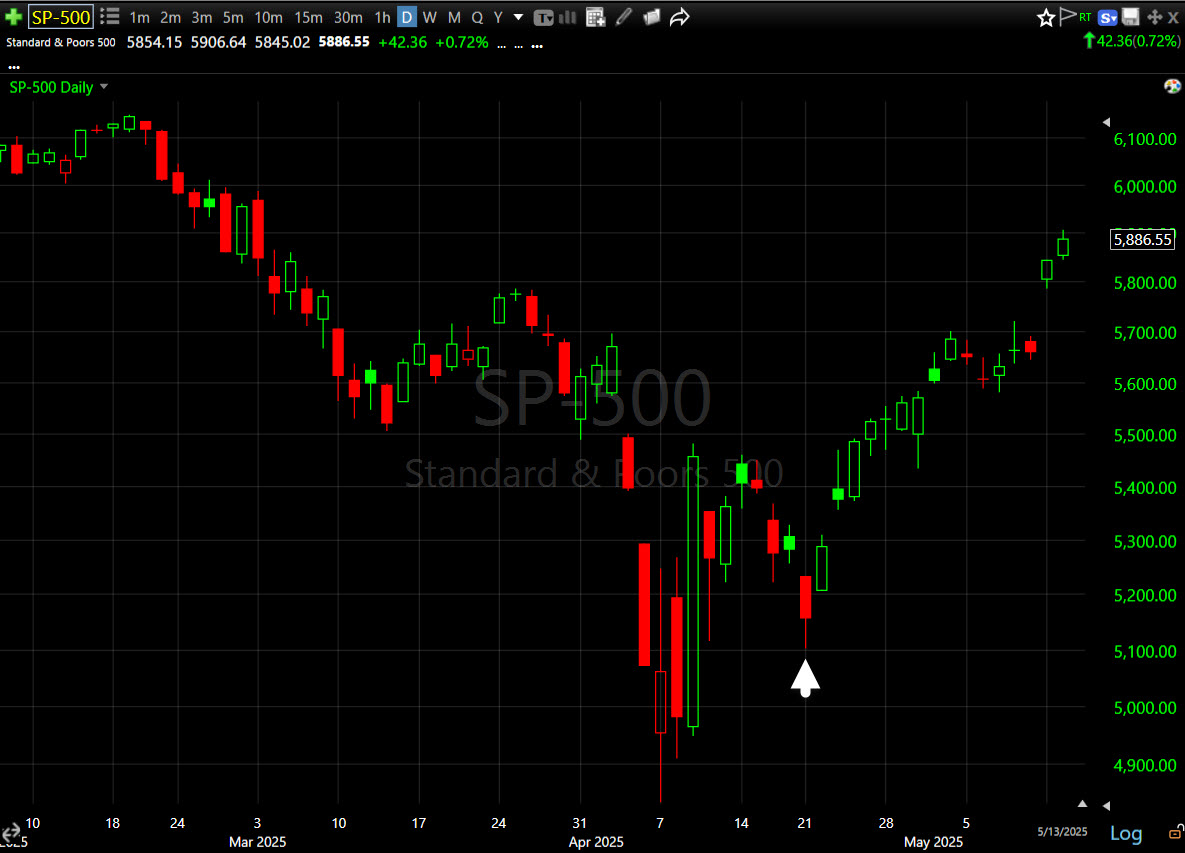 SPX (daily) w/ April 21st, the day 3C went nuts with the strongest intraday leading positive divergence I’ve seen all year. I’ve said numerous times over the last 3 weeks, “Someone knew something,” not the entire street, but some very well connected deep pockets, and they were acting on that information. The S&P has added +14% in the 3 weeks since that day.
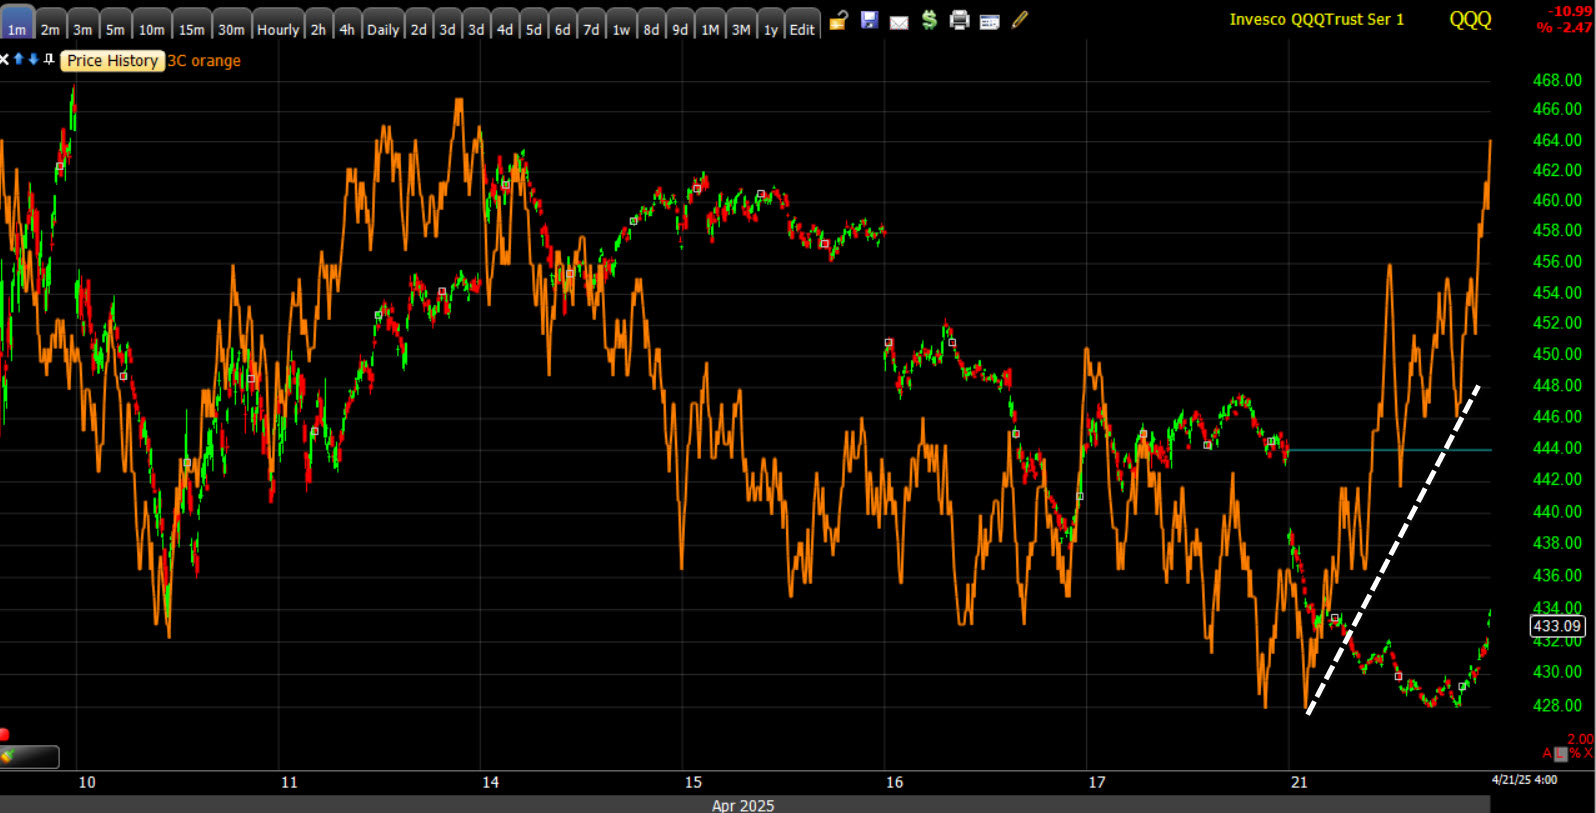 QQQ (1m)- starting with a weaker relative positive divergence and ending with a stronger leading positive divergence.
These stronger leading positive divergences migrated to longer/stronger 3C timeframes as well, which doesn’t often happen the same day. This indicates a stronger divergence or accumulation of the decline. It’s sort of a micro version of what we saw in December of 2022 as mega caps were being dumped amid tax-loss selling after being the worst performing group of 2022’s bear market. As soon as we entered 2023, mega caps followed my call, that they’d go from “most hated stocks” to the new leaders of 2023, which started almost immediately as we entered January, 2023.”
Yes, there was inside information being traded on and 3C was showing us the what the actors were doing. We had no idea why, but we saw what they were doing. All of the above, is conclusive proof.
There was a ton of news today. Do I think any of it mattered? No. The market was set on a course. CTA’s medium term buy trigger was hit yesterday. Hedge funds still have short positions to cover and they are very low on U.S. equity inventory on the long side, so they too have been forced to cover shorts and chase higher prices. Add in corporate buybacks as a steady bid under it all.
Our bull flag from last week broke and is following through to our measured move forecasts. The S&P hit the low end of the $5900-$6000 measured move with a session high $5906.64 and a close of $5886.55. Despite a lack of solid confirmation in 3C charts (underlying money flow) — which is relative to what we have seen recently — the price action intraday was solidly bullish, weaving around $5900.
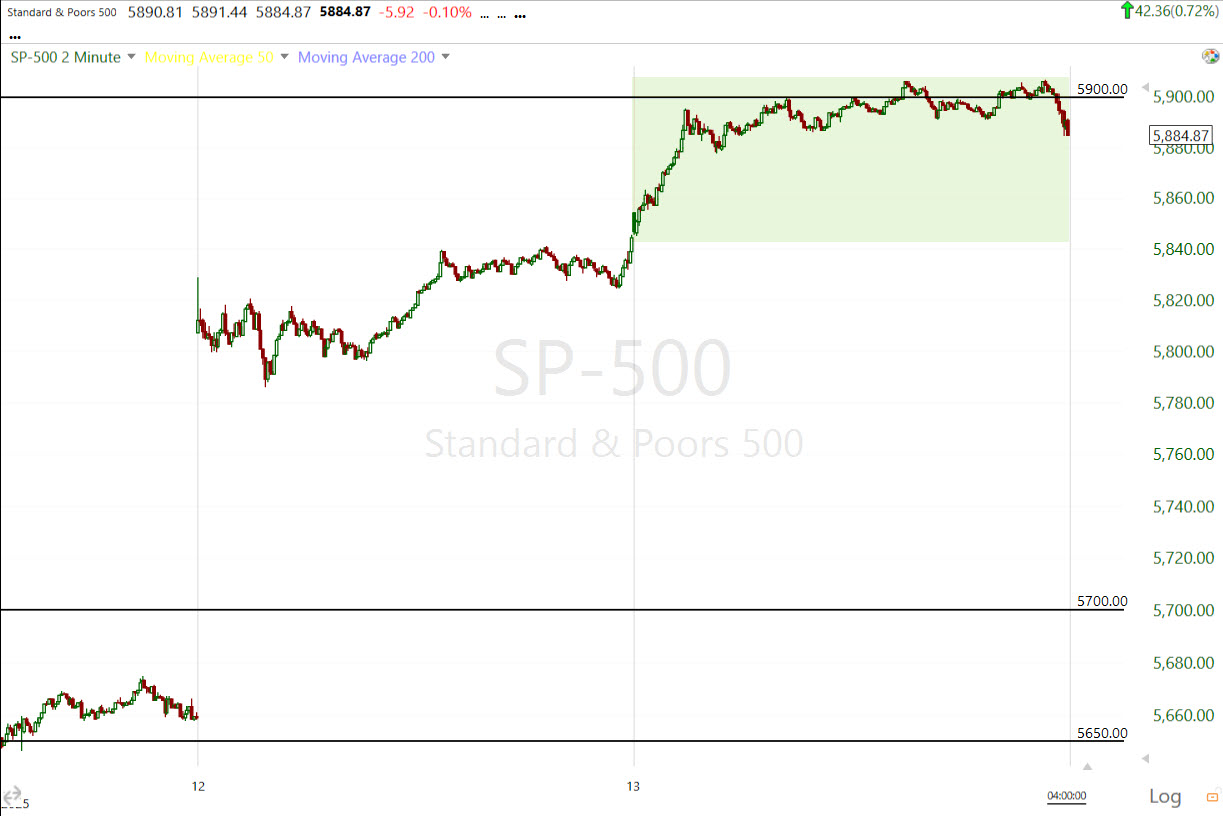
SPX (2m)
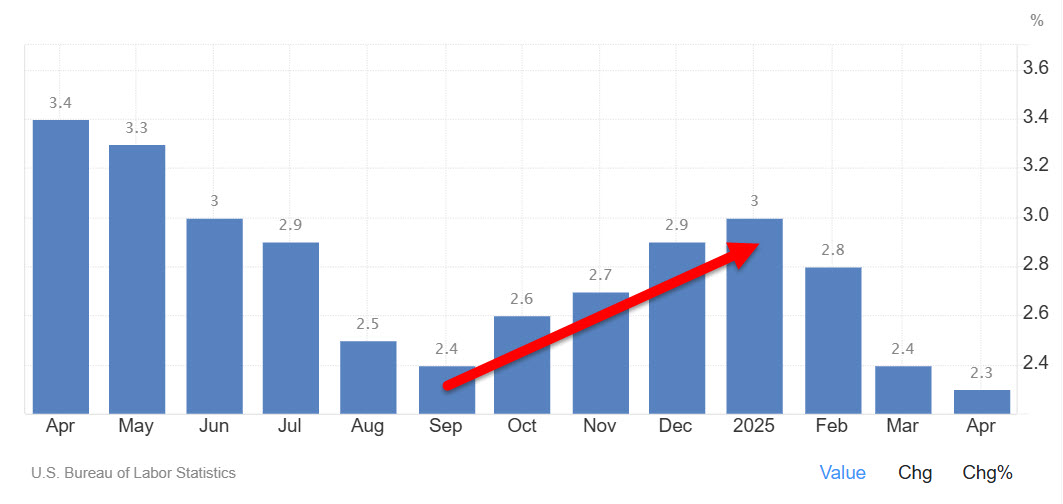
Inflation indications came in much lower than expected with CPI coming in cooler than consensus. September’s bounce in inflation is now well in the rearview mirror.
 The Fed really has no reason not to cut at this point, and certainly more so if we see employment falter. The European Union’s ECB is cutting rates. The Bank of England (BOE) is cutting rates. The Swiss National Bank (SNB) is cutting rates, and the People’s Bank of China (PBoC) is cutting rates. President Trump does have a legitimate foot to stand on when he makes comments like today’s,
“No Inflation, and Prices of Gasoline, Energy, Groceries, and practically everything else, are DOWN!!! THE FED must lower the RATE, like Europe and China have done.
If the Fed doesn’t cut, and certainly if Employment wobbles and the Fed doesn’t cut, it’s starting to look “Political.” Powell says the Fed is apolitical. The guy is a human being and he’s been constantly trolled by Trump in the first and now his second administration. The New York Fed’s former president, Bill Dudley, wrote an op-ed in Bloomberg saying, “The Fed Shouldn’t Enable Trump – The central bank should refuse to play along with an economic disaster in the making.”
You know that my analysis here is not political. Unfortunately, politics does influence the market and I have to cover that.
This article was a really bad decision by a former Fed president because it completely annihilates the credibility of the mantra that the Fed is apolitical. Everything seems pretty calm as far as Trump firing Powell right now, but that could change really fast if inflation keeps heading down and the labor market wobbles and the Fed does nothing, while the People’s Bank of China does everything it can to support China in the trade war. It hasn’t yet, but it certainly could lead to a very ugly episode where the administration does look for ways to fire Powell, which I think would be a disaster for US assets, especially the bedrock of the global financial system, U.S. Treasuries.
The July Fed rate cut probabilities were above the key 50% level, they have slipped below 50% to 38% and now not even the September meeting has 50% probabilities, it’s all the way out to October for the first cut. Of course these probabilities change rapidly, but no rate cuts until October is going to leave a lot of time for a huge, dangerous conflict between the White House and the Fed. Pay attention to what Fed speakers say as they have come out of media blackout.
Averages
The S&P and NDX are just green for the year (+0.1% and +0.9% respectively). Quite a ride so far, huh? That was exactly the message taken from the S&P’s Broadening Top post-election – a market that is losing intelligent sponsorship and being whipsawed by rumors and news.
S&P-500 ⇧ 0.72 %
NASDAQ ⇧ 1.58 %
DOW JONES ⇩ -0.64 %
RUSSELL 2000 ⇧ 0.49 %
The Dow was weighed on by its formerly top-weighted component (now 7th place), UnitedHealth Group (UNH -17.8%), which closed at its lowest level since November 2020 following the news that CEO Andrew Witty is stepping down for personal reasons and that the company is suspending its 2025 outlook as it grapples with higher-than-expected medical costs.
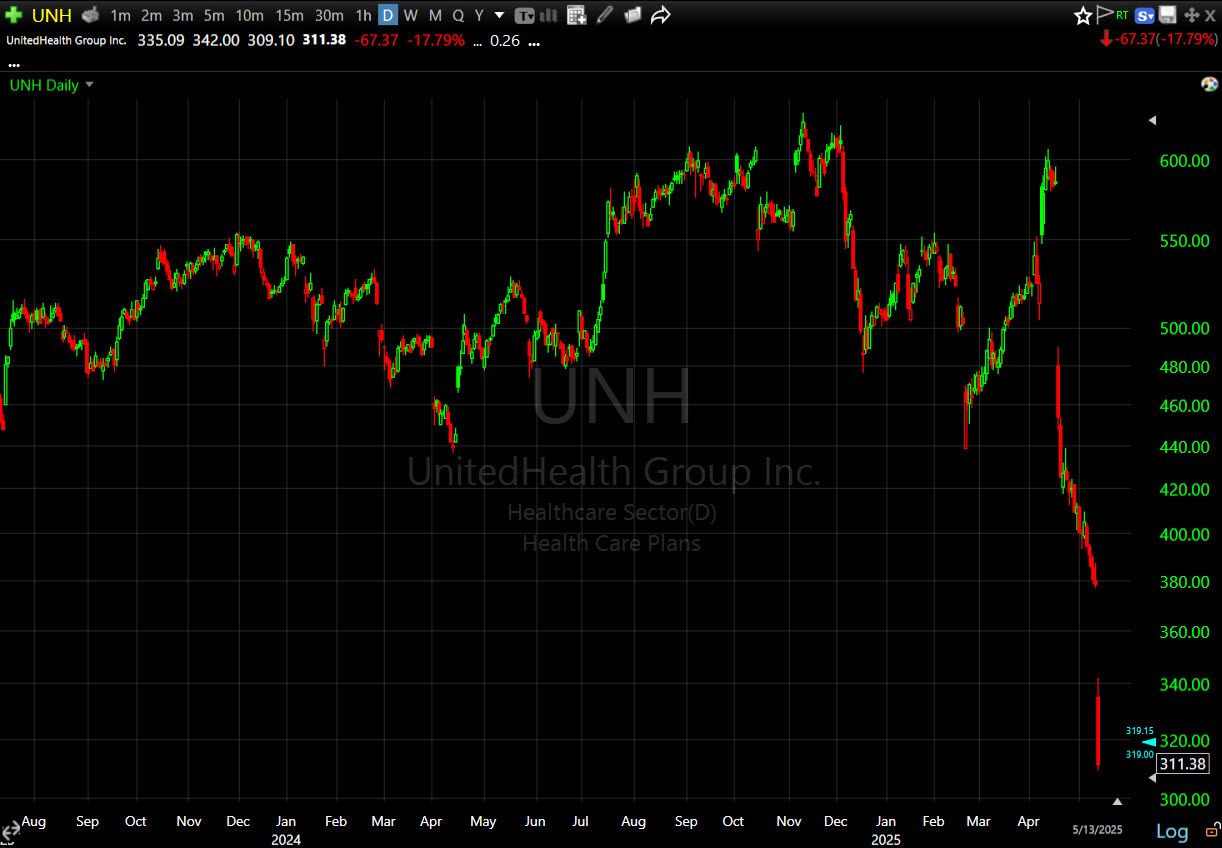 (daily) – This is an absolutely spectacular disaster and reminder that there is still a lot of uncertainty in the market, yet it didn’t translate into broad selling with the mega caps’ leadership on Tuesday.
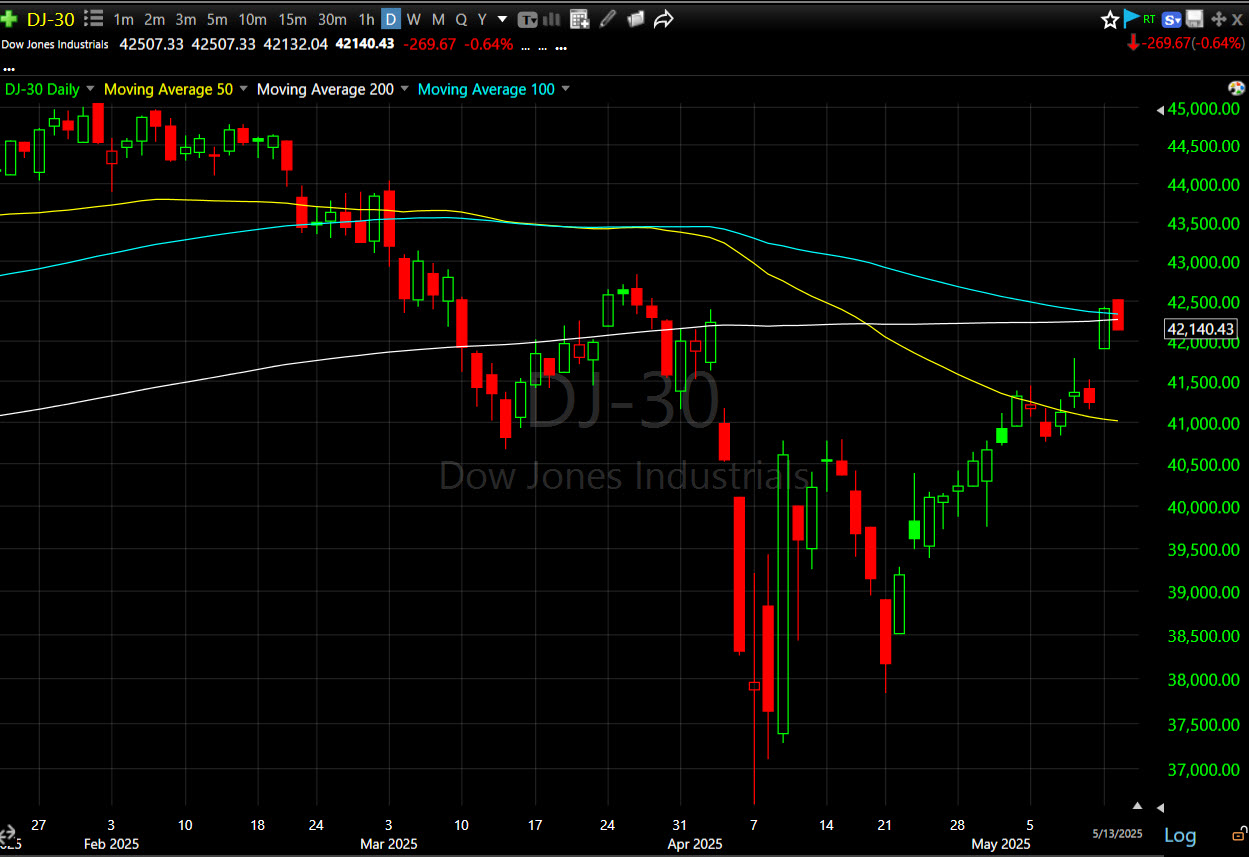 The Dow remains tangled up in its 100 and 200-day SMAs as technical resistance.
After a huge economic growth optimism outburst, supported by short covering yesterday, Dow Transports (+0.25%) slowed their roll today as they neared technical resistance…
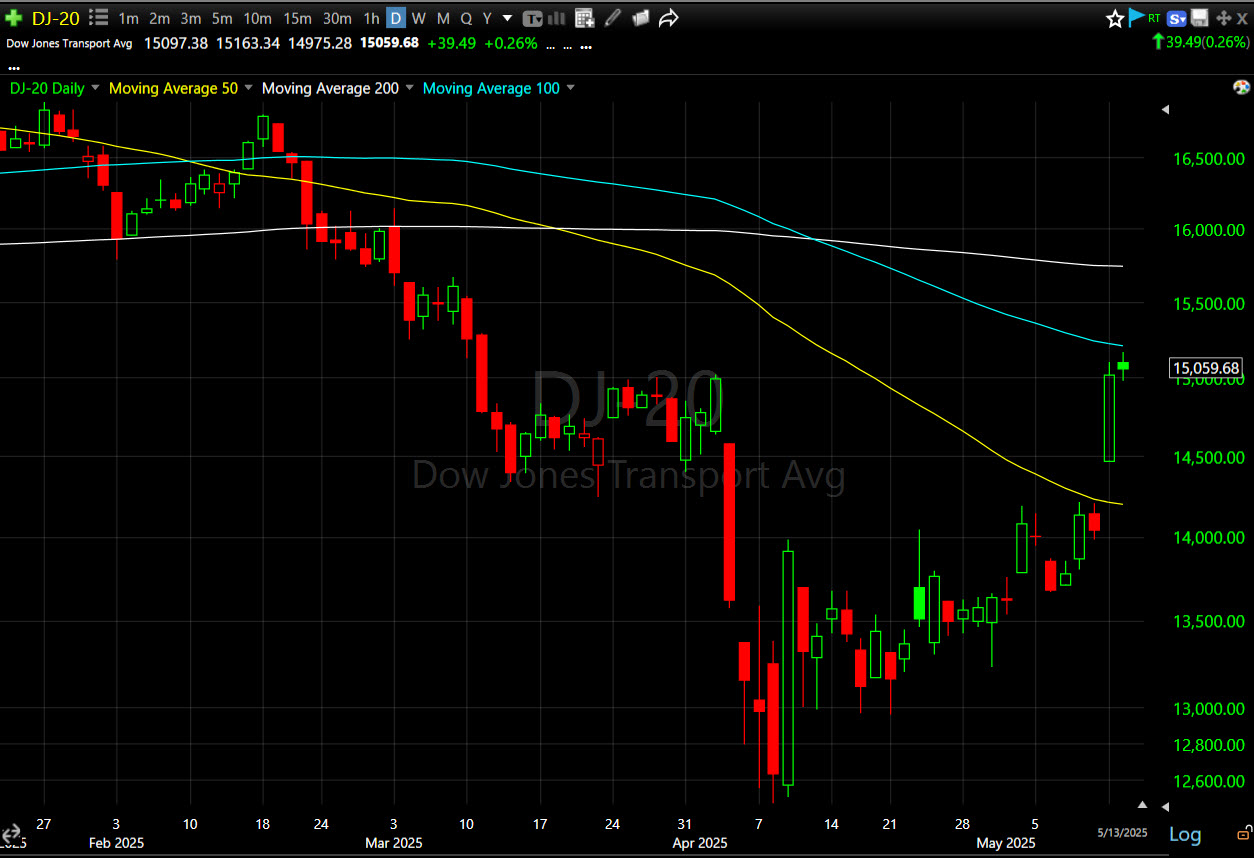 Transports (daily) – near the 100-day.
Small Cap IWM did the same thing…
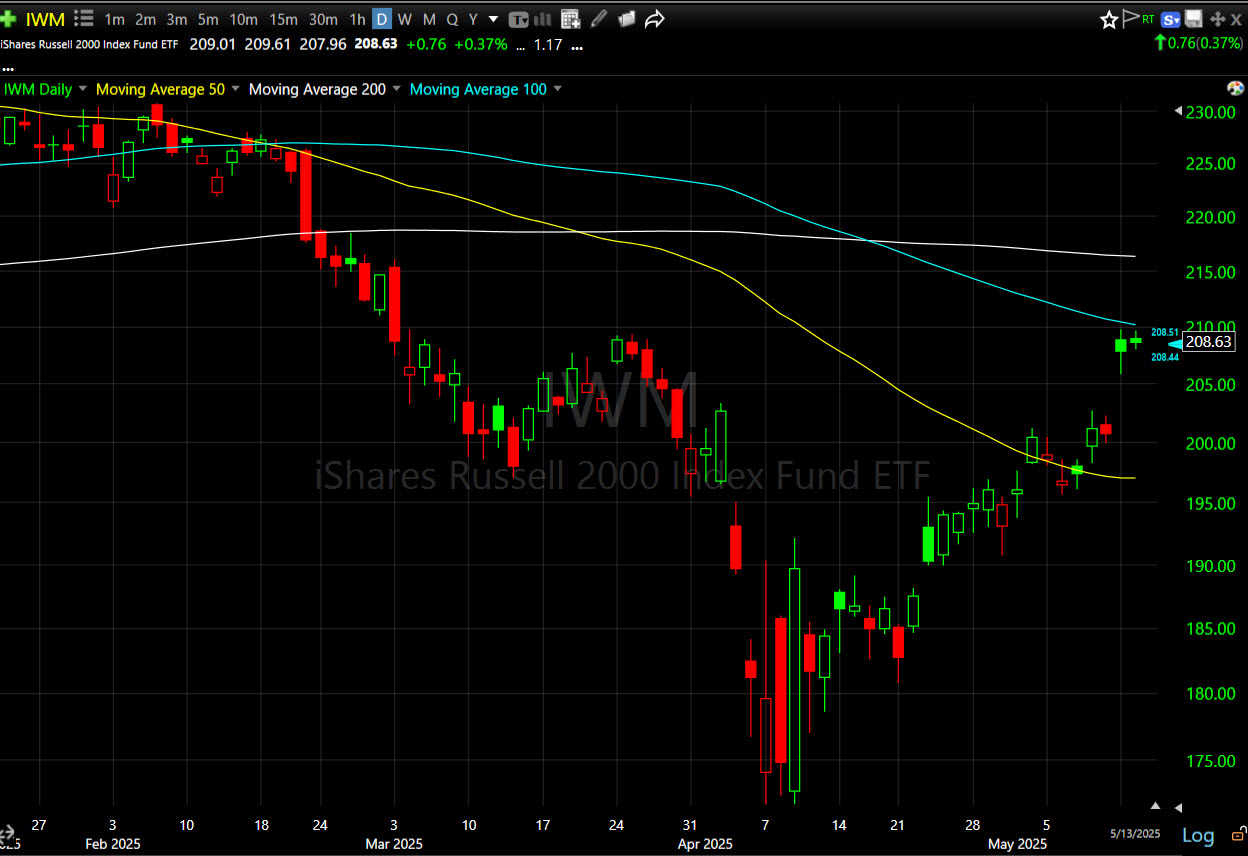 IWM (daily)
Intraday price action looks fine for now, but it’s only a day or so into a potential price consolidation under a technical level of resistance.
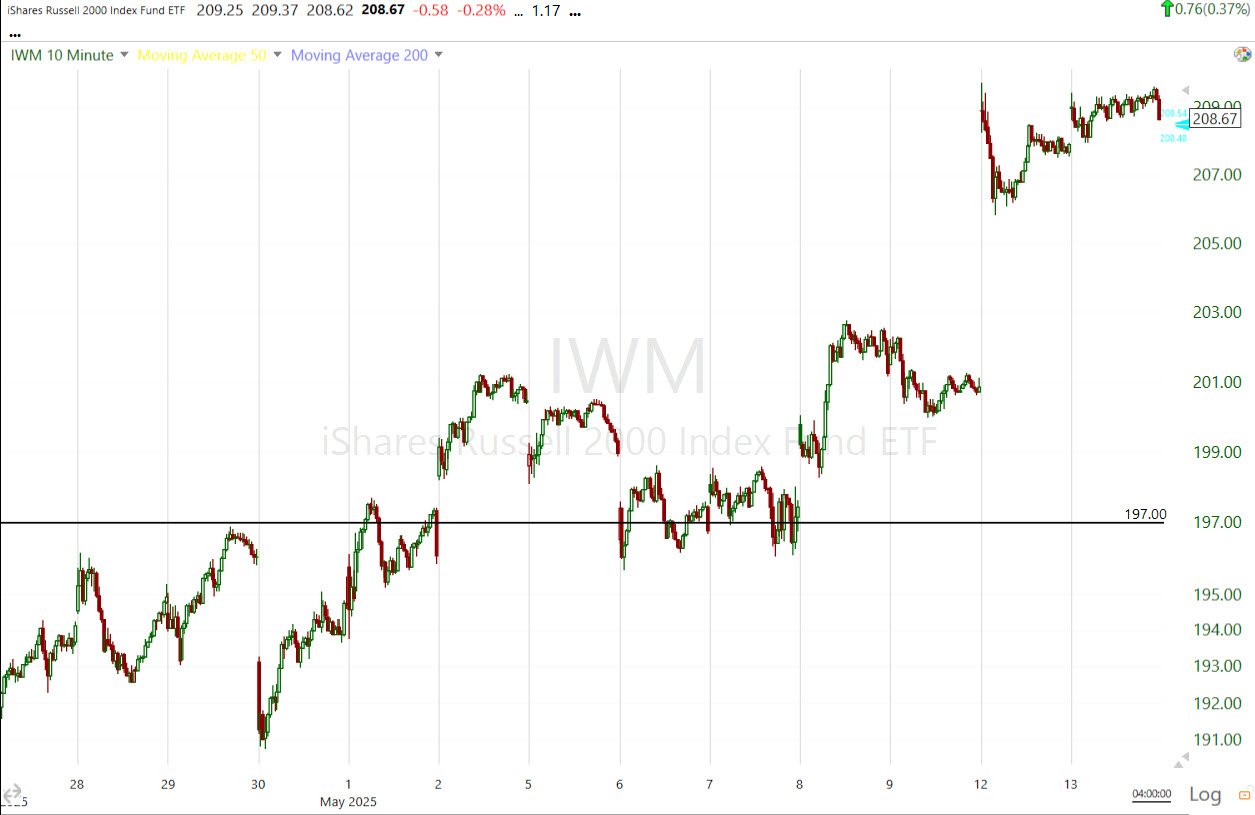
IWM (10m) – Maybe there’s the makings of a triangle or ascending triangle price consolidation. I wouldn’t even hazard a guess this early on. What is not there, is short-term 3C support.
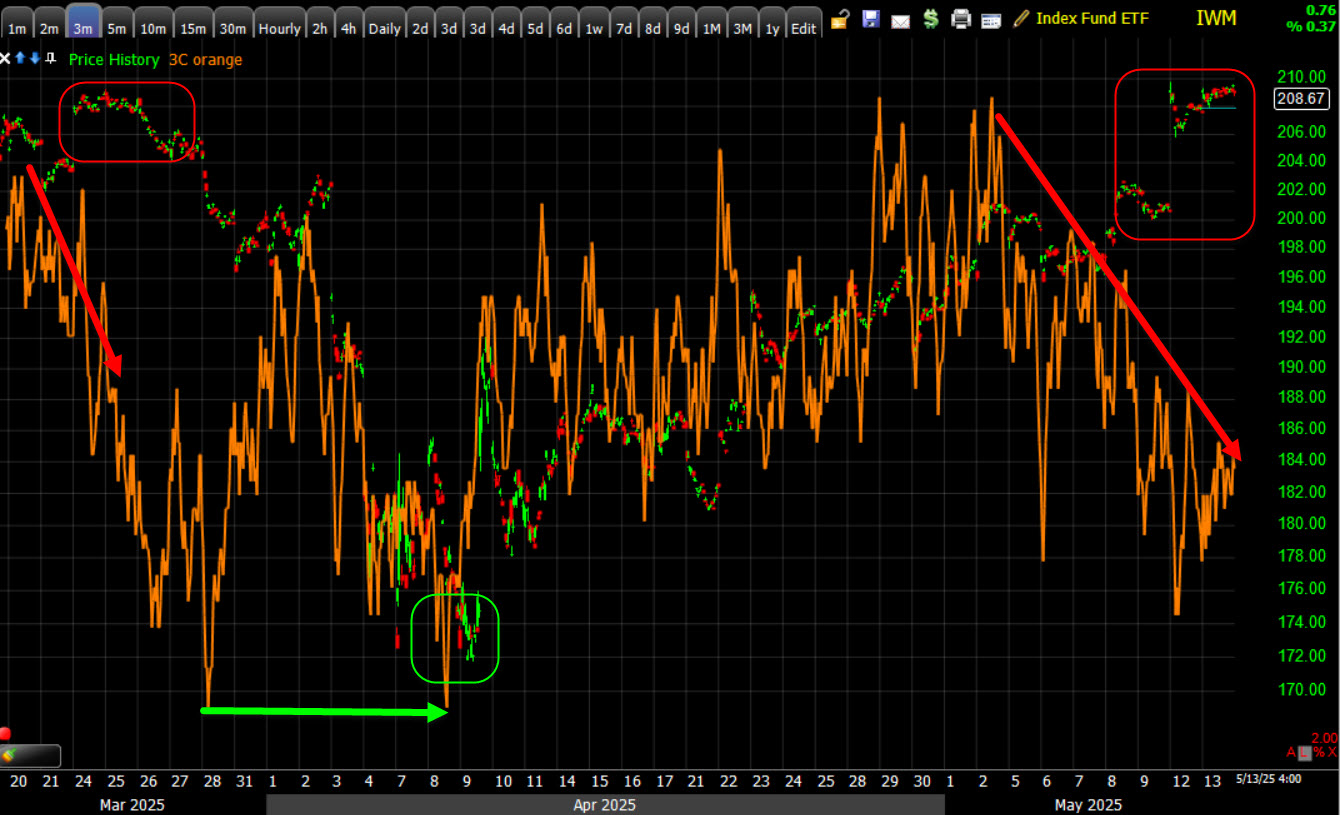 IWM (3m) and 3C – Not getting the kind o support coming out of a bull flag that it should.
What was there, was more short covering in my Most Shorted Index.
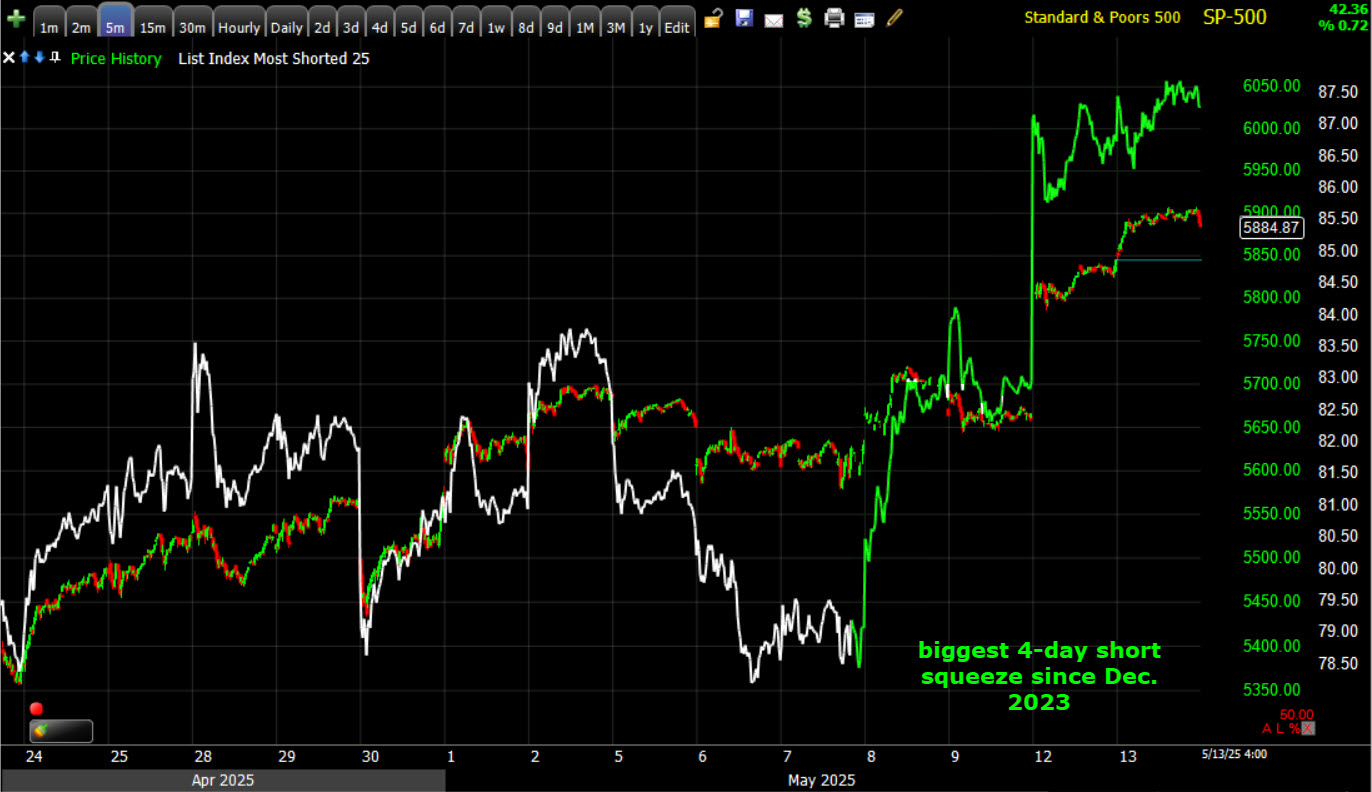 SPX and MSI (5m) – November-December 2023 was that period after the 500-point S&P decline over 3 months from a mid-size H&S top the summer of 2023, and then a massive upside reversal with 5 short squeezes in November-December. Three of them (on their own) qualified as the largest squeeze since the end of the Covid crash.
I reference the decline that led to that reversal and short covering rally below in a link to a video about my Channel Buster concept. This was the biggest 4-day short covering rally since the 500-point decline, and then a Channel Buster reversal that led into the Nov-Dec. short squeeze rally of 2023. This one is pretty spectacular (about 11% in 4 days) and just goes to show how many people (mostly hedge funds) were on the wrong side of the market, short the market and torn to pieces. They need to subscribe and get some 3C information before losing hundreds of millions of dollars! I mean really, $50 a month to save tens of millions of dollars? No brainer, right?
The S&P and Nasdaq-100 both trade above their 200 day moving averages.
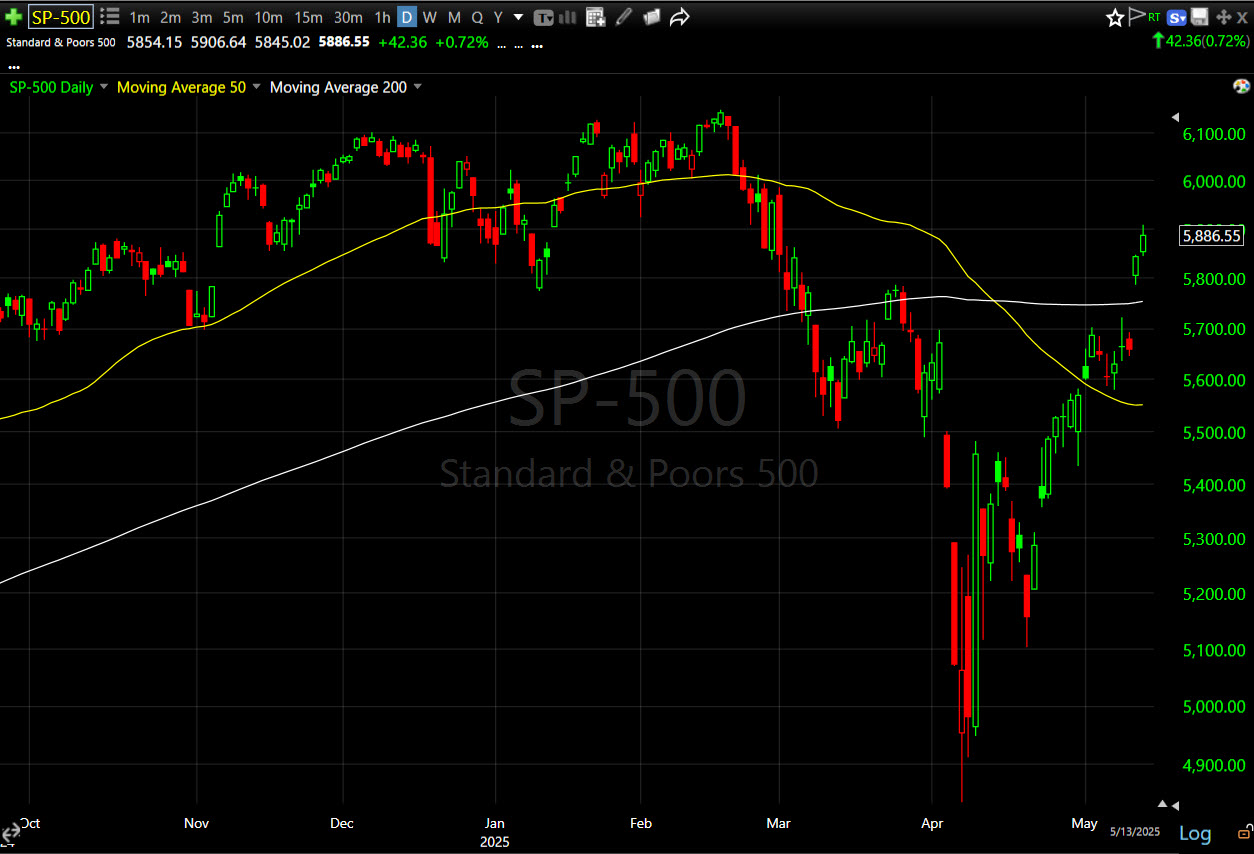 SPX
SPX
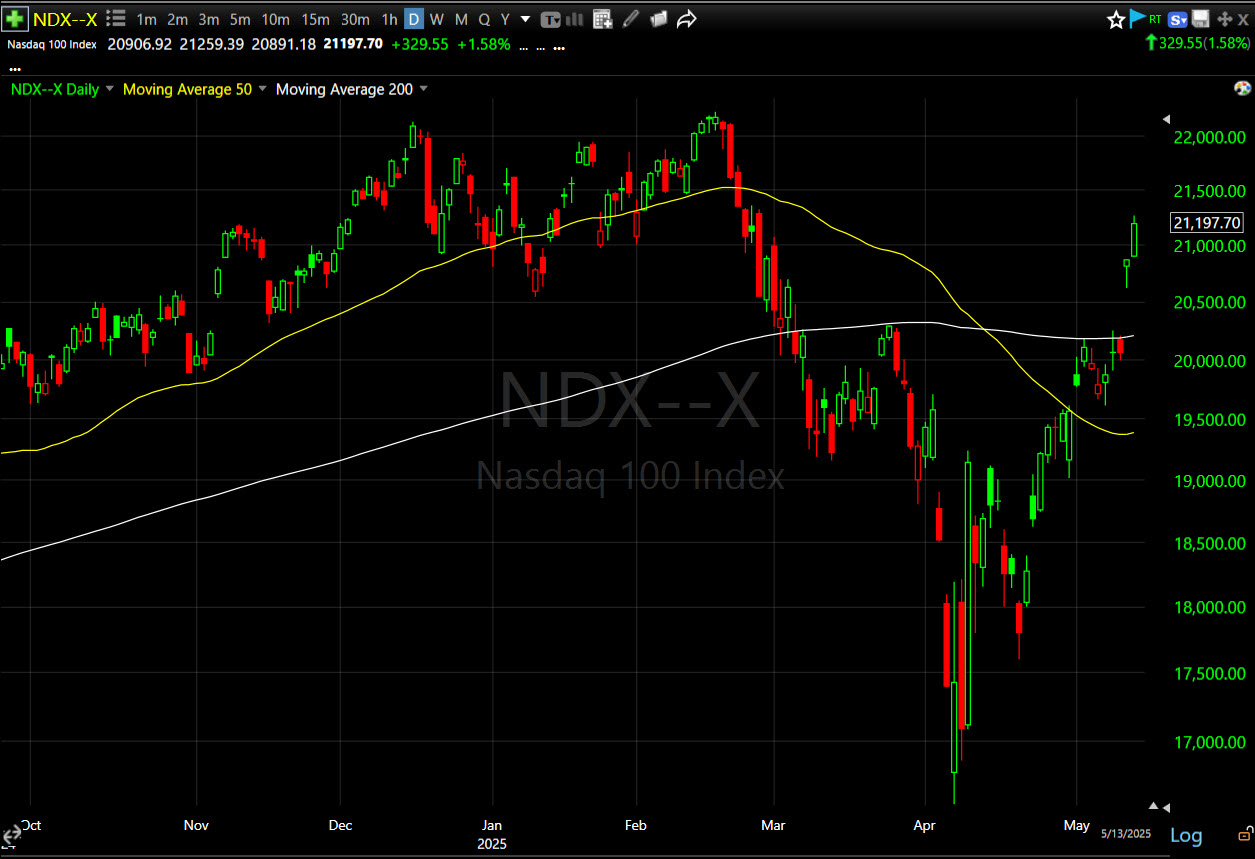 NDX – had a pretty impressive day with a stronger daily candle than yesterday. Today was all about the mega caps.
The problem is that none of them have very impressive 3C charts since the definitive breakout from the bull flag, Monday.
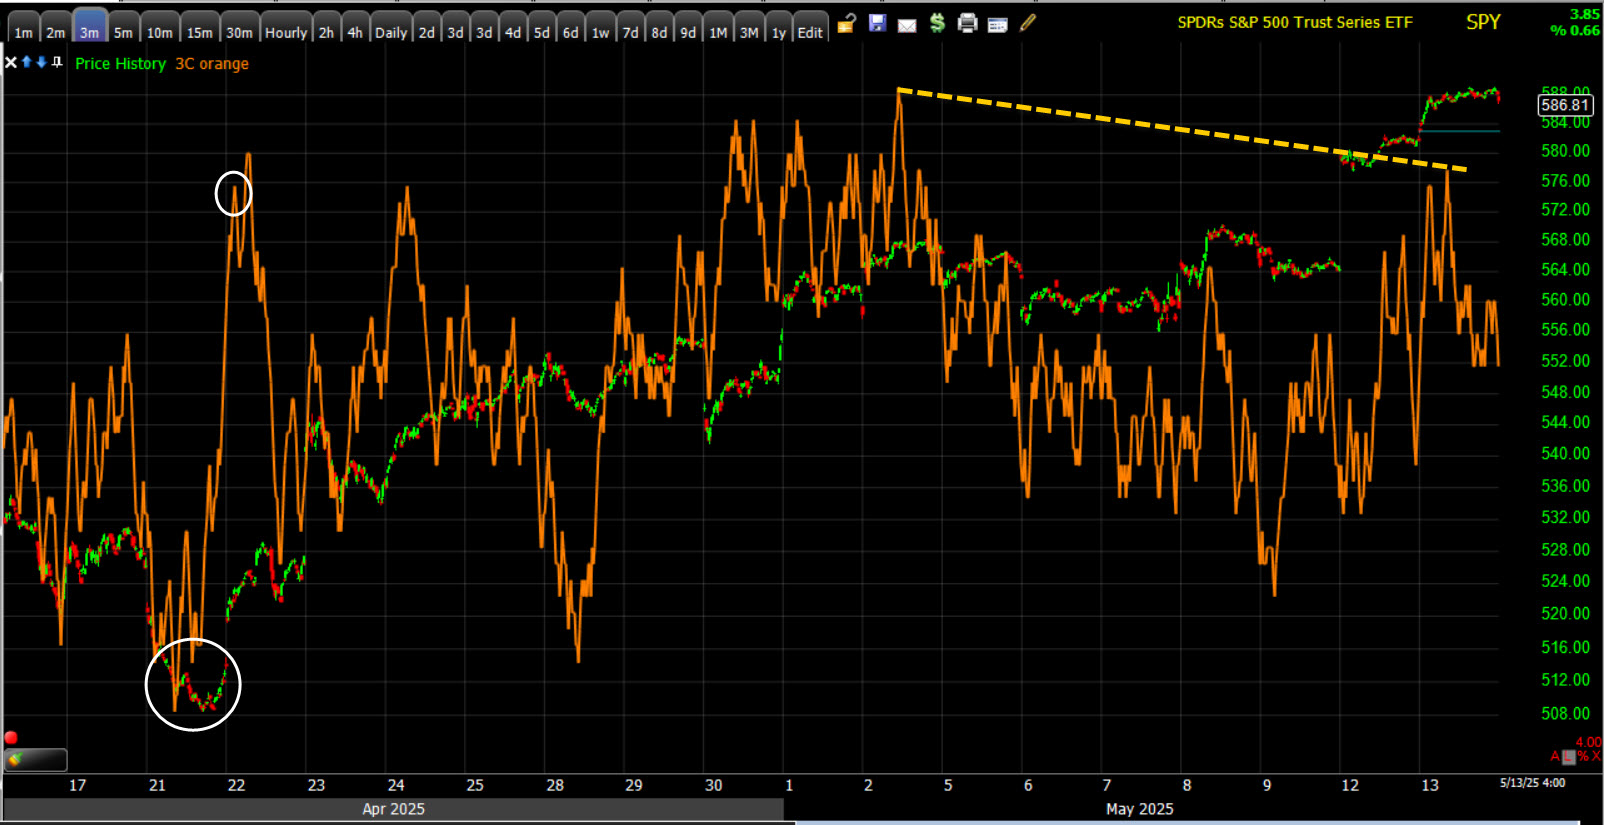 SPY (3m) 3C is not making a higher high with price.
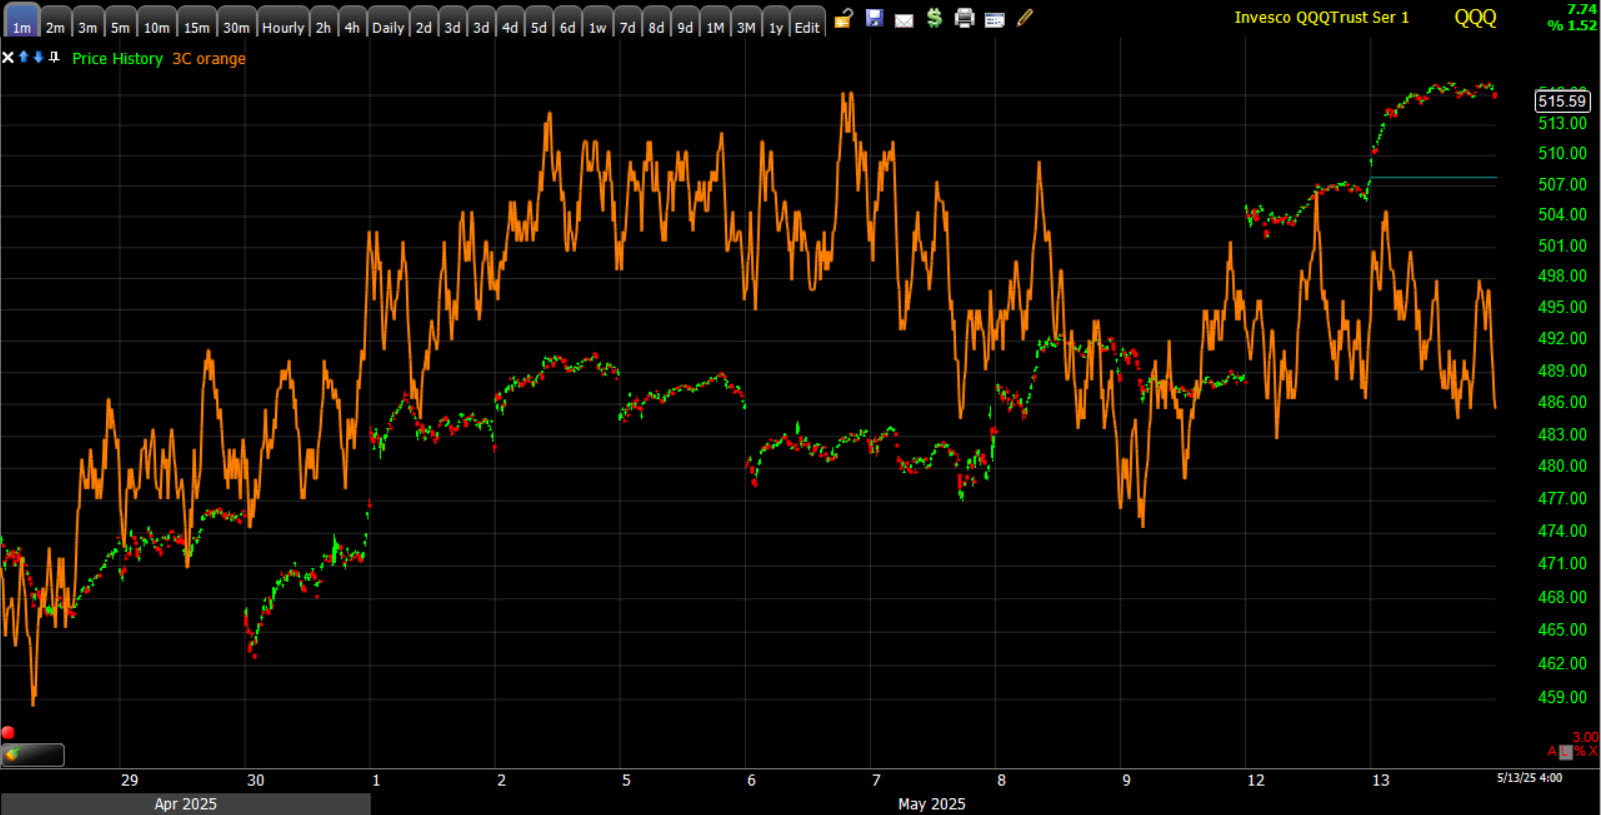 QQQ (1m) – A little faster, more detailed timeframe shows the same for the Nasdaq. 3C is not making a higher high with price. Some charts are uglier and I’m assuming for now that’s just some short-term noise due to Monday’s gap up, but none of the 3C charts look as good as they have, which have been pretty much unquestionably strong and didn’t cause any concern during this rally.
I can’t prove it, but my guess is that those original, well-connected smart money buyers from April 21st, basically bought the so called, “Rumor”, although no one was aware of the rumor, and now, they are “Selling the News” right into a wall of demand from CTAs, hedge funds covering shorts, the whole enchilada. You know who and what I mean.
I think we can still get to SPX $6,000. I think it’s a coin-toss as to whether price needs to consolidate first between here and there, or we just keep running in that direction due to flow and momentum. I am not liking what I’m seeing on 3C charts this week.
VIX (-0.9%) reverted down and reset with VVIX yesterday so we’re kind of starting from a clean signal slate now. Today VIX acted fairly normally most of the day with a little relative strength this afternoon and a touch of relative strength on the day.
VVIX (+4.15%) demonstrated usual relative strength…
 S&P-500 with price inverted and VVIX (5m) – You know the drill. VVIX’s relative performance divergences lead VIX’s relative performance divergences, and VIX’s relative performance divergences lead market pivots or changes in direction (higher and lower). Or, you could say that VVIX leads the SPX’s price pivots, but there’s still the process described above. Very rarely does VVIX alone give a signal, but it’s almost always the first warning bell.
A day is not a trend and I am not thinking this is a big deal yet, but it’s most certainly something to watch as price hits the low end of the measured move target range and is only 100 points or so from the top end of the range. Remember what I expected from the start… that the short-term trend would be higher, but the longer term bigger picture trend would be a move to a new lower low for the year, and just as all of the same layers who sold into the lows, buy into the highs. I see a lot of investment banks turning bullish this week, after missing a thousand point S&P rally!
How long that takes and when it starts, I don’t know yet, but the first step was hitting the upside price targets. Next is determining whether or not the averages consolidate constructively to try to add more to their gains, or we get bearish signals that tell us it’s time to leave the party through the back door, and grab some shorts on the way out.
S&P sectors
S&P sectors were mixed today with 6 of 11 higher, which rules out one day overbought internals. The most heavily weighted sector, Technology, was at the top of the leaderboard with the other two mega cap heavy sectors, Communications and Consumer Discretionary. These are the three sectors that we needed to get to 5900 and all 3 were leading today… again. The lightly weighted, procyclical Energy sector followed along with gains in crude oil.
All four of the defensively oriented sectors ended in the red amid the risk on bias and higher yields.
Mega caps came through again today with another triple digit basis point lead over the equal weight S&P 500. MGK (+1.7%) had a 150bp lead and MAGS (+2.25%) has a 200 basis point edge. This is strong leadership from the mega caps, about 3X the gain of the other 497 S&P stocks since Friday’s close. As I showed this afternoon, they are some of the only 3C charts that are either looking decent or good. As long as mega caps are in the game and displaying this kind of leadership, the market is not going down. They will, of course, be a key area for me to be watching.
Semis did great too with the SOX Index up +3.15%. I still think the SOX index can hit as high as $4950 to $5000, but as I said yesterday I think the oxygen is getting thin up here. Still, this is a much stronger run than I would have expected a month ago.
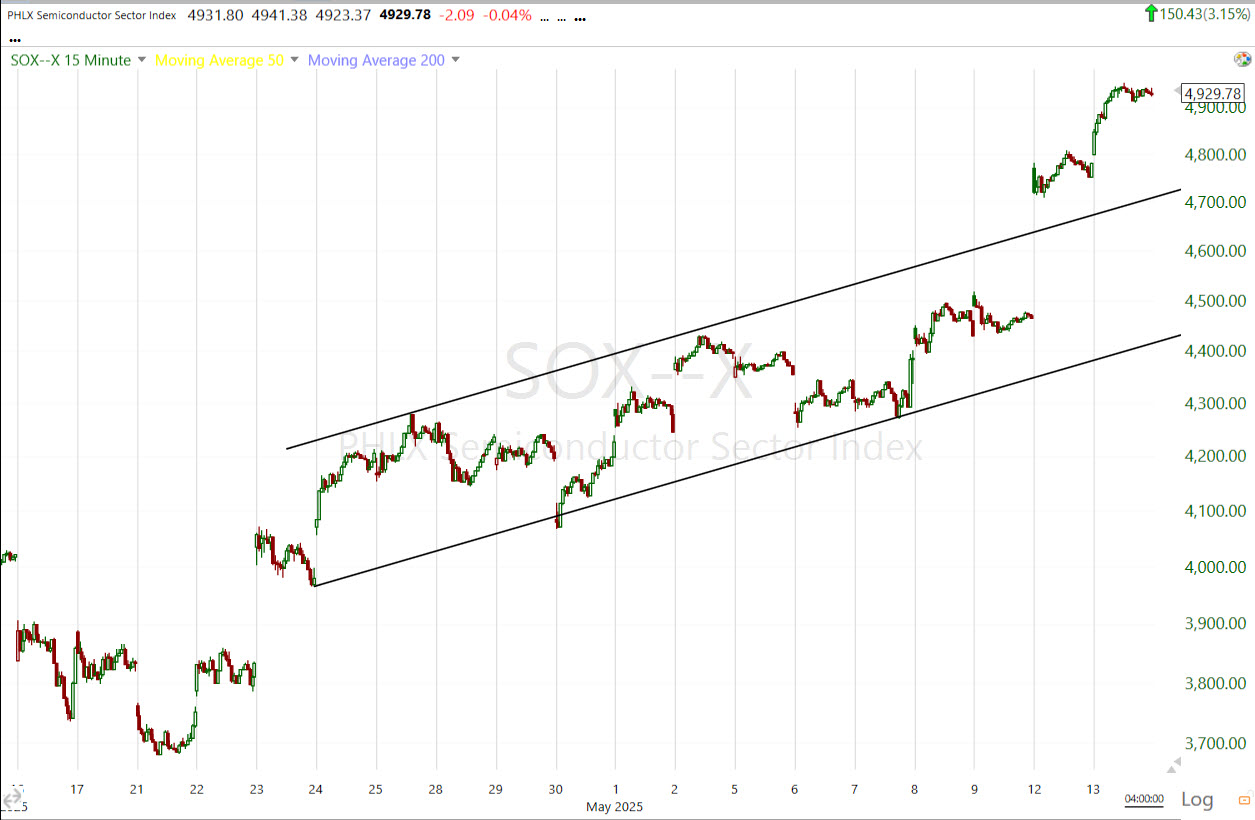
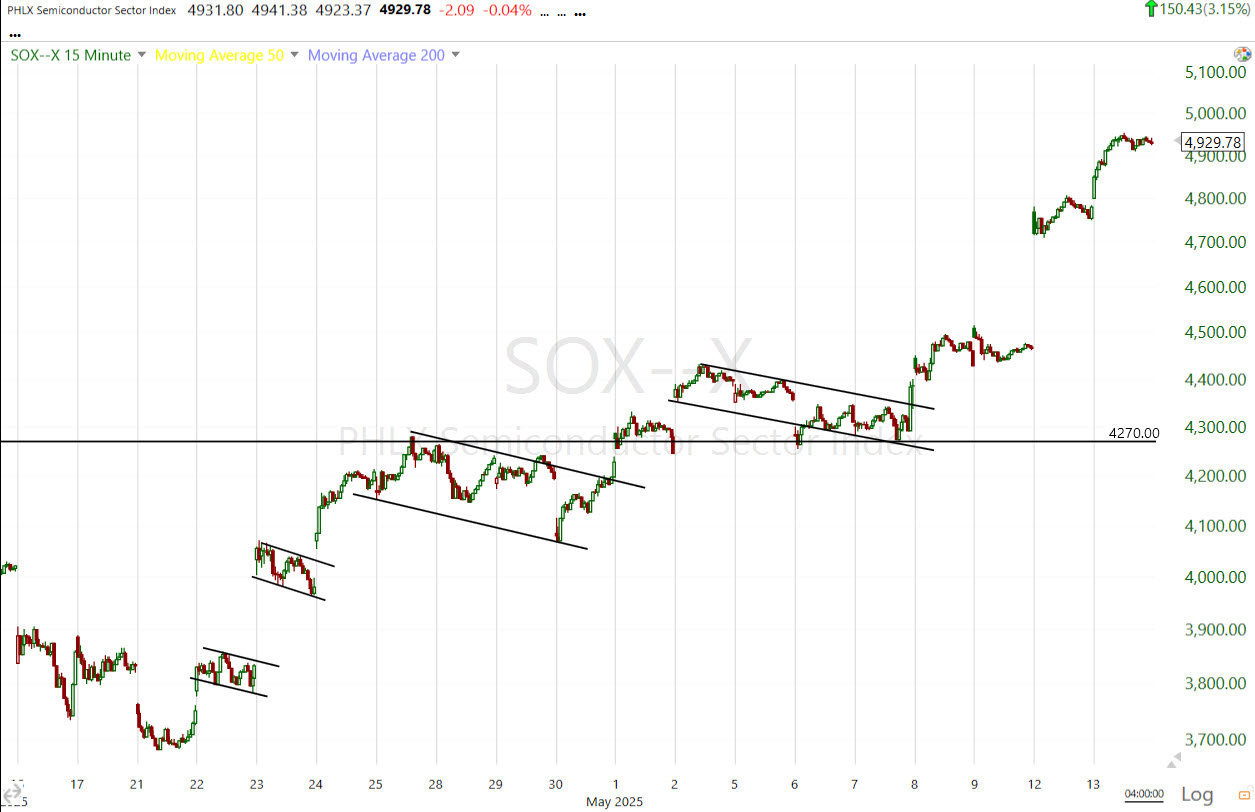 SOX (15m) – This is just flawless bullish price action with bull flag after bull flag, but price is pretty extended here from the last consolidation. We can see that with price popping out of the uptrend channel.
 SOX (15m) – I have a concept called a Channel Buster which is pretty much like the “failed breakout, fast reversal.” I have a short 90 second video on the concept, it’s just the bullish version. Here’s the link to it.
In the example, the bullish version of a Channel Buster was right into the October low and November-December rally that turned everything around for the market in late 2023 heading into 2024 from what was a 500 point decline over three months, so it was a more established channel and a better example of a Channel Buster. It was the literal signal that the bottom was in, but the concept may apply here to SOX in the opposite manner.
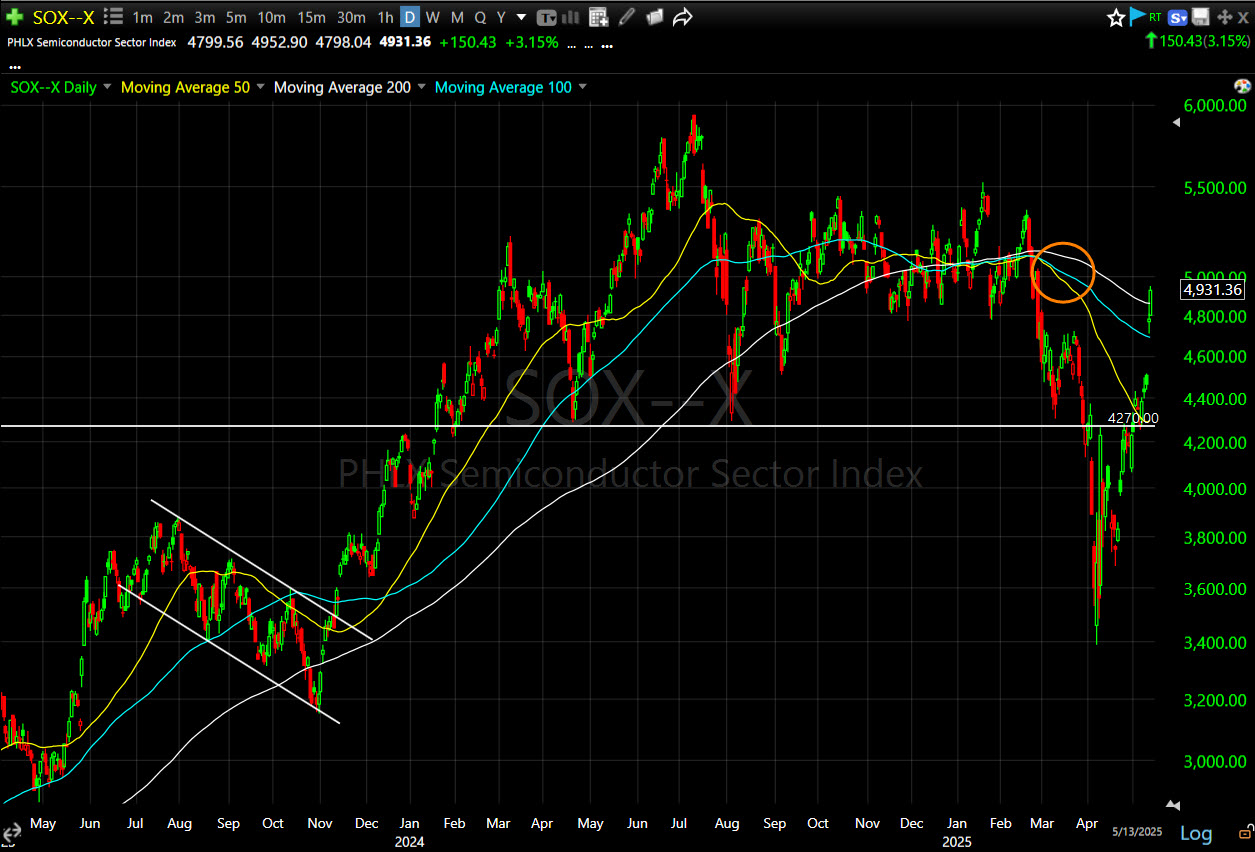 SOX (daily) and the big H&S top and neckline, as well as a trio of moving averages with the 100-day under the 200-day, and the 50-day under them both (bearish rainbow of moving averages). Price is bumping into, or back testing them now. This is still a bearish long term chart.
The Semis 3C chart is not confirming as well as the mega caps I showed this afternoon…
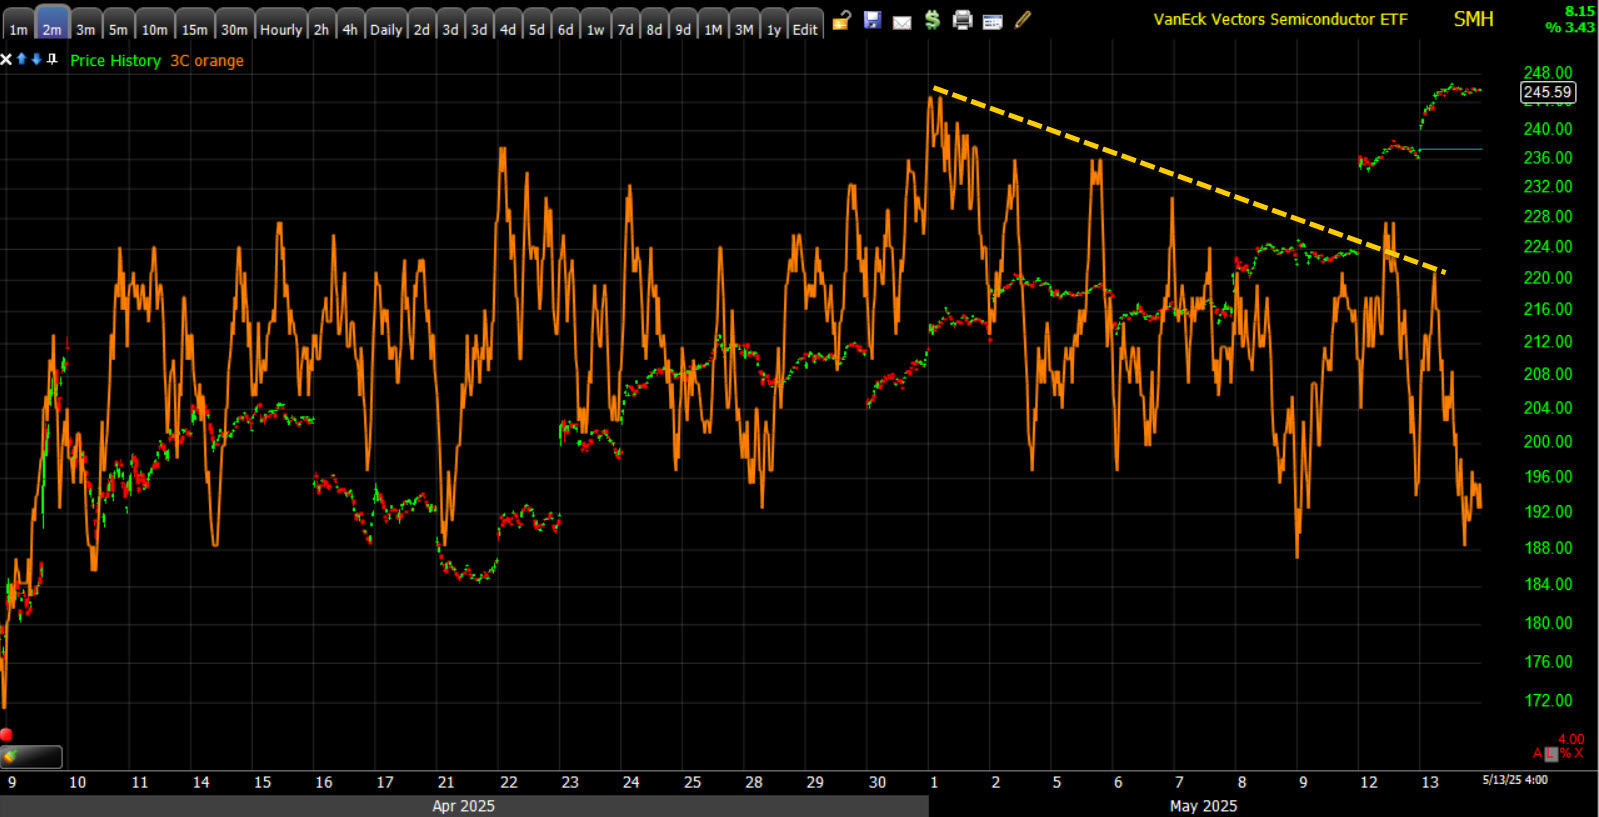 SMH (2m) — Especially where price pops out of the channel, which may lend a little more validity to the idea of a Channel Buster.
However, there are some key semiconductors, like NVIDIA (NVDA +5.6%) — which also happens to be a key mega cap in the Mag Seven group and a standout among the semis today — that still have some pretty tight looking 3C charts in the short term.
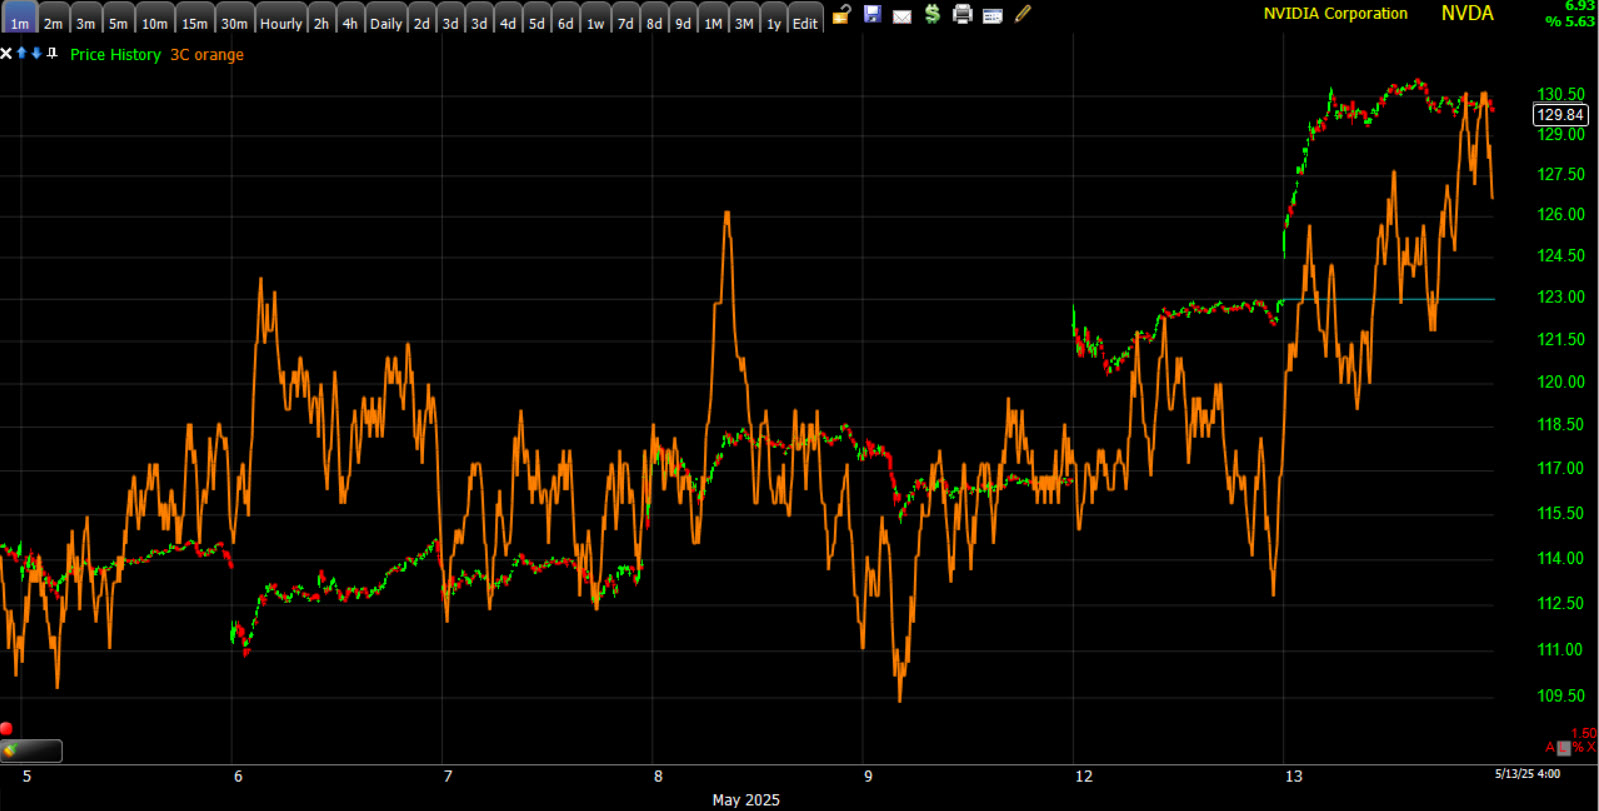 NVDA (1m) – I’d like to see charts like this breakdown first before making a downside pivot call on the semiconductors. Of course it’s very likely that the mega caps would have to break down too before the semis made any significant move lower. However, the semis may stall and be a sort of leading signal for the mega caps and the broader market. The Canary in Tech’s coalmine.
Hopefully you get the gist. There are some signs that say it is time to pay attention. There are also some pretty strong charts out there as well.
Materials ⇩ -0.50 %
Energy ⇧ 1.41 %
Financials ⇧ 0.41 %
Industrial ⇧ 0.70 %
Technology ⇧ 2.16 %
Consumer Staples ⇩ -1.35 %
Utilities ⇩ -0.14 %
Health Care ⇩ -3.01 %
Consumer Discretionary ⇧ 1.32 %
Real Estate ⇩ -1.34 %
Communications ⇧ 0.98 %
Internals
Participation was not great today and that was one of the pockmarks on the day’s tone. Advancers (1631) edged out Decliners (1052), but on a much smaller margin than recent trade. Volume was decent at 1.2bln shares, but down slightly.
S&P sector performance and internals both rule out 1-day overbought internals. Still, I ran the scan.
The Dominant price/volume relationship was fairly dominant — not a blowout, but it would have counted today — coming in at the weakest of the four relationships… Close Up/Volume Down.
No red flags, but a change in market tone.
Treasuries
The 10-yr yield settled 4 basis points higher to 4.50%.
While inflation may not be a current problem, the 10-yr yield above Treasury Secretary Scott Bessent’s red-line at 4.45% for the 10-yr, is.
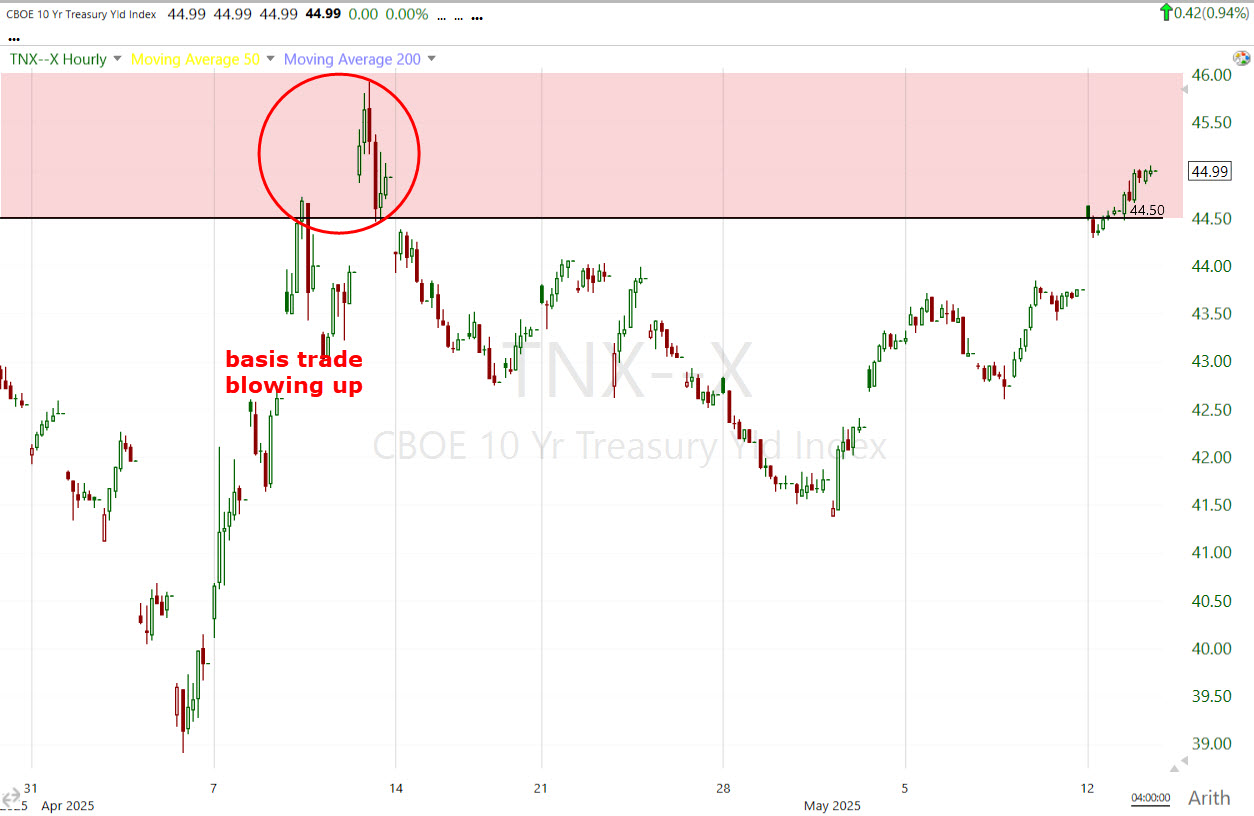 10-yr yield (60m) – Bessent needs to rollover a lot of debt this year and the administration wants to do that at the lowest yield possible. This is his no-go zone at 4.45%.
This run higher in yields has not been a reflection of current inflation expectations, but rather a new emerging narrative of economic growth expansion from the exact opposite a few days ago.
Yields have had a positive correlation with stocks. You may recall in 2023 and 2024 most of the time yields had a negative correlation with stocks due to inflation and Fed rate hikes. As yields went higher, stocks moved lower. That’s a negative correlation. It has been the exact opposite of late with a positive correlation, but at some point higher yields weigh on stocks’ earnings, valuations and more. This is a rapid re-pricing of the new trade-war developments.
Remember my Copper-Gold ratio chart that says, “yields should be much lower,” and in my view the only way yields go 300bp lower is recession (Growth and Inflation slowing). That hasn’t changed overall.
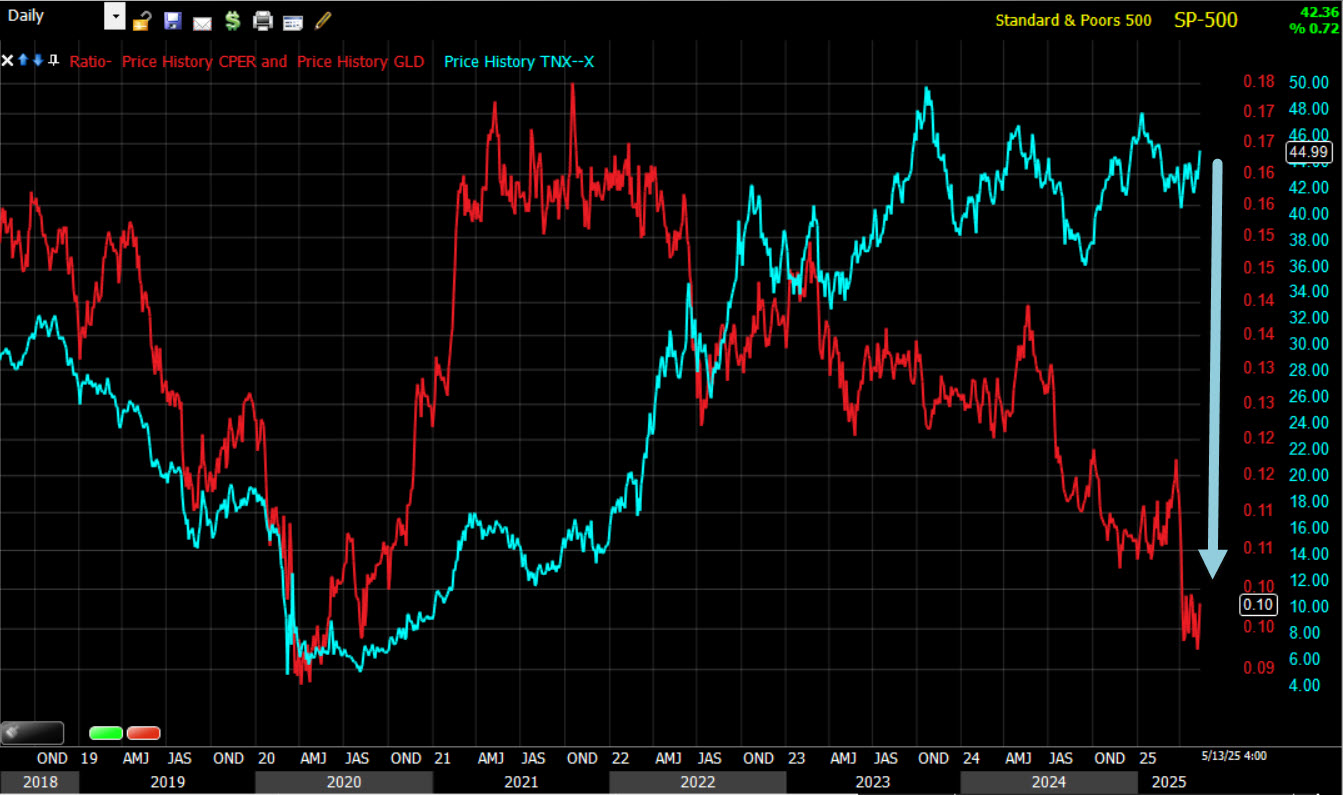 Copper-Gold Ratio in red and 10-yr Yield in blue.
However, if we look at recent movement on a 60 min chart…
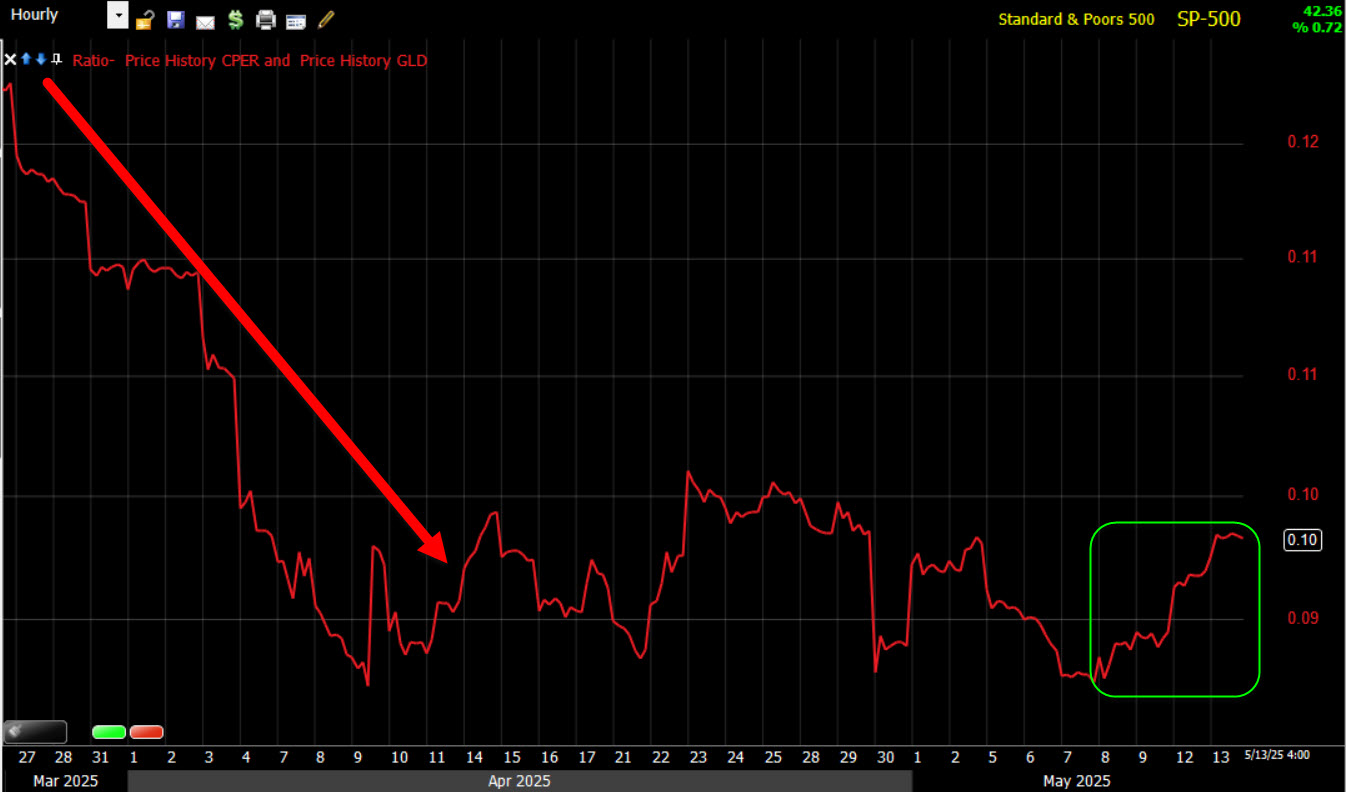 We go from a deflationary or stagflation trend to a minor bounce representing growth. I show you this just to keep the recent optimism around economic growth, in perspective. The whole yield curve is up 10-12 basis points on the week. That’s not exactly a new economic expansion. The near blow-up of the financial system (around the basis trade and China/Japan selling U.S. treasuries) saw a 60-70 bp jump in a little over a week. That wasn’t reflecting growth, that was a VAR shock that could have wreaked massive economic damage if President Trump didn’t do an immediate u-turn on “Reciprocal Tariffs.”
Below we’ll look at what yields are telling us in the very near term with this rally.
Rate cut expectations have come down all week and sit at -51 bp for the year, or exactly two rate cuts from the Fed.
Currencies and Commodities
The U.S. Dollar Index ended lower by -0.85% after its big, but brief, short squeeze yesterday. I’ll touch on this below in terms of what it means for the broader market. Gold got a little relief from the decline.
WTI Crude oil closed up +2.75% to $63.63 and is acting, “growthy.” We can now see the potential “W” base I’ve been talking about fleshed out better on the price chart.
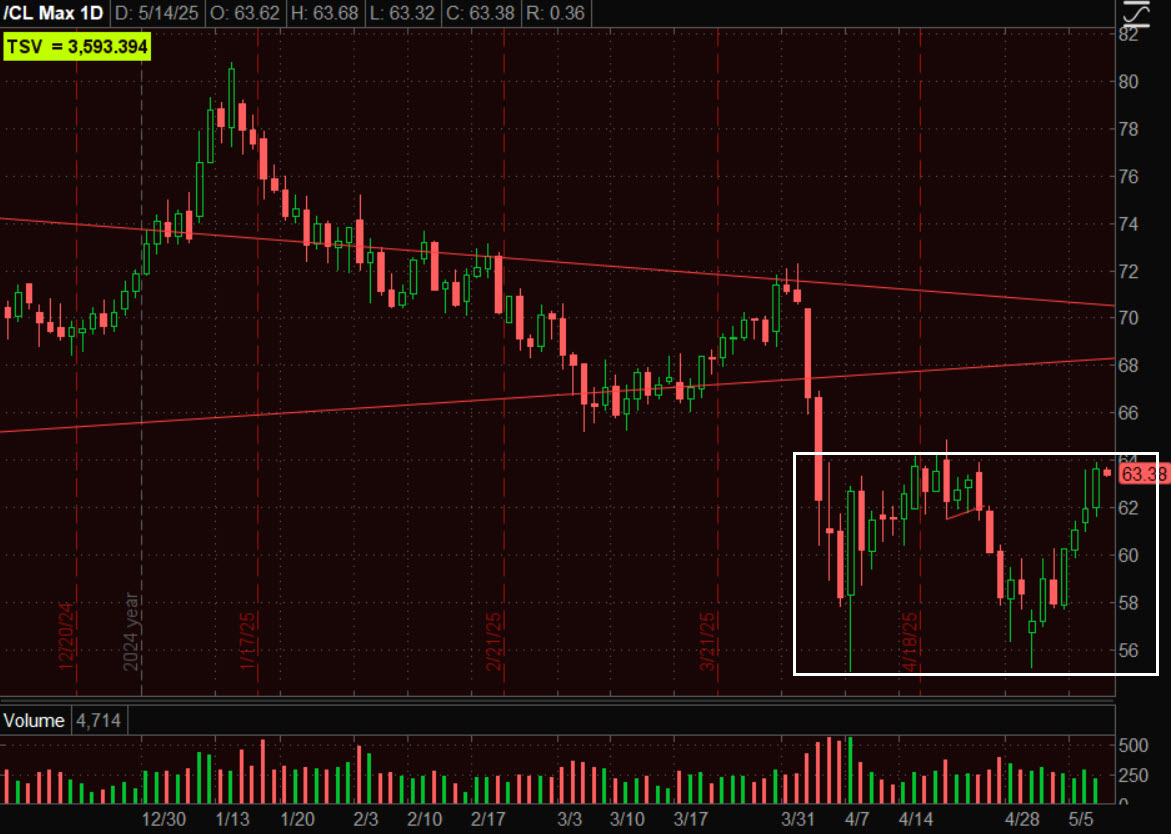 (daily) – If this is a little W bottom, and I have found it a little hard to believe considering how badly crude has been acting, then we want to see price pull up to the top of resistance and put in a small bull flag or other bullish consolidation just below. There’s roughly a 9 point measure move on a breakout above $64. That would put price up around $73! Whatever my personal opinions are don’t matter, this does look like a valid W bottom and it looks like price is going to break out. May be worth a look if you can catch it early on the breakout or in a small bullish consolidation just below that 64 area. Then you can put a tight stop on it and give it a chance. It’s also a goo leading indicator for whether the market has some more legs under it to run or not.
Gold futures closed +0.4% higher to $3,254.50/oz, but price action near term is bearish. Everything about this week has diminished gold’s appeal as a safe-haven asset. Remember when gold was soaring and I was warning almost nightly that price was getting, “too parabolic”? Deep declines that we have seen recently are the result of price getting too parabolic and not having spent time to build in support along the way that would come in handy now. We are seeing the result of exactly what I was warning about all of those nights in the Daily Wrap.
I think gold has more downside to go. Price is acting bearish in very near-term trade.
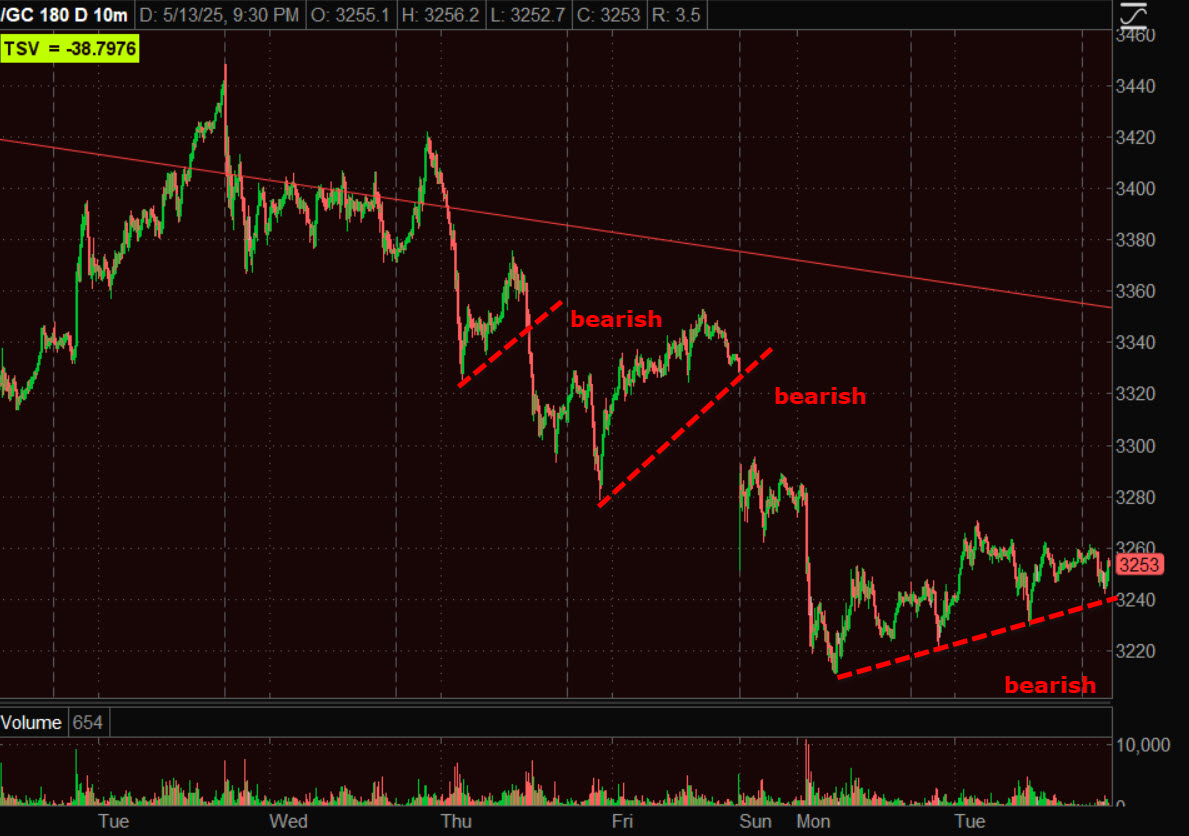 Gold futures (10m) and a number of bearish flags on the way down. Gold should probably see another 3% leg down just from this latest bearish consolidation.
If you are long term bullish on gold, then I wouldn’t worry about it too much. Gold looks like it is on its way to test the bottom trend line of a large bull flag. That large bull flag was needed due to price getting too parabolic. A big consolidation was needed and that is what we’re getting.
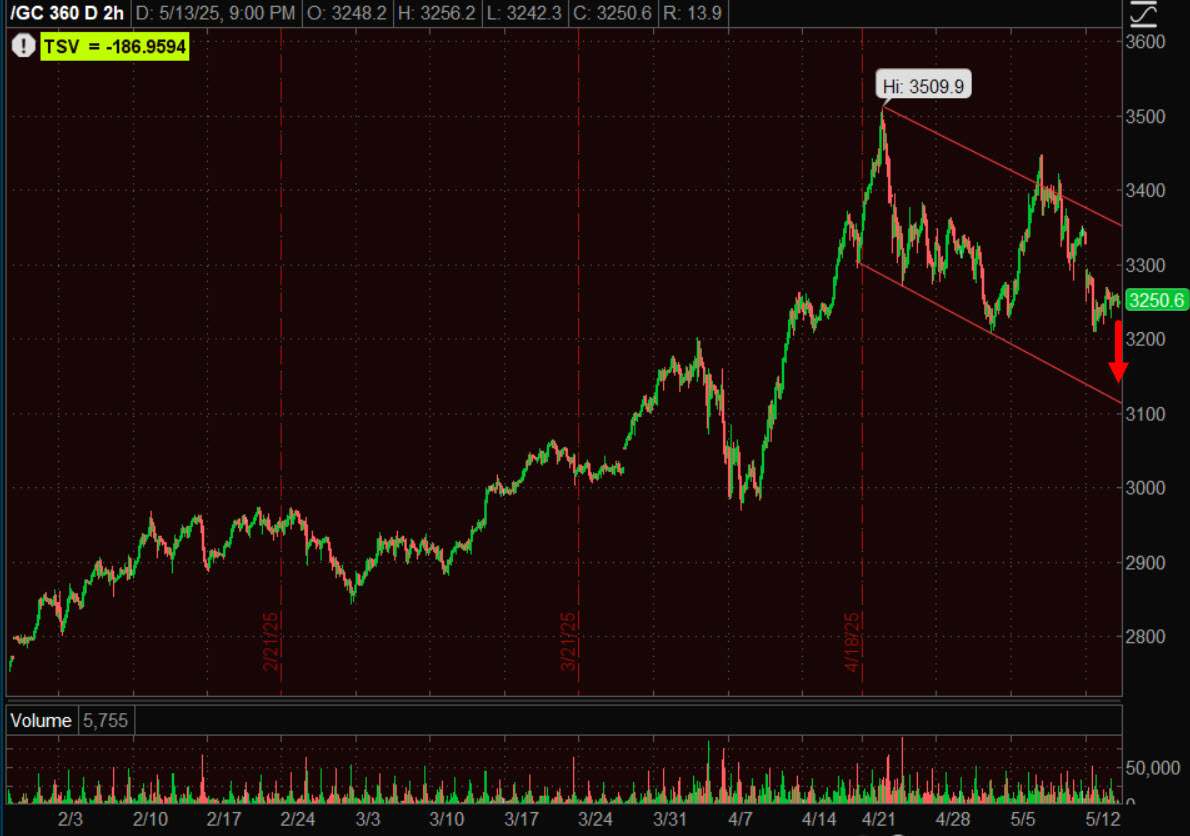 Gold (60m) – Ideally, gold doesn’t go all the way down to the lower trend line of the bull flag, but rather finds support around $3200. It can dip below that and come back up and that’s fine too, but some of the strongest bull flags won’t touch the lower trend line on the last pivot. They’ll make an equal low (compared to the last pivot low) or a slightly higher low. If price does head down to test the trend line, that’s fine too, but the scenario described would be more ideal.
URA added another +2% today
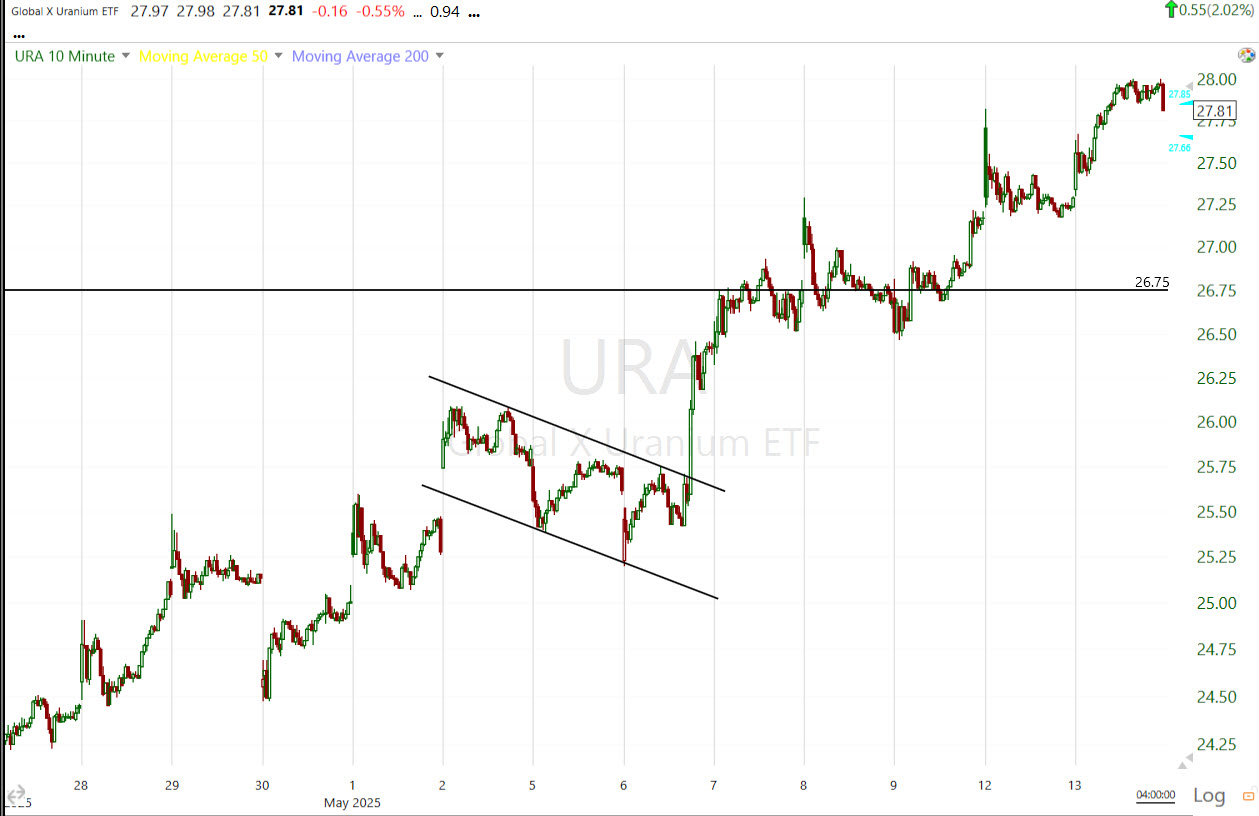 (10m) – This is a thick zone of overhead supply above $26.75, so price action is looking pretty good considering. URA has held support at its 200-day each of the past two days. A decent start and the price trend looks good.
Bitcoin gained +1.3% today, finding support in the mid 101k area and popping back up toward $105k.
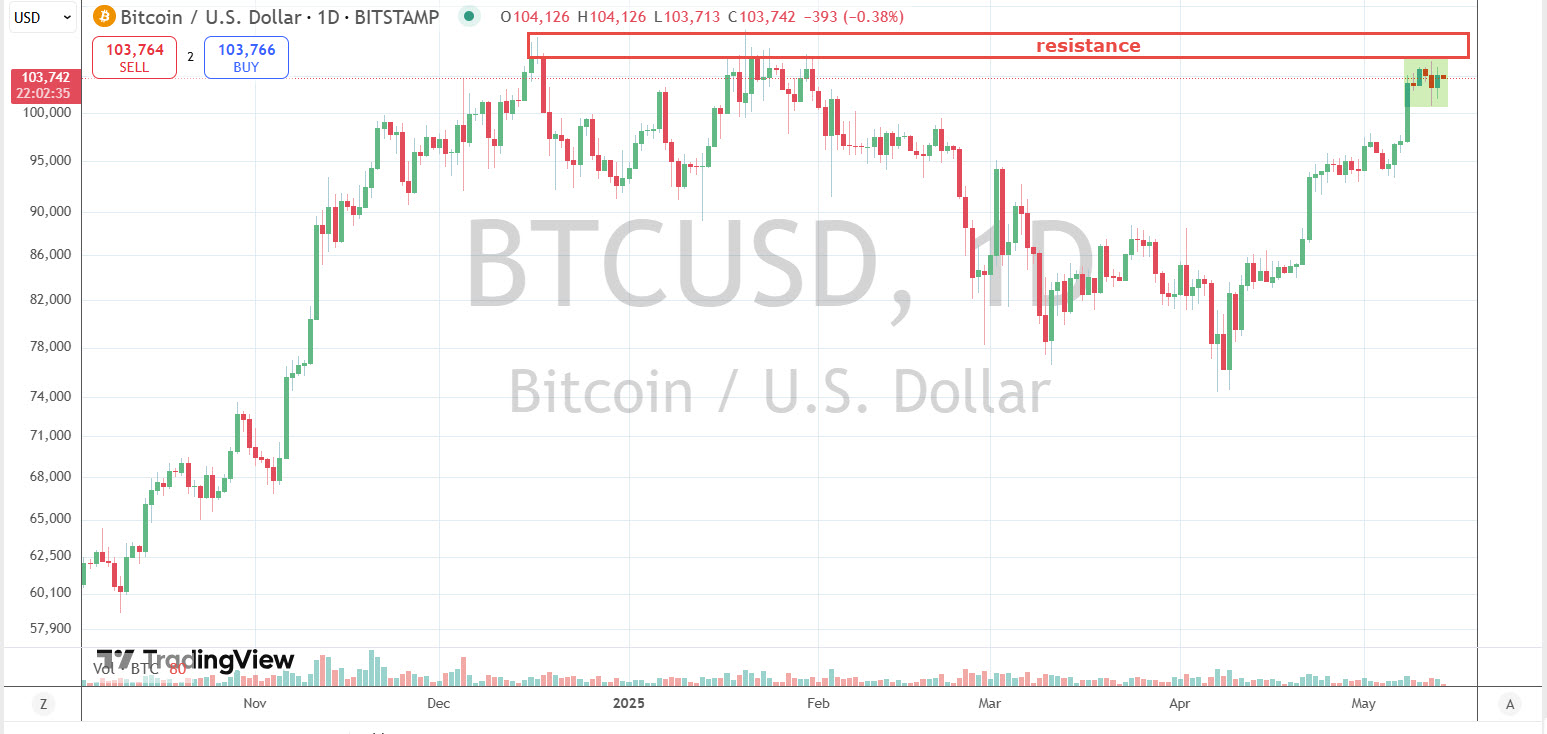 (daily) – I guess we can call this area in green a bullish consolidation, although when you look at it on an intraday chart it’s not fantastic, but it’s something and it’s right below key resistance. That’s what I’ve been saying Bitcoin needs to do here. Think about the consolidation in terms of a spring that is being coiled up to release energy and take a crack at breaking through that resistance.
Summary
I’m gonna try to freestyle this. I am not tactically bearish on the market. I see some things that don’t look great popping up this week, but I think there’s still potential for a lot of flow related buying…CTA’s, Buybacks, etc.
Sure, the upside action today was also helped by a fear of missing out (FOMO) on further gains, momentum after the notable de-escalation in the trade war with China, and an April Consumer Price Index that lacked any tariff inflation shock. Also, the news that Saudi Arabia, in conjunction with President Trump’s visit there, announced a $600 billion investment plan in the U.S. However, I think the flow of funds (short covering, CTA buying, funds that have hated this rally and very underexposed to stocks playing catch-up) would have brought us here to SPX $5900 even if none of that happened (assuming CPI didn’t come in super hot).
The mega caps’ leadership is key. The semis may, like they have before, act as the canary in the coalmine for Tech… a leading indicator.
Yields are still in a pretty good place and reflecting optimism around economic growth.
 S&P futures (5m) and a proxy for the 10 year yield in blue. Confirming pretty well, excited about economic growth prospects in the wake of the big reversal on China tariffs.
The Dollar?
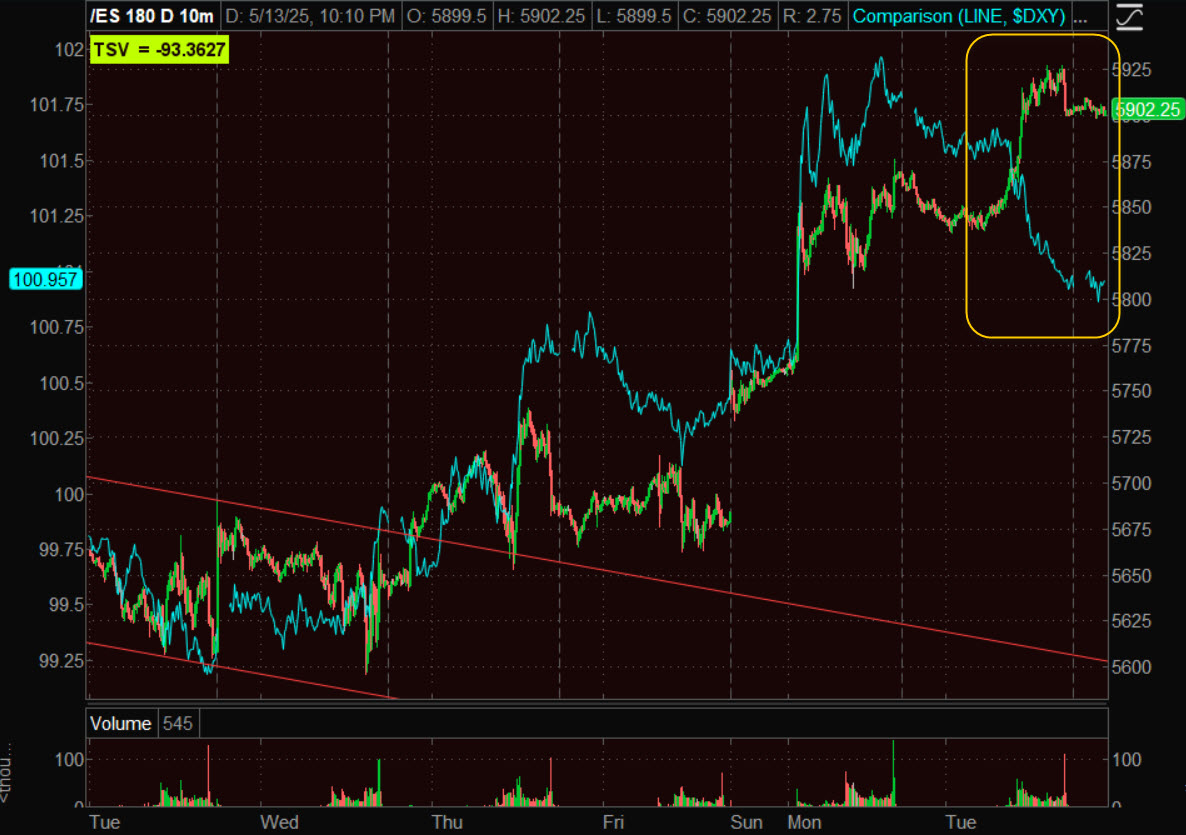 Same chart, just with The US dollar index in blue. Is this a red flag? No. I’d say it’s pale yellow and just something to keep an eye on.
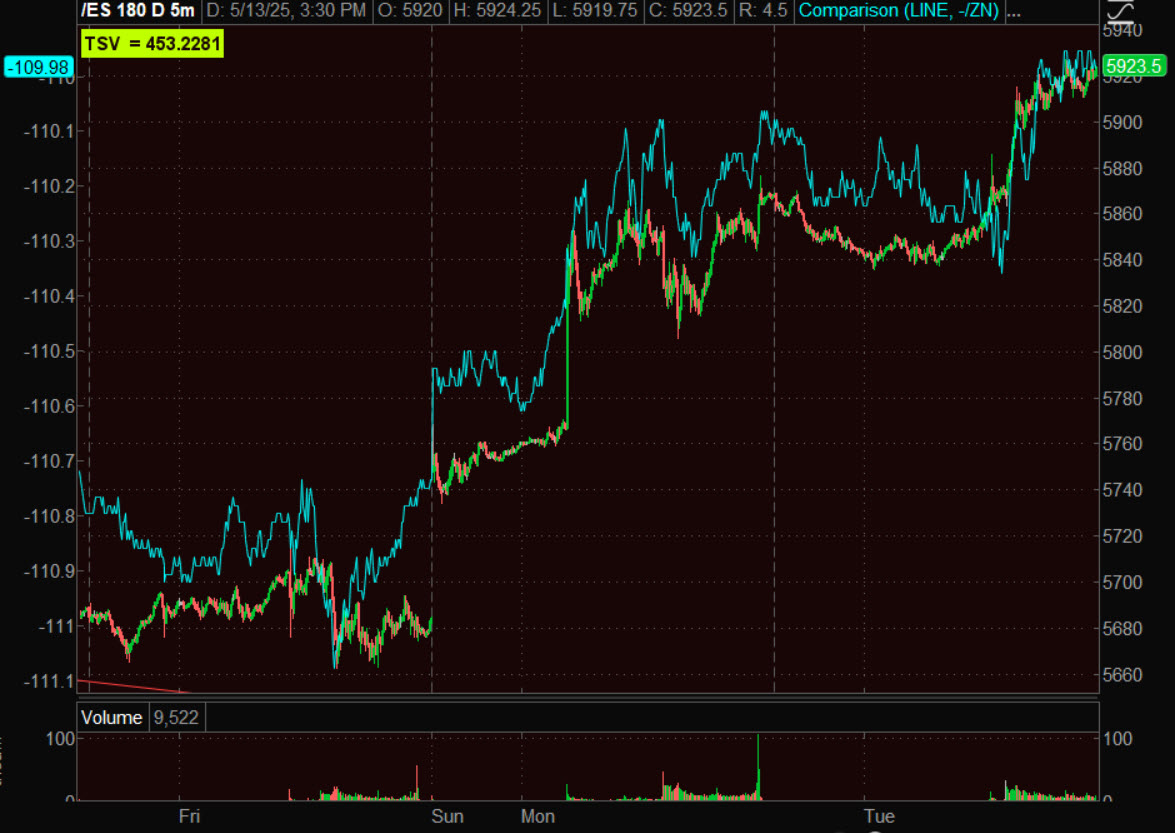
HY Credit…
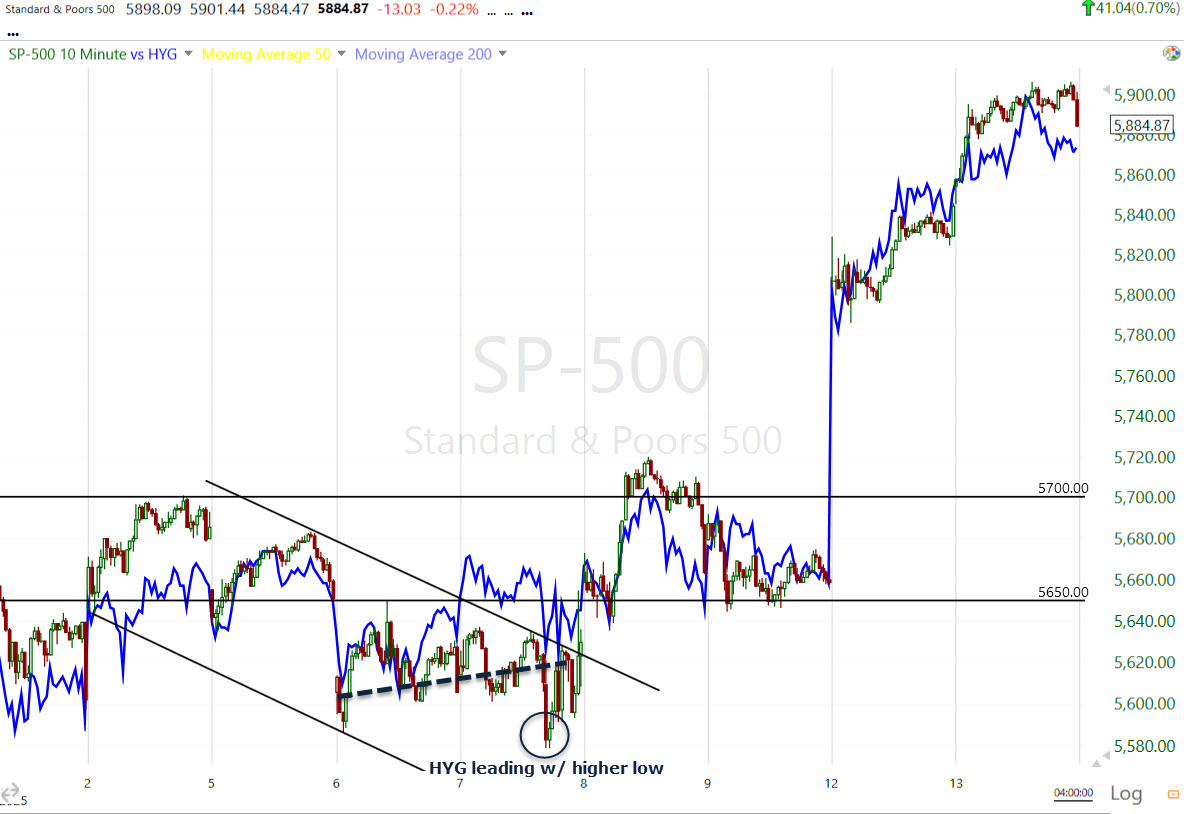 Not bad. Again, something to keep an eye on as this is our window into what institutional money is doing.
VVIX is acting up a little, but as I always say, “A Day is Not a Trend.”
From a bullish perspective, 3C is disappointing this week. It isn’t confirming the breakout from the bull flag very well, and that “can” lead to a failed breakout, although I think there’s still a reasonable chance that the S&P hits $6k first. This is almost entirely based on flow, and the fact that so many funds were were caught wrongfooted, and very underweight stocks.
I think the reason 3C doesn’t look great, is the people who were in the know on April 21st, the really deep pockets and really smart money that were connected to what was actually going on between the U.S. and China, long before anyone had a clue, those were the buyers that we saw on April 21st. I think they are selling into all of this flow this week, and that is why 3C is not looking great right now. That’s the bottom line. They got in with inside information, made a lot of money and are selling to the fUnds that sold and shorted at the bottom, that are now covering shorts and chasing price higher.
Strong hands, informed money, are selling to weaker hands that have hated this rally. That’s my take.
Overnight
S&P and NASDAQ futures are pretty much flat or up about 1/10 of a percent and right now they are the only ones that matter. They look to be consolidating today’s gains in a bullish fashion. Small Cap Russell 2000 is down 0.2%.
The US Dollar index is down 0.1%.
WTI crude is down 0.65%, just below that $64 level and it looks to be starting a small bullish consolidation. If you are interested, this is the time to be paying attention.
 WTI (2m)
Gold futures are down 0.5% and are still in that small bearish consolidation.
Yields are down to to three basis points, and with the dollar down, this is something to pay attention to because these two have been signalling economic growth optimism. However, the 10-yr yield is in a tough place and the Dollar jUst gave back a good portion of yesterday’s gains. They are a big part of the message of the market.
Looking ahead to Wednesday, market participants receive the following data:
- 7:00 ET: Weekly MBA Mortgage Index (prior 11.0%)
- 10:30 ET: Weekly crude oil inventories (prior -1.11 mln)