Wartime Correlations Are Back, And AI Stocks Are Most Exposed
Wartime correlations that the stock market broke with when the ceasefire went into effect, are back in play, but it’s a fairly new development, just starting to realign since mid-May.
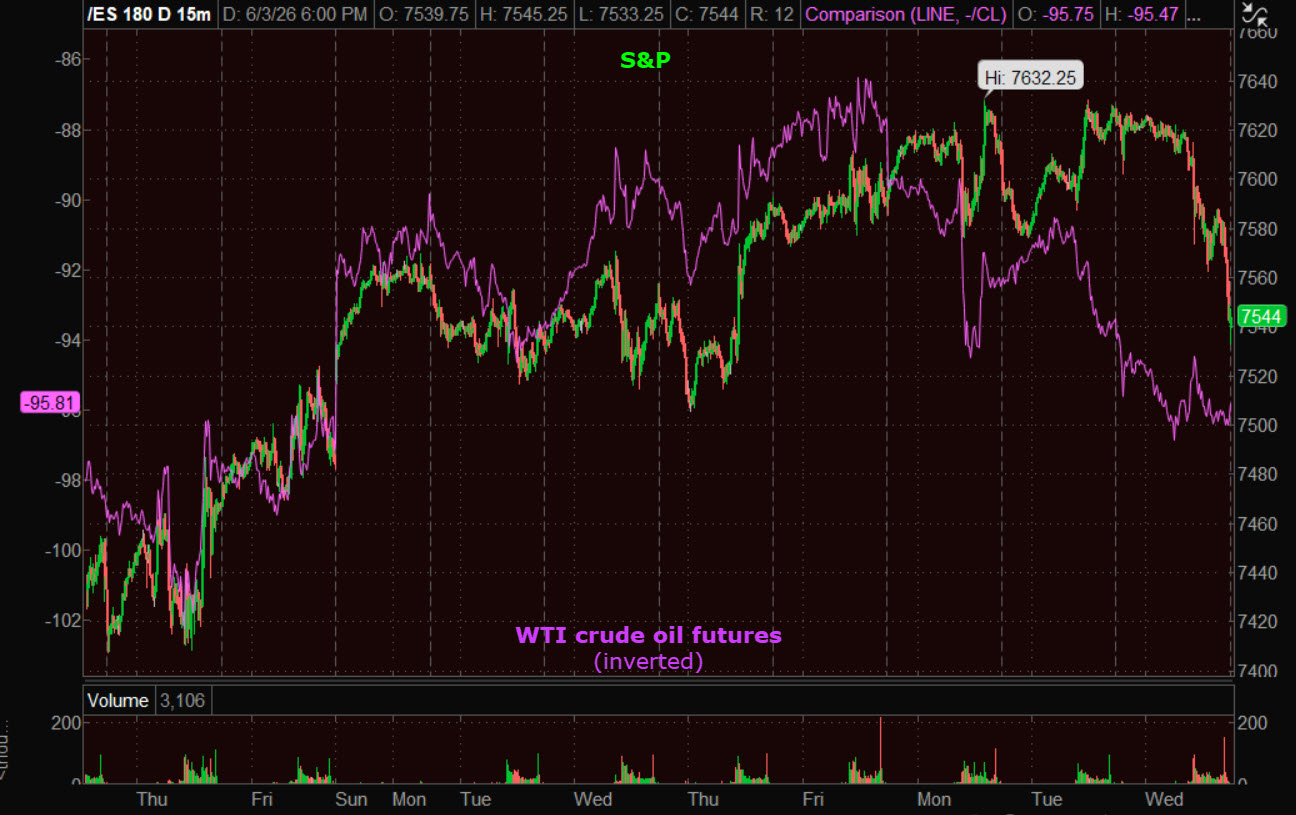 SPX (15M) and WTI crude (inverted) in purple. On this chart, WTI’s strength is still leading the SPX a bit lower.
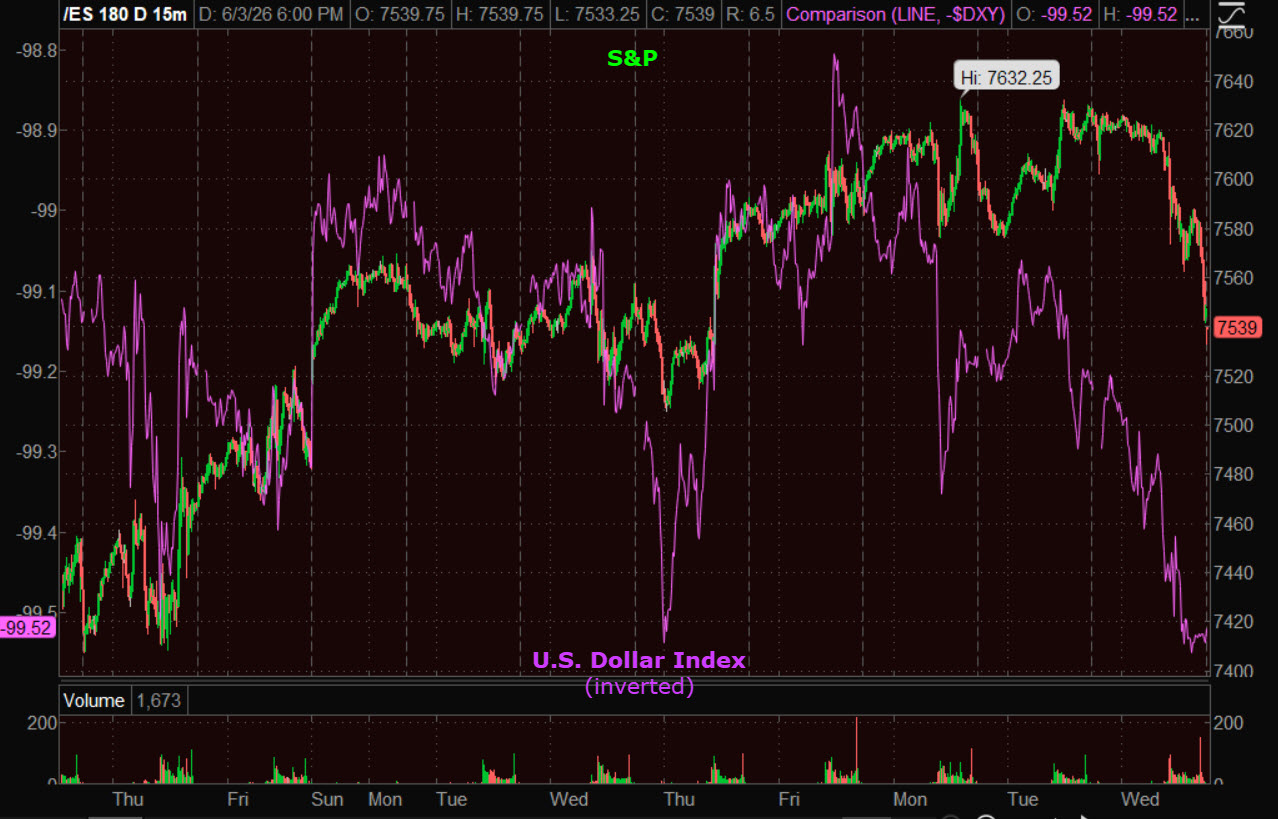 SPX (15M) and the U.S. Dollar Index (inverted) in purple. The correlation reasserting itself makes the Dollar’s bullish price action all the more interesting.
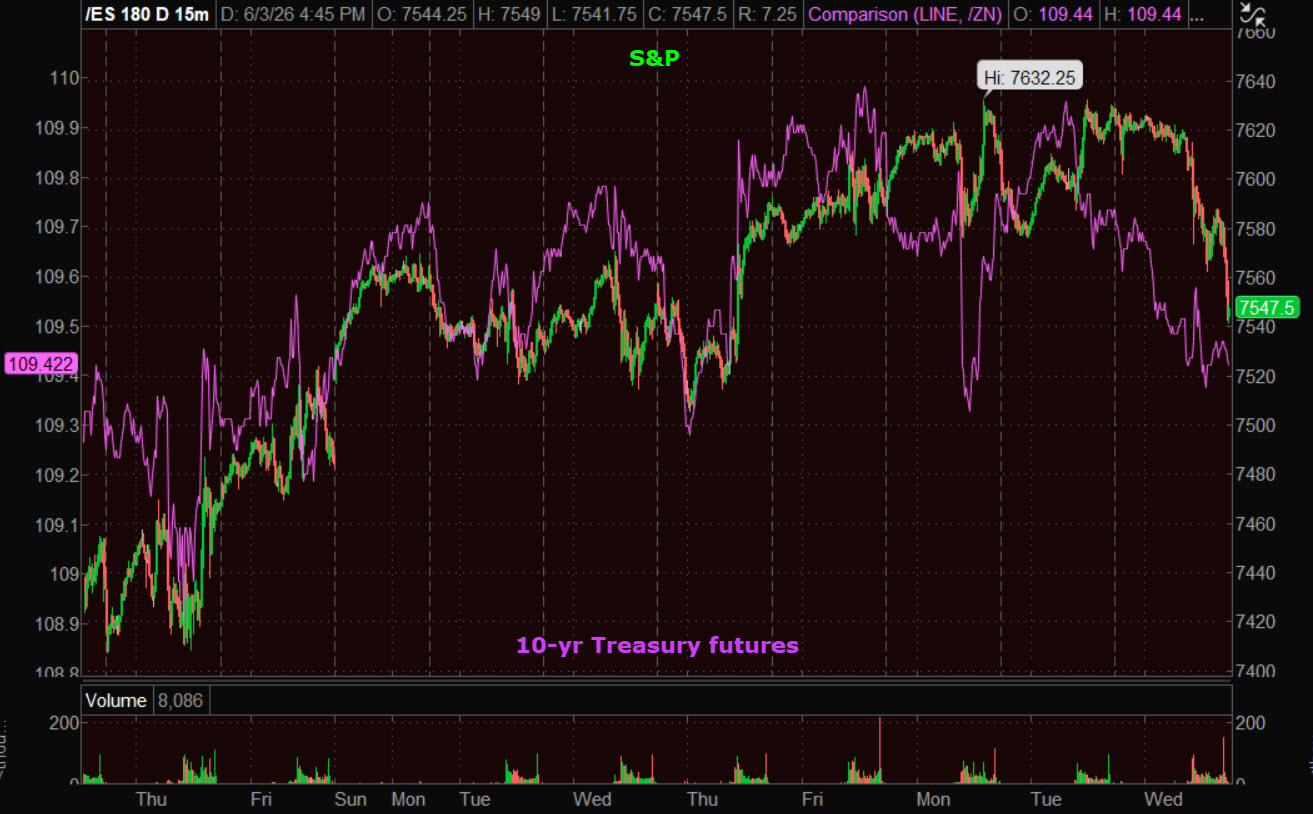 SPX (15M) and 10-yr Treasury futures in purple. Remember that yields move opposite Treasury prices. With this correlation coming back, higher yields=lower stock prices, which makes the 10-yr yield’s breakout and successful test all the more interesting.
I think it’s pretty safe to say that the kinetic escalation in the Middle East overnight was the fulcrum for the equity market Wednesday.
- US military fired a Hellfire missile to disable a tanker attempting to bypass the American blockade in the Strait of Hormuz.
- IRGC fired missiles at a “Zionist/American” vessel.
- NOTE: Multiple reports indicate the IRGC has adopted a new escalation doctrine, responding to each U.S. or Israeli provocation with roughly 1.5 times the force.
- U.S. launched retaliatory attacks against a communications tower on Iran’s Qeshm Island near Hormuz.
- IRGC launches missiles and drones targeting: US Fifth Fleet HQ in Bahrain, US Ali Al Salem airbase base in Kuwait, Kuwait International Airport terminal & Diplomatic Missions, killing 1 person and injuring dozens more.
Crude Oil, the U.S. Dollar and Treasury Yields rose, while the Averages fell.
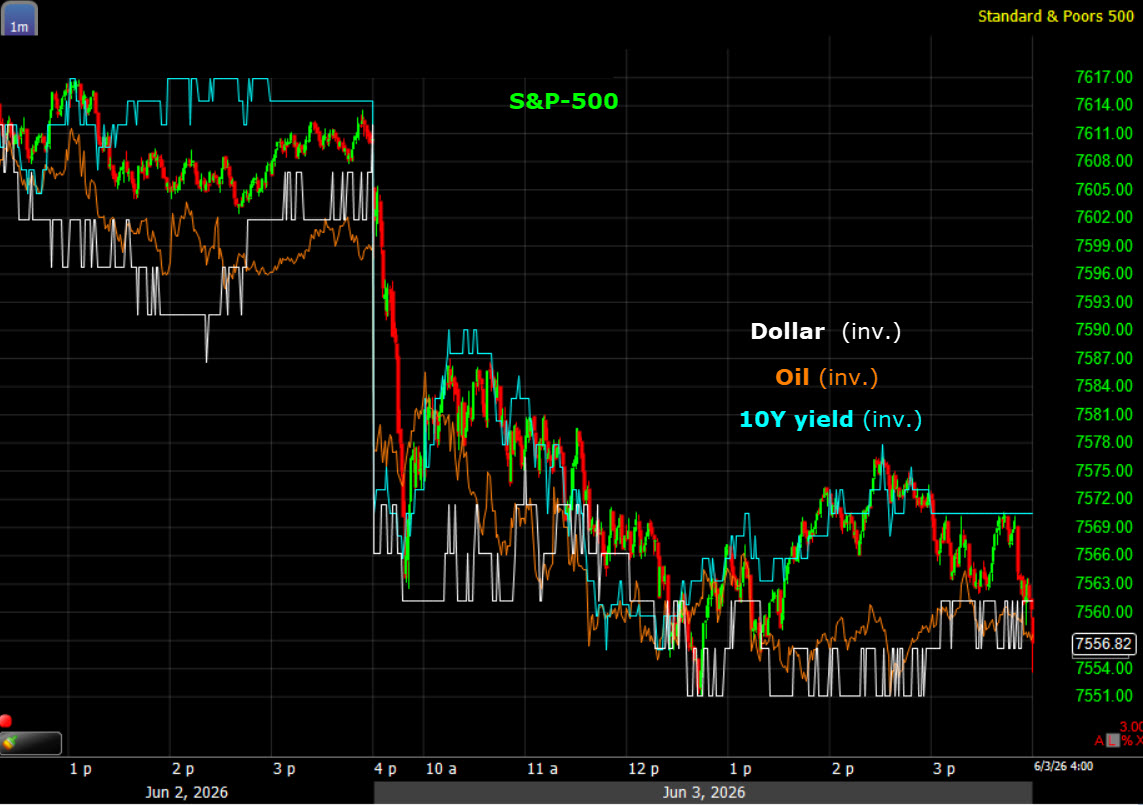 S&P (1M) the other assets’ prices are inverted for context.
Secondary factors included: Israel’s military operations in Lebanon, renewed tariff uncertainty, huge crude inventory drawdowns, and inflationary Services PMI data.
While President Trump claims talks have been ongoing every day, Iran’s Foreign Minister pushed back, saying “no tangible progress has been made.”
Points of contention include: Iran’s highly enriched uranium, the Strait of Hormuz, frozen Iranian funds and Lebanon. Or, pretty much everything.
Economic data:
- Weekly MBA Mortgage Applications Index -2.5%; Prior -8.5%
- May ADP Employment Change 122K (consensus 110K); Prior was revised to 105K from 109K
- May S&P Global U.S. Services PMI – Final 50.7; Prior 50.9
- April Factory Orders 4.8% (consensus 3.5%); Prior was revised to 1.8% from 1.5%
- The takeaway from the report is that the headline numbers masked a weak month for business spending, evidenced by the 1.0% decline in nondefense capital goods orders, excluding aircraft. To be fair, that decline followed a very strong 3.8% increase in March, so it could just be a natural pullback after a large increase.
- May ISM Non-Manufacturing Index 54.5% (consensus 53.6%); Prior 53.6%
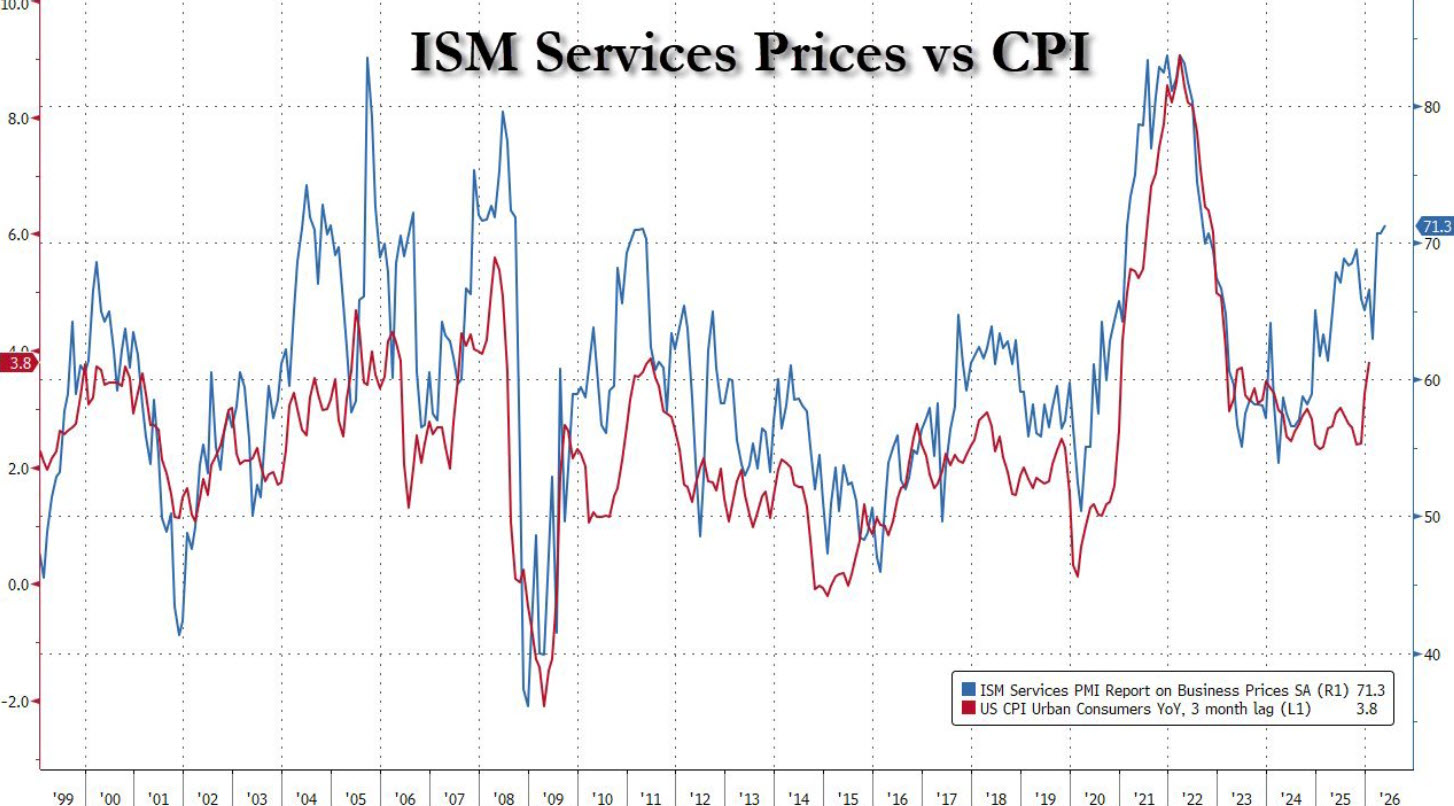
- The takeaway from the report is that activity for the country’s largest business sector picked up pace in May, notwithstanding higher prices that were reflected in the highest average 12-month reading (68%) since April 2023.
I’ve mentioned April’s 6% PPI several times and the probability that inflationary producer prices make their way into consumer prices (CPI). If cpi ends up at 6% in a couple of months, you’re not going to have a 30-year yield sitting at 5.00%. Considering the argument I’ve been making, today’s ISM Prices Paid is moving toward CPI ~6%
Averages
The S&P’s 9-day win streak ended with all averages closing lower. Russell 2000 and the DJIA were the worst performers, while the NDX lost the least.
The Momentum style factor (+1.1%) outperformed, while Growth (-1.3%) was the worst. Value (0%) was flat, while High Beta lost -0.7%.
S&P-500 ⇩ -0.70 %
NASDAQ ⇩ -0.29 %
DOW JONES ⇩ -1.21 %
RUSSELL 2000 ⇩ -1.31 %
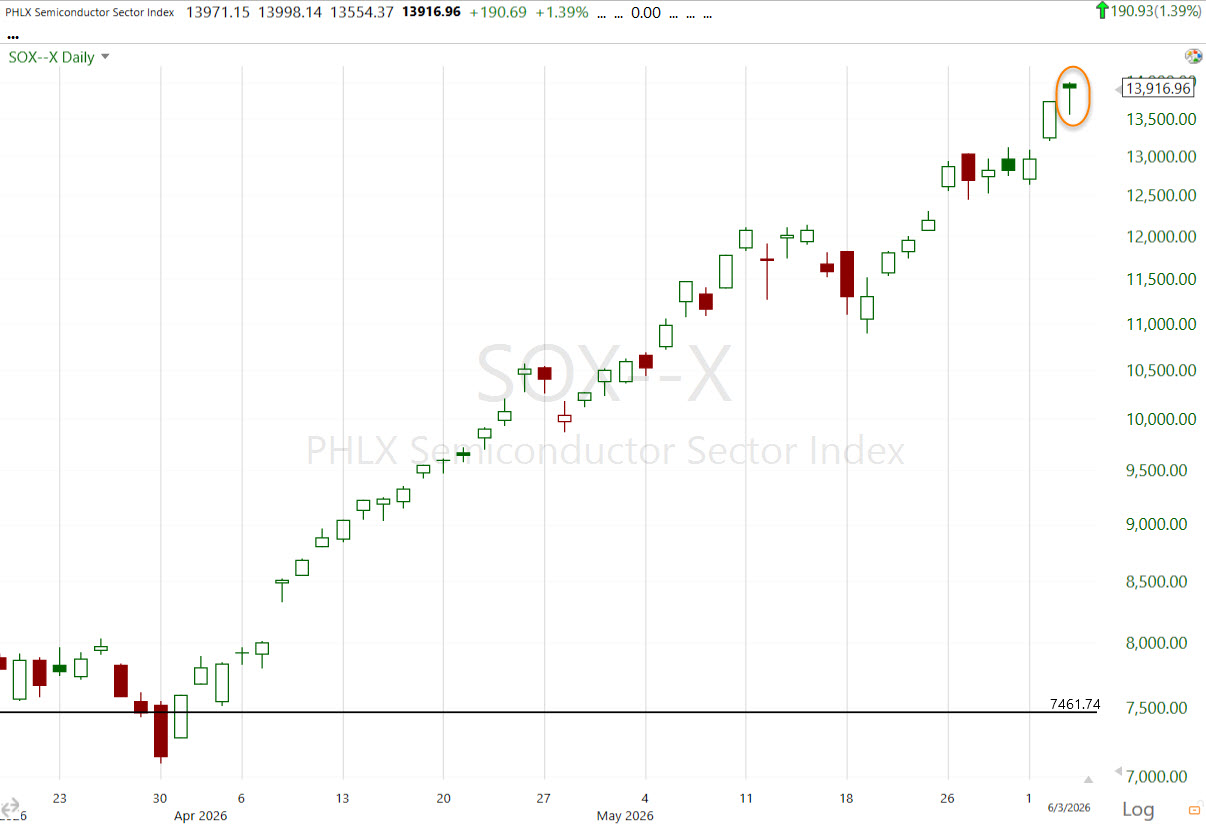
Just a couple of days after 3C negatively divegres in the cap-weighted indices. Today the SPX posts an ugly daily candle.
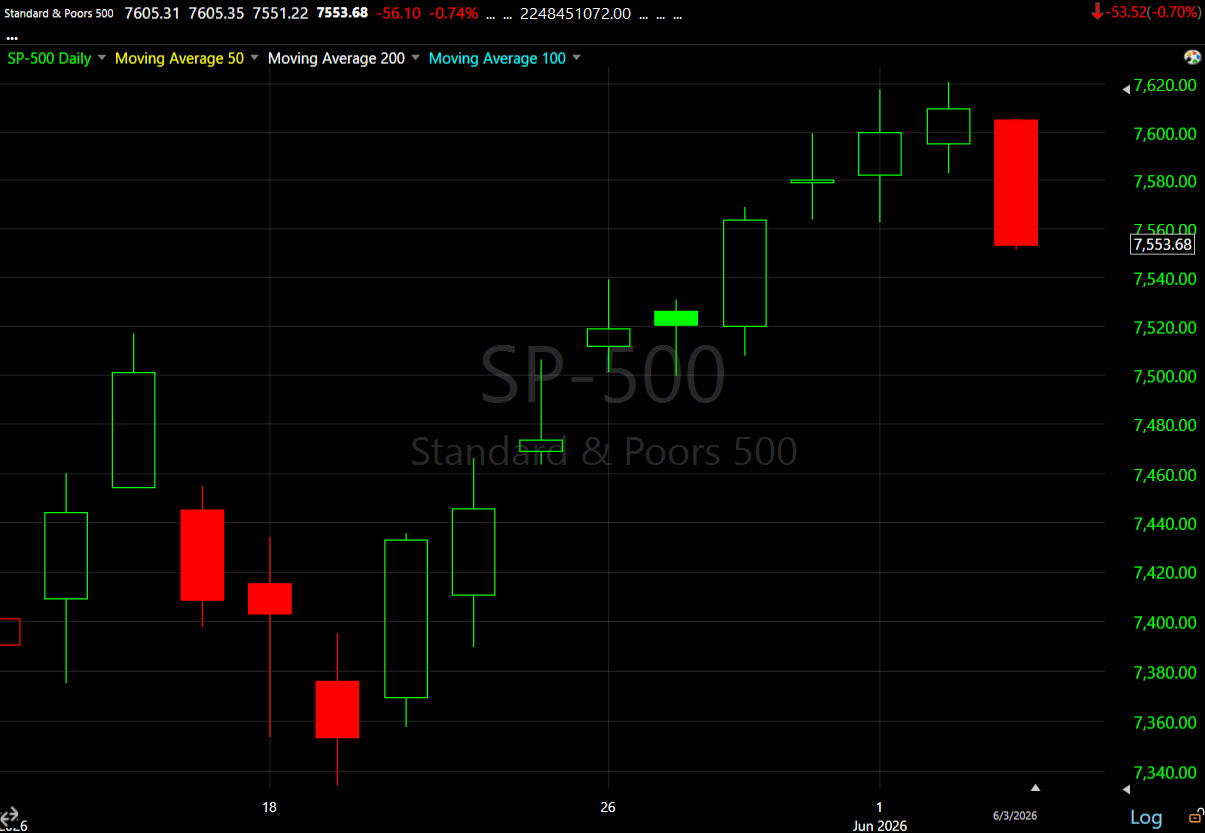 Opening at the high of the day and closing at the low.
The key level I’m still eyeing is $7500…
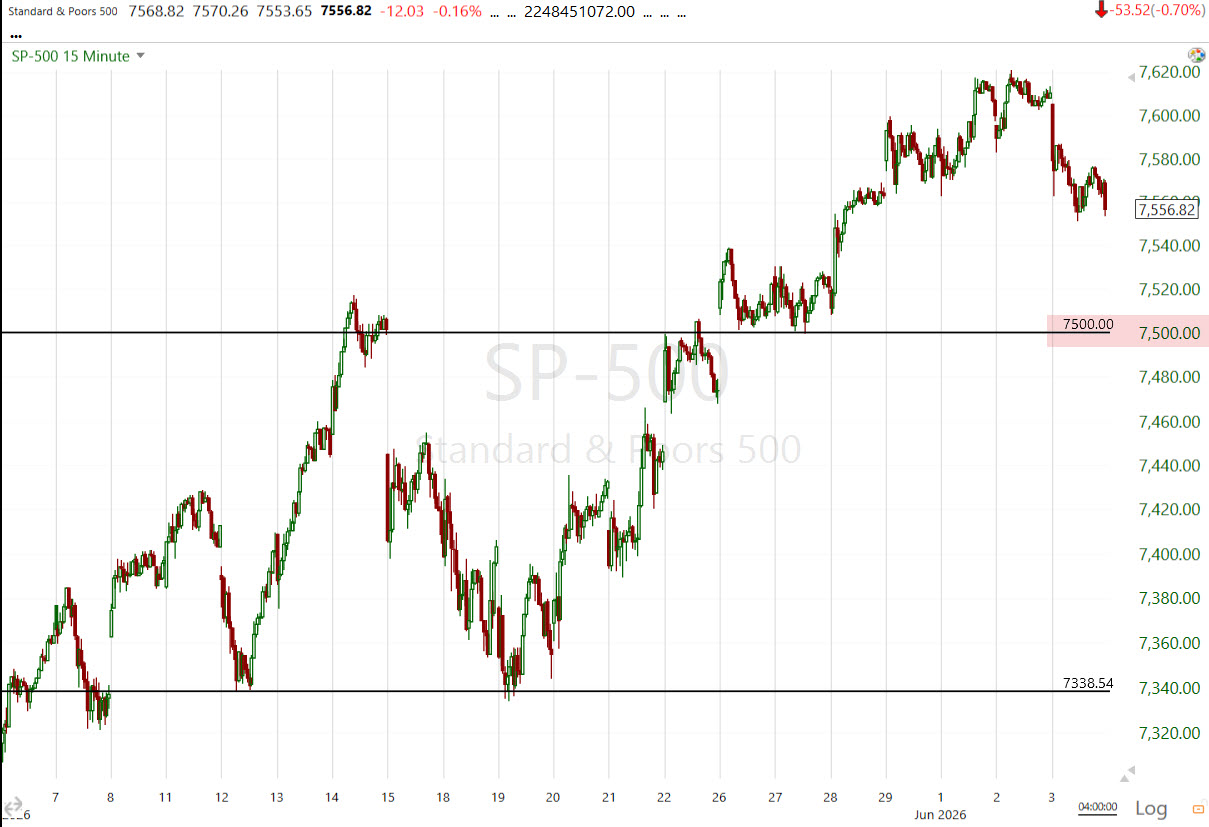 (15M) and it’s just -0.75% below today’s close. A break below $7500 gives some evidence that something has gone wrong and it’s not just another run-of-the-mill dip. There’s psychological importance there, gamma, and price structure (potential for failed breakout scenario) all in play at $7500.
3C was fairly quiet and tame today, but something changed in recent days coming into the month of June.
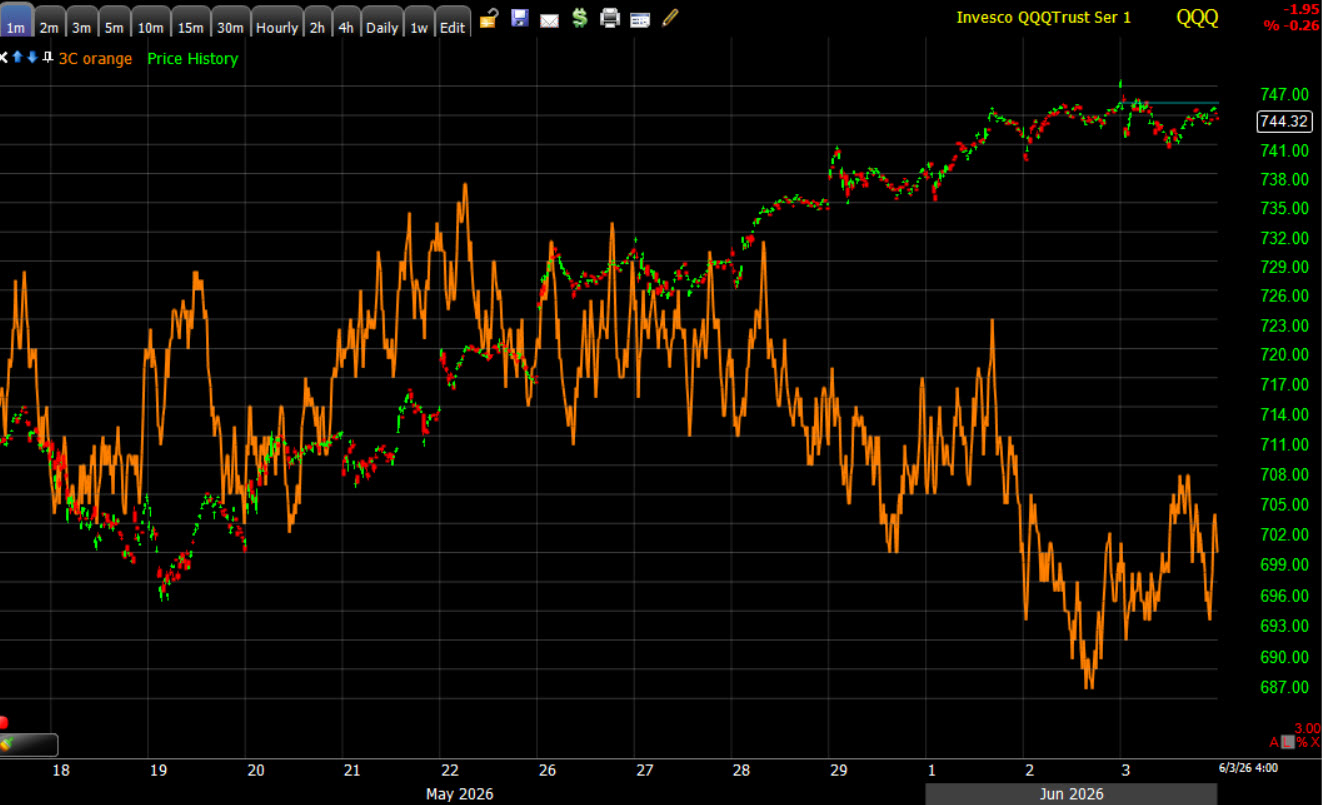 QQQ (1M)
And it was most notable in the cap-weighted (Tech dominated) averages. And at a time when they’re overbought readings are extreme.
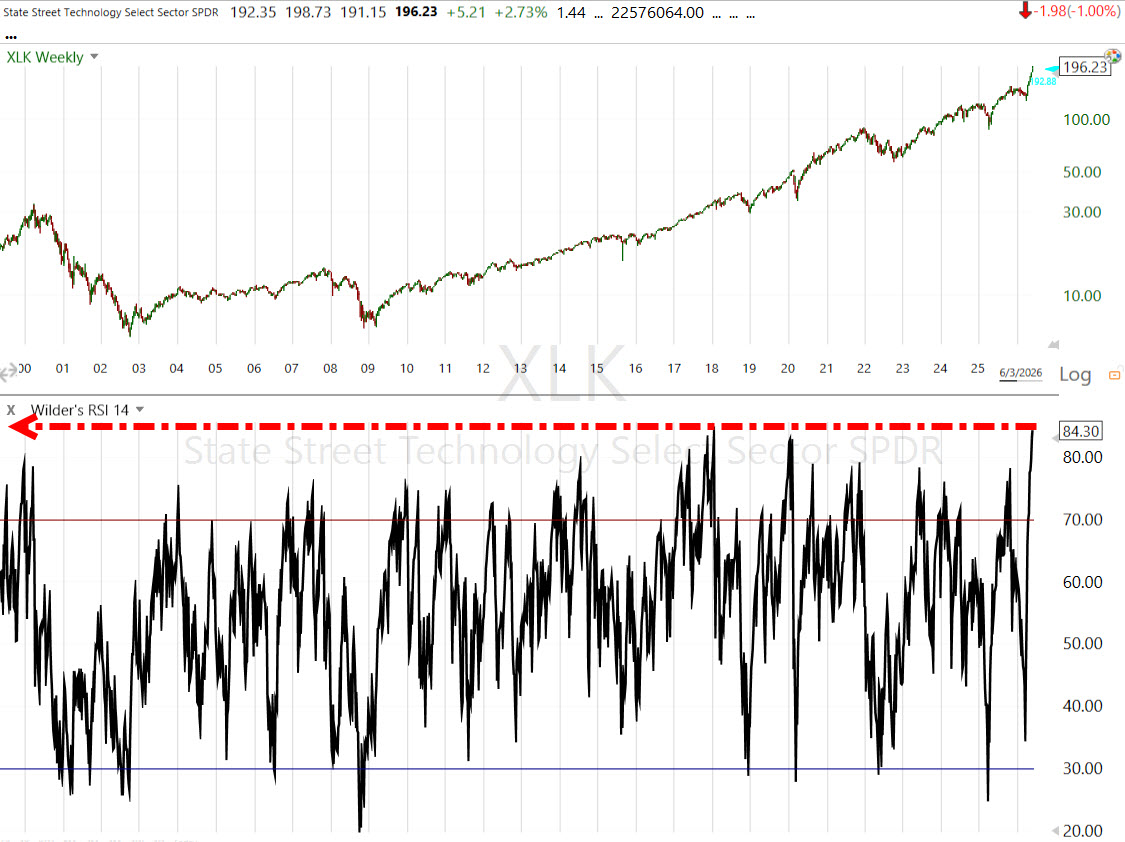
Nasdaq’s weekly RSI…
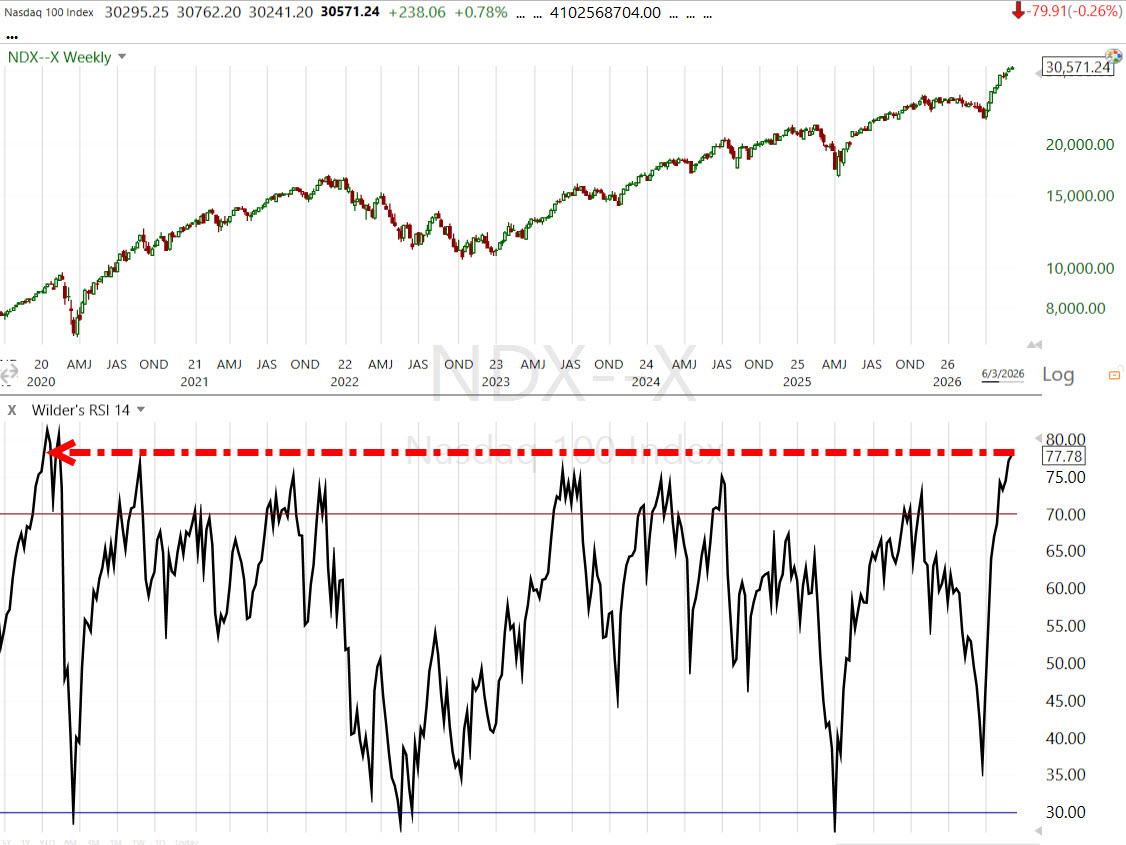 Hitting the record highs seen just before the Covid crash. Ironically, breadth was narrow and tech-led then too, trading at record highs just before the crash, but nowhere near as narrow as now. Also ironically, intermarket signals were SCREAMING AND JUMPING OFF THE CHART. The message rates, commodities, commodity currencies and credit were sending? MAJOR DEFLATIONARY EVENT AHEAD.
What could have been more deflationary then the entire economy being shut down for two months? The lockdown created a demand shock sending the economy into a deflationary spiral. At one point, oil prices actually went negative. It was one of the sharpest short-term deflationary shocks in history.
Of course it led to an inflationary surge, but what was most notable, and if you were a subscriber then you may recall, I was pounding the table every day for 5 weeks ahead of the crash as stocks traded up +0.2% to new record highs almost daily. The commodity, bond , currency and credit markets were screaming in unison for more than 5 weeks that it was coming. Then, a -35% crash.
The scenario now is different, but with similar intermarket warnings. I’ll touch on it more in the sectors section.
The high beta, speculative stocks that were ripping higher in recent days, “The Dash for Trash,” were some of the weakest areas today: Meme Stocks, Non-Profitable Tech (-2.2%), and my Most Shorted Index.
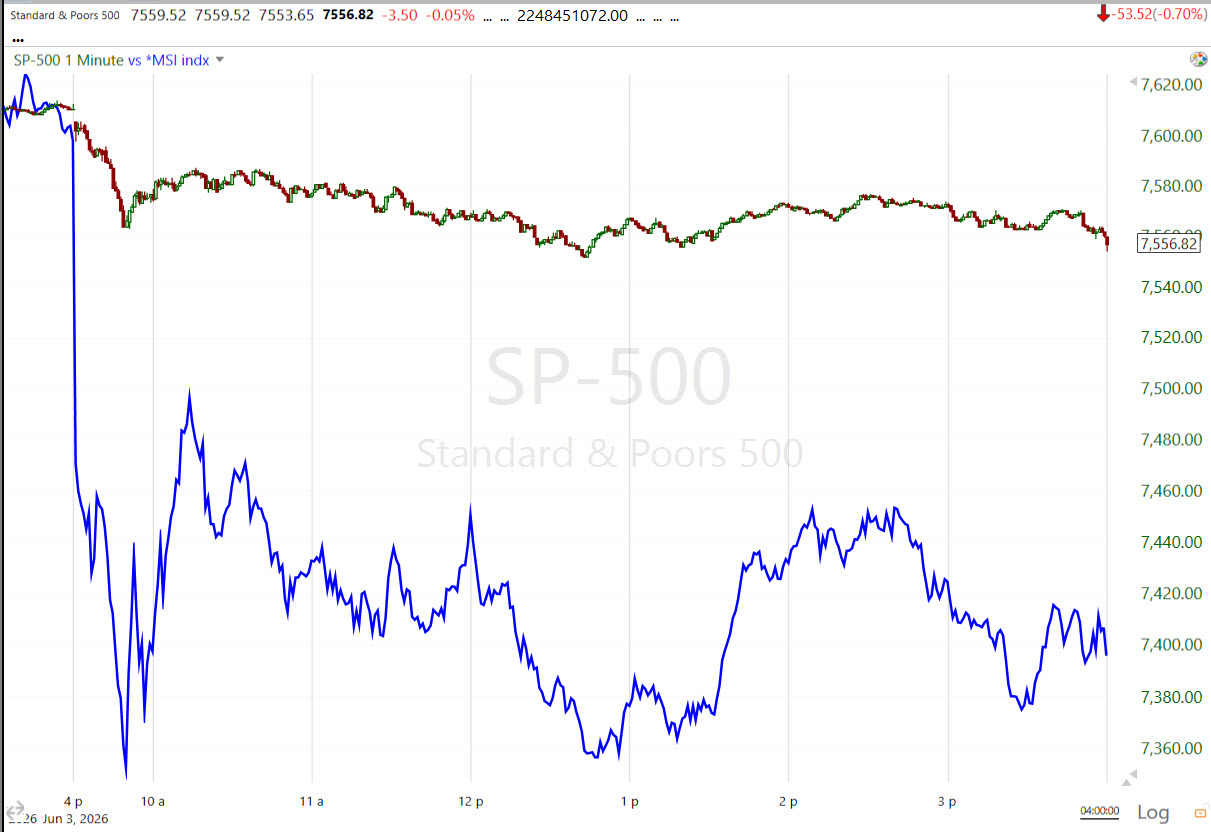 SPX & MSI (1M normalized) It turns out the Short-Covering capacity of the MSI was running out of fuel.
Volatility’s Term Structure is in deep contango.
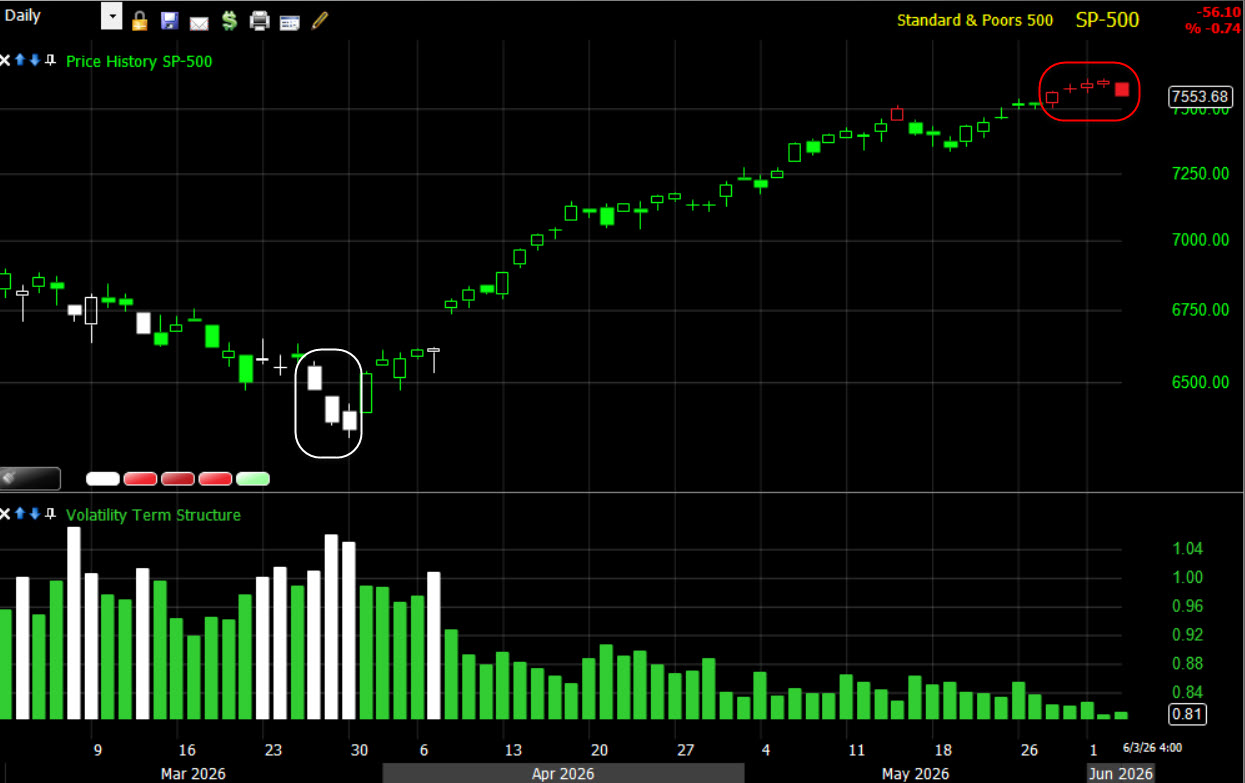 SPX (daily) – The candles are painted red to reflect periods of deep contango. They don’t back-test well as a reliable signal like the Backwardation signals (white), but they do send a message. When no one is hedged for the downside, normal corrections can become something much uglier.
Example: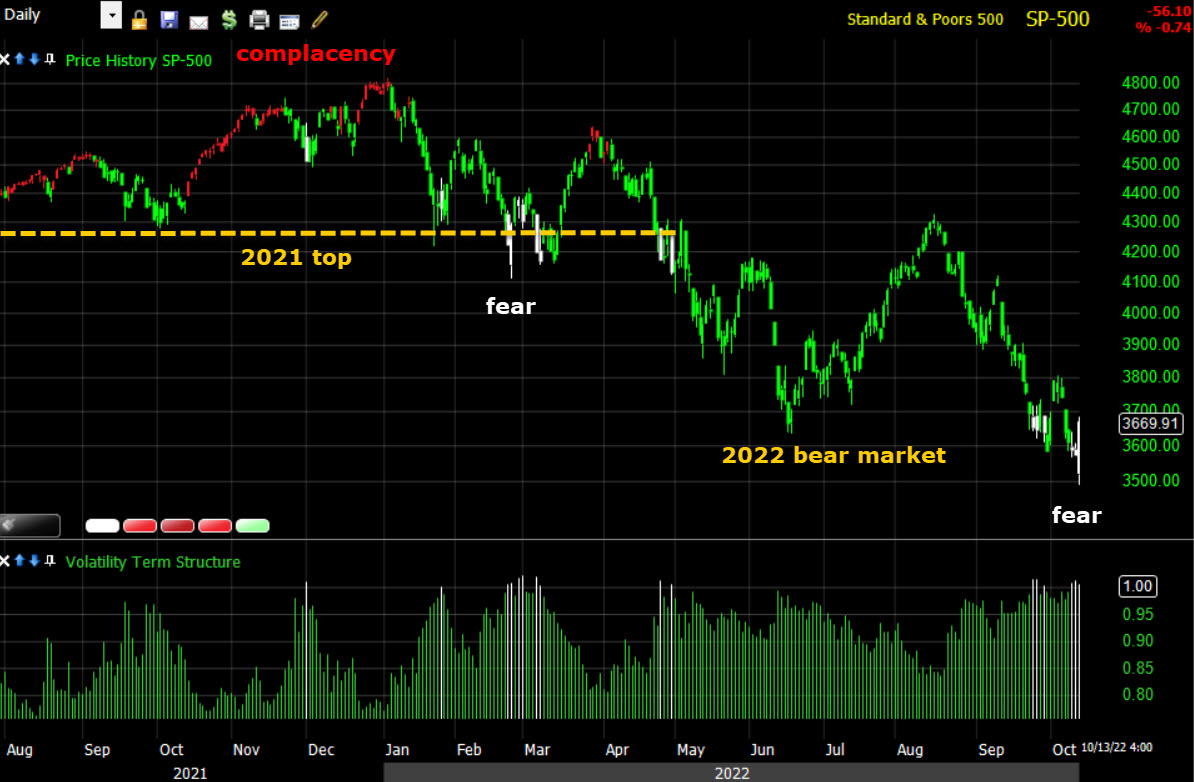 SPX (daily) 2021-2022
VIX (+1.8%) displayed unusual relative strength early this week, led by VVIX (-1.05%). On a relative basis, both displayed weakness today. It’s almost as if the market caught down to the recent relative strength accompanied by 3C signals in vol assets over the same period (3C was quiet in the vol space today, too).
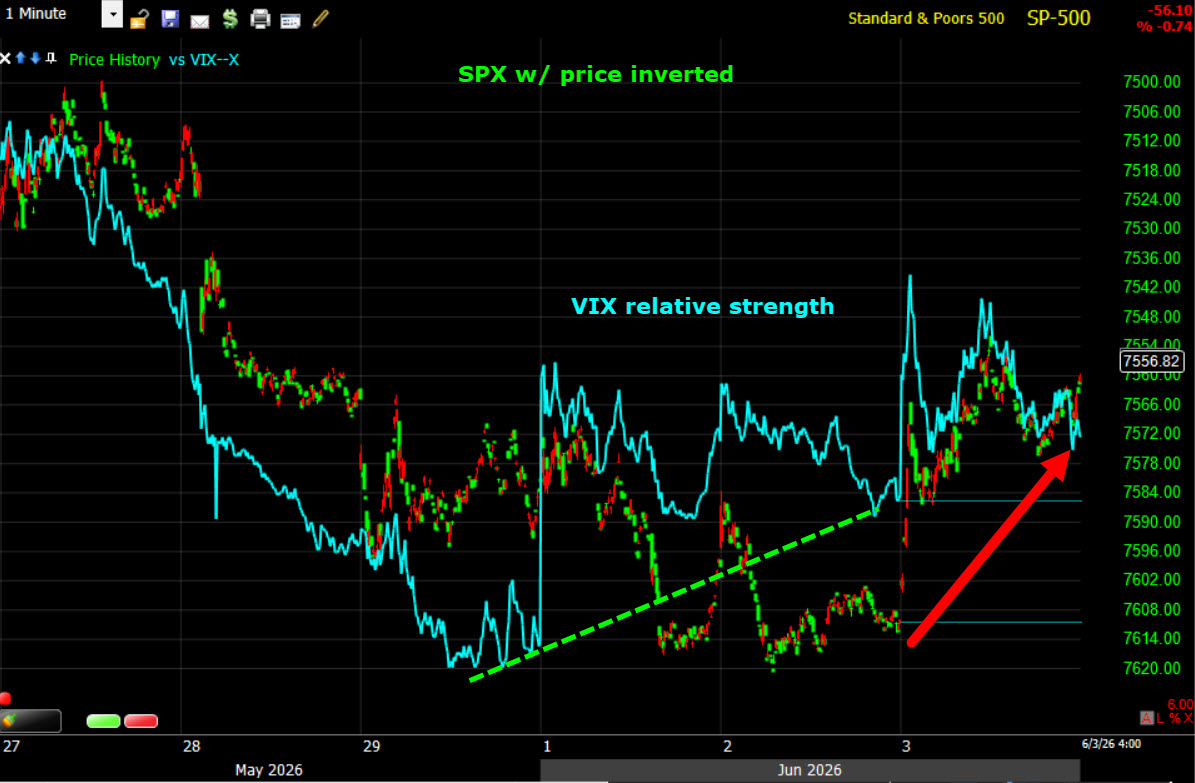 SPX (1M w/ price inverted for context) – It’s another one of those weird synchronicities, as if someone knew some trouble was coming and hedged up right before it. The SPX caught down (red arrow) to VIX’s relative strength from the last few days.
VVIX’s relative performance almost always leads VIX’s, and VIX’s relative performance leads the market. You could say, VVIX’s relative performance leads the market first, there’s just a few steps in between.
VVIX is still displaying relative strength on the week.
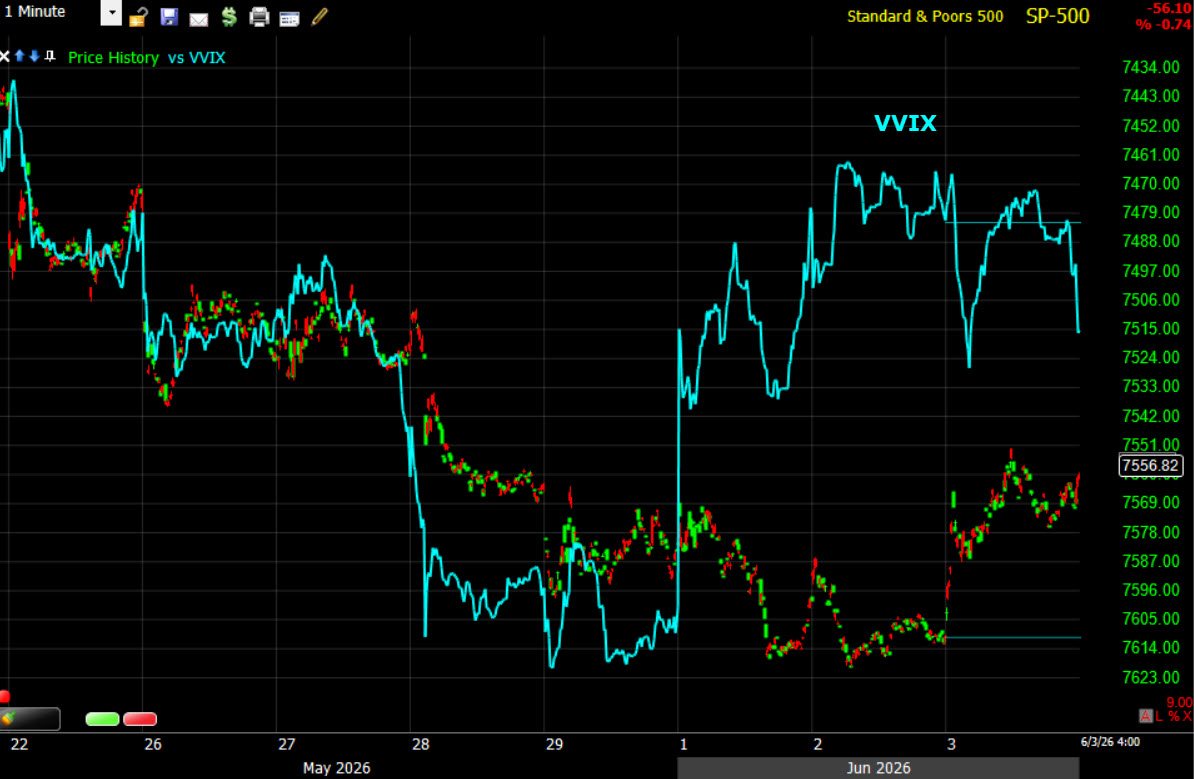 (1M) – Let’s see if it builds on it.
The Absolute Breadth index ended 1 point higher at 16.11, but still within quick striking distance of new sub-14 signals.
S&P sectors
Sector strength waned throughout the session, with six S&P 500 sectors finishing lower, three of which retreated by more than 1%. The three mega-cap heavy sectors (Tech, Communications and Consumer Discretionary) sat at the bottom of the leaderboard along with Financials. Energy was best with rising oil, the other green sectors gave the day a defensive feel (Health Care & Consumer Staples).
The Financial sector underperformed. Crypto-related issues such as Robinhood (HOOD -6%) and Coinbase (COIN -6.2%) sank with Bitcoin losses. Asset Managers (KKR -4.15%, BX -4% & ARES -4%), Credit Services and Financial Data Services were among the worst performers in the sector.
Mega Caps (MGK -1.15% & MAGS -1.1%) underperformed the Equal Weight S&P-500 (-0.4%) again. Alphabet GOOGL -0.8%) traded lower on heavier volume after the largest US equity capital raise in history. This is exactly the kind of thing that caused concern around the hyperscalers just before the war.
I’ve been noting the standout relative weakness of the Mag-7 mega caps this week (June). Given they basically are the SPX and NDX, you don’t see this often…
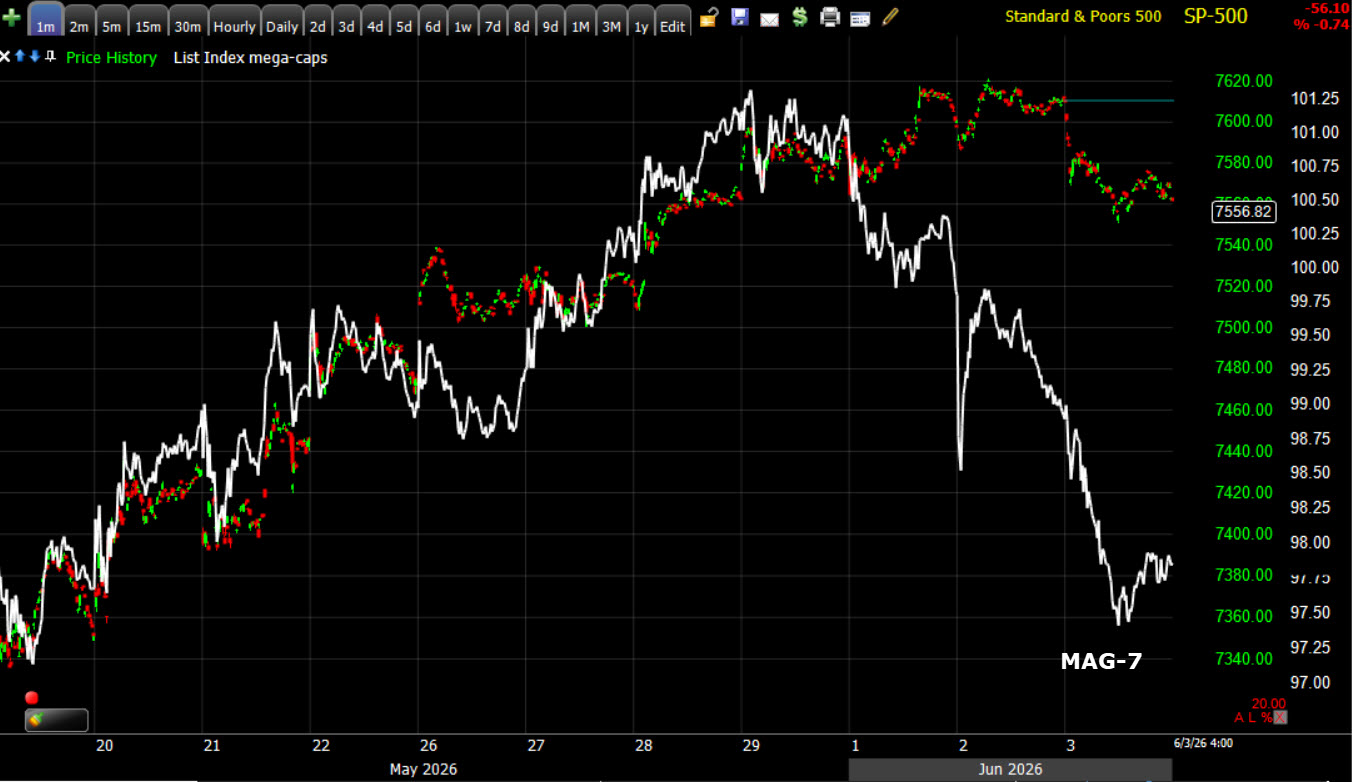 SPX (1M) and an Equal Weight Index of the Magnificent-7 mega caps.
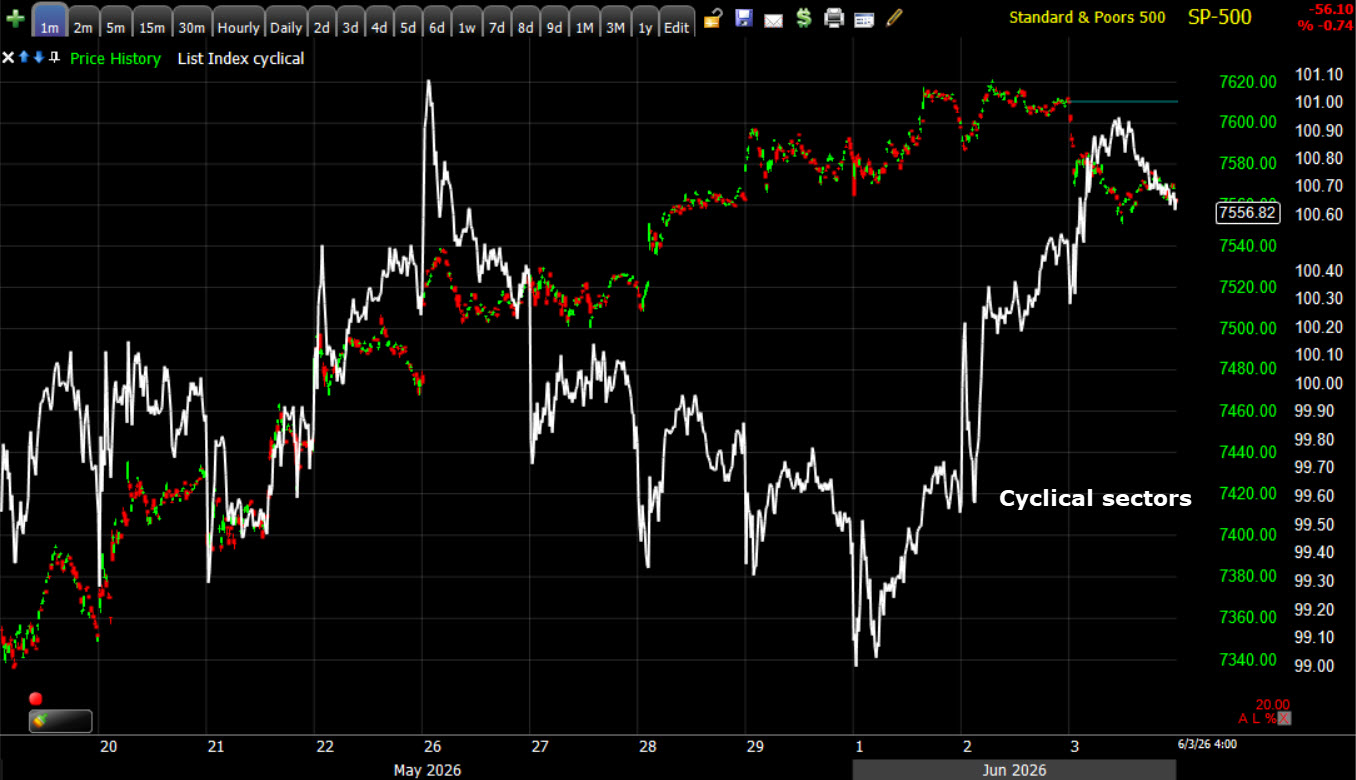
Rotation in June? Over roughly the same period, my equal weight index of procyclical sectors seems to be trying to take up the slack.
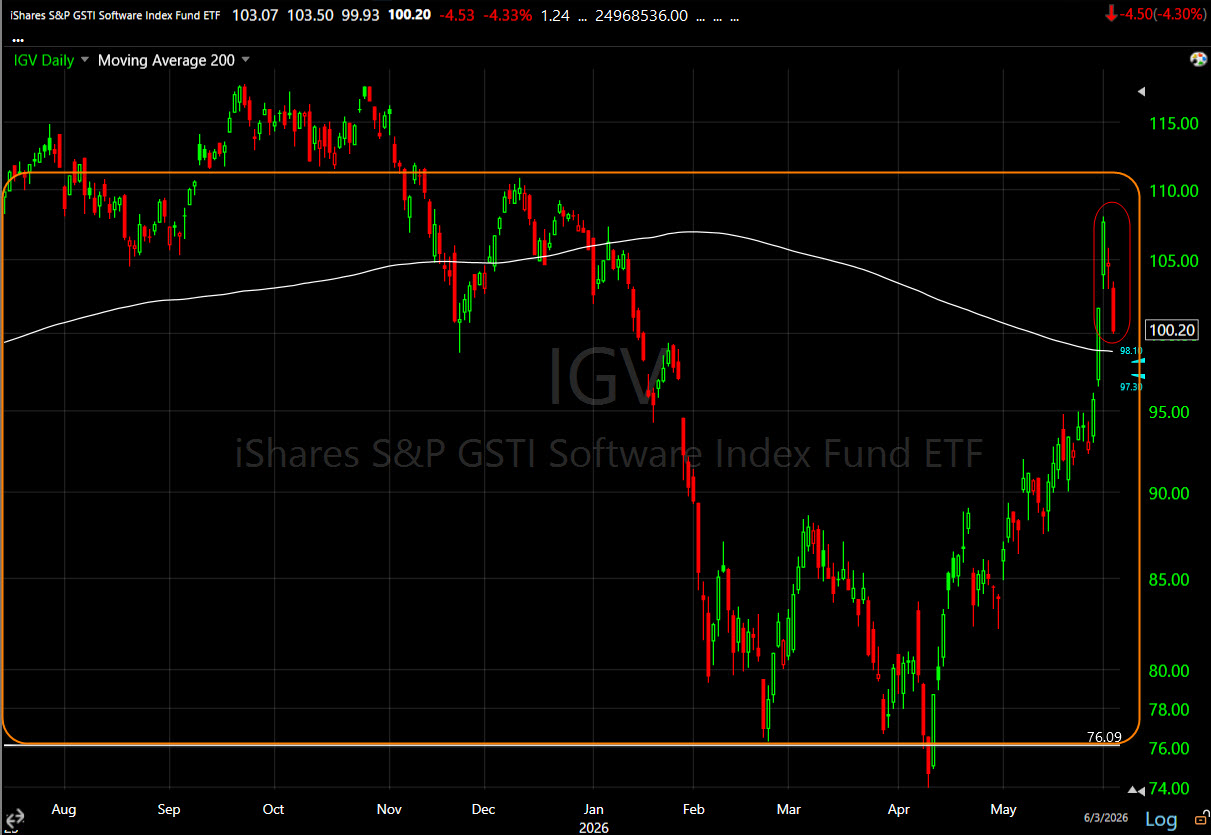 Software (daily w/ 200-Day SMA) – and more than that, Asset Managers were notably weak as mentioned above. My plan since IGV was barely above $76 was to watch these credit assets as price neared the 200-day.
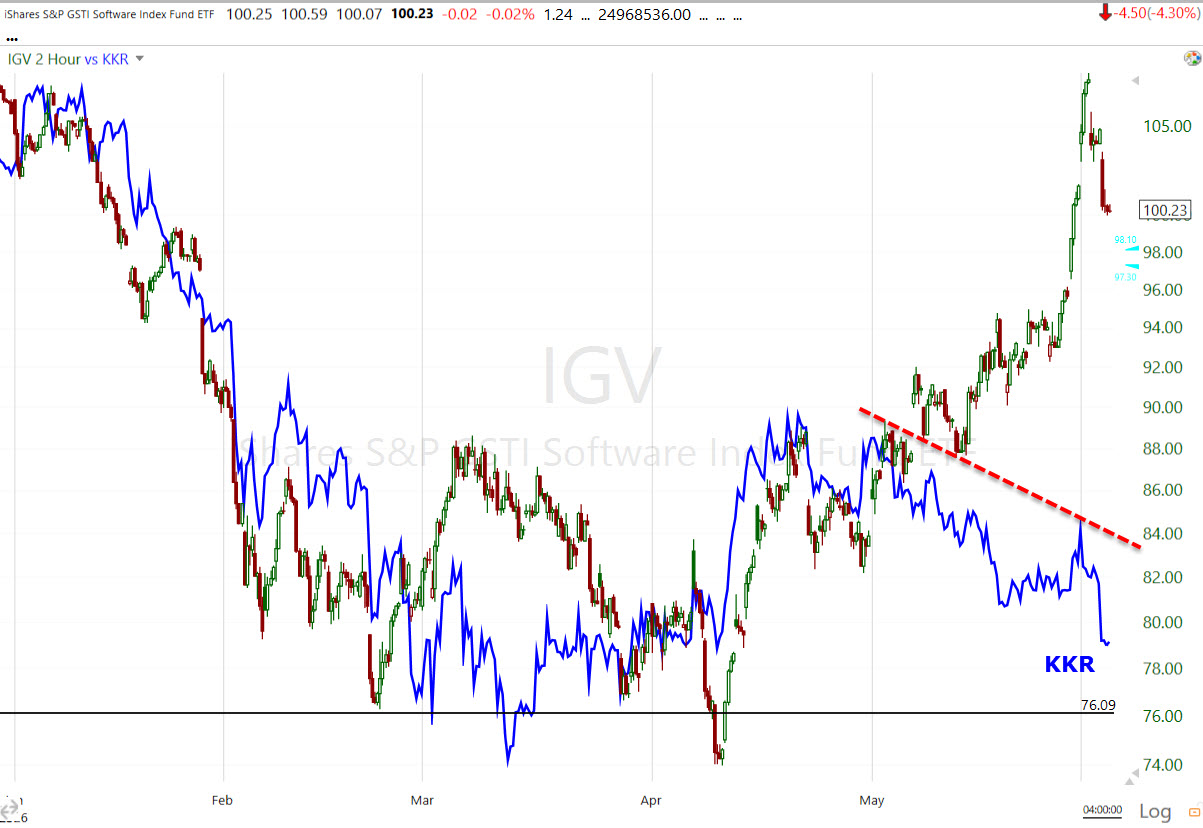 Software (2H) and KKR -4.15%, though I have a large watchlist of different companies that have differing levels of exposure to software. The danger is in overfitting or falling victim to confirmation bias.
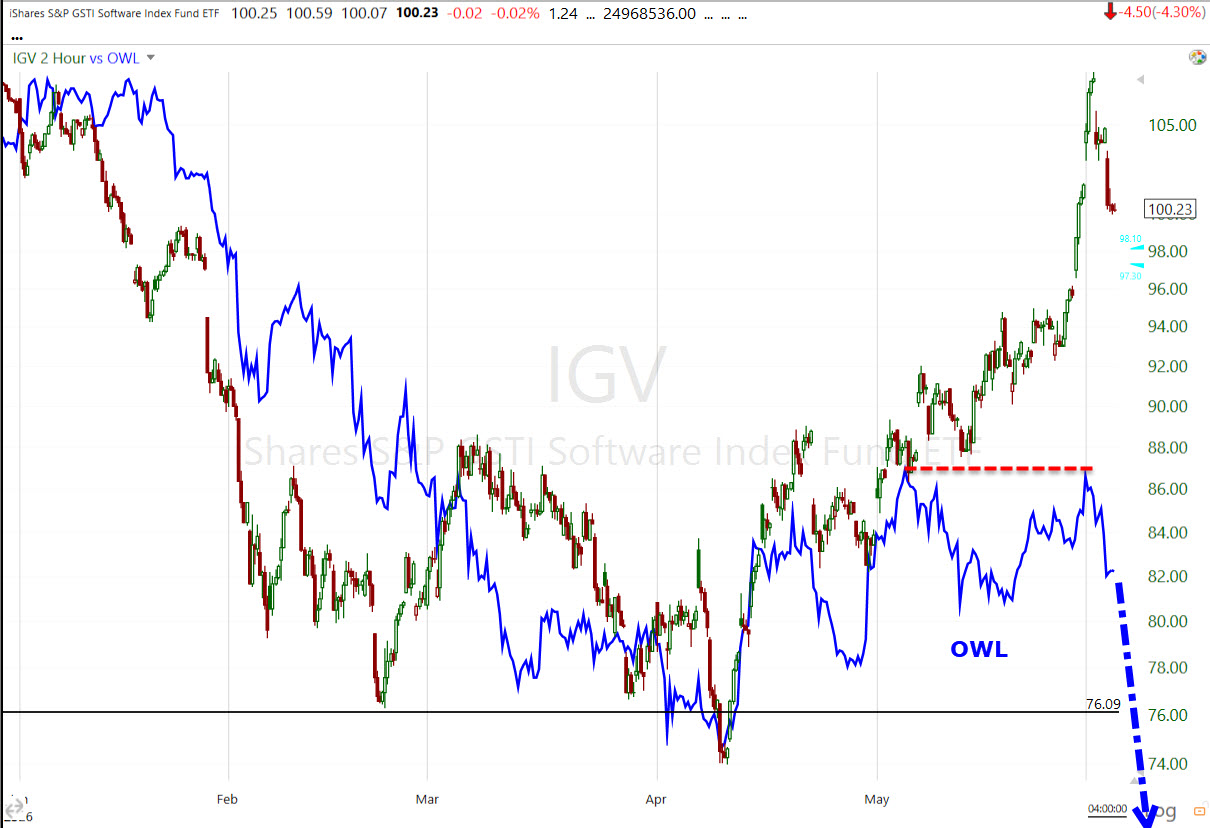 (2H) Software would become a high probability short-sale, and at attractive levels.
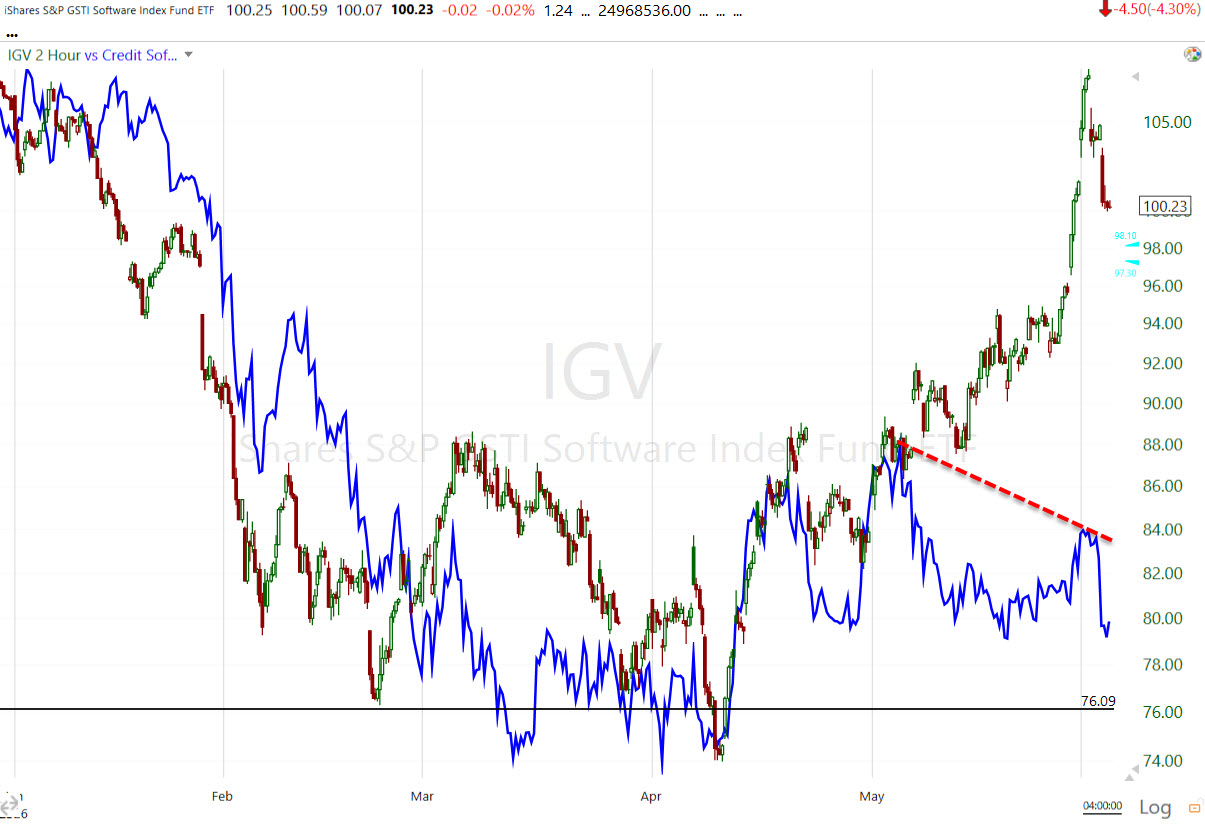 (2H) Which looks a lot like OWL. If Credit jumps off the chart, which I suspect it will if yields move as I expect, Software will become a high probability short trade trade set-up as its credit related issues post leading signals. They haven’t acted great on the bounce off IGV $76, but they’re not quite jumping off the chart yet.
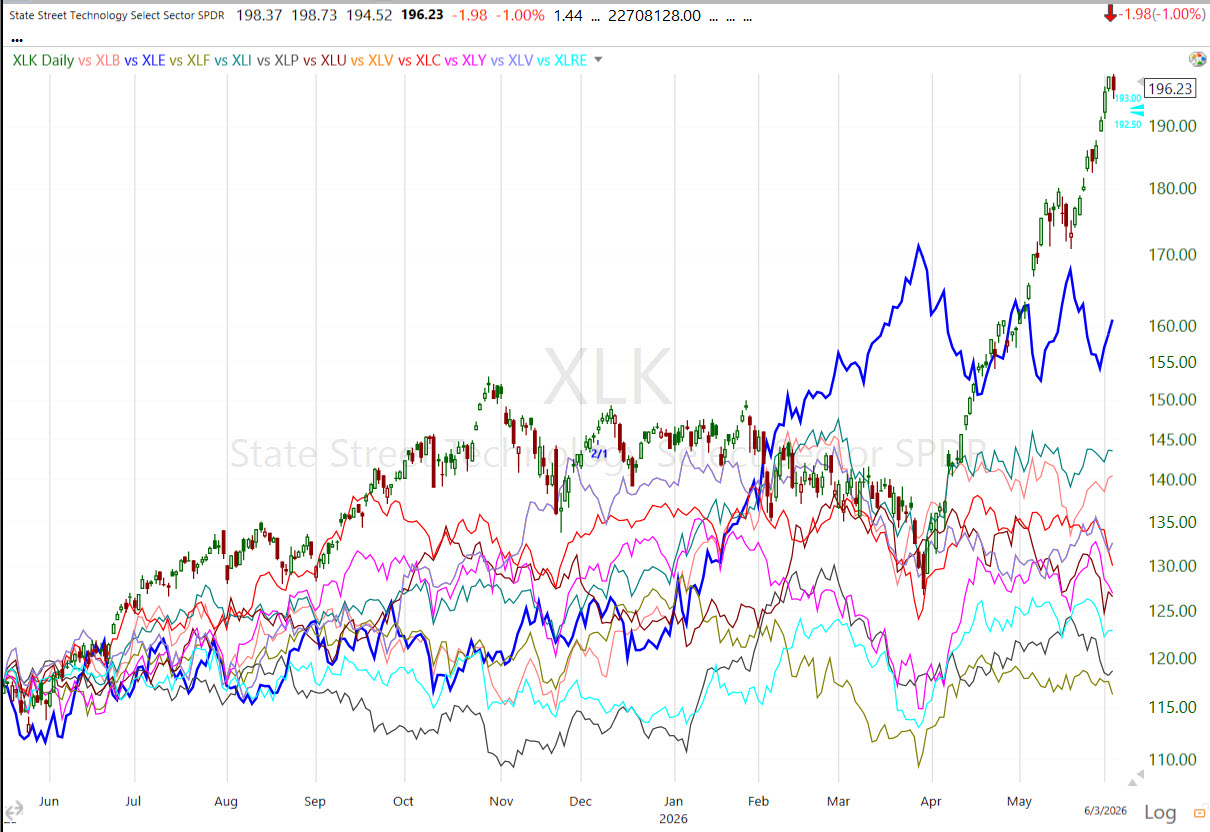 Technology sector (Daily normalized as of May 2025) and the other 10 S&P sectors. Energy is the closest (dark blue), but Tech stands out above and beyond.
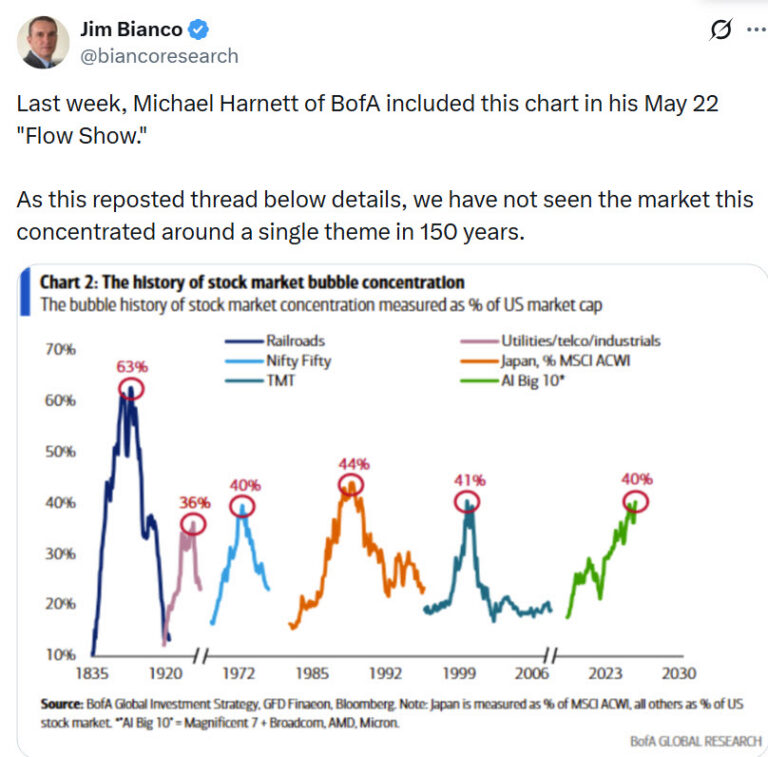
Recall yesterday’s BofA chart and excerpt:
“ the AI Big 10 (Magnificent 7 plus Broadcom, AMD, and Micron) now represents ~40% of total U.S. market capitalization, matching or exceeding the peaks of the Nifty Fifty (1970s), Japan bubble (1980s), and dot-com bubble (late 1990s). Only the 19th-century Railway Mania reached higher, at ~63%.”
Bottomline: We haven’t seen a market this narrowly concentrated in a handful of stocks in 150 years, since the Railway Mania…
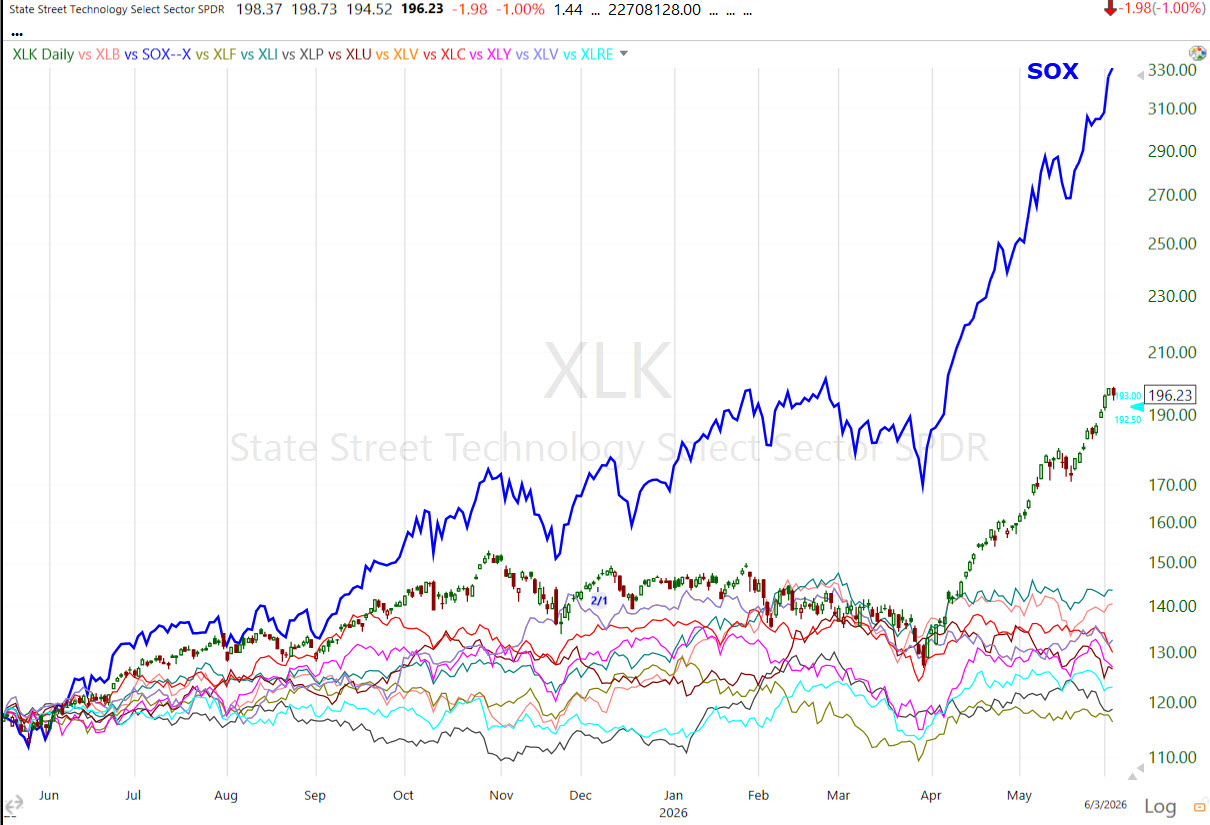 This is the same (Daily, normalized) S&P sector chart as above, I’ve just replaced Energy with the Semiconductor Index (SOX).
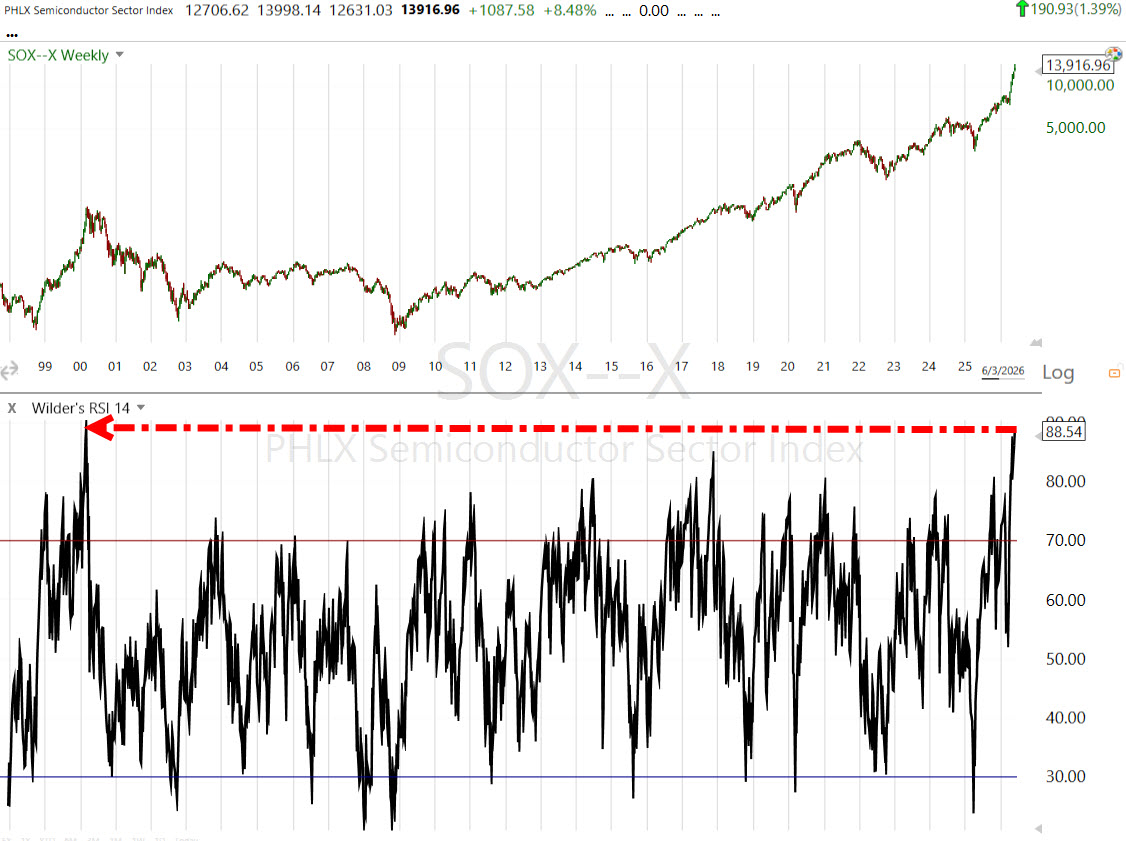 The most extreme since the Dot.Com buble’s top.
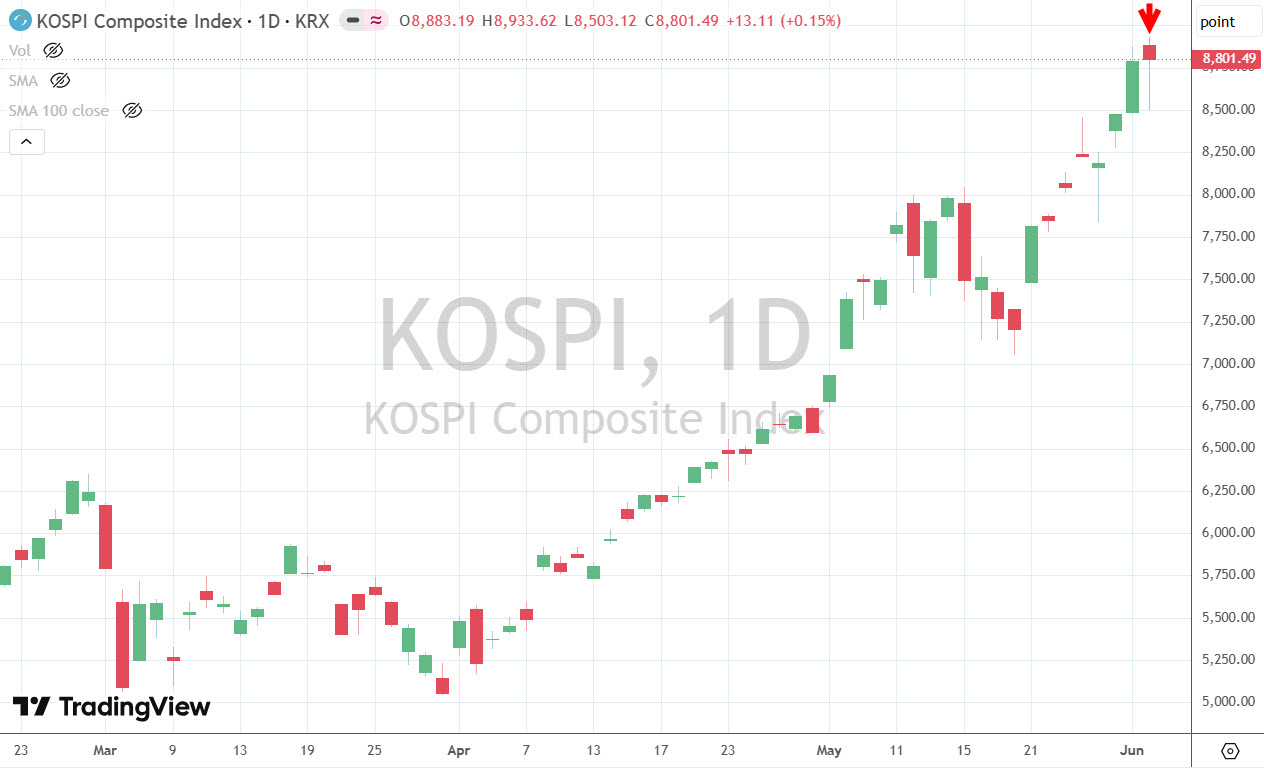 Like SOX above, the KOSPI ended with a Hanging Man candle too.
 (daily) But given the charts above, it’s another chart to keep an eye on. Intraday action had a small bear flag, so like the others, it’s all about confirmation / follow-through from here.
Materials ⇧ 0.21 %
Energy ⇧ 1.29 %
Financials ⇩ -1.15 %
Industrial ⇩ -0.08 %
Technology ⇩ -1.00 %
Consumer Staples ⇧ 0.40 %
Utilities ⇩ -0.43 %
Health Care ⇧ 0.79 %
Consumer Discretionary ⇩ -0.73 %
Real Estate ⇧ 0.05 %
Communications ⇩ -1.31 %
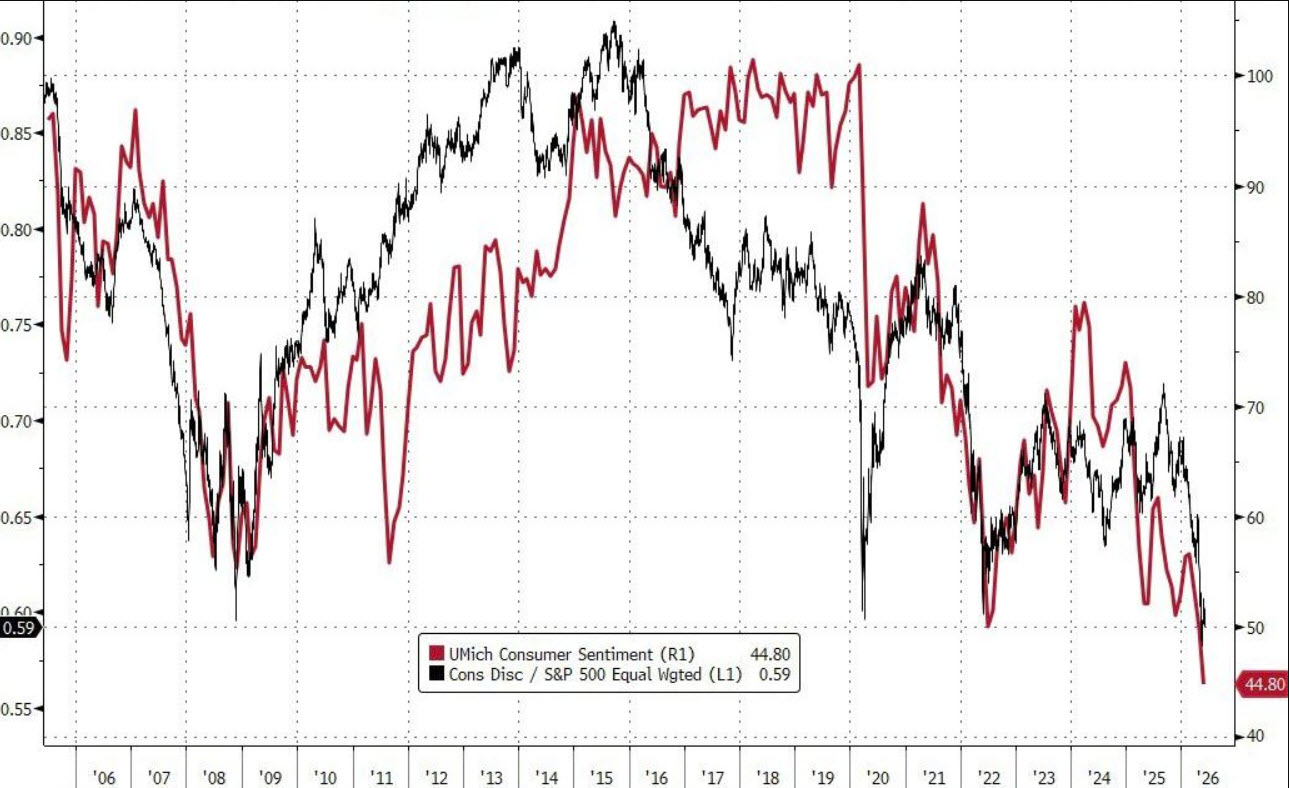
And he’s right. When inflation becomes persistent, it doesn’t just raise prices, it erodes real purchasing power, especially for middle-income households who drive the bulk of discretionary demand. Consumers shift spending toward necessities and defer or cancel everything else: the new kitchen, the family cruise, the restaurant night out, the new SUV.
Internals
Internals were massively lopsided with Decliners just shy of a 3-to-1 ratio over Advancers.
There was nothing close to a Dominant price/volume relationship, therefore no 1-day oversold internals signal.
Market breadth remains horrendous.
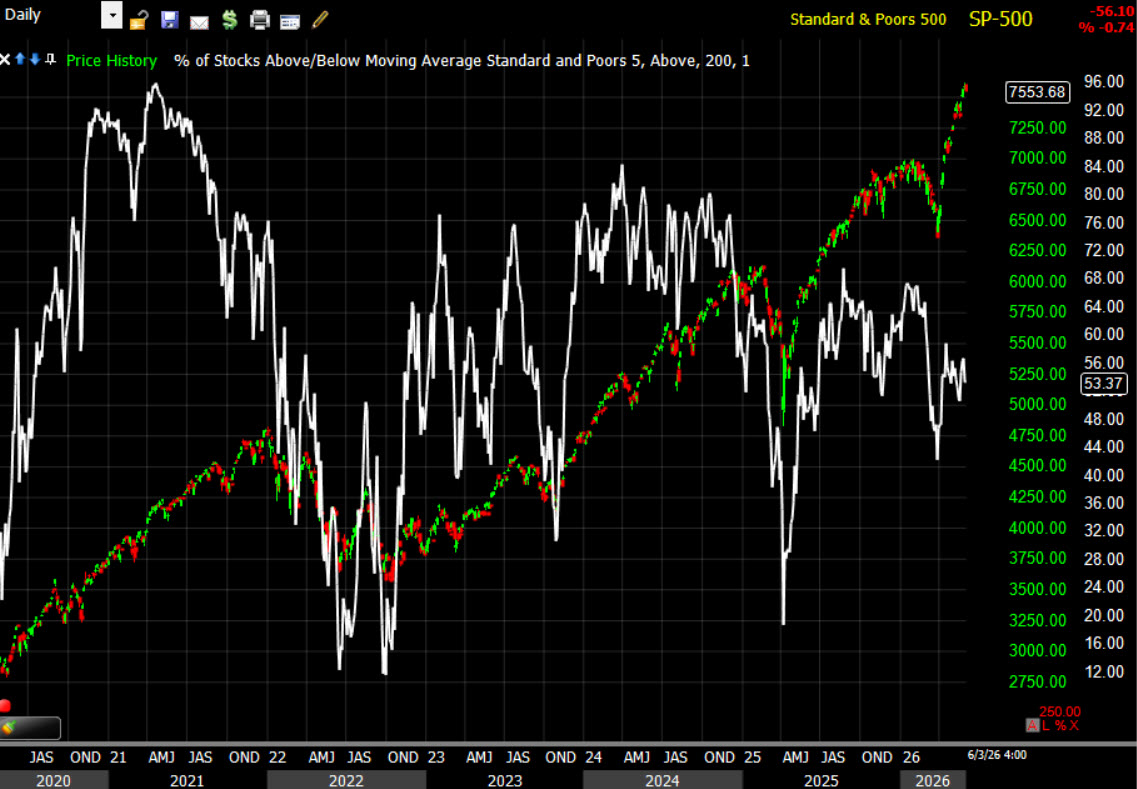 With the S&P just barely removed from a string of new record highs, the percentage of SPX component stocks above their long-term 200-day SMA is barely half at 53%.
Treasuries
Just as yields pull back to test key support — in the 10-yr yield’s case, successfully backtesting former resistance and the breakout level of a huge 2.5 year bullish consolidation/base–Treasuries saw their biggest drop (spike in yields) in 2 weeks today.
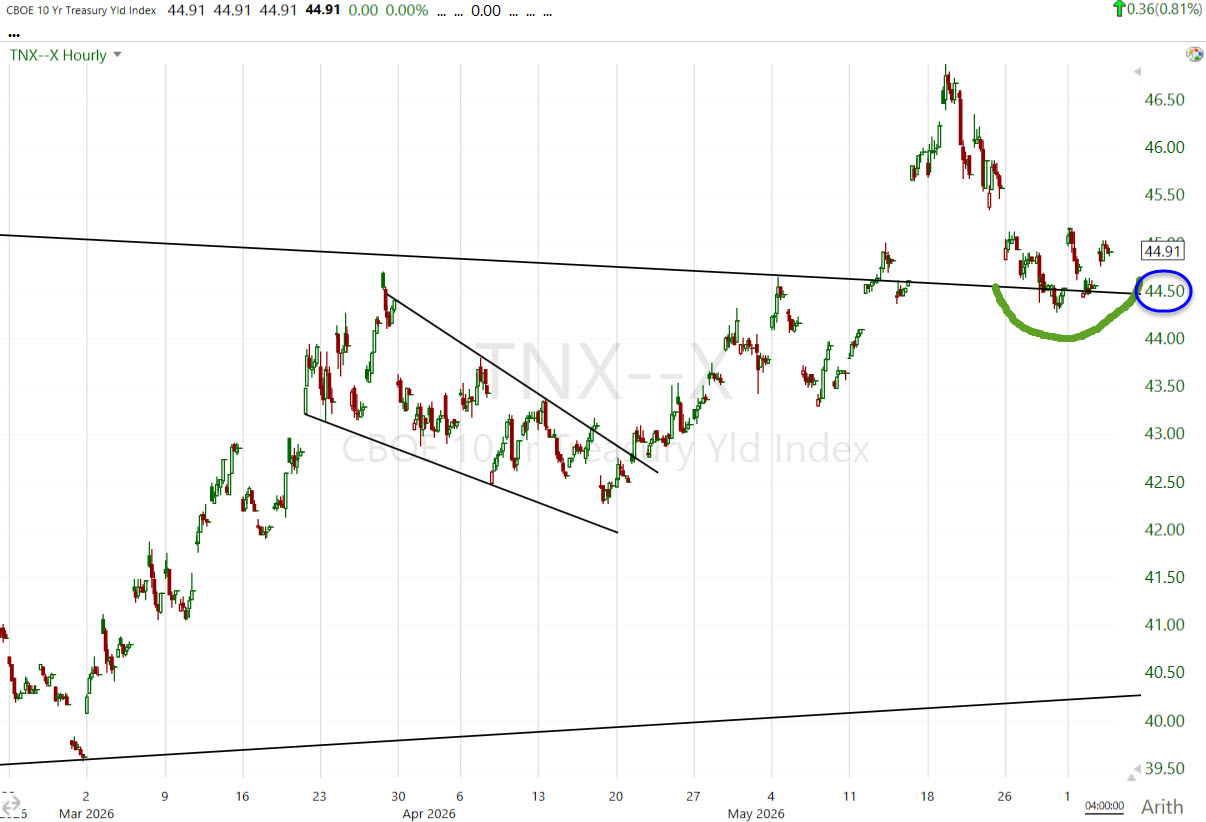 10-yr yield (60M) The 10-year Treasury yield pulled back sharply in recent sessions, providing equities with a favorable tailwind. However, the price action has been screaming “bullish for yields” Then it tested and found solid support right at 4.45%, potentially the most significant technical level in years.
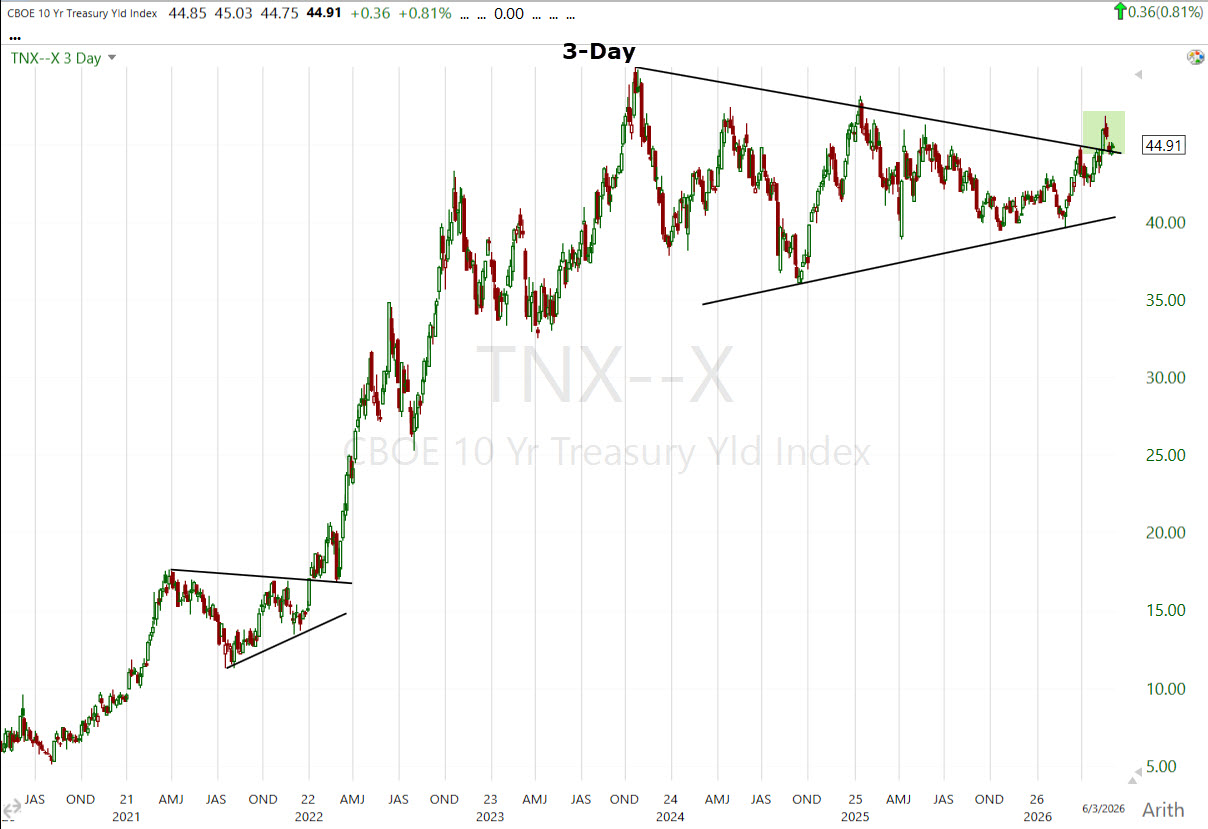 10-yr yield (3-Day) Huge bullish consolidation/range and the start of a breakout.
The 2-year yield settled up four basis points to 4.09%, and the 10-year yield settled up four basis points to 4.49%.
HY and IG Credit were unremarkable on the day. It’s the trend that jumps out.
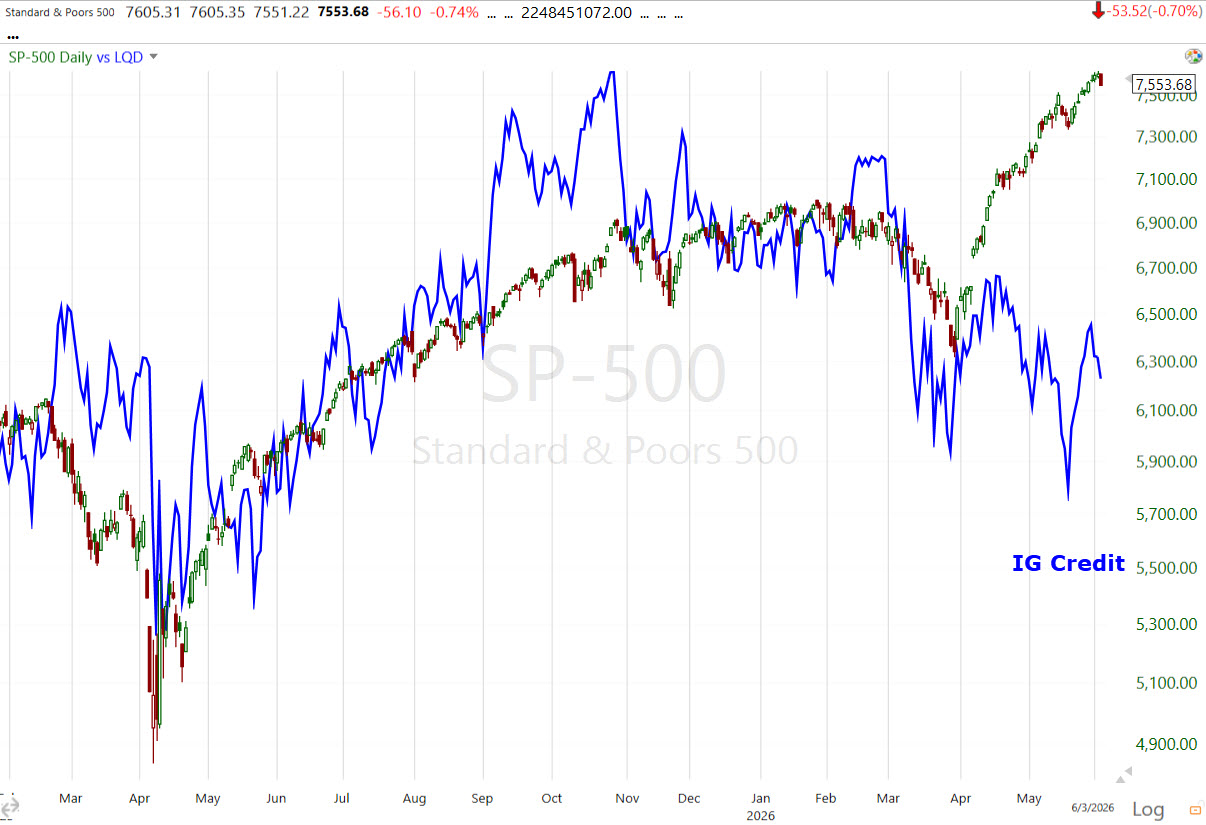 SPX and Investment Grade Credit (daily)
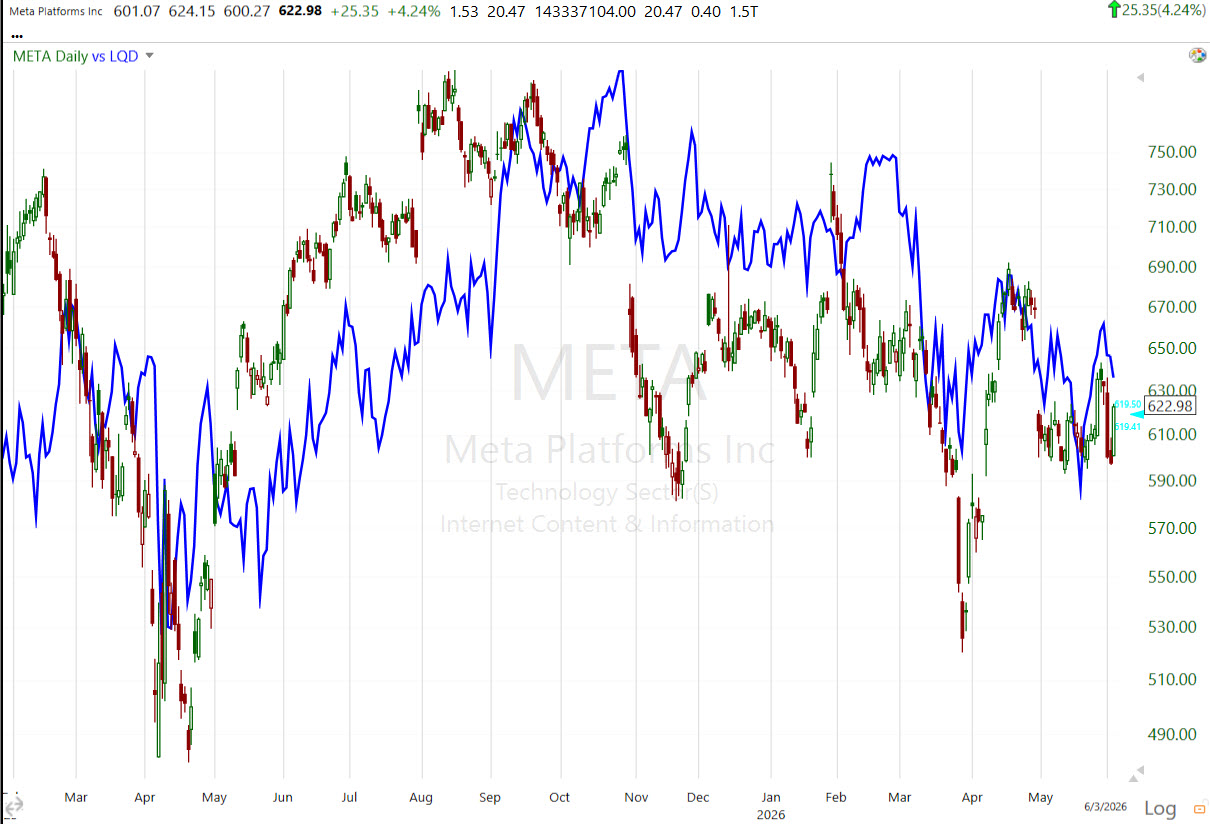 META & IG credit (daily) – Heavy issuance (~$84 billion total debt recently) and off-balance-sheet structures for data centers, but still strong cash flow.
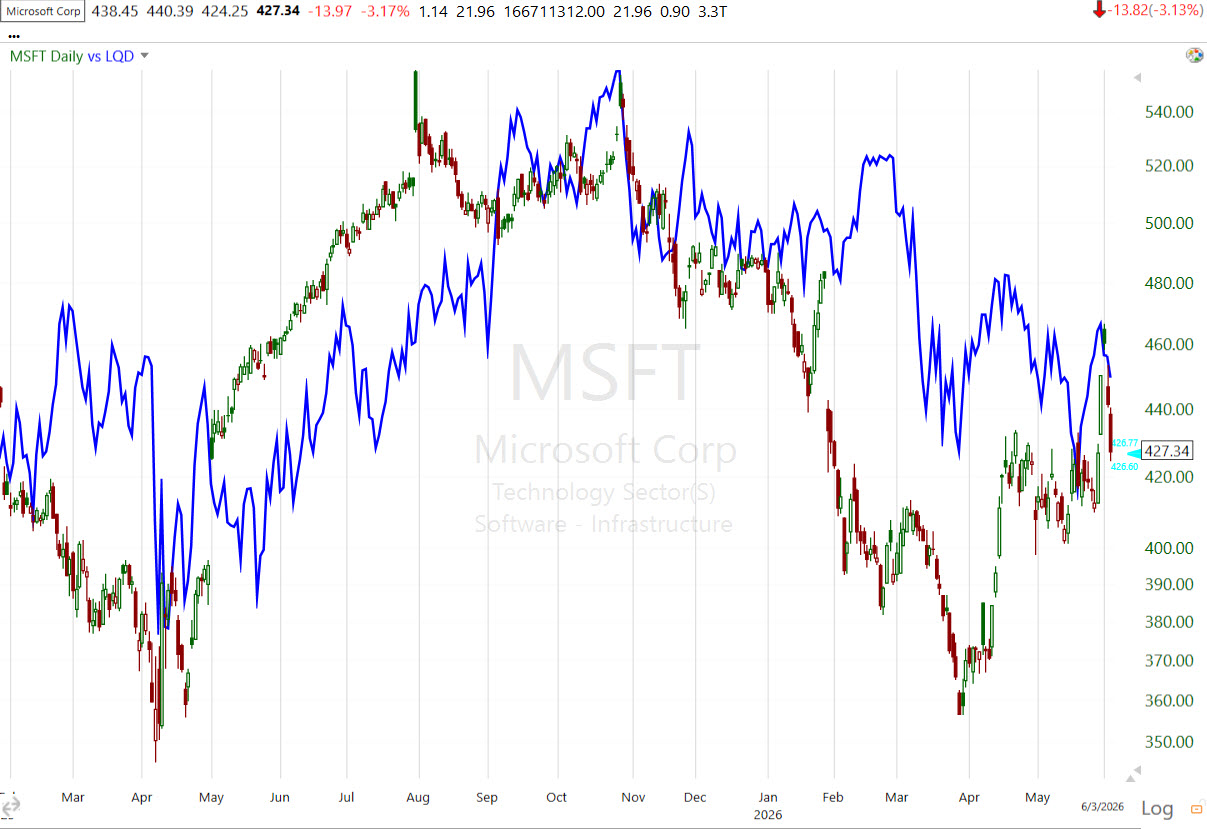 MSFT – Large issuance, but best-positioned balance-sheet wise.
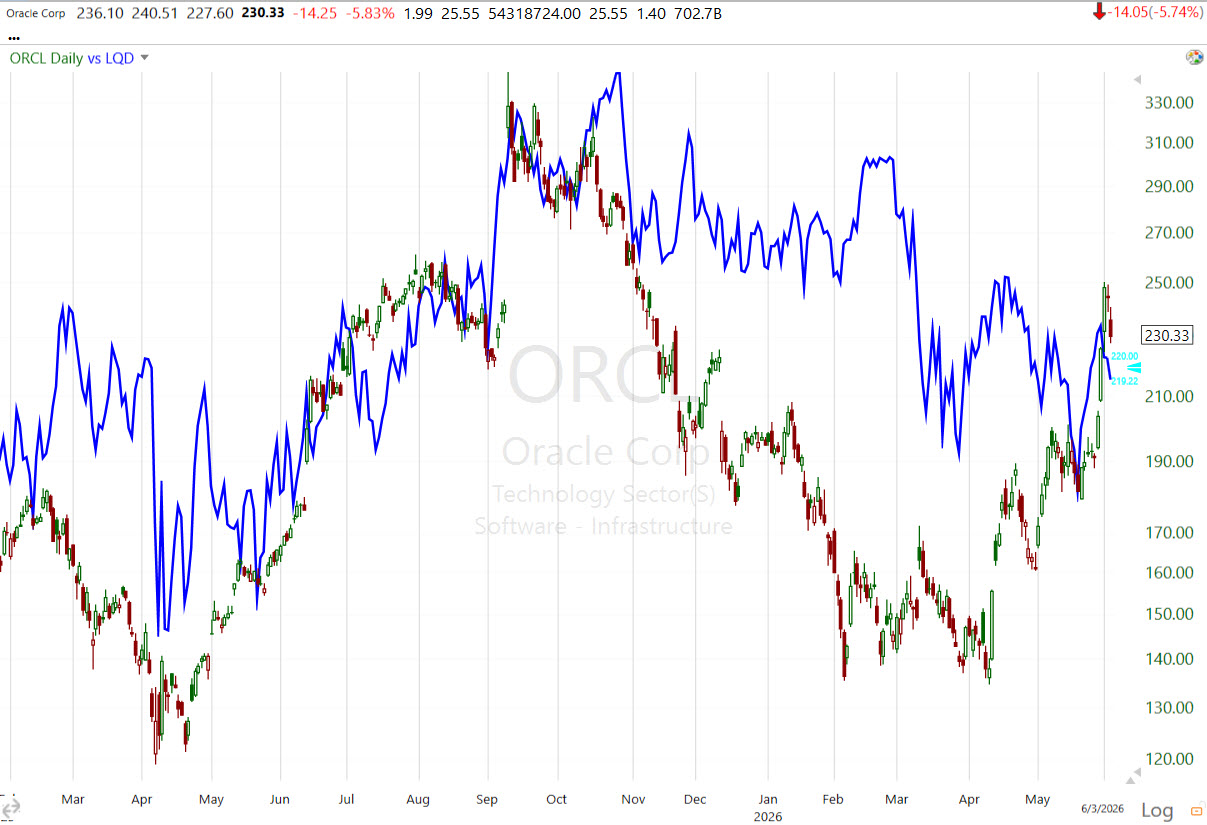 ORCL – The most leveraged and worrisome among the hyperscalers for AI-related borrowing: $300 billion Stargate deal with OpenAI. Rated only two steps above junk (Baa2/BBB, with negative outlook in some periods) and burning cash on the buildout.
Currencies and Commodities
The U.S. Dollar Index closed up +0.33% to $99.55. It’s one of the few assets acting like a geopolitical safe-haven. Treasuries can’t as higher oil drives inflation and bonds sink. Gold can’t as it has an inverse correlation to real yields and the dollar. I don’t expect a full-scale kinetic war to restart, but I can’t explain why the dollar is looking like it knows something is coming (like we just saw).
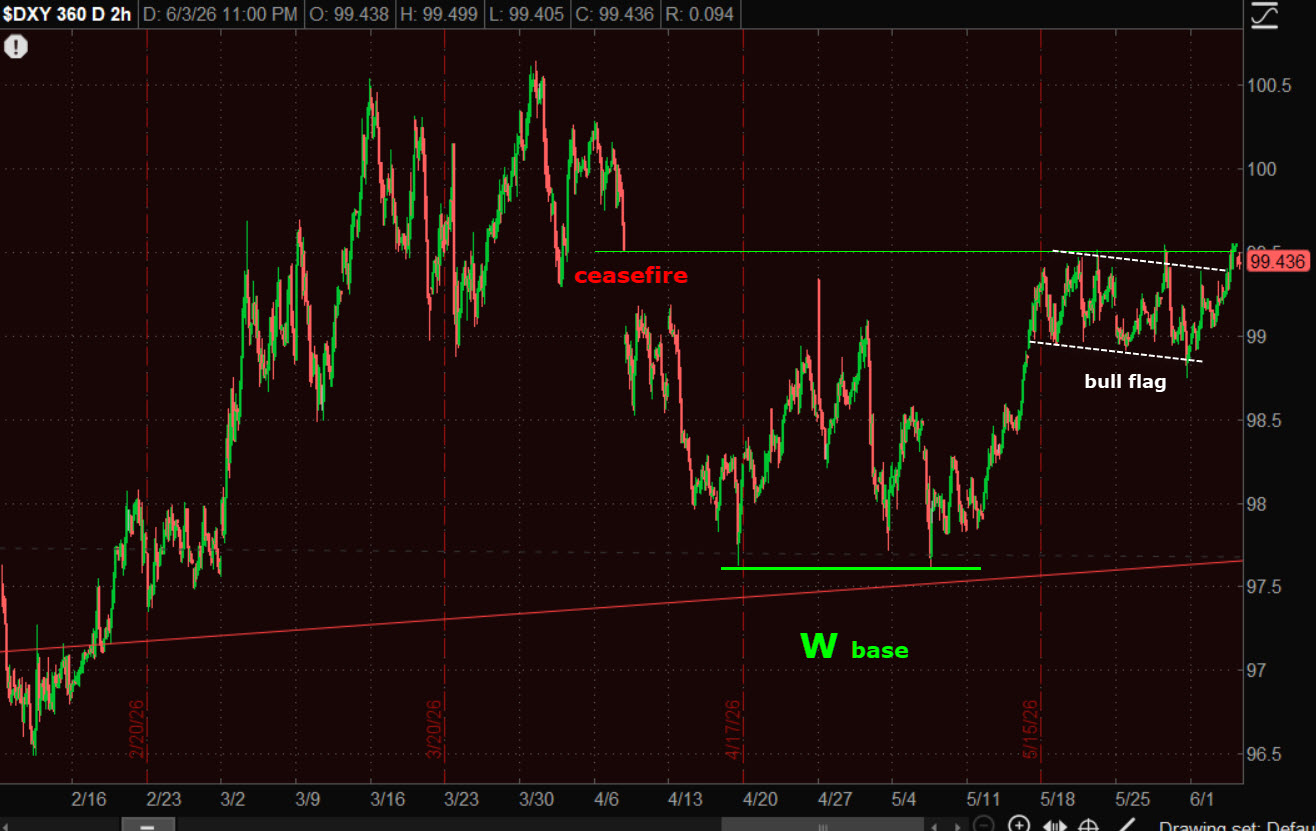 (2H) -The price action speaks for itself. One possible fly in the ointment is USD/JPY is trading back up at $160.
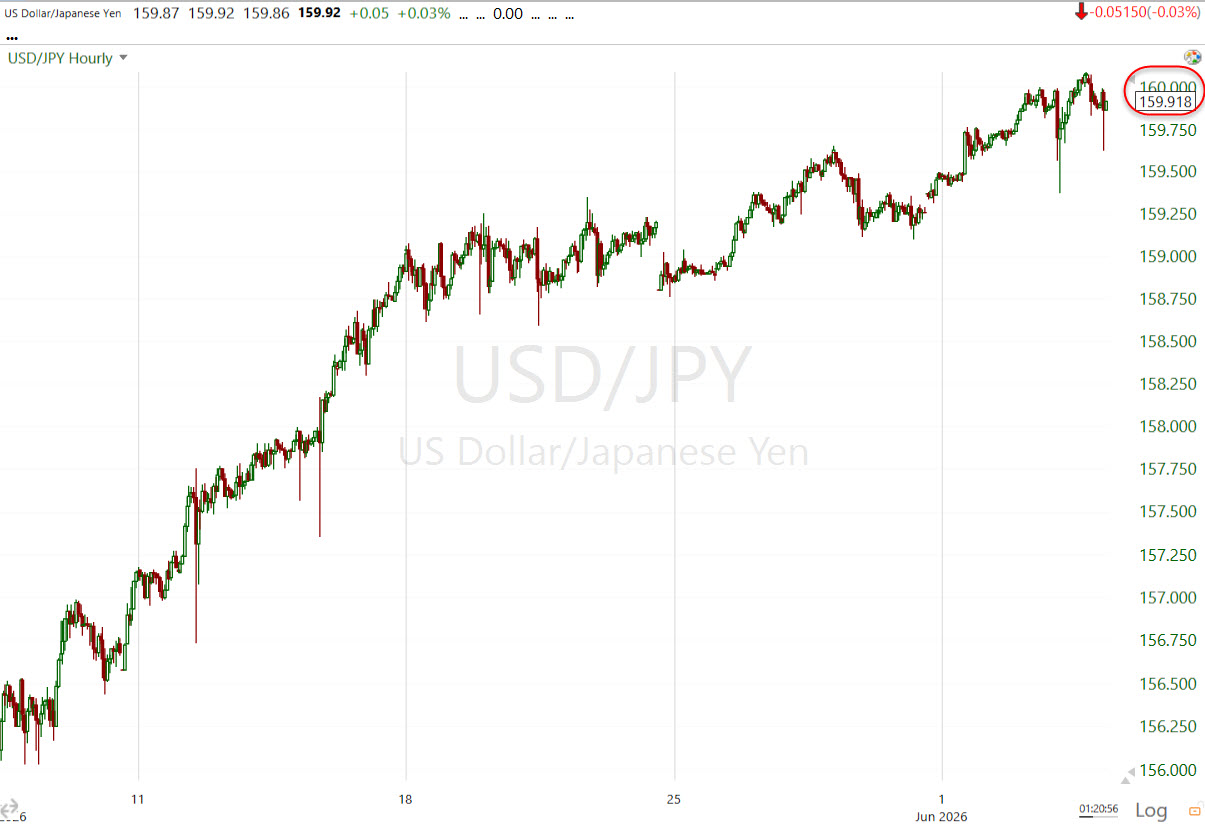 That’s the Bank of Japan’s Red-line. Last time Dollar-Yen was here the BoJ intervened with a BAZOOKA, spending $73-$74 BILLION dollars, selling the dollar and buying the Yen.
That would send the dollar careening lower. The flip side? They’d have to sell U.S. Treasuries to fund the intervention=Higher Yields. Something to watch as we enter the red zone again.
WTI Crude oil closed Tuesday with a bullish consolidation into the overnight session, then added to it, closing up +2.4% at $96.08/bbl.
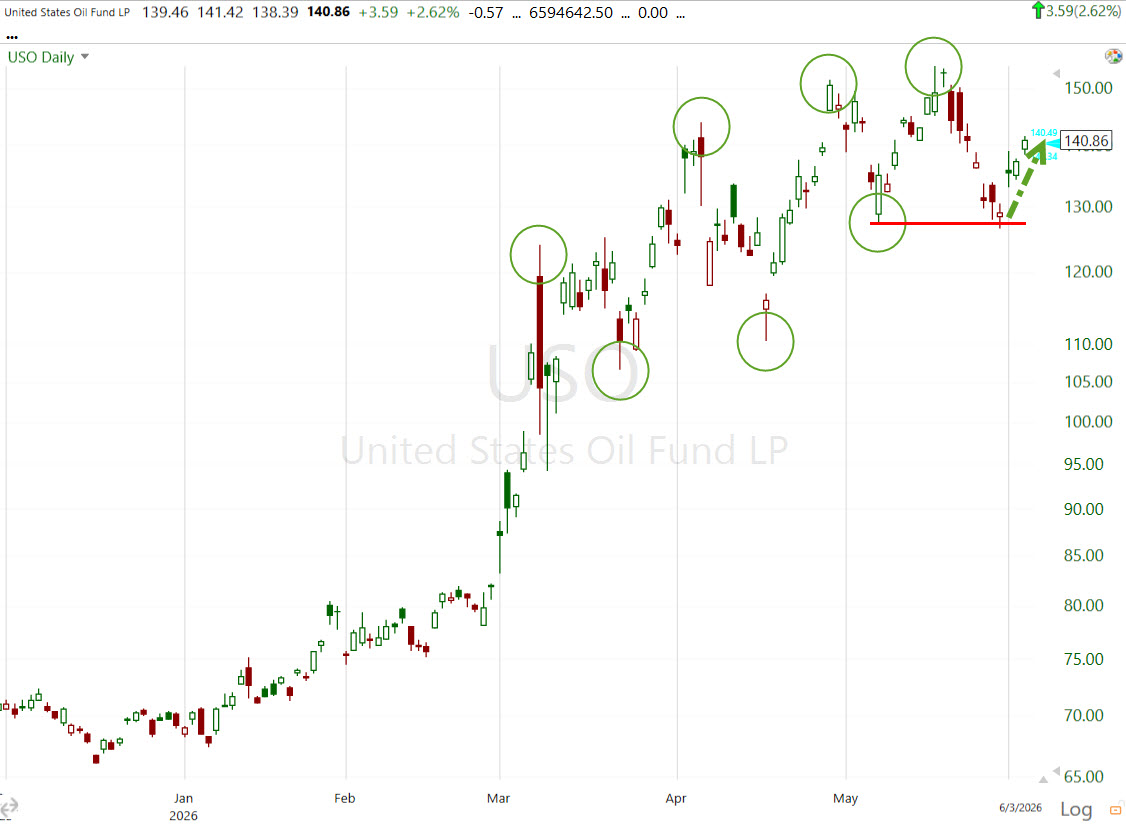 Using USO (daily) to clean up the trend, it remains a textbook up trend of higher highs/higher lows. Even last week’s dip amid all of the comments that a peace deal was imminent, oil tested the last pivot low and found support there (red).
Large crude drawdowns from the DOE inventories report complicate things and put a bid under oil:
- Crude -7.794MM, Exp. -3.050MM (biggest since February); sixth straight weekly decline.
-
Cushing: –583k barrels per DOE, with inventories approaching “tank bottoms.”
- Gasoline +3.364MM Unexpected builds, lifting inventories off the lowest seasonal levels since 2014
though Gasoline stocks remain historically low for this time of year despite the build.
- Distillates +1.502MM Mixed/small changes.
- Cushing -583K
- SPR drain: -7.993MM last week. Down -58MM since the start of the war to 357MM barrels. The operational bottom (or minimum operational level) for the US Strategic Petroleum Reserve (SPR) is approximately 150 million barrels before damage to the salt caverns and other issues.
The SPR sits at its lowest level in a year, causing concern that there’s not enough of a cushion if the disruption of flows from the Strait of Hormuz are prolonged.
Oil is not only pricing in real-time developments related to the Middle East, but longer-term factors that are already baked in:
- Restarting shut-in wells: Dozens of major fields across Iraq, Kuwait, and Iran have been offline for months; bringing them back online involves technical uncertainties, pressure management, and potential long-term reservoir damage that won’t be fixed overnight.
-
Clearing the Persian Gulf backlog: Between 1,500 and 3,200 vessels (including hundreds of oil tankers) remain trapped, along with ~20,000 crew members. Even if the Strait reopens immediately, it will take weeks just to move them out, plus additional months for hull cleaning from heavy biofouling (barnacles and marine growth that can spike fuel consumption 40-80%).
-
Repairing damaged infrastructure: Key facilities like Qatar’s LNG trains, Saudi export terminals, and regional refineries have taken direct hits; some repairs are estimated to take 3–5 years, locking in lower export capacity for the foreseeable future.
-
The long tail of supply delivery: Even after a deal, the oil and gas already stranded in the Gulf still has to load, sail the long routes to Asia and Europe, and actually arrive. Markets remain in deficit until that entire backlog clears , a process that stretches well into late 2026 or beyond.
-
Other baked-in structural effects: Permanently higher insurance and freight rates for the region, depleted global inventories from months of curtailed production, and limited alternative pipeline routes that can’t fully replace the lost Strait volume.
-
Strait of Hormuz transit fees: Iran is charging up to $2 million per tanker for safe passage. On a standard VLCC carrying ~2 million barrels, this adds roughly $1 per barrel in direct costs, a new structural premium that persists even after any ceasefire.
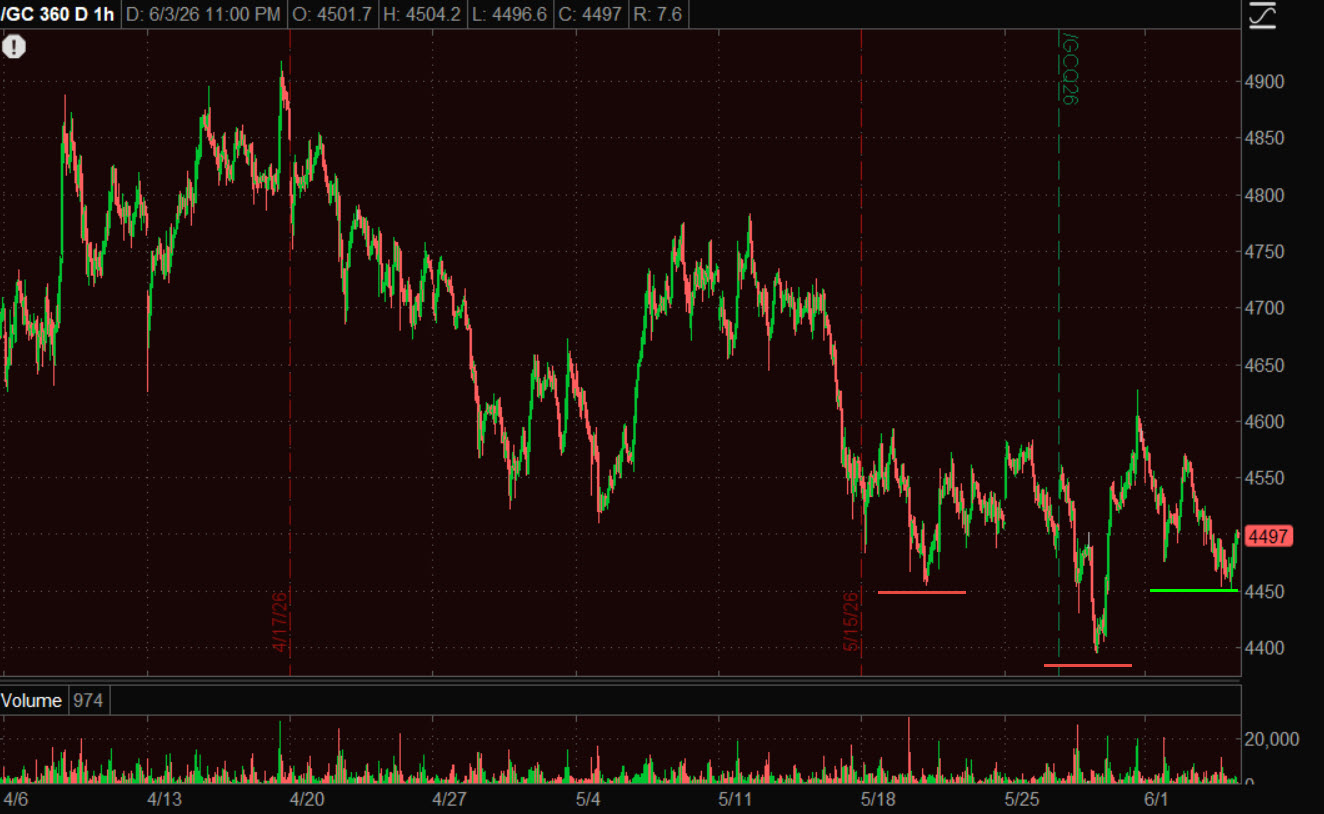 (60M) The scenario I’ve mentioned over recent days about gold having the chance to shift its bearish trend to a more constructive by putting in a higher low, may be under way (green). If Rates and the Dollar spike, it’s going to be very hard for gold to fight the outgoing tide, but for now, it has a major technical factor working for it…
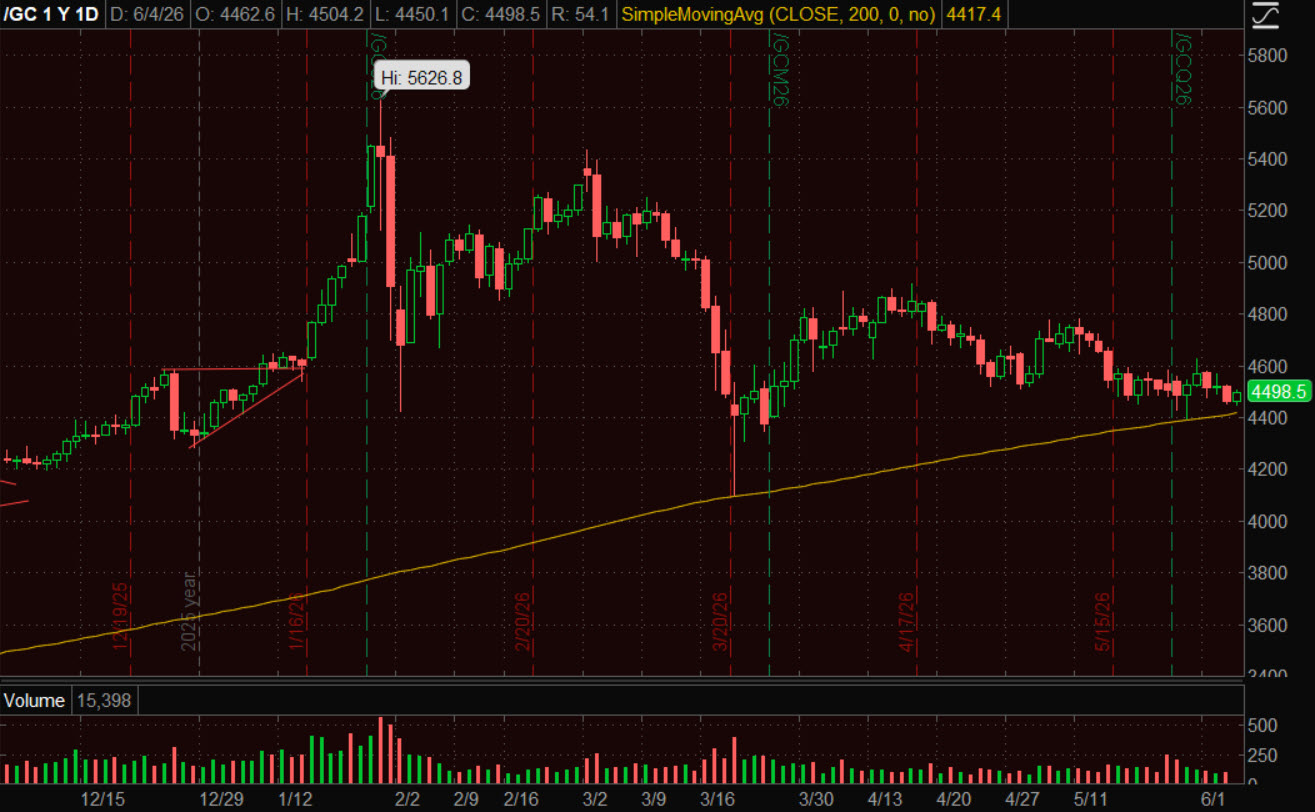 (daily) The 200-day moving average acting as support.
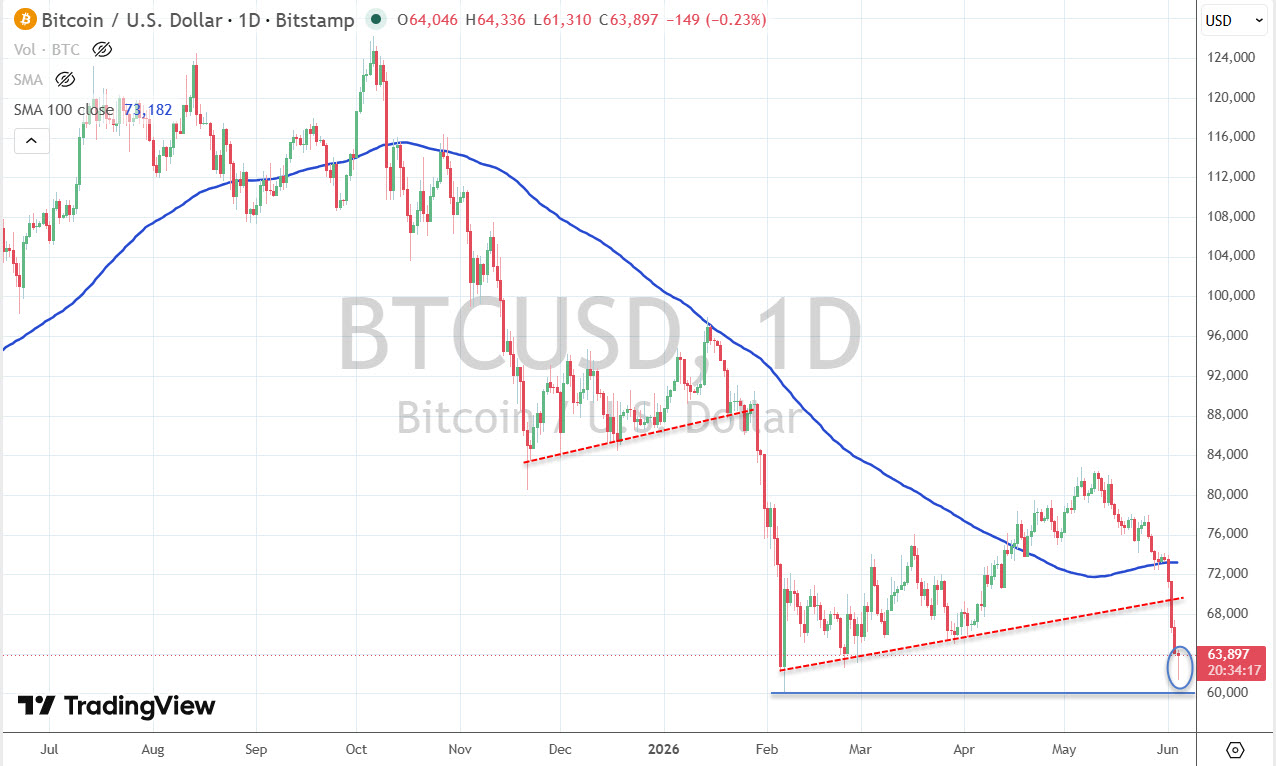 (daily) I’m including tonight’s price action because it’s remarkable. There’s a small bullish hammer after price tested down to $61,310, right off “last ditch support” at $60k.
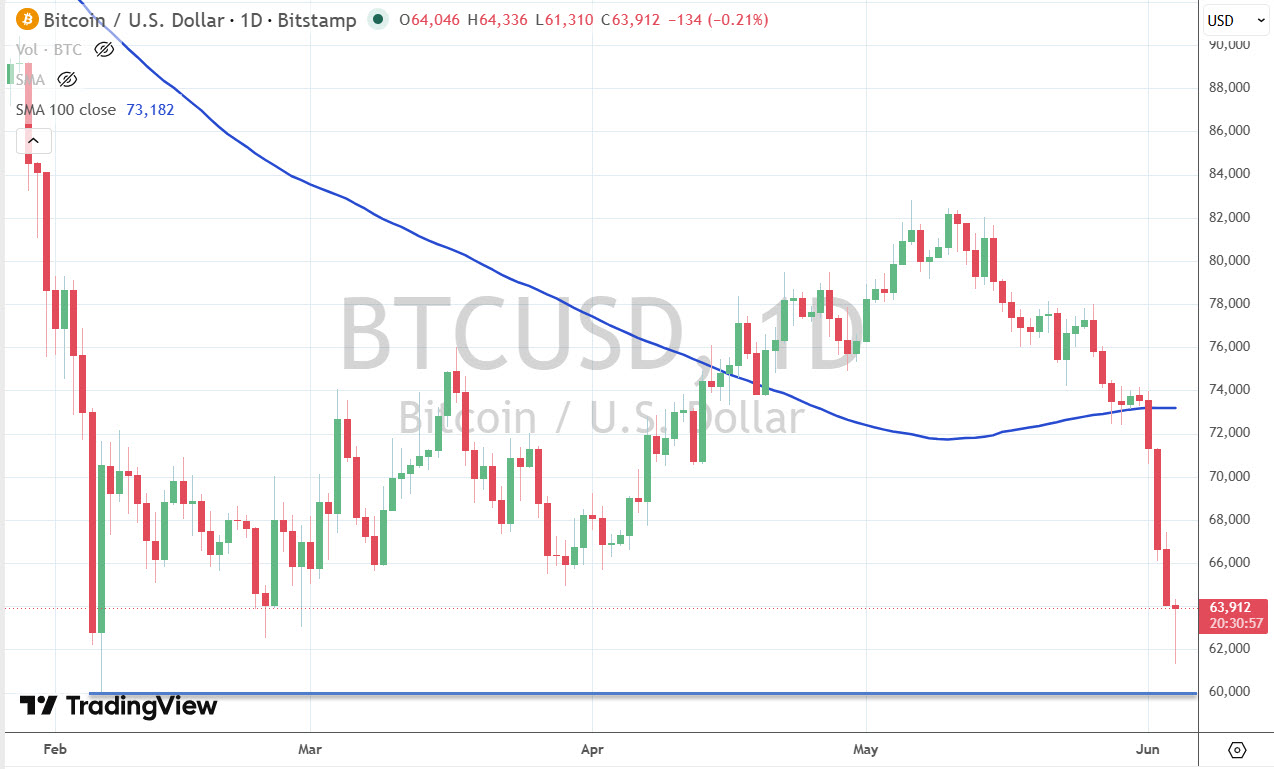 If I had to guess, I’d say that because $60k is such a crucial level, price is going to react there. Whether it’s a temporary speed bump of support that leads to a backtest of the broken 100-day, or a pause in the area, it’s a hugely important level and there’s almost certainly going to be some kind of knife-fight there.
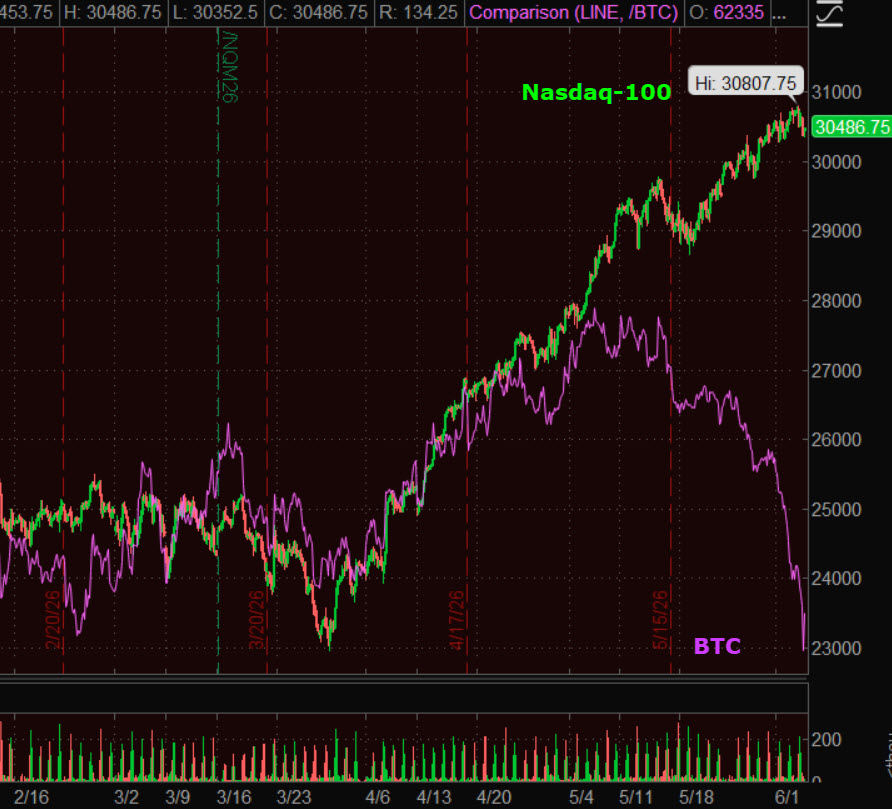 Nasdaq-100 and Bitcoin futures (3H) – As covered in Tuesday’s Wrap, this is nearly a carbon-copy of the set-up from February 2025, right before the Liberation Day Tariffs crash.
Summary
The S&P Tech sector’s trailing 12-month P/E ratio has jumped from roughly 32 to 48 since the 3/30 low.
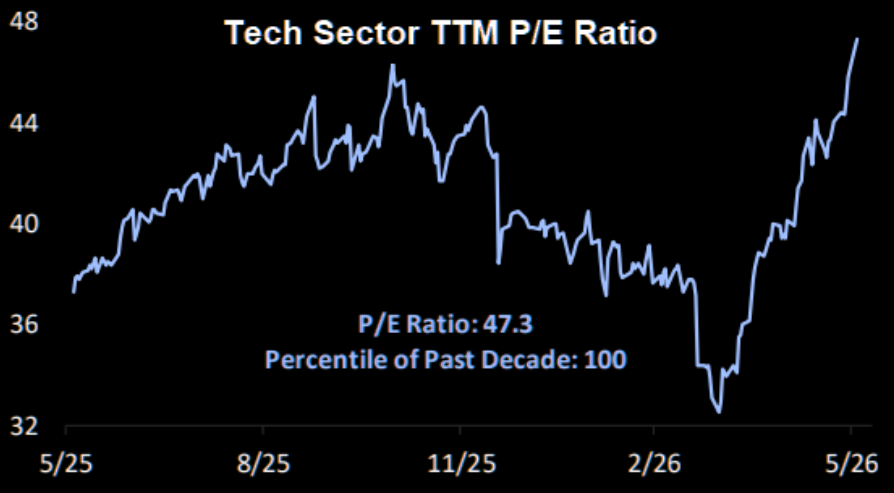
Source: Bespoke
Overnight
S&P futures are down -0.4% and Nasdaq -0.55%, while the dow and R2K are close to flat. Tech is under pressure tonight.
Yields are essentially flat.
The U.S. Dollar Index (-0.05%) is essentially flat, but right there at the bull flag’s breakout level, aligning with the “W” base’s breakout level and the Dollar’s pre-ceasefire level.
WTI Crude oil futures are down -0.5%, though trading in a nice little bullish consolidation.
Gold futures are up +0.75%, taking advantage of the calm in yields and the dollar, and trading at… $4501. Gold just doesn’t want to leave the area.
Bitcoin is down -0.4%, but that’s after being down a lot more and posting a bullish Hammer right above last ditch, key support at $60k.
There are a lot of very interesting levels in play. It feels like another one of those odd market synchronicities, and at a major fork in the road.