A Currency Crisis Continued


As we continue, let me sum up a possible scenario…
3C has been showing strong, longer term distribution in the market, 3C as well as Don Worden’ Money Stream (2 totally different accumulation/distribution indicators) both call the 2007 top and agree about the character of the market from 2009 forward.
SPY Daily 3C chart (2005-2013)

From the left to right, at the green arrow: from 2005 to mid 2007 3C is moving up with price at the green arrow, this is “Price and 3C trend confirmation.
“A” The 2007 top in which 3C shows a negative divergence (distribution)
“B” 3C makes a positive divergence at the March 2009 low, accumulation. At the same time, November of 2008 QE1 is launched, at the March 2009 lows the F_O_M_C announces the will add $700 Billion in MBS and $300 Billion in Treasury purchases.
“C” 3C goes negative as QE1 ends in March of 2010, the market tops 1 month later in to 3C distribution.
“D” 3C goes negative in to the April 2010 top as QE 2 ends in June of 2010. Shortly after that in to the late July/early August bounces, 3C goes negative (distribution) and the SPX drops by nearly 20%.
“E” 3C goes positive (accumulation) in to the early August lows after a -19% decline.
“F” 3C does negative (distribution) before and in to the September 13th F_O_M_C launch of QE3, the market doesn’t rally, but falls 8% over the next couple of months. 3C had called the distribution in to QE3.
“G” 3C is leading negative (strong distribution) in to the 2013 rally and new SPX highs,
***3C distribution signals can also be institutional short selling as both come across the tape as a sale***
It appears smart money is using price strength to sell and / or sell short in to as this is one of the sharpest leading negative divergences, even worse than 2007’s top / 3C distribution.
At the same time, Shizo Abe who is a monetary ultra-dove (who will nominate like minded individuals to the BOJ – Japanese Central Bank-Bank of Japan) defeats the former PM in a September run-off vote for the LDP presedency and as of December 26 2012, Abe becomes the new Japanese Prime Minister as LDP wins in a general election landslide. By March 2012, Kuroda is confirmed as the BOJ’s chairman with several new like minded governors that Abe nominated in an attempt to halt 20 years of Japanese deflation
Yen reacts to Shinzo Abe’s election victory…

The Yen moves higher vs. the $USD as Shinzo Abe wins a run off vote, the Yen starts moving up in an almost parabolic fashion as Abe becomes the PM in December 2012 and Yen reacts to the new leadership and “ultra-dovish” Abe BOJ nominees.
Back to the SPY/3C

On a closer timeframe, here’s the November 16th lows with 3C accumulation. There has been distribution in to this move higher and now 3C is in a leading negative low, far below anything on the chart. The Tend Channel stop out os around the same time as some significant moves in currencies and changes in character as well as very significant market breadth changes that I believe cannot be read in any other way than, smart money has been selling and moving out of a lot of stocks regardless of what the averages have been doing. There are few thing as deceiving as price in the major averages.

On a short 3 min chart looking at recent action at “A” we have a head fake move that has obvious distribution in to that move, there was another at “C” and “B” showed distribution as well. The accumulation at “D” was VERY small compared to the price move which makes me thing there’s been a lot more short selling than you might think. “E” shows some short term 3C/ Price trend confirmation earlier in the trend (about the same time the F_E_D leaked the F_O_M_C minutes a day and a half earlier and allowed investment banks like JPM and GS to trade on what was essentially insider information last week, Martha Stewart went to jail for a LOT LESS! At “F” there is a VERY serious leading negative divergence and this is the same time that the Yen has been moving up from a base that has been under accumulation since April 5th, this would cause the Carry Trade to be closed out.
Don Worden’s Money Stream confirms the 3C readings.

Recently there’s a deep leading negative divergence in Money Stream just before the Trend channel was hit and if you look at the last post, the same time market breadth deteriorated badly, it seems there was a lot more selling there than people think because of the price action in the major averages, the price action in a majority of stocks has been far less bullish, in fact downright bearish, breadth is objective. At “B” the Trend Channel was broken, but as I warned as that happened, that doesn’t mean an immediate reversal, often there’s a lot of volatility just after, but in my experience, it has been best to take the Trend Channel signal because the gains that are to be had after the stop tend to be very volatile and can disappear in the blink of an eye. At “C”price in the SPX moves higher, but Money Stream moves to a leading negative divergence, never moving higher with price in confirmation again. At “D” Money Stream ‘should” (like 3C) be making an all time new high with price if there was confirmation, both MS and 3C are telling us that there has been heavy selling in to this move higher and as we have seen in looking at ES’s VWAP, it has been trading around or above VWAP and the 2nd Standard deviation top channel, which is where orders are typically sold. Volume has not confirmed either, any “healthy” move higher should see expanding volume with price, it’s “Confirmation 101”.

The long term Money Stream/SPY chart shows the same as 3C, confirmation in to the bull market of 2002-2007, distribution at the 2007 top, volume showing capitulation “C” near the lows and “D” the lows on expanding F_O_M_C QE1 policy. Since then, MS has been in a strong leading negative divergence as this market has been fueled higher led by central bank manipulation, not anything near solid economic fundamentals and it looks like the F_E_D is preparing the market for the “Punch bowl” to be taken away (that didn’t workout well in 2000 or 2007. “F” shows once again, diminishing volume in to the move higher, people may discount it as “It’s different this time”, but it never is, they have been saying that for centuries.
I believe the higher $USD (which moves opposite the market) and a higher Yen (which causes the Carry trade used to finance leveraged stock purchases) are both going to put significant pressure on the market, not to mention everything else from F_E_D policy to market breadth and leading indicators.
The extreme move in gold and silver Friday as you know, was something we expected to some extent in the context of a pullback, but the extreme nature of it leads me to believe profitable positions that are years old in both (especially gold) were sold to cover some carry trades.

While gold/GLD (green) hasn’t been trading in its normal inverse correlation with the $USD for at least a couple of months since late February,recently the correlation has been there, however for GLD to make a move like it did on Friday on the kind of volume it did, the $USD (red) would have had to pull out of the pullback and move to a new high (red arrow).
As mentioned before, I believe the $USD is coming off a larger longer term base and has been pulling back recently, here’s the 3C/$USDX daily chart (these are VERY strong signals in 3C at 1 day).

Here’s the “W” base I pointed out in the last post with 3C leading positive divergence at “A” after a pullback to bring prices lower in to accumulation range at “A” and a stronger leading positive divergence at “C” , the recent pullback that has allowed the SPX to make its new all time highs while 3C has been in line-no negative divergences.
I also believe this pullback is ending which will pressure risk assets like stocks and commodities.

The 30 min $USDX futures show a 3C positive divergence in to the $USD recent pullback, that’s the point of a base pulling back, to accumulate on the cheap.

The more detailed, faster 5 min chart shows some short term small distribution to pullback price and strong positive 3C divergences in to the pullback suggesting the $USD pullback is about to end and prices head higher.

The much faster 1 min $USDX chart shows the same strong positive divergences with very weak negative divergences to pull back price with a strong leading positive divergence in to the start of trade for the new week (green arrow), this is what I expected to see on Friday when I said,
“And for the week, the USD pullback has been supportive of the market, but the last few days something hasn’t been right. I will look this weekend, but I suspect currencies are about to flip, the $USD back to its uptrend, the Yen moving higher and some others that won’t be good for risk assets like the SPX.”
As for the other part of the equation, the Yen and EUR/JPY / USD/JPY…

The hourly Yen Futures single currency chart shows a leading negative divergence (distribution ) at “A” and a nice rounding bottom with a leading 3C positive divergence (accumulation) at “B”, this is what I was worried about on April 5th hours after the BOJ announced their QE on steroids, the most ambitious Central Bank QE ever seen and I think it may have backfired on the BOJ.

The very strong 30 min 3C Yen chart shows strong leading positive 3C accumulation at “A” followed by a move higher in the Yen at “B”, this is not what the BOJ wanted to see and it is certainly not what anyone with an open carry trade wants to see as the cost of that trade is moving against them.

As for the 1 min chart, there’s a strong leading positive divergence at “A” followed by a move up in the Yen and what looks like a triangle consolidation at “B”. Normally this would be taken as a bullish consolidation/continuation pattern and I think the longer term charts say the Yen goes higher, but in the short term this could be a head fake move to bring the Yen lower to accumulate or if we see strong positive divergences form, it could be the price pattern it looks like.
Opening trade tonight in FX/Currencies is moving the way I expected Friday, the reason for this analysis, it’s not what the BOJ wanted, but more importantly it puts pressure not only on the market due to correlations, but it puts pressure on big institutions to close their equity trades and close their FX carry trades as they are quickly becoming expensive, remember some of these trades are at 200:1 leverage so every pip can be significant.

The carry pair of EUR/JPY has been moving down and opened lower for the start of trade this week, tried to move up and hit a new low.
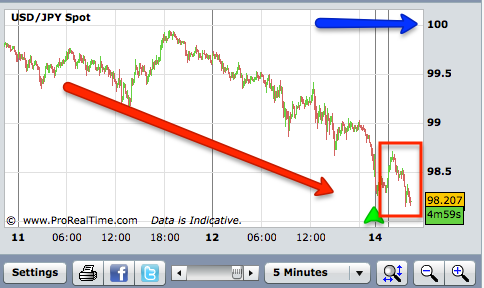
The other Carry trade, the USD/JPY has been moving lower, pressuring carry traders and I believe the reason GLD was aggressively sold Friday in part because over several years, these are some of the most profitable positions institutions have.
The BOJ WANTED to see the $USD/JPY trading at $100, but it’s moving away from that level.
From the short term 3C charts, I believe both pairs, but especially the $USD/JPY can bounce overnight, but I believe the pressure stays on them .
JGB’s are under pressure again tonight (the sign of failure for the BOJ) and gold and silver are selling off again, it is very probable that cash needs to be raised to meet margin calls on JGB (Japanese Bonds) positions.
The end result, I think the Bank of Japan may have pushed Central planning too far and may be seeing their QE policy blow up in their faces.The end result, I think the Bank of Japan may have pushed Central planning too far and may be seeing their QE policy blow up in their faces.
This might be too much for the market to handle, I believe this is going to be too much to handle. I expect lower prices soon.