
Daily Wrap June 12, 2025 — Futures Reel as Israel Strikes Iran: Navigating the Geopolitical Storm
*** I wrote most of this post as of closing data but as I’ve been writing Israel has launched an attack on Iran. Rather than e-write the entire post, I’ll leave it as it is/was and note any areas in the post where I was aware of that information in red and then we will take a look at what’s happening now at the bottom of the post.
Trade today was similar to yesterday, balanced and low conviction on both sides of the tape. Equities saw some pressure stemming from President Trump’s toughening stance on trade and some renewed geopolitical concerns surrounding the Middle East, but that was offset by rate-cut friendly soft inflation data, and Oracle (ORCL) posting impressive earnings and outlook.
President Trump said that letters with trade term offers will be sent to different countries. These offers will not leave much room for negotiation since he added that they will come with a “take it or leave it” caveat. The timeline was said to be a week and a half to two weeks.
On the geopolitical front, tensions in the Middle East are flaring after yesterday’s report that U.S. Embassy staff in Baghdad received authorization to leave their post. President Trump confirmed the report last evening, and today. ABC News reported that Israel is considering military action against Iran with logistical support from the U.S. President Trump made some contradicting comments on the situation, first saying, that the U.S. was, “fairly close to an agreement” with Iran, then warning ominously that, “Something could happen fairly soon” in the Middle East. Oil has been saying that for a week or two?
This is just one of many examples of oil looking trigger happy over the last week or so…

Economic data released today included a cooler-than-expected PPI report for May (0.1%; consensus 0.2%) and a jobless claims report, which showed a big jump in Continuing Claims (+54,000 to 1.956 million) to levels not seen since late 2021.
All of today’s economic data strengthened the market’s rate cut expectations for September, and it played a part in the market’s opening rise off lows.
Averages
The S&P 500 finished Thursday with a modest gain in a muted session, slightly outpacing the Nasdaq-100 and the Dow. Meanwhile, Small Caps and Dow Transports (-0.12%) lagged as my Most Shorted Index showed some more noticeable relative weakness on the day — shorts probably re-entering positions as some of the usual squeeze suspects like Non-Profitable Tech (-2.4%) were notably weak. The short-squeeze that defined the first half of the week, supporting Small Caps, has vanished.
S&P-500 ⇧ 0.38 %
NASDAQ ⇧ 0.24 %
DOW JONES ⇧ 0.24 %
RUSSELL 2000 ⇩ -0.38 %
There’s not much to update on the price charts. The SPX held above $6,000 and yesterday the Nasdaq-100 did us the favor of confirming $21,800 as its equivalent of SPX $6000, and held above that level as expected.
3C did get a little this afternoon squirrely this afternoon. I posted the first hint of quiet selling picking up in an Intraday Update, and again in the Afternoon Update.
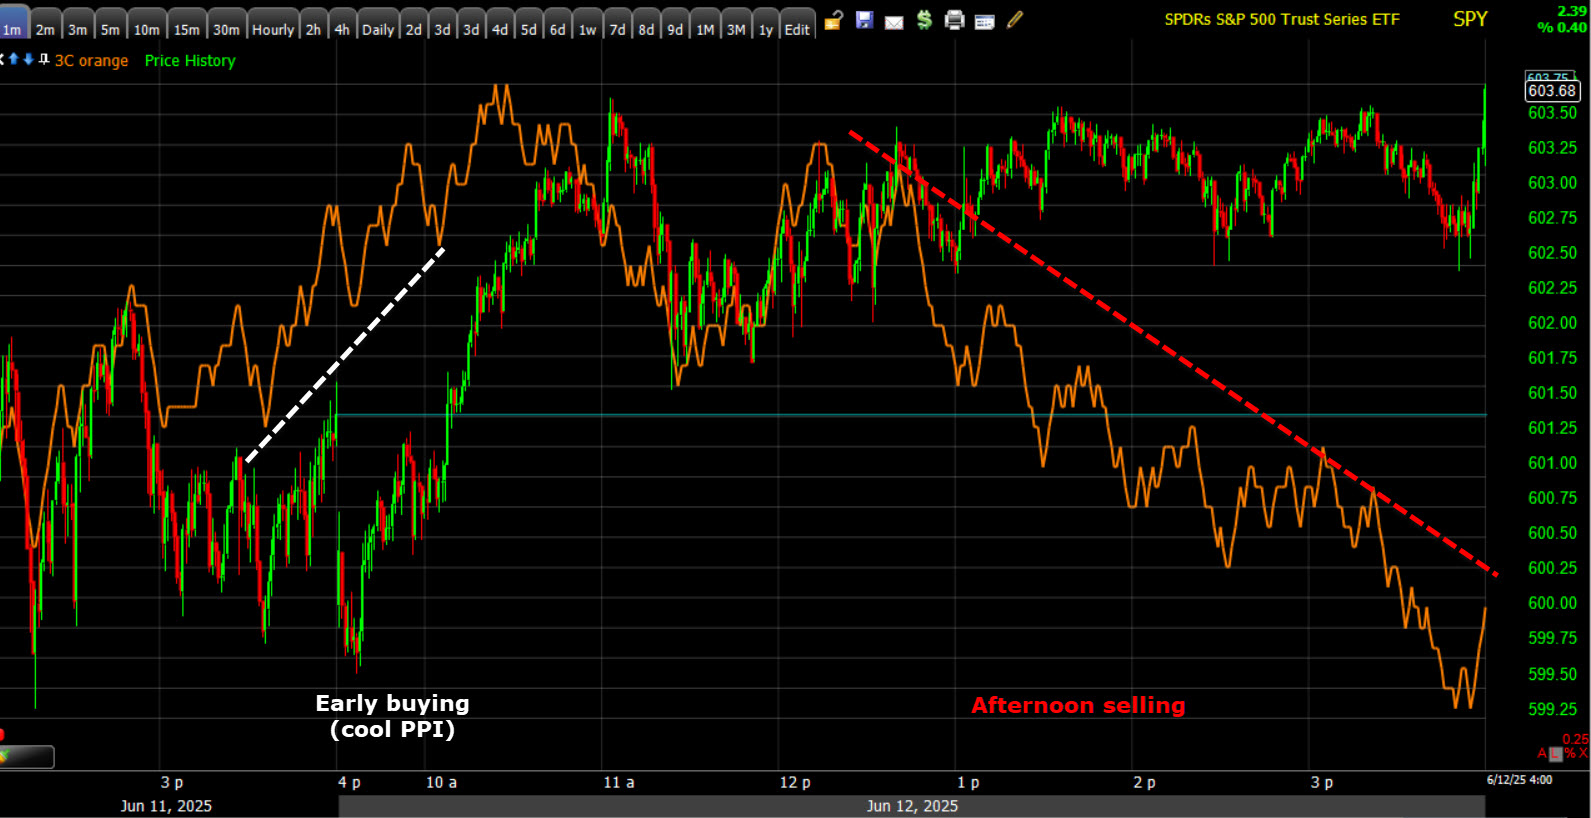 SPY (1m intraday today)
As best as I can tell, it looked to me like investors or a big fund was repositioning, selling mega cap tech, but not so much the Mag-7 stocks at the pinnacle of the group, but rather some components in the 71 component stock mega cap issue, MGK…
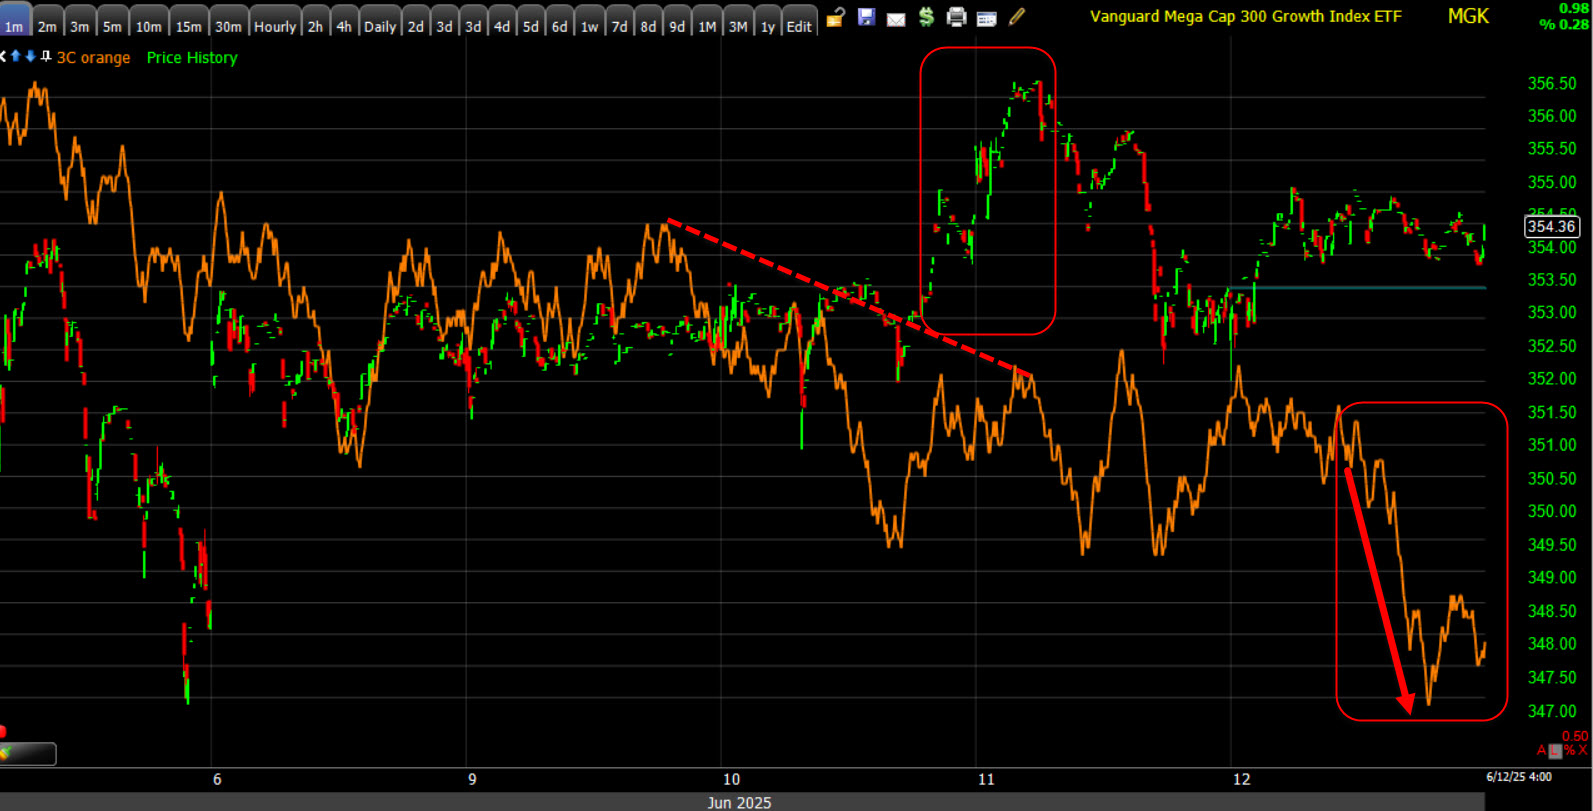 MGK (1m)
And buying more defensive sectors such as Utilities, Consumer Staples, and Health Care.
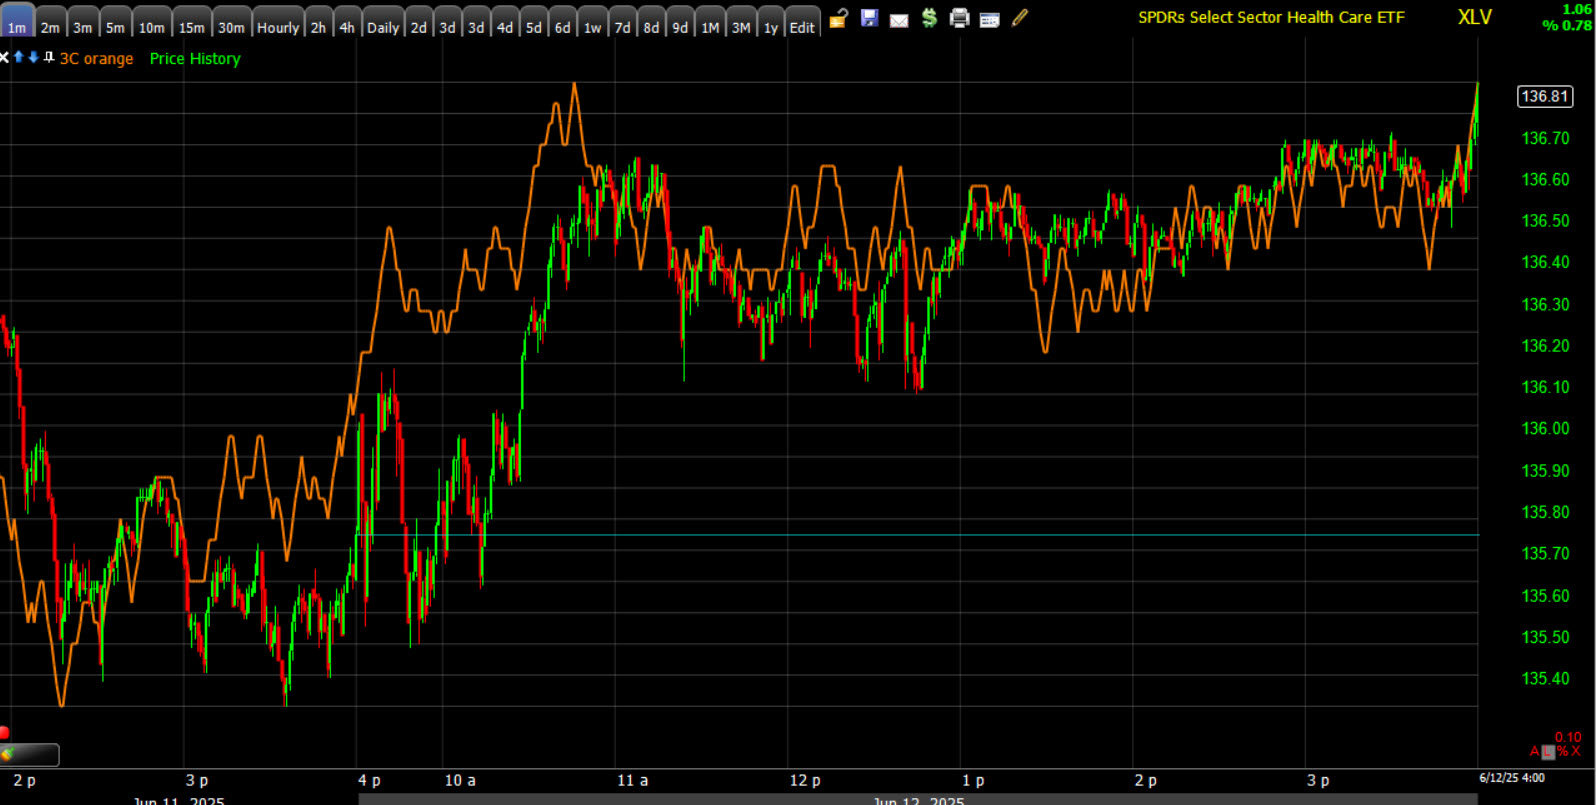 Healthcare sector (1m intraday today) with early buying and perfect 3C confirmation of gains.
As reported yesterday, we got the first whiff of some more meaningful selling that faintly smells like distribution. That means that the negative divergences in important areas such as the averages or key groups like the mega caps, is starting to migrate from the very sensitive, but weaker, short term 3C time frames (1m), to the more meaningful longer term 3C trend time frames (3m-5m).
Volatility started to act up today with VIX (+4.4%) following in VVIX’s (+4.1%) footsteps and displaying relative strength.
The ABI is not currently a factor sitting at 31.
Considering the heightened geopolitical risks, the SKEW index has barely moved from where it has been sitting at 140-ish for a month. That reeks of investor complacency.
S&P sectors
Seven sectors finished the day in positive territory and one flat, with top-weighted technology finishing only behind the lightly-weighted Utilities sector. Oracle (ORCL +13.3%), the fifth-largest component stock in the Tech sector provided the sector support. Lower rates provided support for Utilities and other counter-cyclical sectors. The main takeaway was the day had a more defensive tone in sector performance. The rotation seemed to be money flowing out of mega cap tech, to defensive sectors.
On the downside, the mega-cap heavy Communications sector was the worst performer with 20 of 22 component stocks ending lower. Interestingly, Media and Advertising stocks were some of the worst in the sector, and Alphabet (GOOG -1%) was among the most influential laggard in the sector. Google had intermittent blackouts across nearly all of its products, from cloud to search to email.
The industrial sector modestly underperformed other cyclicals with Boeing (BA -4.8%) weighing the group down after an Air India 787 crashed shortly after take-off in Ahmedabad.
Chipmakers were among the outperformers in early trade, but the Philly Semiconductor Index (SOX +0.3%) gave back the bulk of its early gain, finishing behind the broader market. SOX is near a thick zone of resistance from the better part of last year (see daily SOX chart below). Near-term, SOX is officially entering consolidation near that thick resistance.
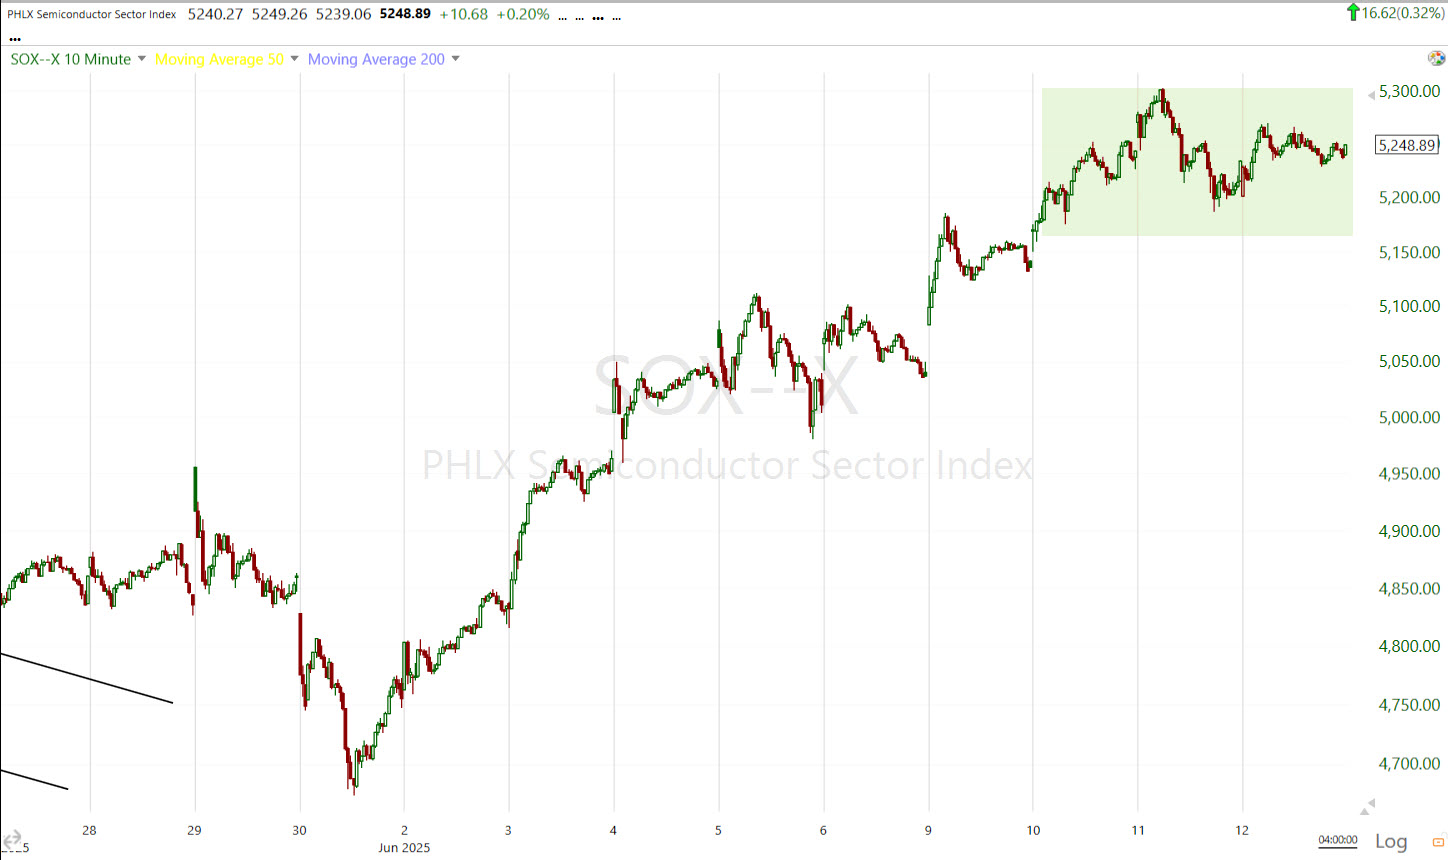 (15m) – That said, the price action is still excellent. Short-covering has recently been the primary driver. The consolidation should be considered to be bullish until it proves otherwise. In other words, I don’t love the risk / reward profile to go long semis from this consolidation, but I would not short them yet while price action still looks constructive.
Volume, is a completely different story and casts some suspicion on the price trend.
I identified the probability of head and shoulders top in SOX last July at the record high, well before there was any hint of a head and shoulders on the price chart. Yet, a head and shoulders pattern developed and price broke down from it. It was the price volume trend that gave it away back in July at record highs. Volume should increase on a healthy advance, and diminish on pullbacks or corrections within that advance.
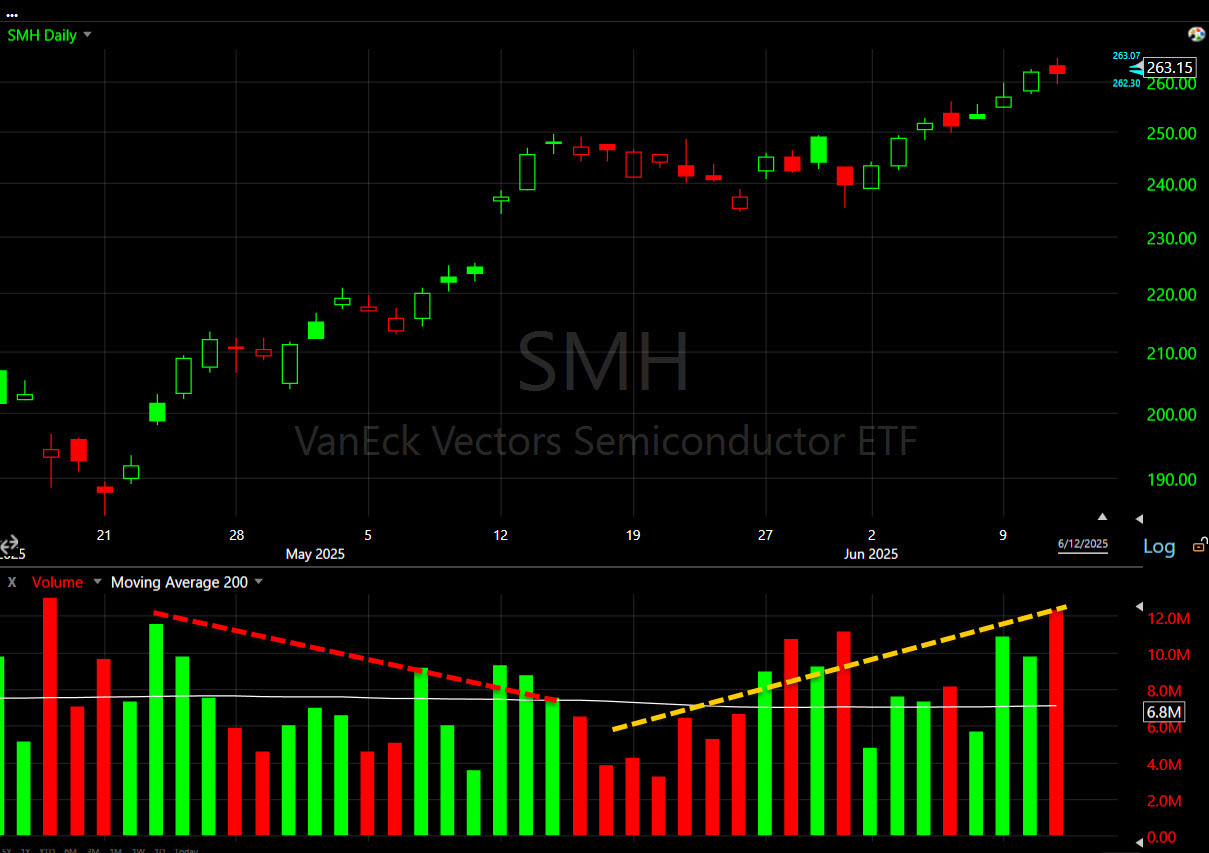 (daily) – That is not what is happening here. Volume was heavy enough at the start of this advance from April 21st that I wouldn’t have called it out as problematic, but it is trending lower as price rises. More recently we see heavier red volume as price advances and on minor corrections and consolidations. This is the opposite of what you should see in a healthy advance, no matter what the asset is.
When I see price volume action like that, I am almost sure of what I’m going to see on the 3C chart.
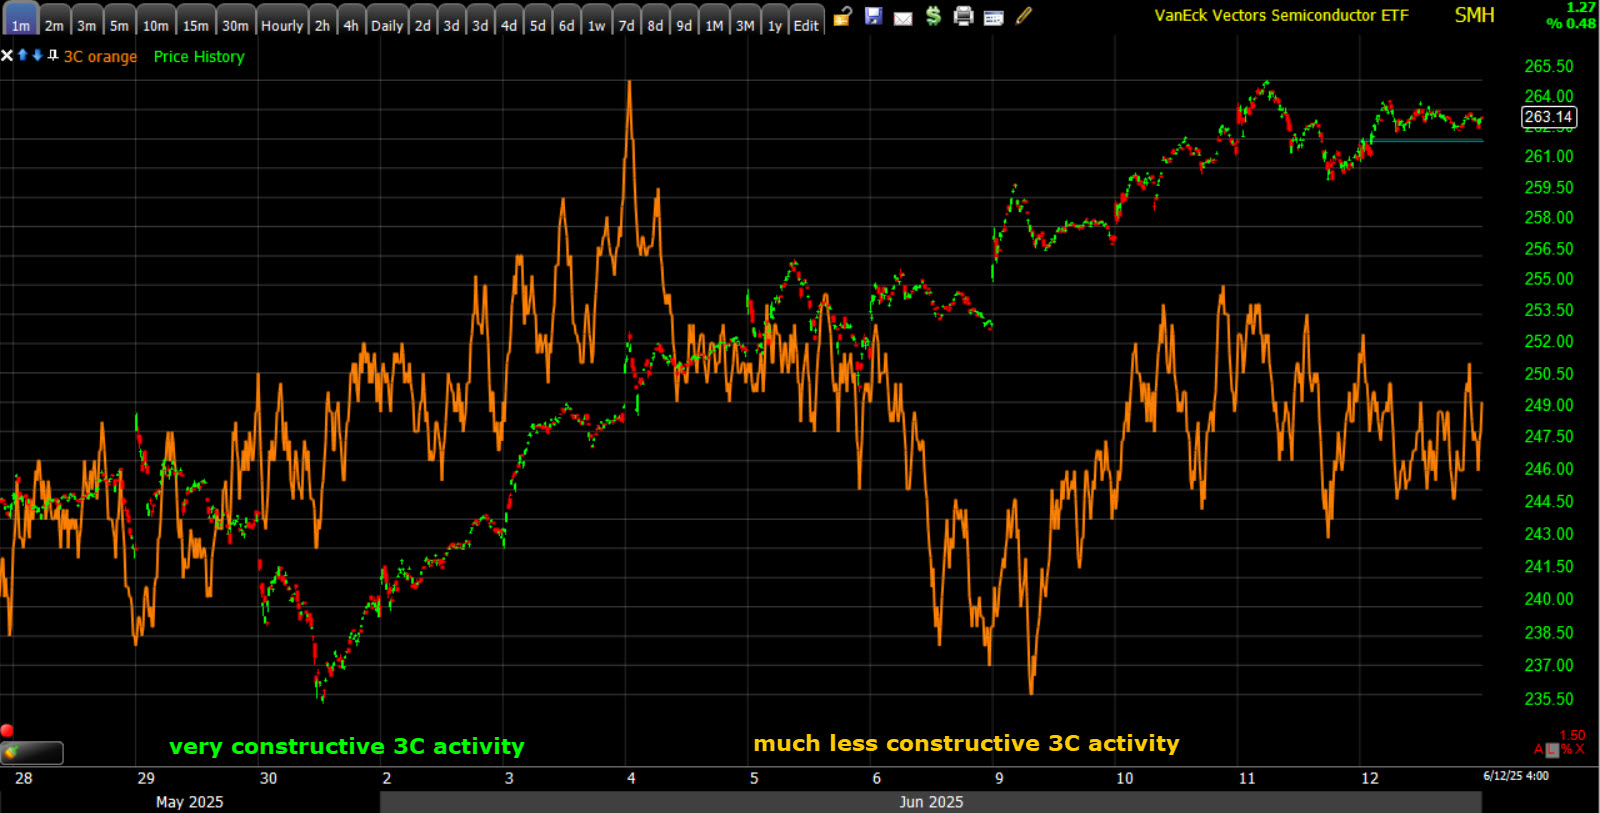 (3m) – The first half of the rally has stellar 3C activity from positively diverging to leading price higher. The second-half was after the Geneva consensus between the US and China, which broke over a weekend, then we saw very poor 3C confirmation as soon as trade opened that Monday and ever since then. It was evident that our April 21st buyers were selling the news.
3C is much less constructive in the more recent second-half of the chart. Underlying money flow is not as supportive which we can tell just from looking at the price volume chart above. However, it is moving in the same direction as price. In short, that means that the buyers are still in control (or the shorts who are covering), but their conviction is far lower, and there are those who are taking profits more aggressively and exiting the position. What I’m looking for from here on 3C is evidence that the sellers/shorts are gaining control.
If SOX doesn’t make a new record high above $5904, there’s a greatly increased risk that it posts a lower high that defines the early stage of a primary downtrend, or better known as a bear market.
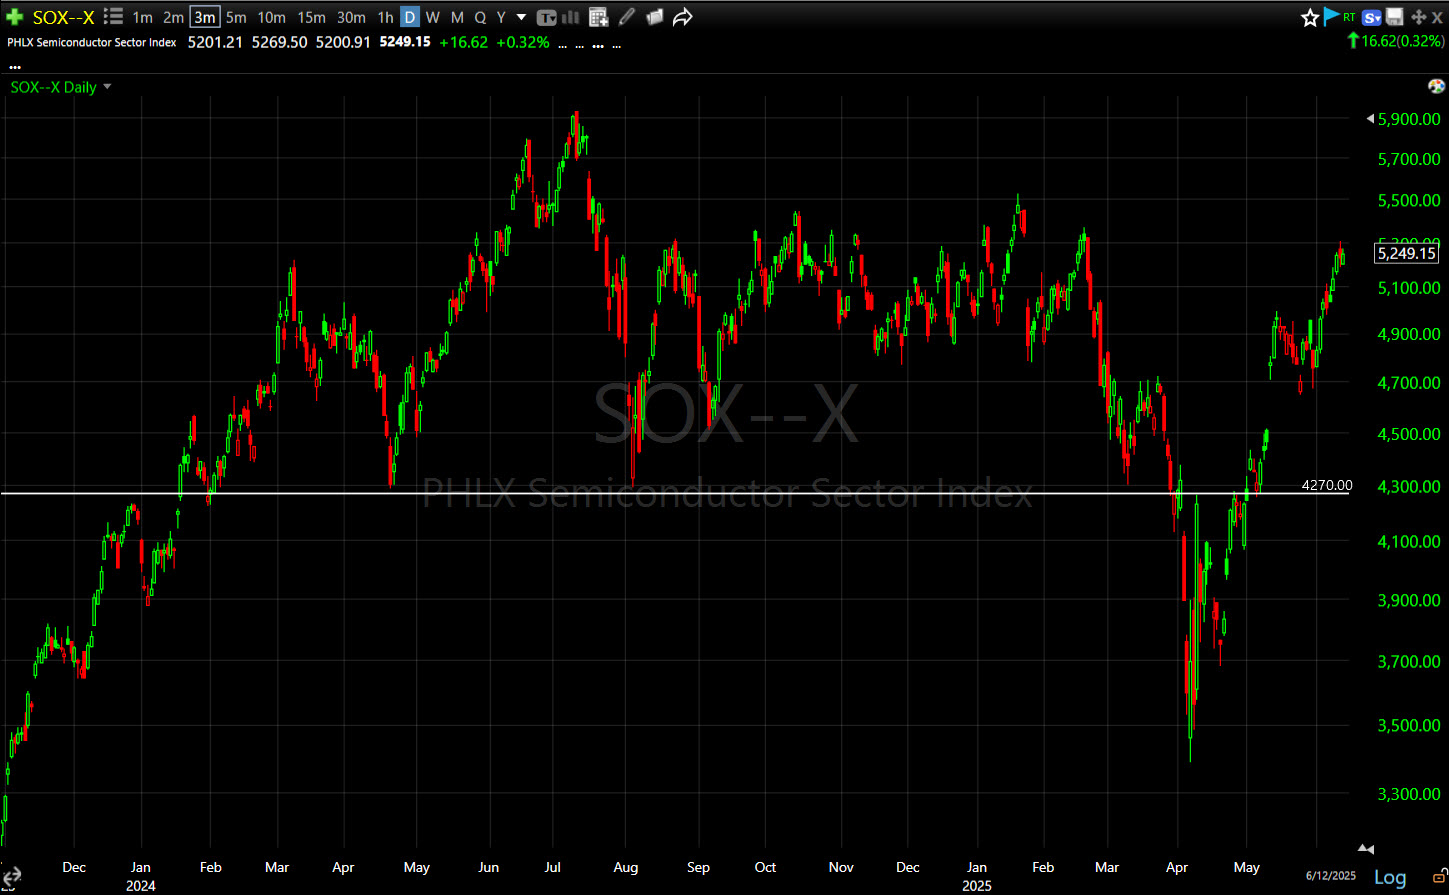 (daily) – The primary trend lower low is already there. Any pivot down from here that does not make a new record high first, will be a lower high and better define a primary downtrend. In terms of trend related price levels to be aware of below, $5100 is where one sub-intermediate up-trend currently sits and the second is at $5000. A break of either of those turns what has been a stellar rally, into a worrisome decline.
Materials ⇧ 0.42 %
Energy ⇧ 0.35 %
Financials 0.00 %
Industrial ⇩ -0.26 %
Technology ⇧ 0.93 %
Consumer Staples ⇧ 0.59 %
Utilities ⇧ 1.21 %
Health Care ⇧ 0.78 %
Consumer Discretionary ⇩ -0.47 %
Real Estate ⇧ 0.55 %
Communications ⇩ -0.81 %
Internals
Advancers (1582) edged out Decliners (1180), but still a pretty neutral day. Volume came in at 1bln. shares.
The Dominant price/volume relationship was not very strong and it wouldn’t have mattered anyway as far as one day overbought or oversold internals go. It came in at close down/volume down which is the most benign relationship and the one most often associated with a consolidation day.
Treasuries
Treasuries ended with solid gains, as the 10-yr note and shorter tenors essentially finished where they started, while the long bond outperformed with help from today’s strong $22 bln 30-yr bond sale. The 10-yr yield fell six basis points to 4.36%, ending just below its 50-day moving average (4.369%). This afternoon’s 30-yr auction was stellar, stronger than both the 3-yr and 10-yr sales earlier this week, suggesting concerns over long term debt are abating as inflation comes in tame.
Interestingly, the 10 year yield started the week by testing the danger zone for the attractiveness of equity valuations at 4.50%, and has had a pretty sharp move lower since.
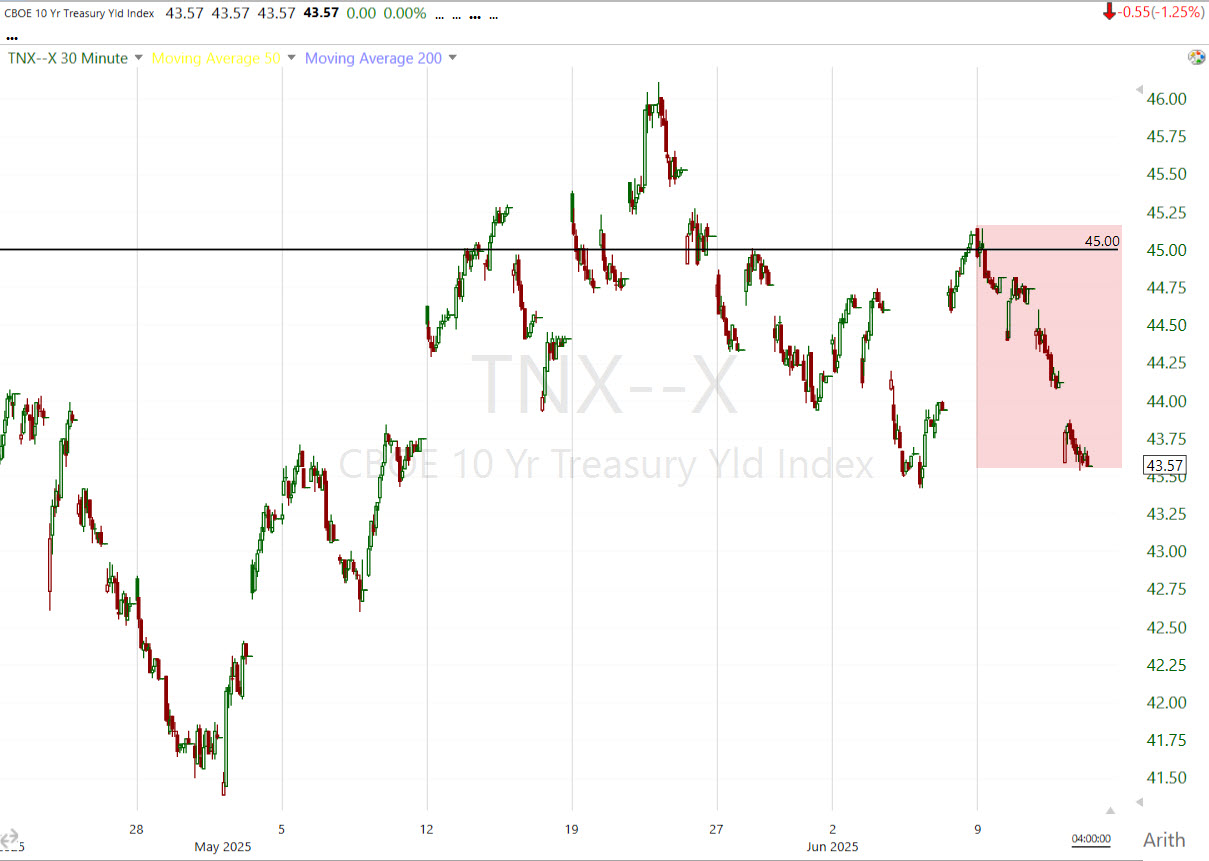 (30m – this week in red) – Most of the decline is the soft inflation readings and decent auctions, but some of it is concern over economic growth with the tariff news this week, and some of it is safe haven buying due to geopolitical concerns.
We always want to watch for sharp moves in yields in either direction. They can lead to a VAR shock on a 2 sigma event (about 60-basis point move at current levels over a period of a month), They can also reflect the bond market sharply repricing growth/inflation out of events like the upcoming tariff escalation. Most of the major crashes I’ve called ahead of time (2016, 2018, 2020 and even this year) have relied on the message of the market, in every one of those cases the bond market was screaming trouble while stocks we’re making 0.25% to 0.5% all time new highs, completely complacent and unaware. The Covid Crash was a standout as Yields, Dr. Copper, Oil and the Aussie (commodity currency) all crashed nearly in sync and most of them started to jump off the charts more than a month ahead of the stock market crash.
We know why yields are lower, but just saying, keep an eye on them. Then there’s oil to factor in should something break in the middle east. *As I’m writing, something broke.
Currencies and Commodities
The U.S. Dollar Index lost another -0.75%, thing to hold support at what I’ve called the red flag zone, but closing below it.
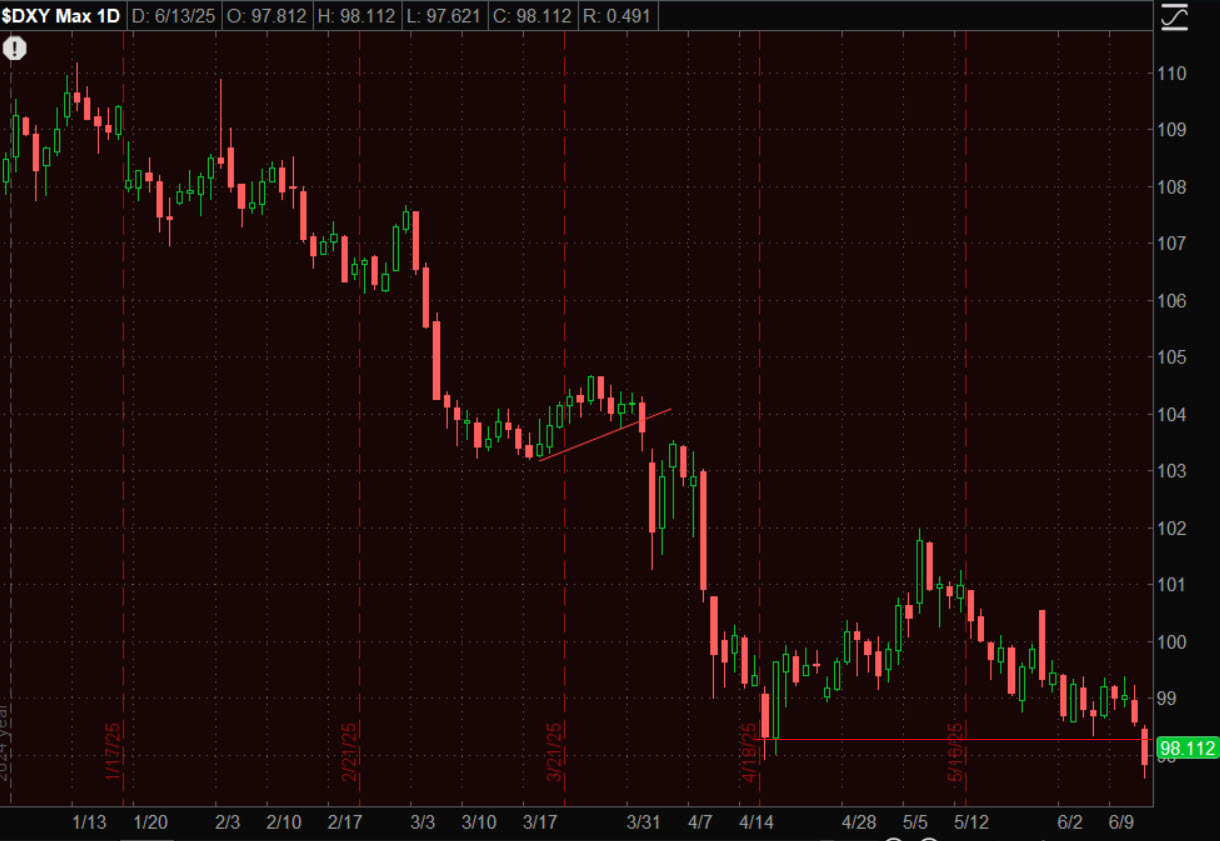 (daily) – The environment for equities is getting less constructive. Remember though, the dollar’s relationship to equities is not a constant. It depends on a lot of factors… The Dollar Smile.
WTI Crude oil closed up about +0.75% to $78.86, but as I’m writing this all hell is breaking loose in the Middle East so I’ll cover the rest at the bottom of the post. Remember our measured move is still in the $74 to $75 area.
Gold futures settled sharply higher (+1.8%) to $3,402.40/oz, as traders scrambled into the yellow metal amidst a convergence of risk factors and dovish macro signals. A softer-than-expected U.S. inflation print rekindled expectations of Federal Reserve rate cuts, while the U.S. dollar slid to multi-week lows, increasing gold’s appeal. Rising geopolitical uncertainty from Middle East tensions to ongoing U.S./China trade negotiations further fueled safe-haven demand. Technical momentum also added fuel, with investors eyeing a potential breakout beyond the April all-time high near $3,425.
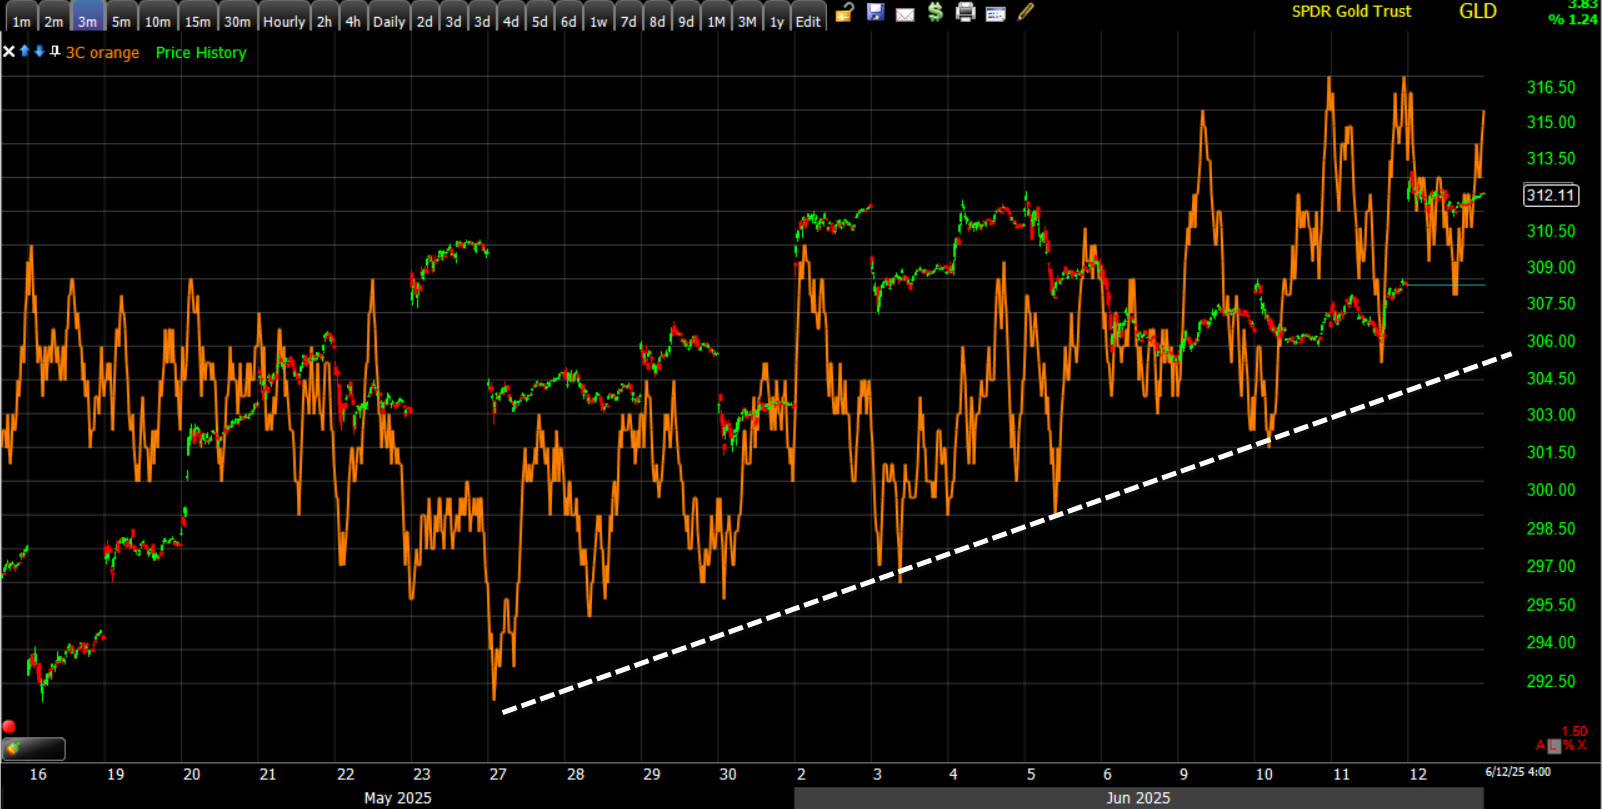
I’m going to use GLD’s price chart to clean up the price trend a little.
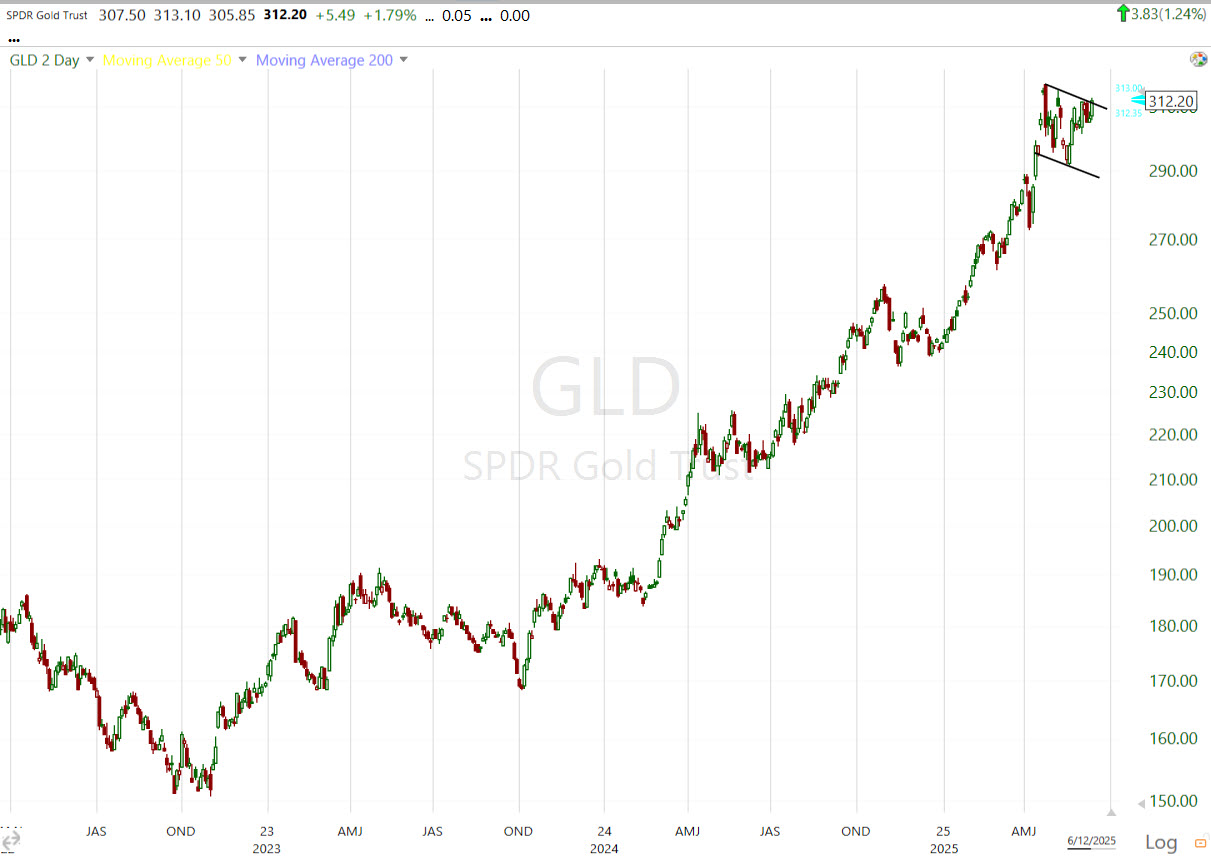
(2-Day) – in retrospect I think you can see how price was getting too parabolic in the rally as it entered 2025. This big bullish consolidation was much needed and reduces the risk of a sudden downside reversal, which was building as price was getting too parabolic and not providing support levels along the way. That said, this consolidation is appropriate in size, it is mature, and it is ready to break out. My gut feeling has been that gold breaks out at the same time stocks start to breakdown. We’ll see if I’m right about that or not, but either way gold still looks great.
Gold came pretty darn close today…
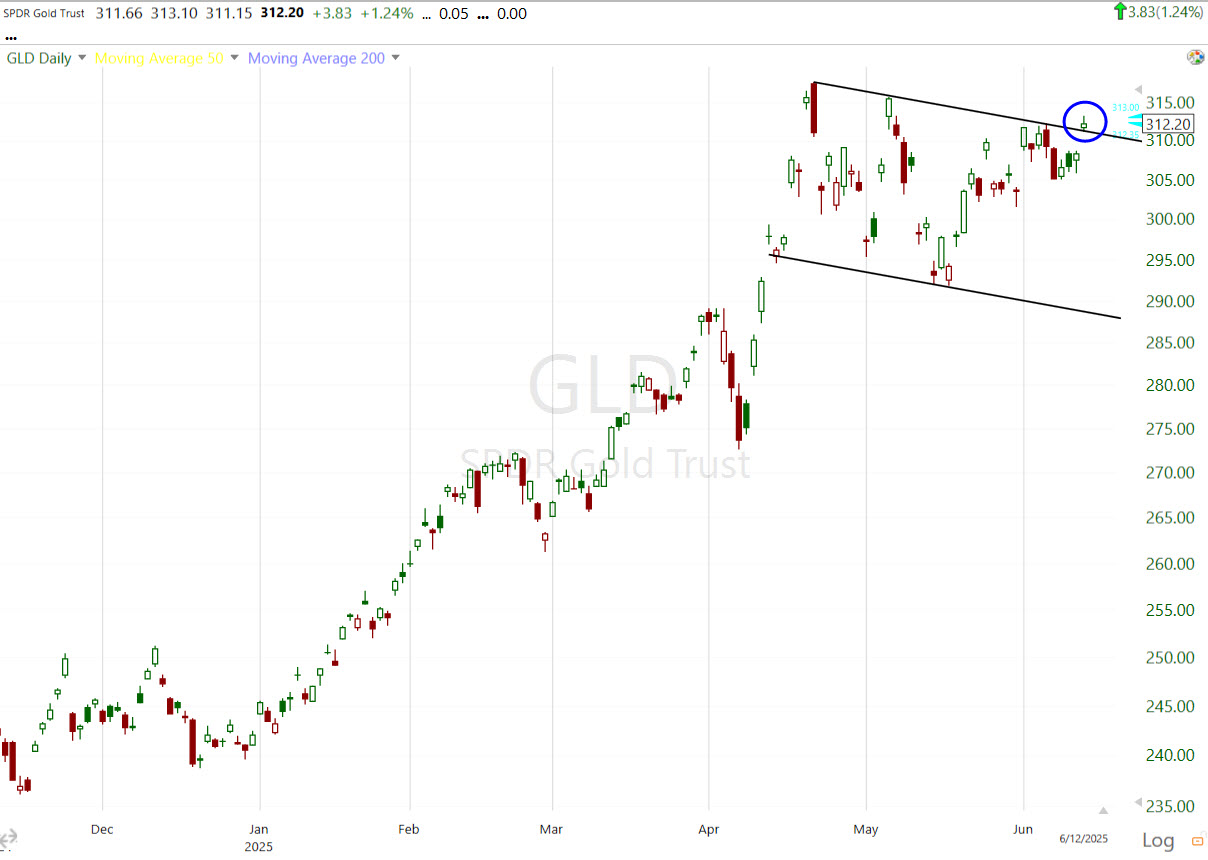
GLD (daily)
GLD’s 3C chart is doing exactly what it it be on a trend basis that is appropriate to the size and length of gold’s up-trend.
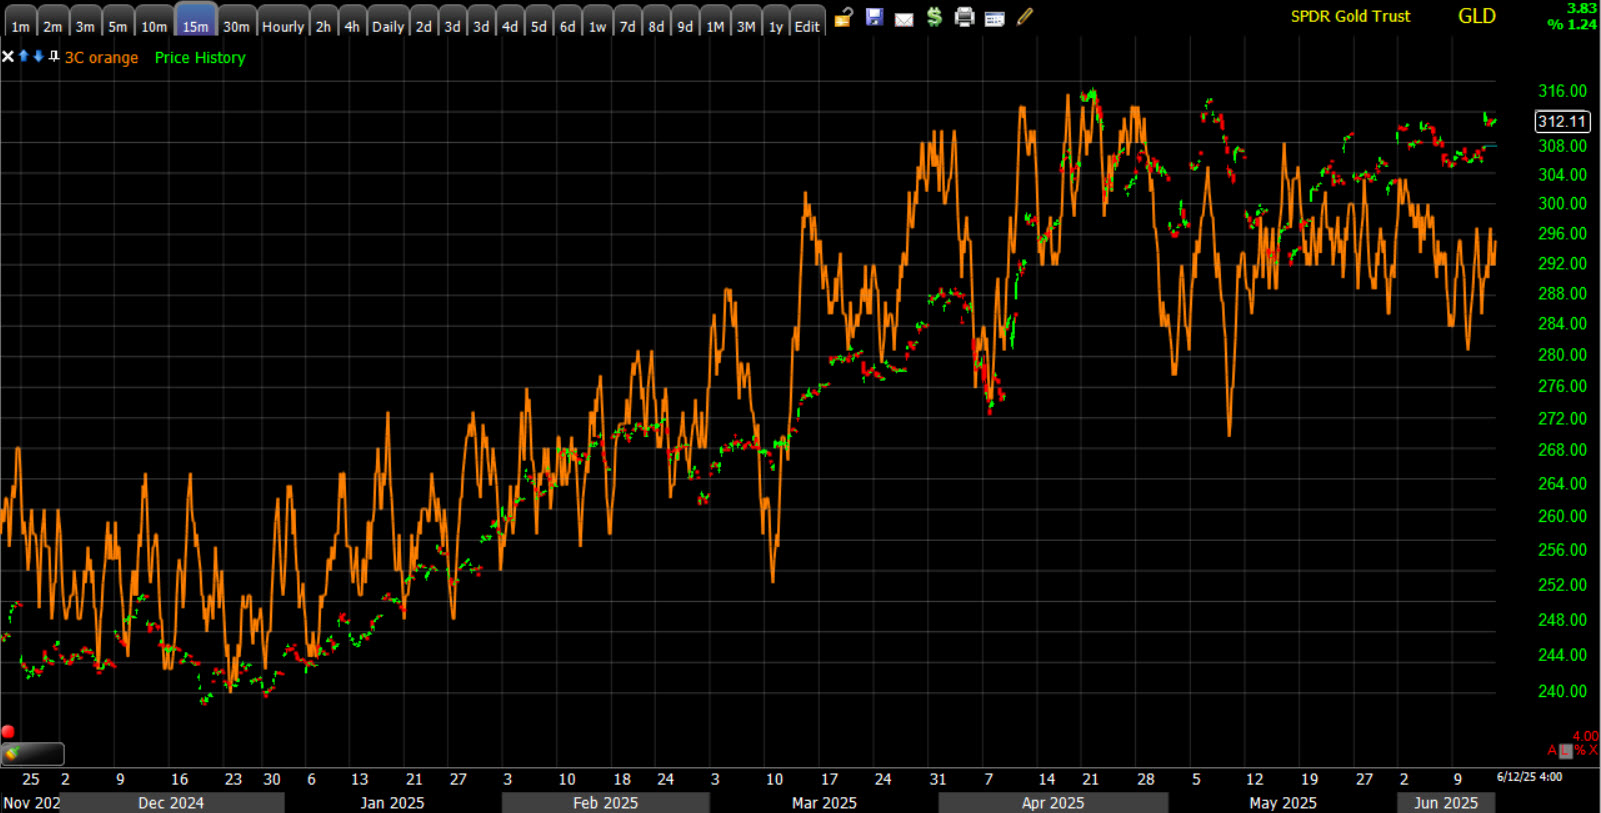 (15m) – Notice how I’m using a much longer 3C time frame to capture the trend appropriately. This is damn solid confirmation. It says underlying money flows are acting appropriately to the price trend or gains.
If we get a little bit more granular and look at the consolidation…
 (5m) – Although gold is in a range of sorts, more accurately a consolidation, we can see how 3C is leading price higher as the consolidation is fully mature. What does mature mean? That can vary a little between consolidation types, but a general rule of thumb is that price will have five pivot points defining the consolidation at the upper and lower trend lines. GLD has that.
URA gained +0.4% to $36.01. Today’s follow-through could have been better, but price action remains constructive.
Bitcoin continues to struggle with that 110,000 area, pulling back more today, and going a little risk off with tonight’s developments.
Summary
I’m not going to highlight this part in red.
Well, oil was right. I haven’t seen the latest as I’ve been putting together this post and going through data but the gist is…Israel has launched an operation, attacking Iran.
- AP cites an Israeli official who says that the targets are Iran Nuclear and Military sites. There also appears to be targeted assassinations of nuclear scientists, high-ranking military officials and those related to iran’s ballistic missile program.
- NYT quoting an Iranian official: Three residential buildings demolished in the Shahrak Shahid Mahallati neighborhood in Tehran, where senior military leaders reside
-
Israeli PM Netanyahu says that Israel is attacking Iran’s nuclear program, is seeking to remove the ballistic missile threat.
-
Netanyahu in a televised address said “will continue for as many days” until the Iranian ‘nuclear threat’ is removed, and “as long as necessary”.
On US side…
- RUBIO SAYS US IS NOT INVOLVED IN ISRAEL STRIKES AGAINST IRAN
- *RUBIO: IRAN SHOULD NOT TARGET U.S. INTERESTS OR PERSONNEL
- *RUBIO: ISRAEL TOOK UNILATERAL ACTION VS IRAN
- Ahead of the Israeli strikes, the US notified several allies in private on Thursday that Israeli strikes were imminent and made clear it was not involved, one of the Axios sources said.
I’ve heard reports that Iran has started to retaliate, scrambling jets and reports of ballistic missile launches. This doesn’t have the feel of the past “performative” strikes and retaliation, this has a more serious feel, perhaps war.
Overnight
S&P futures are down -1.7%…
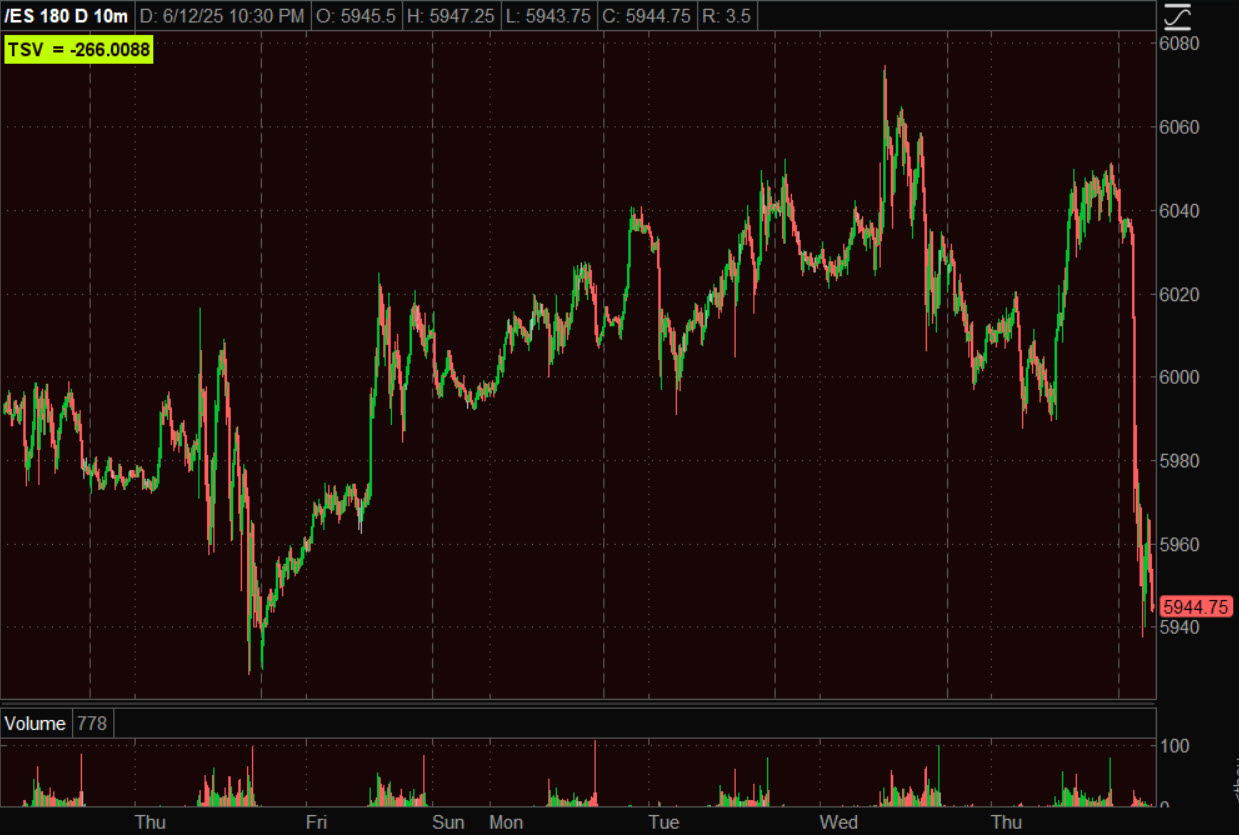 ES (10m) – That’s ugly, but it’s sending price back down into our lateral range, 5800 to 6000.
Small Cap Russell 2000 futures are hit harder, down almost -3% with a move below last Thursday’s low where the other averages are still holding.
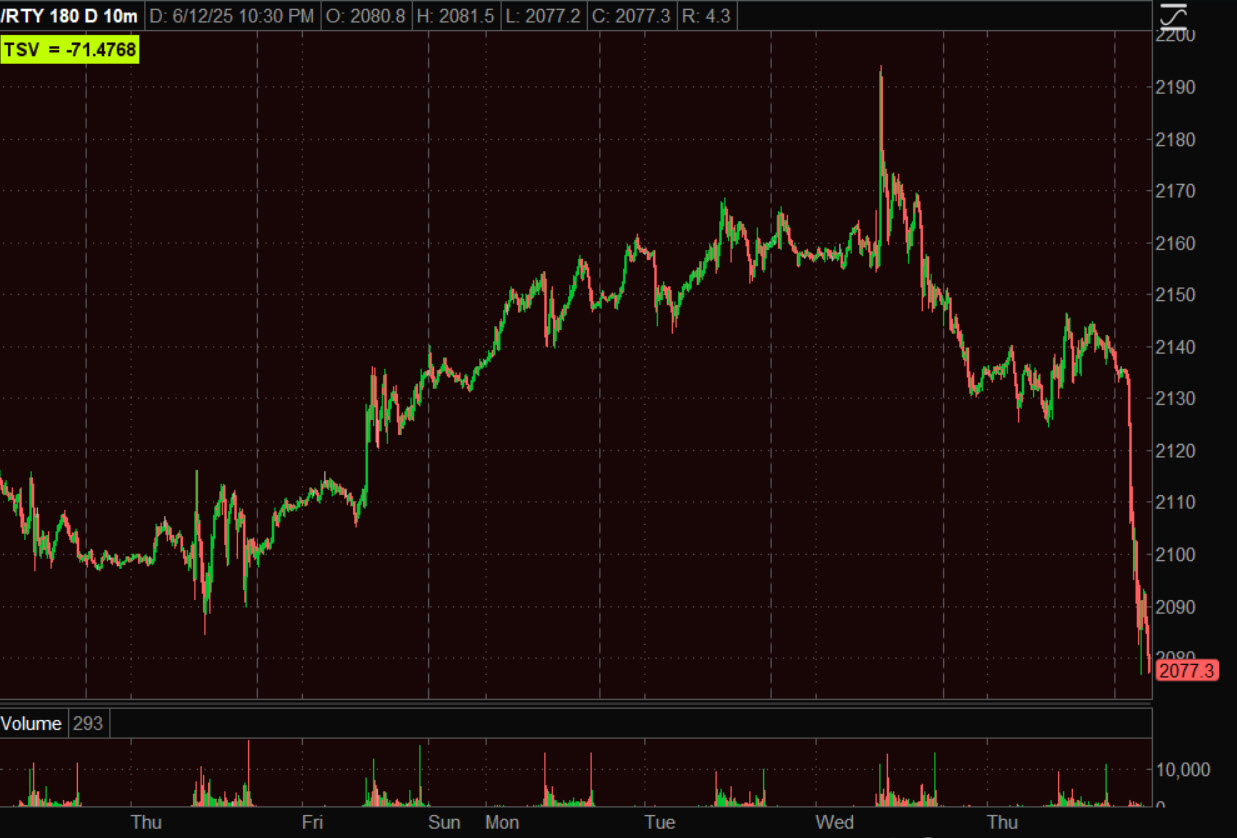 (10m) – Small caps tend to lead risk sentiment.
The US dollar index is up about 0.15%, getting a very modest safe haven bid. We want to keep an eye on the carry trade, USDJPY. Take a look at the chart below and you’ll see why. The FX pair led the market off last week’s low and negatively diverged today. In the very near term , we want to keep an eye on last Thursday’s low.
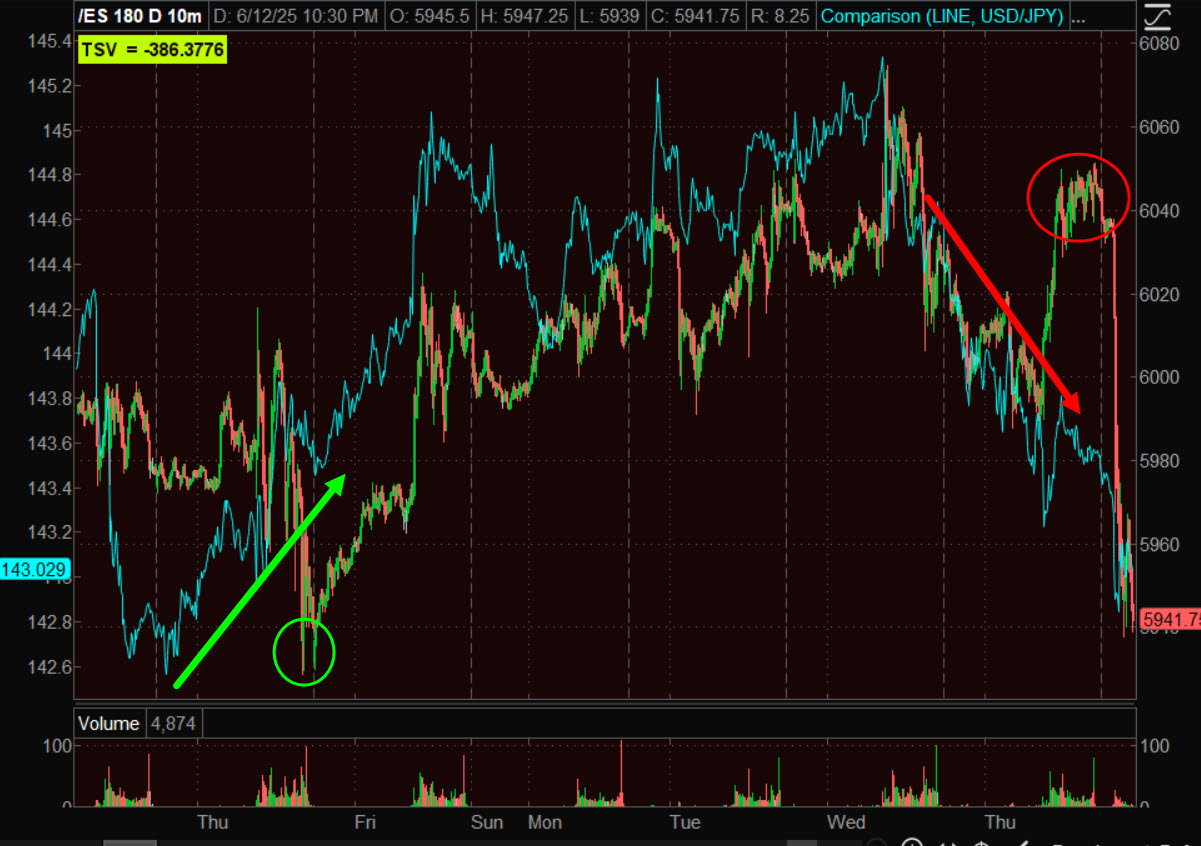 S&P futures (10m) and USD JPY
WTI crude oil, Oh my gosh comma is up +13%!!! Who’s long Oil?
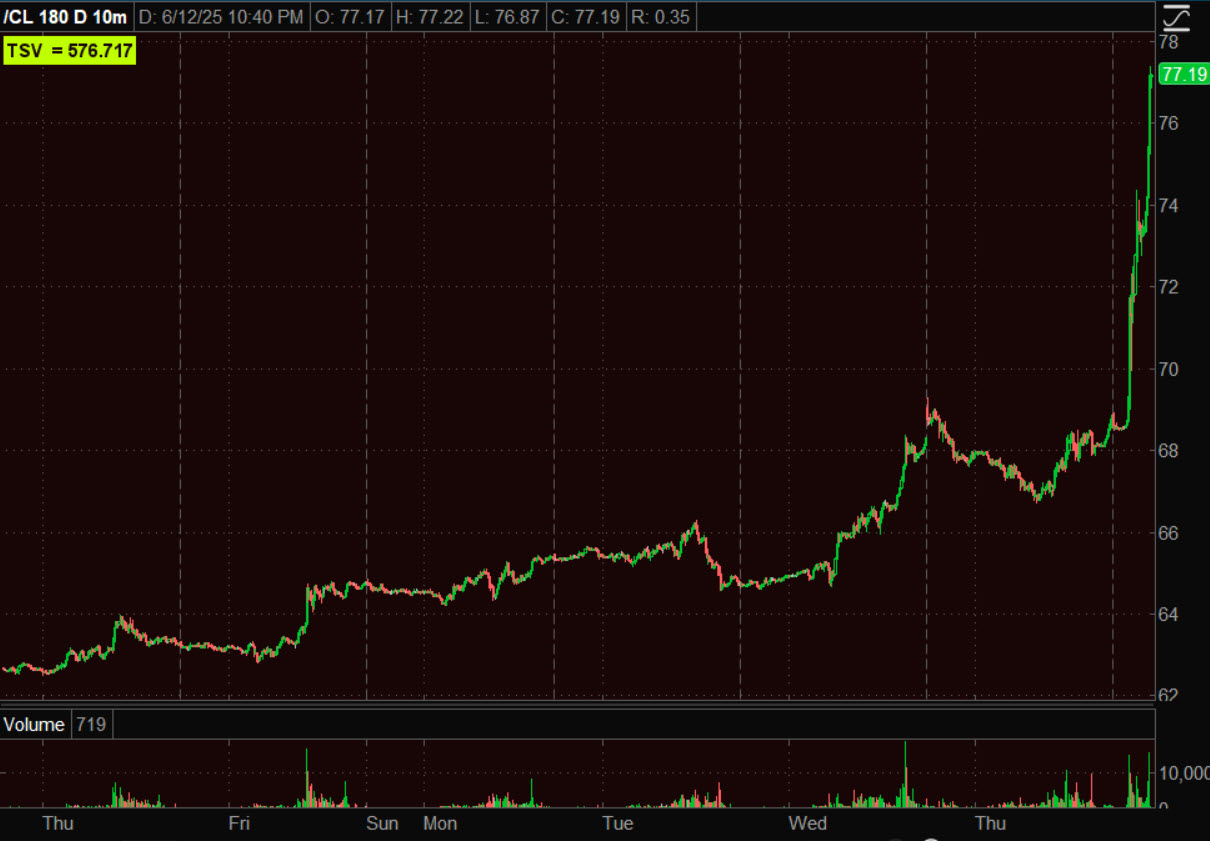 (10m) – this has already moved through the measured move, remember there are a lot of shorts in this including CTA’s. If you are long, I would let this run for now and obviously keep a close eye on it.
Gold futures are up +1.7% on a strong safe haven bid, trading at $3462/oz. There is our breakout underway.
 (2H) I know some of you are very happy tonight.
Treasuries caught a little bit of a safe haven bid, like the US dollar, it’s not all that impressive. That’s interesting. Yields are only down about 3 basis points. This is really curious. I’m wondering what this is about. The safe flight to safety in both assets should have been bigger.
Tomorrow is going to be an interesting one. I can’t imagine many traders are going to want to hold positions over the weekend given what Netanyahu has said, and given the fact that Iran will retaliate. See you in the morning.
Tomorrow’s data will be limited to the 10:00 ET release of the preliminary reading of the University of Michigan’s Consumer Sentiment Index for June (prior 52.2).