Early Update – Contagion Sparks Second Largest Sell Program Ever
11:04 a.m. ET
September’s troubles continue the first day of the new week, with anxiety focussing on China’s Evergrande and a default’s fallout for banks, the U.S. debt ceiling, and infrastructure plans running into roadblocks.
Evergrande, one of China’s largest property developers, could reportedly default on its $300 million of debt ahead of an interest payment due Thursday. In the U.S., Treasury Secretary Yellen wrote an opinion piece for The Wall Street Journal warning Congress that an historic financial crisis could result if the debt ceiling isn’t raised. Separately, House Majority Whip Rep. Clyburn (D-SC) said the Sept. 27 vote on the $1 trillion bipartisan infrastructure bill could be delayed.
SP-500 -1.8%, Dow -1.6%, NASDAQ-100 -2.2%, Small Caps -2.6%
The negative effect and anxiety of Evergrande can be seen in index futures’ open from Sunday night.
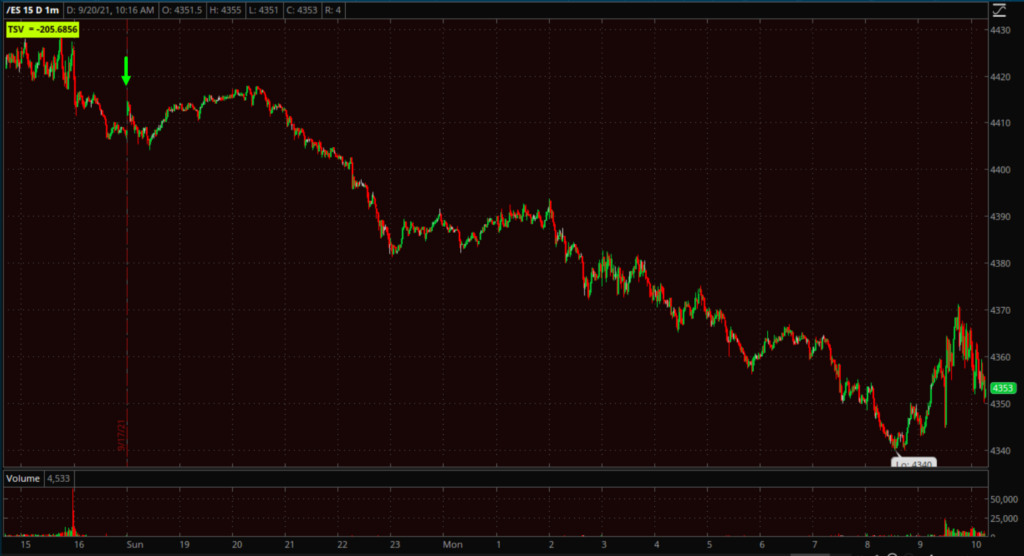 S&P futures (1m) with Sunday’s globex open (green arrow).
Fear of contagion is evident in one of Evergrande’s smaller peers, Shanghai-based Sinic Holdings Group which focuses on the development of residential and commercial properties in China, it was halted trading after it shares plunged -87% plunge on Monday afternoon on no apparent news. Volume the last 2 hours was 14 times normal for the stock.
In recent weeks I’ve pointed out what looked like a (smaller) head and shoulders in the Dow forming with appropriate volume for a H&S and Transports leading lower with about a -2.6% measured move…
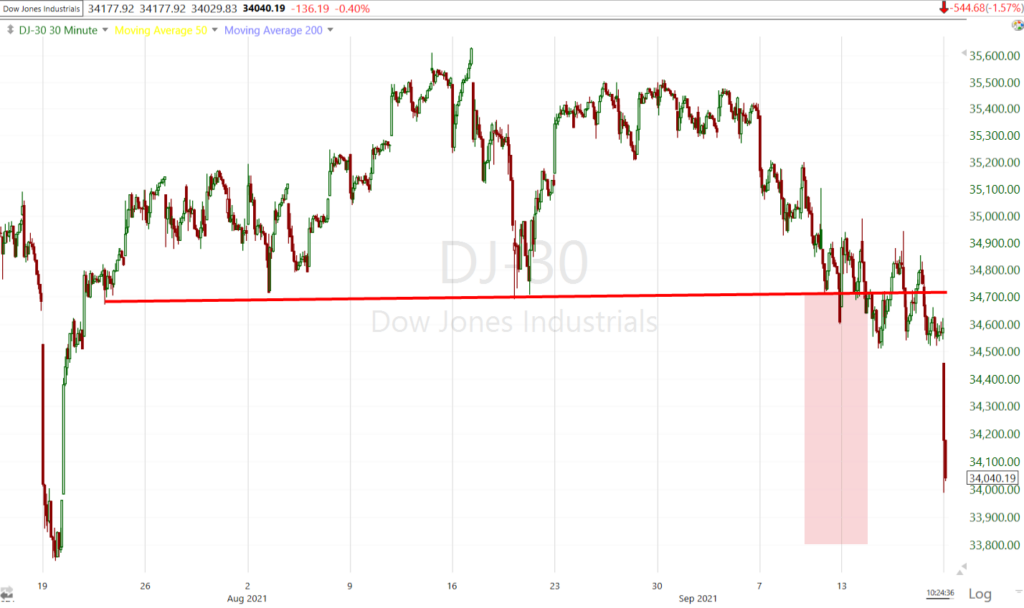 Dow (30m) H&S and measured move. The Dow is already -2% toward completing that measured move (red shaded).
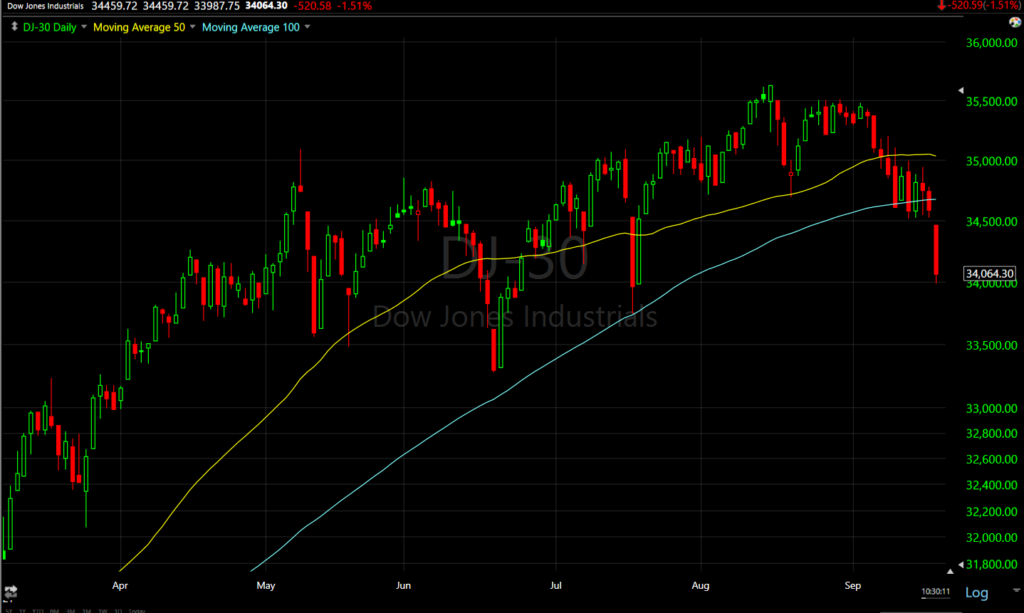 Dow (current daily) broke clear under the 100-day sma that held the last 6 days.
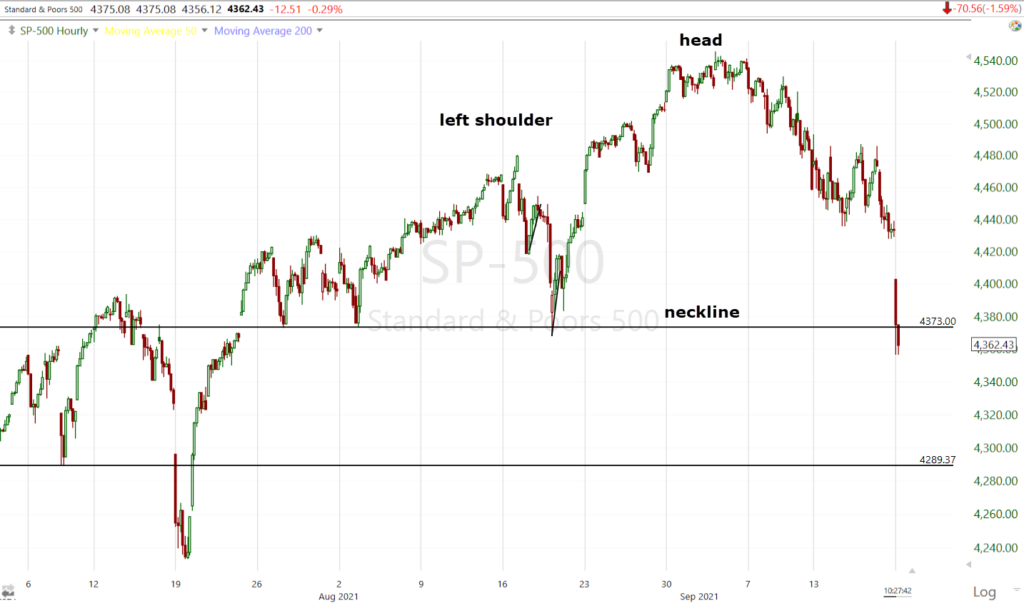
Now the S&P appears to have a larger H&S forming (3.75% MM).
SPX (60m) H&S forming? From here the S&P would have to bounce from the neckline, it could fill the gap, but so long as the bounce does not make a higher high vs. the head, we’d have a right shoulder and an approximate -3.75% measured move downside target (from the neckline) which would come in around $4200.
The S&P broke clean below its 50-day which has been technical support all year (at least 7 tests).
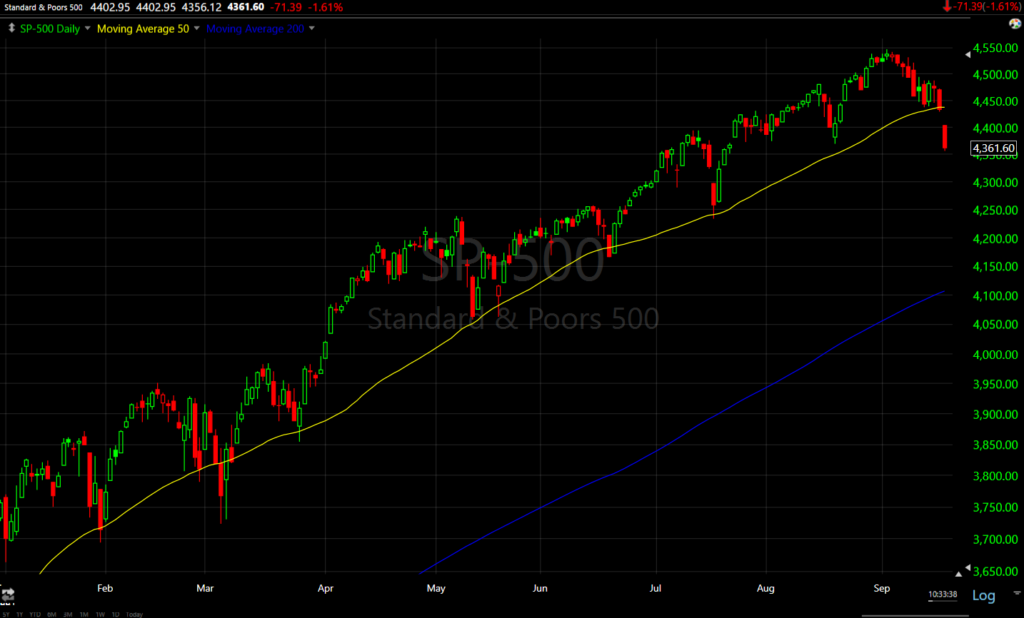 SP-500 (current daily w 50 and 200-day sma yellow and blue respectively). As mentioned Friday, the S&P has traded as much as -2.3% below its 50-day this year (March) and recovered. It’s -1.8% below presently.
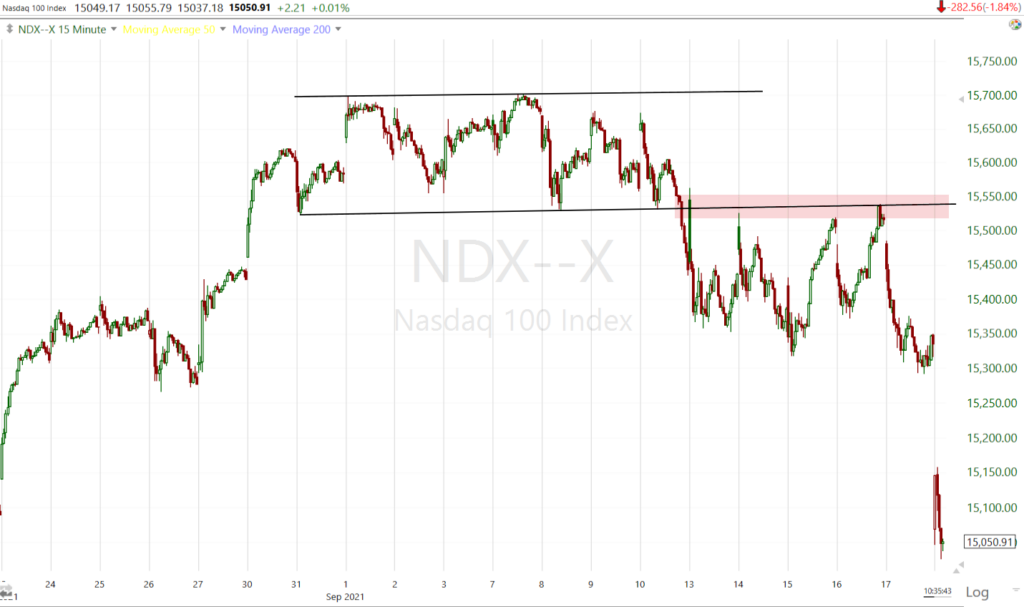
The NASDAQ-100 has displayed clear resistance at the bottom of its former range (former support turned resistance).
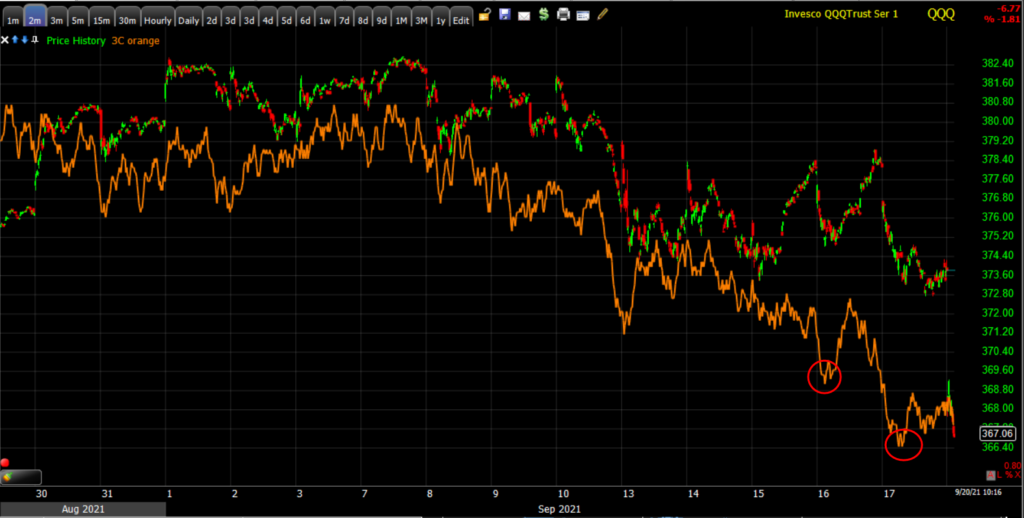
And NASDAQ/QQQ has had the most troubling 3C chart, leading lower last week…
NASDAQ-100 has also broken under its 50-day.
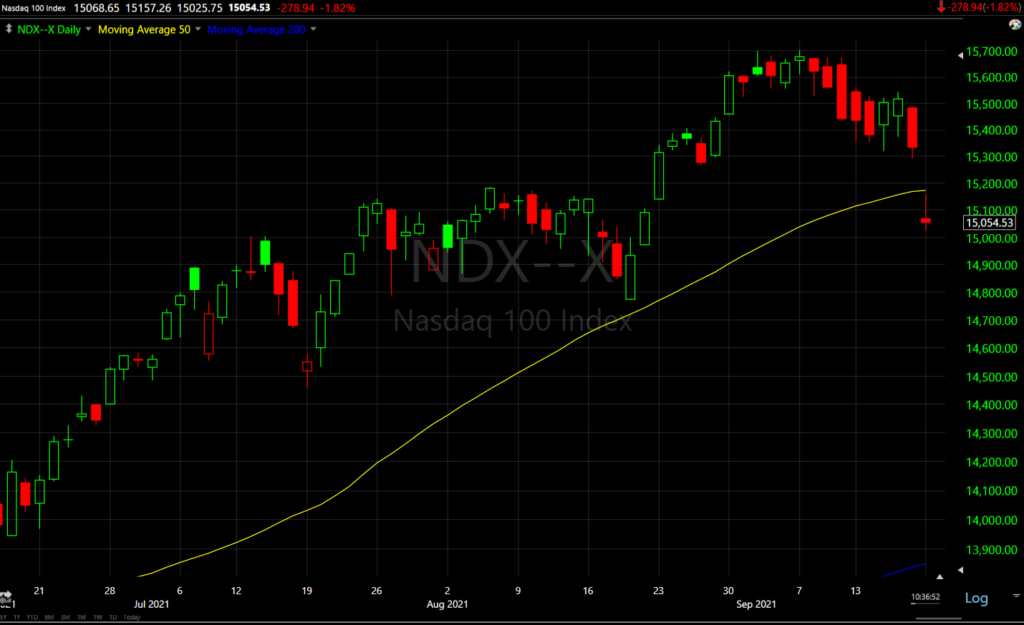 NASDAQ-100 (current daily) and 50-day sma
Last week I was somewhat concerned NASDAQ “may” be forming a bear flag, but much more concerned that Small Caps, that tend to lead risk sentiment, had a clear bear flag. Those concerns were clearly justified.
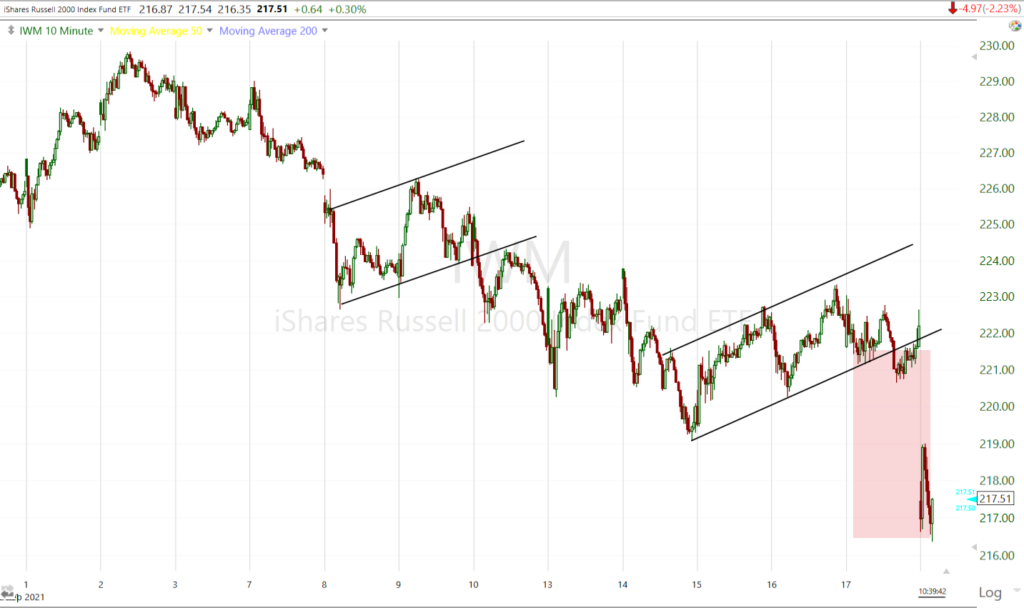 IWM (10m) has already hit the measured move target this morning for the last (most recent) bear flag and the $218 target from the prior flag.
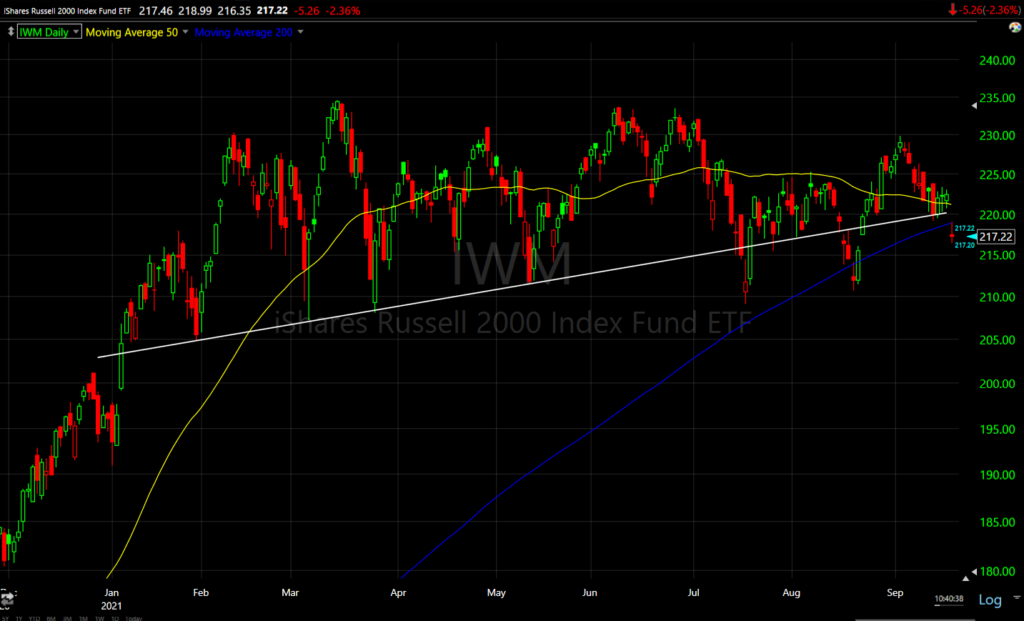 IWM (daily) is back below the 2021 toppy pattern’s neckline and below its 200-day sma (blue).
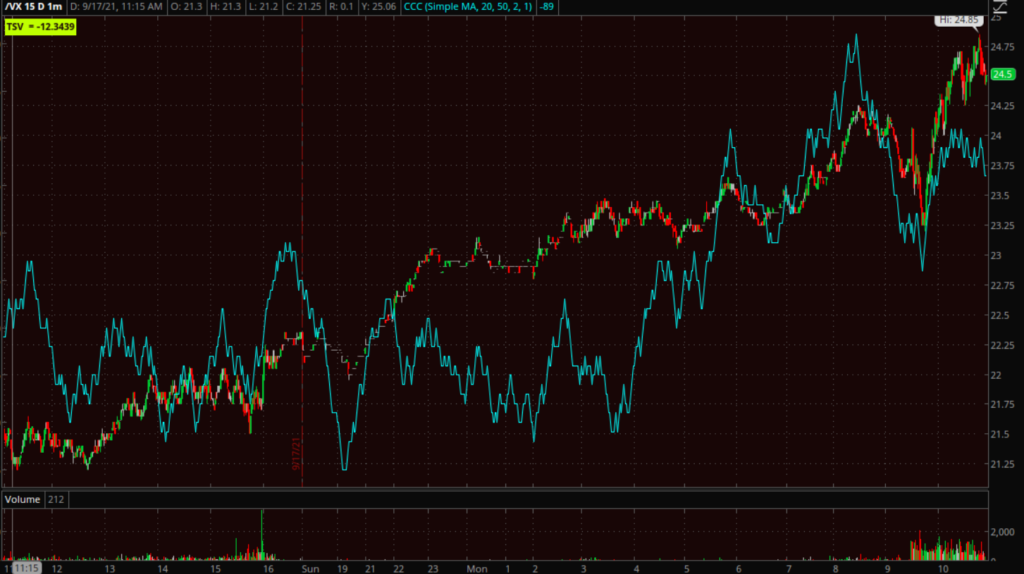
VIX is up +23.75% with clear relative strength, hitting the highest level since May as the Absolute Breadth Index has been plungng recently hitting 18 on Friday, which says something given last week’s relative weakness. I’d say there’s about 7% of relative strength presently from 5% of relative weakness last week.
All 11 sectors are down in broad-based selling with cyclicals the worst (Energy -3.9%, Financials -3.15%, Materials -2.%), then mega-cap heavy sectors (Communications -2.25%, Discretionary -2.4%, Technology -2.2%), Bond proxies are down the least, but still -0.4% to -1.2%. Bank indices are down -3.6% to -3.8% from the potential Evergrande fallout.
One of the troubling aspects of September has been lack of leadership. The first week more defensive secular growth mega-caps and defensive sectors did well, but quickly faded the first week’s gains. Recently cyclical sectors’ downside rate of change slowed, as if they might be able to take a leadership role. All of that has collapsed.
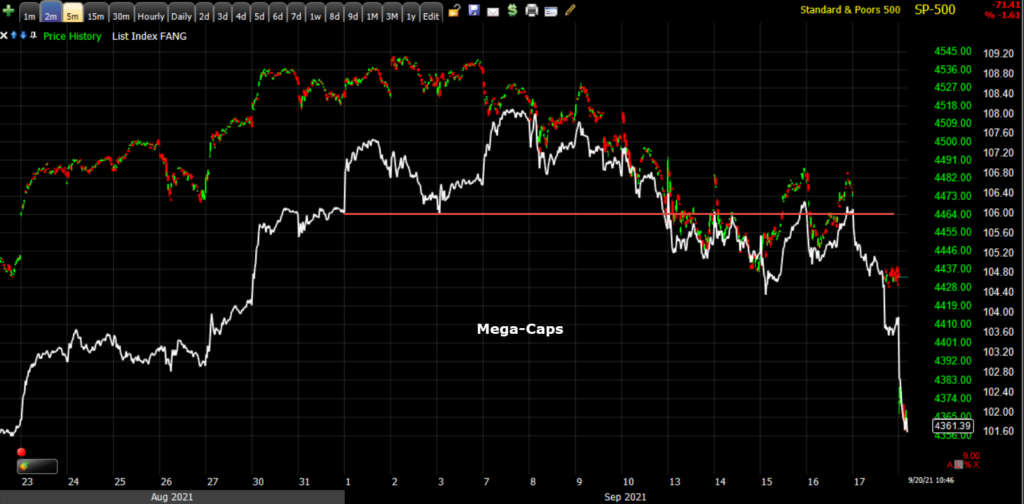 SPX (2m) and mega-caps early September strength faded, then resitance
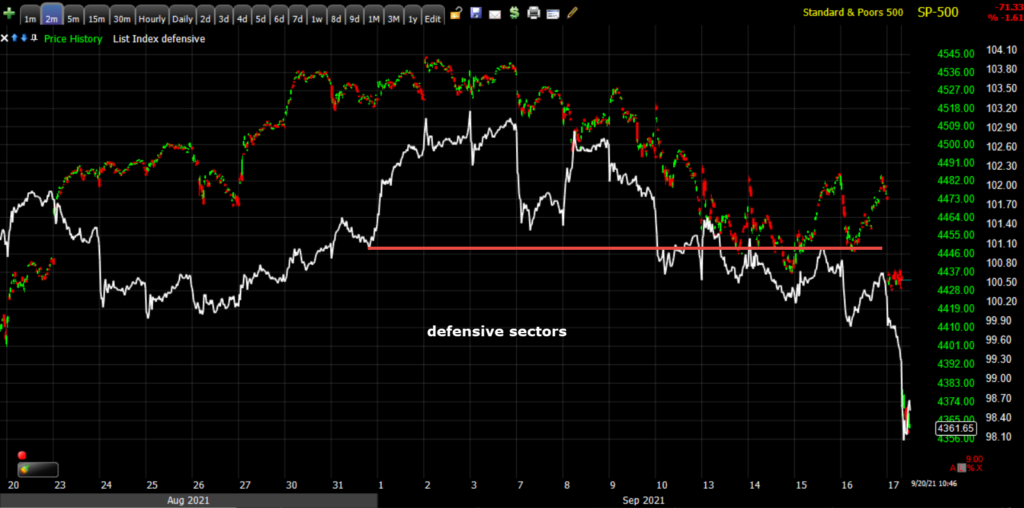 SPX (2m) and defensive sectors nearly identical
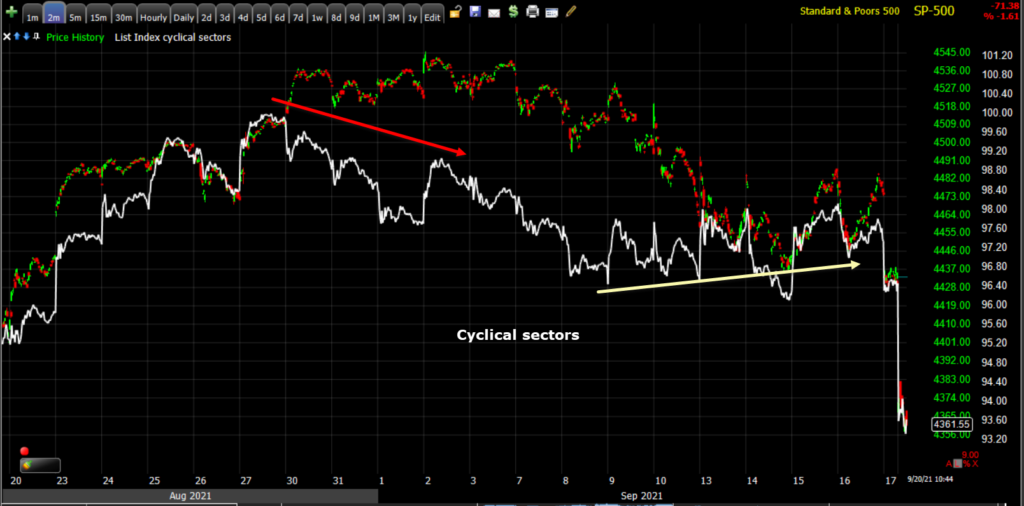 SPX and cyclicals (2m) collapsing
Decliners are some 10-to-1 over advancers at the open in very broad-based selling. Bloomberg notes that the negative TICK (number of stocks ticking down vs. up) was the second biggest in history at the open, just 2 stocks shy of the largest in history. As for breadth, the oscillators are in DEEP oversold territory (0-100 range) at 1.
Bond yields are down -4bp to -5bp in a flight to safety and curve flattening trade. Recall that the curve broke under a lateral trend from June the last week and a half. Credit, which had been the most supportive factor from a market signal perspective, is starting to deteriorate and catch down toward the averages, but is still positively divergent (relative basis).
Cryptos are feeling the risk off to with BTC futures down about -6.8%. Gold is up +0.8% in what appears to be some safe-haven buying.
This is very ugly price action sparked by contagion concerns, but the larger problem this month has been, “where will the leadership come from?”. No leadership was established and that was and is still the real problem for the broader market.
The S&P could bounce and fill the gap today just from a very deep oversold level It is either the most oversold of the year or tied, I’ll have to take a closer look. That was the one thing it wasn’t last week. My expectation, though, would be that a bounce would simply fill out a larger H&S topping pattern, which is what Small Caps have been reflecting most of 2021.
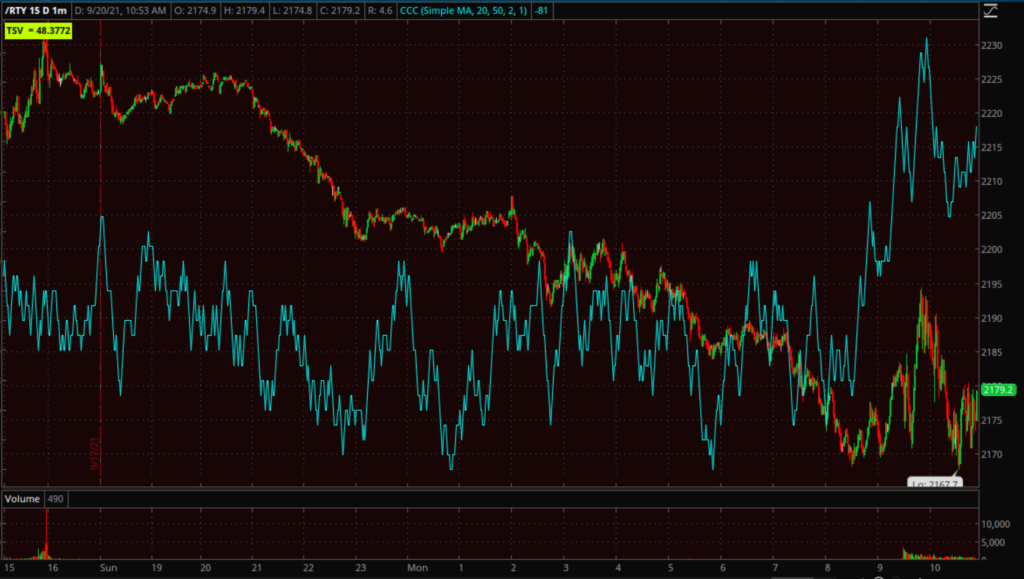
Intraday S&P, Dow and Russell 2000 futures may be trying to find a bottom as the Dollar Index comes down from morning highs (+0.1%).
However, like QQQ’s 3C chart, NASDAQ-100 futures are confirming to the downside.
VIX futures (1m) have been confirming to the upside, but have a very small potential neg. divergence forming here. I’ll update any changes.


