Entry/Exit Systems


HERE’S ONE OF MY SYSTEMS-WHAT ARE YOURS?
With the weekend here, I thought this might be a good time to show you one of my systems so you can mess around with it over the weekend. I’d really like to hear about your ideas since parts of this system came from other people’s ideas. First up is my entry system. This is not the only entry system I use, but it is one and I like it. I chose to show you RACK because I exited this position today and it clearly shows up on the second chart. I also didn’t want to cherry pick any stocks for this display.
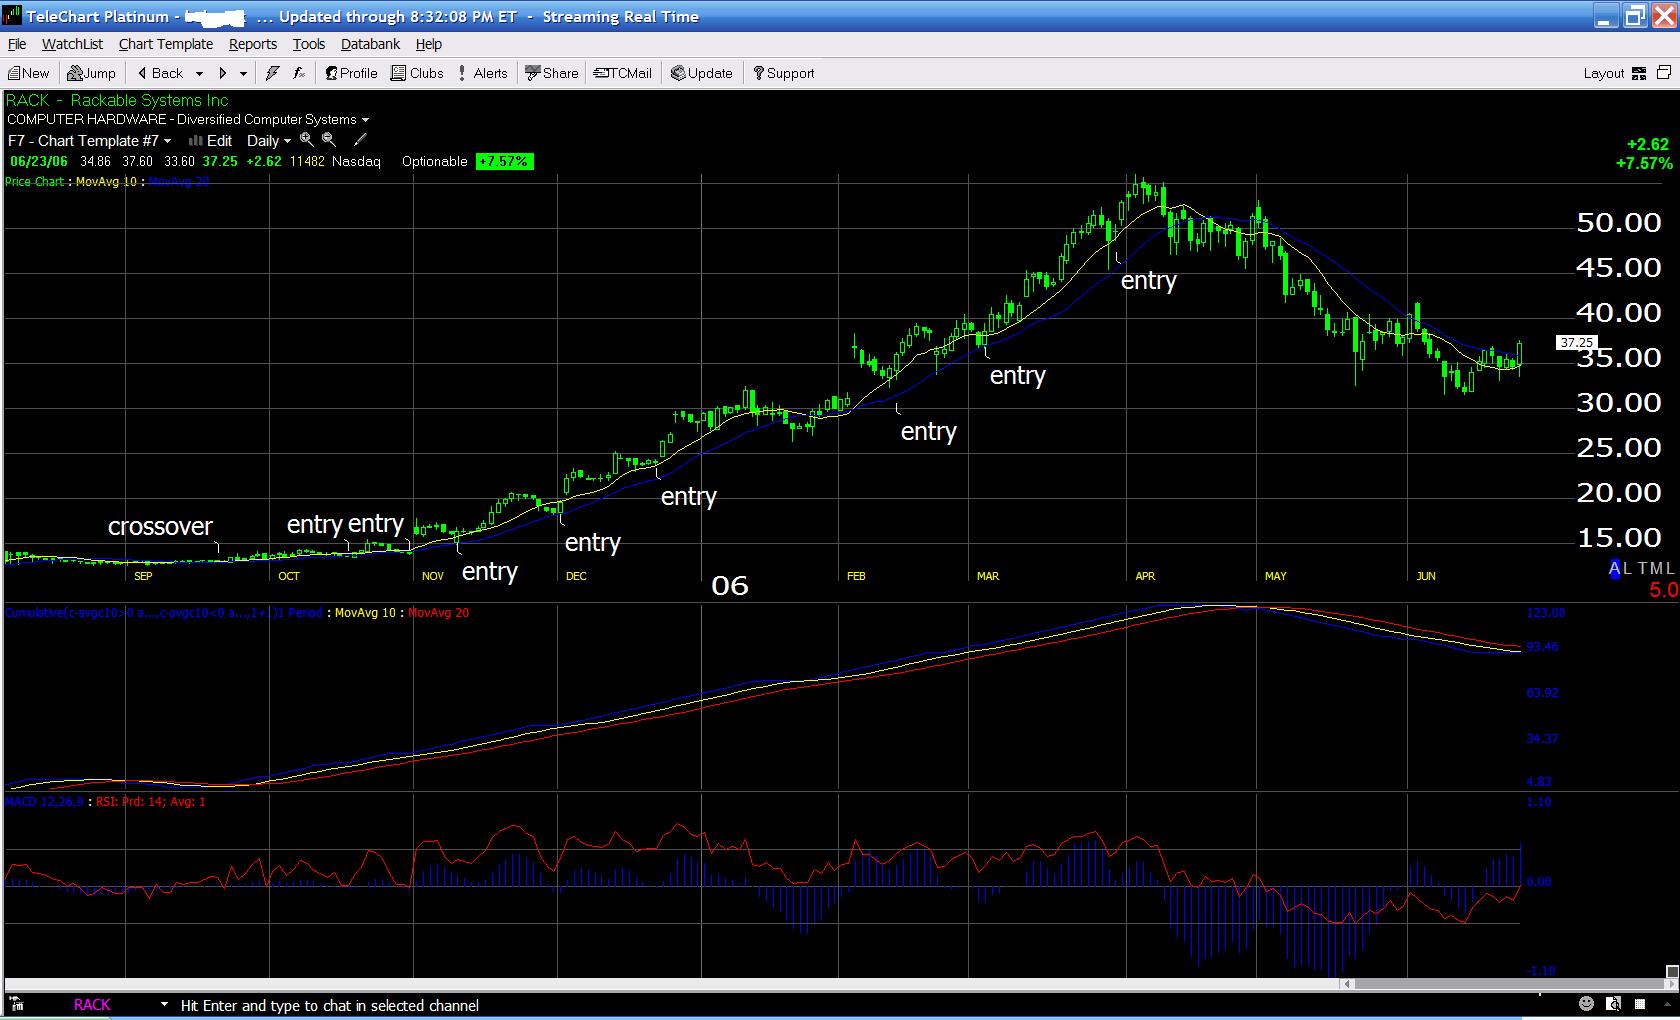
In the top window I have a 10 day (yellow) and a 20 day (blue) moving average. What I’m doing here is using the crossover to signal a buy and then entering on the first pullback to either moving average. In fact you can enter half the position on a pullback to the 10 and the other half should it continue on to the 20-if you like. There are other criteria that must confirm a buy. In the middle window I have a custom cumulative indicator that I wrote. It is a little redundant in its function and in all honesty, you can do without it with similar results. The idea here is the cumulative line in blue, should cross above the 10 (yellow) and 20 (red) moving averages. In the lower window I have plotted RSI and a MACD histogram. For an entry long, RSI must be above “0”. MACD also should have a positive reading for a long position, that is-above the “0” line. As you can see (hopefully), there was a crossover in Sept of ’05 and at least five subsequent possible entry points. In January of ’06, you’ll see on the next chart there was an exit signaled. I must say, I usually follow my signals on the stop side rigorously, but in this case there was a very good argument to be made not to follow the exit signal as price had not penetrated a significant support level just under the system stop. In any case, had you gotten out, you could have easily got back in around mid February at $33 and still have made nearly 20 points. Had you stuck this trend out from start to finish, you’d have entered around $13-14 and exited about 6 months later at $49. Not too bad. This is why I say “the money to be made is in trends”. So in recapping, we look for a crossover of the 10 over the 20 for a long (vice-versa for a short) with a positive RSI and MACD. The cumulative indicator is icing on the cake (if you are a Telechart user and want the program, let me know-it basically is comparing price to a 10 day and 20 day ma, it’s redundant). Next lets look at the stop system.
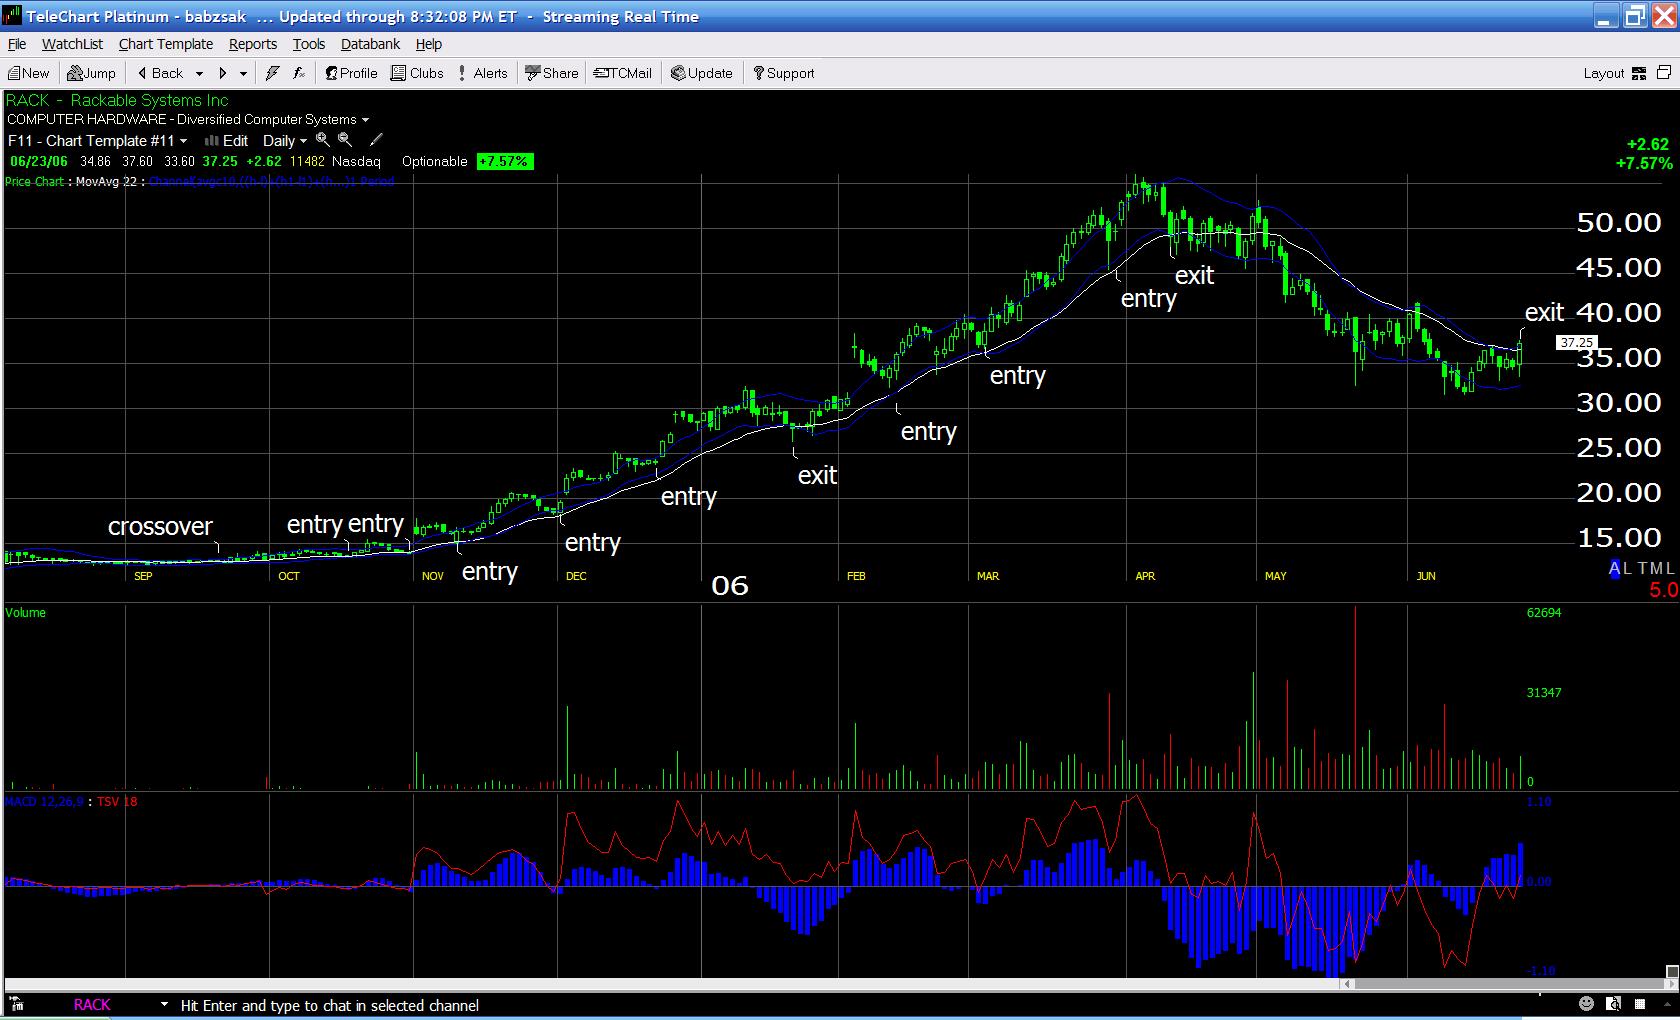
This is a custom cumulative stop channel that I wrote using Worden’s Telechart. This is one of the cool things about the program, you can write your own indicators! What I’m trying to do with this channel is approximate a width or a band around price based on the stock’s 10 day average volatility. I multiply that average volatility by a width of my choosing and apply it around price. When you are in a long position, a move outside the highest level of the lower band, is a stop. The reverse is true for a short position. In the other windows I have volume, Time-Segmented Volume and MACD. I’m watching for deterioration in the trend just in case something shows up before the channel hits a stop. As you can see, once a stock gets trending, you can’t beat this channel (in my opinion). There was one stop triggered (as I mentioned before, the one I may not have honored) around the 3rd week of Jan. After that it didn’t trigger again until the second week of April. That was clearly the end of the trend. As I said a few days back, I’ll never buy the bottom or sell the top and now you can see why, but I will catch the meat of a trend.
Now look how well this channel works for the short side too. If you were to switch to the short side early May or late April, based on the entry system’s cross-unders, the channel didn’t pull you out of the trend until today know ther are a couple of days in which the intraday price rose above the channel, but as most of you know, I usually only honor stops on a closing basis with few rare exceptions. Today you can see clearly price moved through the channel signaling a stop.
As you can see, the results speak for themselves-$35 points on the way up and another $12 or so on the way down. The catch is this-it is not often you find a stock in the beginning stages of a trend. This is why I swing at a lot of pitches and keep my losses small with position sizing, and the 2% rule. If you want to read a little more about the trend channel, see my post http://trade-guild.blogspot.com/2006/02/stops.html. Now, I showed you mine, you show me yours!