Evening Star Reversal


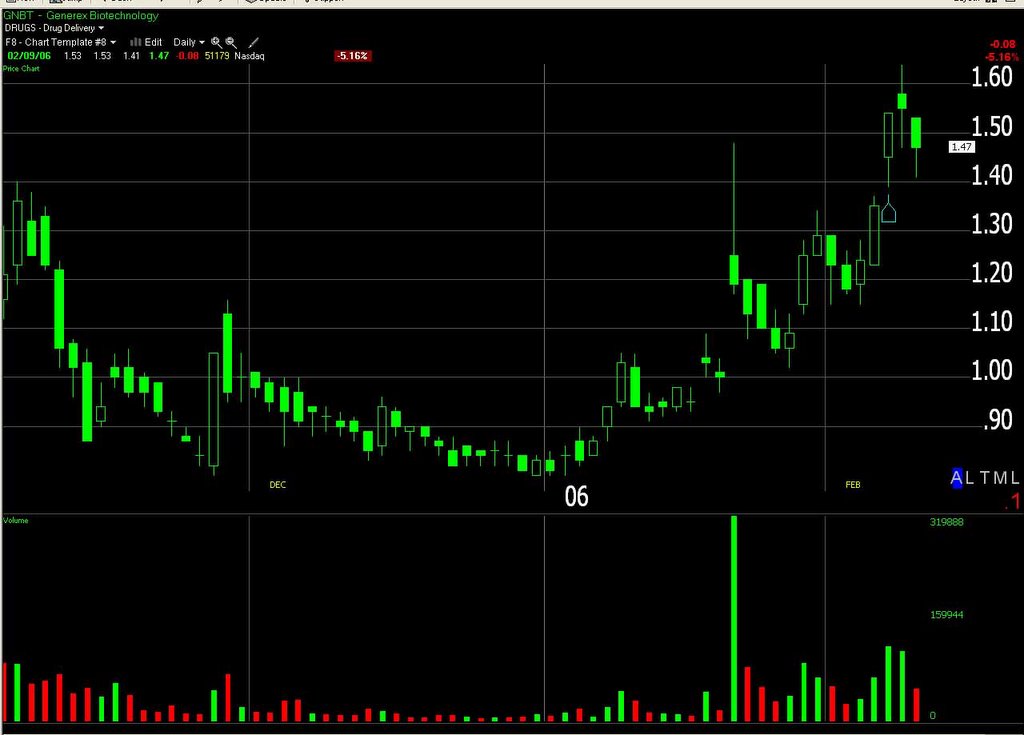
I was asked what an evening start is. The last 3 candles on this chart form an evening star formation. You should be able to click on the chart to get a bigger view. The way a candle works is the open candles which show up as black with a green outline are days in which the stock opened lower and closed higher. The bottom of the real body is the opening price, the top of the real body is the closing price. The lines that look like the wick of the candle are the intraday high and low. Conversely the filled in candles or in this case the solid green are days in which the stock opened higher and closed lower.
An evening star formation consists of 3 candles and it generally marks a reversal in trend. The 1st has a long white real body (in this case the black candle), the second is a star which is a candle with a small real body(either color), the 3rd candle is a black real body(in this case pure green) that closes deeply into the 1st candle’s real body. On a perfect formation, you’d have a gap between the 1st real body and the star and a gap between the star and the 3rd candle’s real body, but it is not necessary to complete the pattern. The bigger the 1st candles real body and the deeper the intrusion of the 3 candles real body, the more severe the pattern. I know it’s all confusing at first, but study this chart and soon you’ll have it.