Example Subscriber Post – Wednesday’s (November 30th, 2022) Daily Wrap
The stock market closed out November and heads into December (seasonally favorable time for the market anyway, as well as midterm election year seasonals) on a strong positive note. The major averages all posted strong gains today, breaking out from bullish consolidation patterns that have been in place since our last measured move S&P target of $4,000 was hit mid-month. The key pivotal event of the day was Fed chair Powell’s speech, but price action has suggested the averages wanted to go higher. In fact , I didn’t think the speech was all that dovish, it was just nothing new, and not as hawkish as the market may have feared.
In front of Mr. Powell’s remarks, the main indices were meandering around their flat lines until comments from Amazon.com (AMZN +4.5%) CEO Andrew Jassy precipitated a modest decline. He said at the DealBook Summit that “people are very much hunting for bargains“ and noting that the economy is “a lot more uncertain” than previously thought. This played into the market’s concerns that the Fed is going to raise rates too much and create a hard landing for the economy.
Interestingly the mega-caps had been acting well on a relative basis all day, even before Powell when yields were higher. The Dow has been the big winner over the past 2 months, but I’ve been expecting the large-cap Tech oriented NASDAQ-100 to play catch-up.
The tone of the market changed completely with the release of Powell’s speech. The market predominately reacted to the following key excerpt:
“Monetary policy affects the economy and inflation with uncertain lags, and the full effects of our rapid tightening so far are yet to be felt. Thus, it makes sense to moderate the pace of our rate increases as we approach the level of restraint that will be sufficient to bring inflation down. The time for moderating the pace of rate increases may come as soon as the December meeting.”
The fed funds futures market now prices in a 74.7% probability of a 50-basis point increase at the December meeting versus a 66.3% probability yesterday, according to the CME FedWatchTool.
Just about every asset class reversed on Powell’s speech. The Dollar and US yields sank, while gold and stocks rallied.
As I’ve said recently, the worse the economic data, the more the market will like it as it will put pressure on the Fed to be careful how much further they hike rates. On that note, the Chicago PMI reading for November (37.2) was particularly ugly, falling further into contractionary territory (i.e. sub-50 reading) than the market was expecting. China also reported weaker-than-expected Manufacturing PMI (48.0) and Non-Manufacturing PMI (46.7) readings that fell further into contraction territory (below 50).
Averages
The Dow up over 20% from its early October lows so you may hear some financial media sources define that as a new bull market for the Industrial Average. I’d be wary of those claims as a 20% rule for bull/bear markets is completely lacking of any context as it depends greatly on a stock or averages’ beta. The primary trend for the Dow has turned even more transitional, which is something I first noticed in August, leading me to believe that we were much more likely to enter a more sideways/lateral trend the rest of the year, than the primary downtrend. I’ll include a chart below. Dow Transports (+1.94%) were fine, but lagged the DJIA by a little.
However, I’v also felt strongly that the NASDAQ-100 that has been lagging the other major averages, would play catch-up on the next leg up and as you can see today, it doubled the Dow’s price percentage gain with mega-cap leadership.
S&P-500 ⇧ 3.09 %
NASDAQ ⇧ 4.58 %
DOW JONES ⇧ 2.18 %
RUSSELL 2000 ⇧ 2.72 %
All of the averages broke out of bullish price consolidations over the last 2 weeks or so.
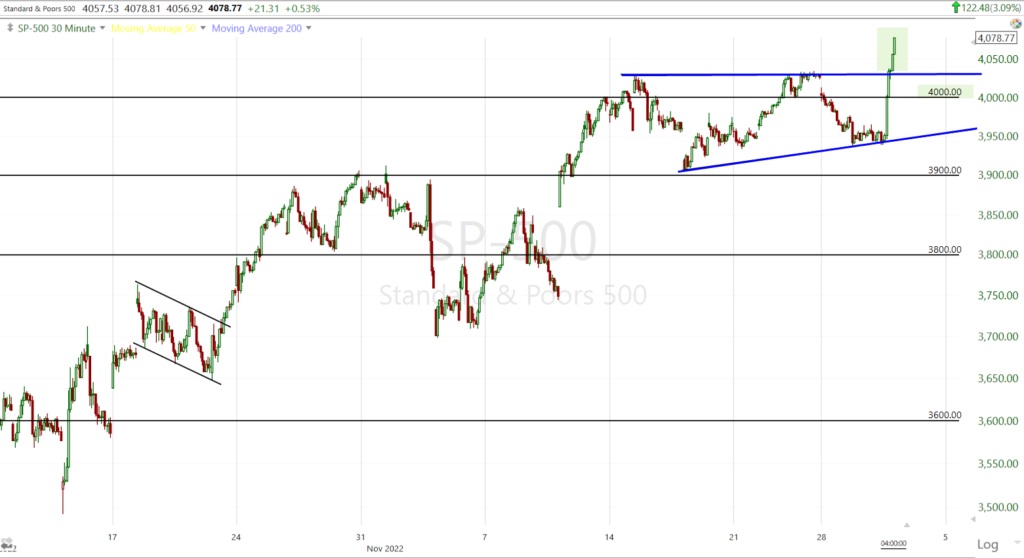 SP-500 (30m) with a bullish ascending triangle. You may recall that I said the most bullish of these patterns, typically breakout 2/3rds of the way to the apex which was the case with this one.
The S&P 500 was also able to break above a key technical level, its 200-day moving average at 4,050, and with that came an increase in short covering in the Most Shorted Index of stocks.
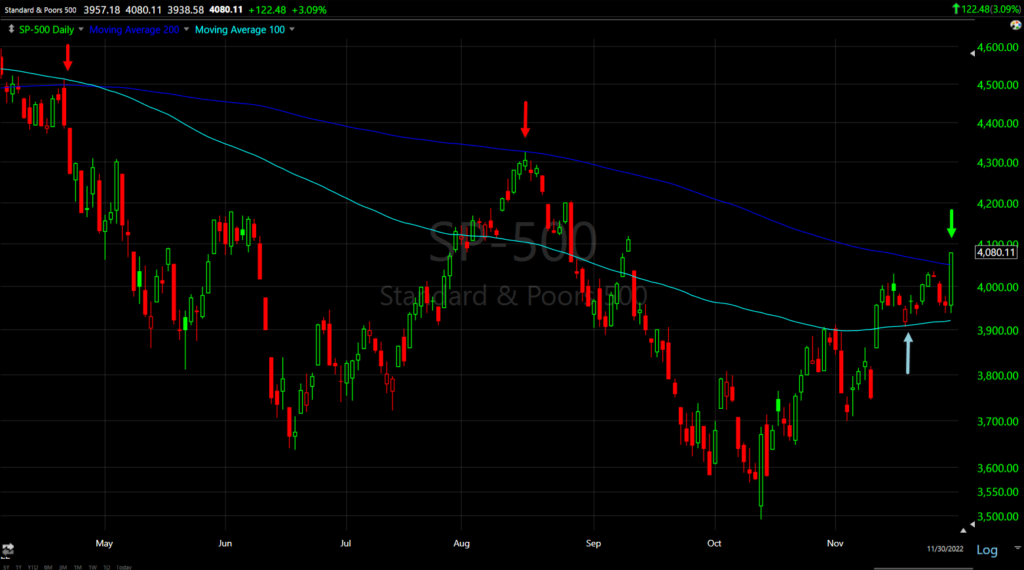 SP-500 (daily) meeting resistance at its 200-day the last two times it tested te average, but breaking out above it today, as well as closing at session highs which is typically bullish for the next morning’s start.
I noted in the Afternoon Update there was short covering in the Most Shorted index, but…” I wouldn’t call it extremely large yet and that may be because the S&P is taking on its 200-day sma that was resistance from August and I suspect a lot of technical traders are going to want to hold or add to some of their shorts here at the 200-day.”
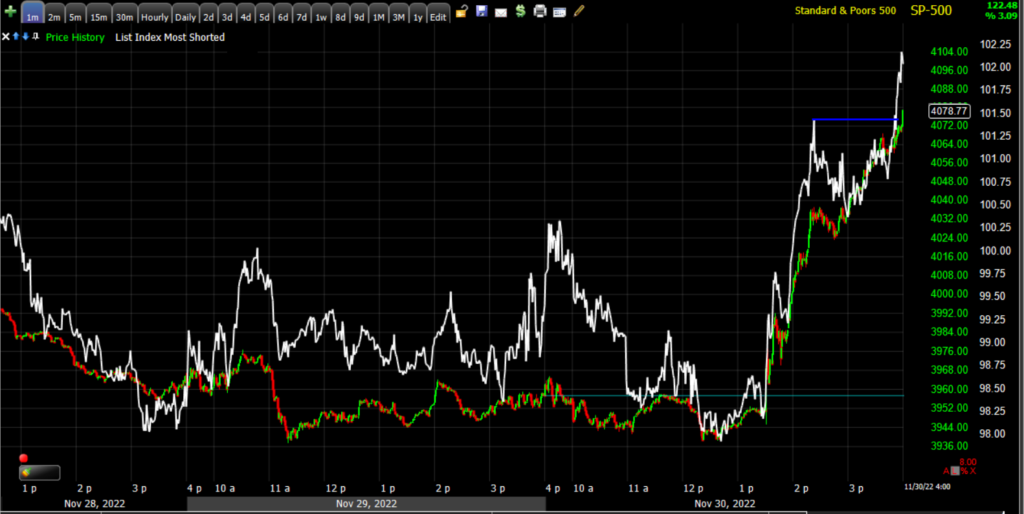 SP-500 (1m) and the Most Shorted Index. As the S&P crossed above its 200-day sma, more shorts started covering in the MSI.
However, to put the overall situation into perspective, lets take a wider view of the situation…
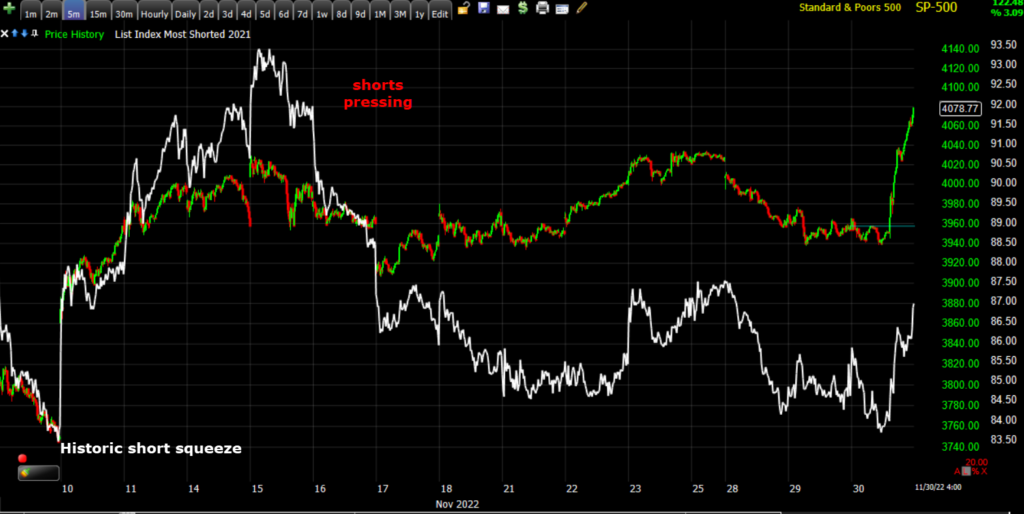 SP-500 (5m) and the Most Shorted Index. After one of the strongest short squeezes ever as the S&P met our first upside target at $4,000, the shorts really stepped in and pressed new short positions. There’s still a lot of potential for more short covering to drive the averages higher from here.
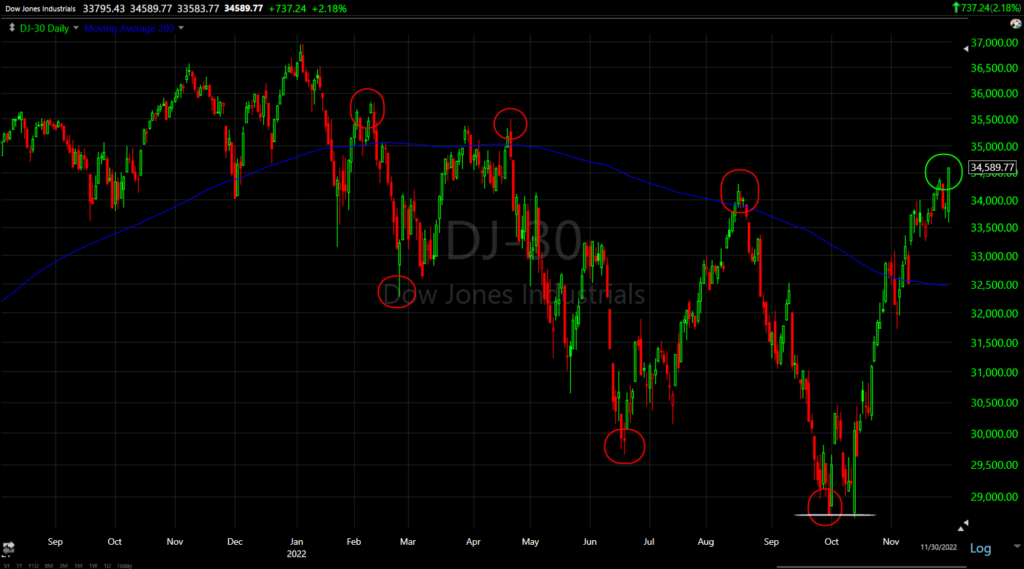 Dow (daily) with 200-day sma. The red circles are the primary downtrend or bear market, a series of primary trend lower highs and lower lows. you may recall the base I was looking for into October, that was a “W” base for the Dow (white trend line). The green circle is a primary trend higher high, which throws the bear market primary trend into a transitional state, but until there’s a primary trend lower high as well, I would not consider this a bull market, but the typical strong counter-trend rally.
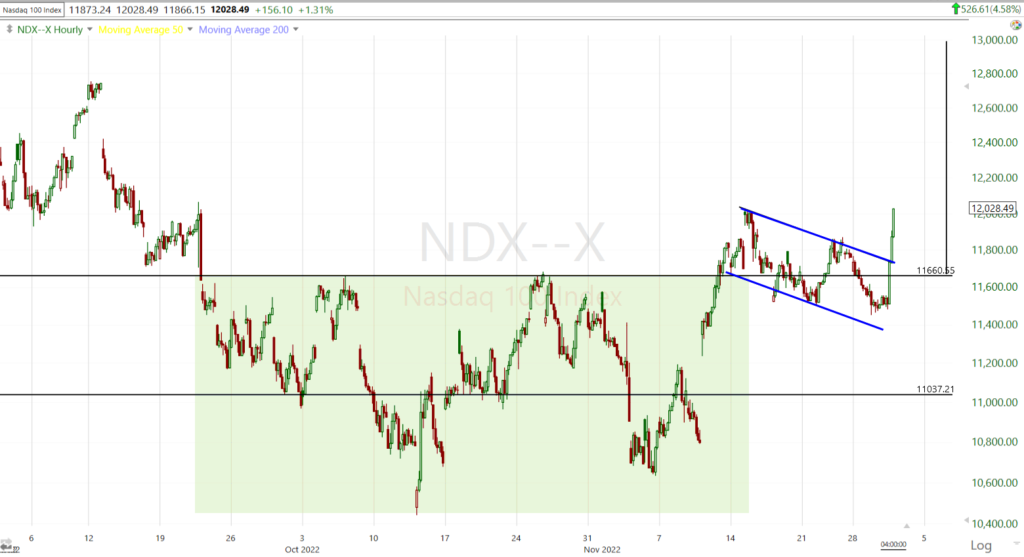 NASDAQ-100 (60m) was the last average to break out of its October base, an inverse H&S base (shaded green), and it broke out of its bull flag (blue) today. The measured move for the base is $13,000 or about another 8% higher, so I do continue to expect the NASDAQ-100 to outperform the other averages on this leg.
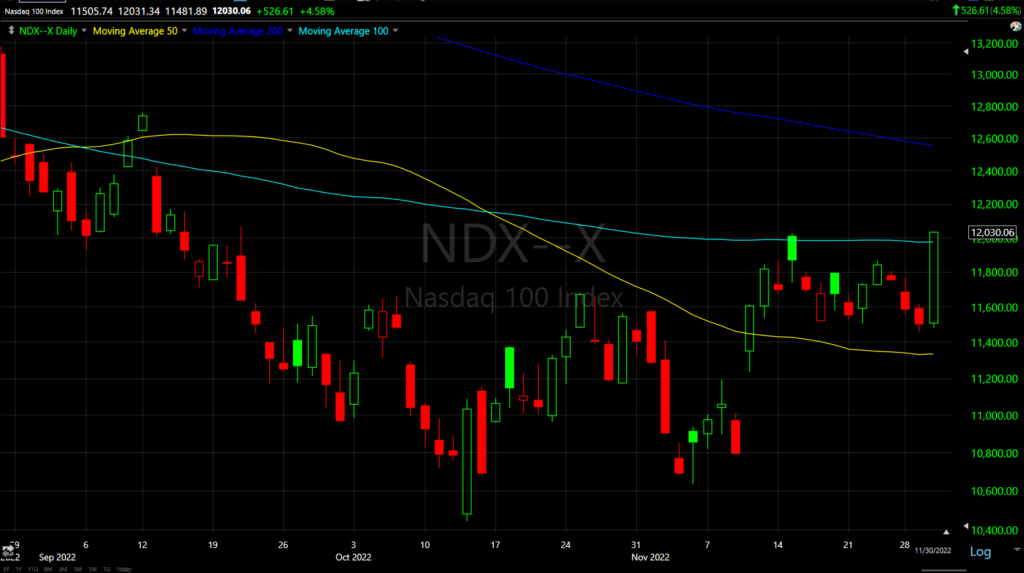 NASDAQ-100 (daily) met resistance at its 100-day just a couple of weeks ago, today it pushed above with a close at session highs, much better looking price action than the last time it was here.
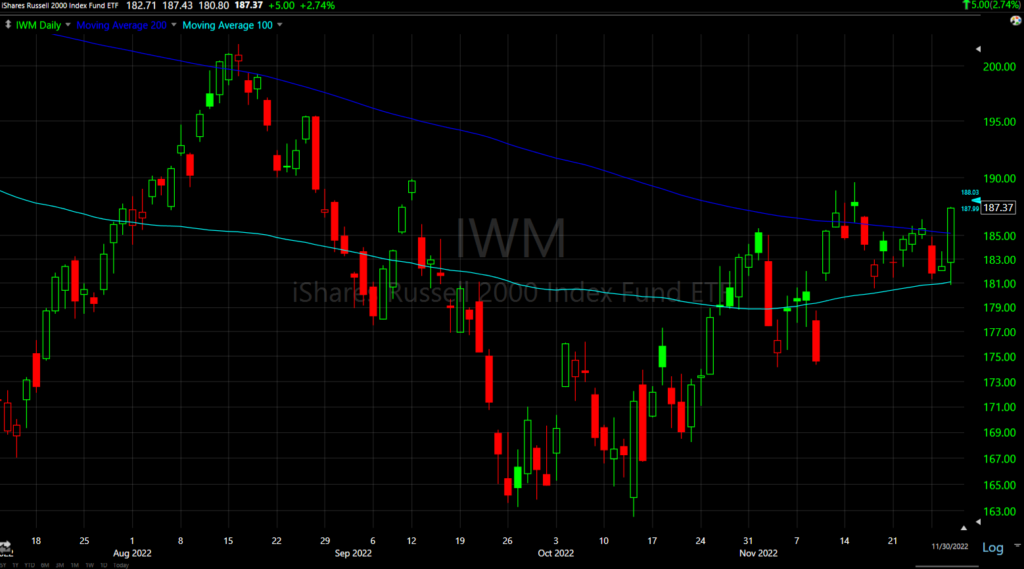
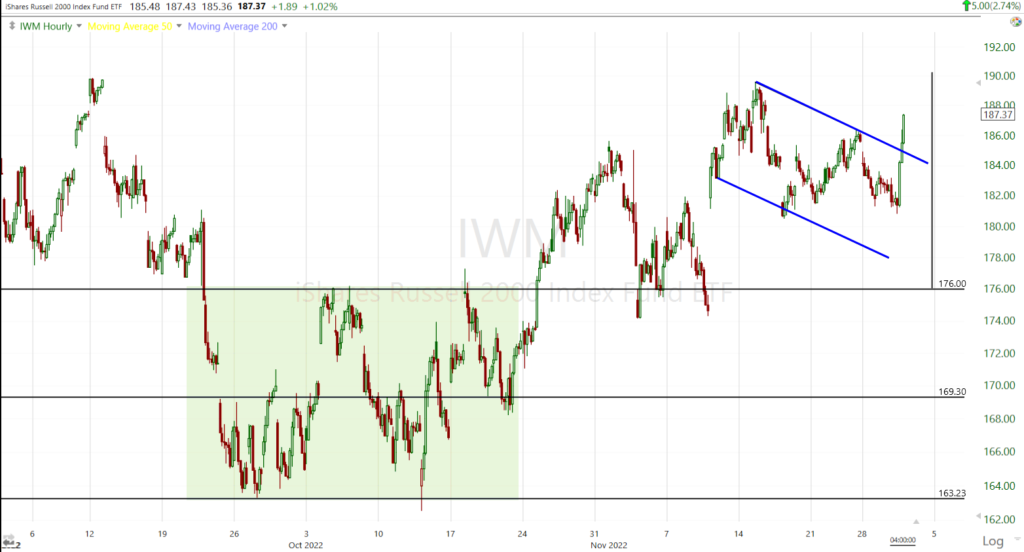 Small Cap IWM (60m) shared something in common with the Dow, both had “W” bases. IWM broke out of its bull flag. It’s measured move target from the “W” base is around the $191 area, but the bull flag suggests it could trade even higher than that. If or when we get the next price consolidation, even if only intraday, we can better-dial in the probabilities of the bull flag’s higher measured move as we typically get a small price consolidation around the mid-point to a measured move (in this case referencing a higher measured move based on the bull flag).
The more short covering we get in the Most Shorted Index, the more it will benefit Small Caps disproportionately.
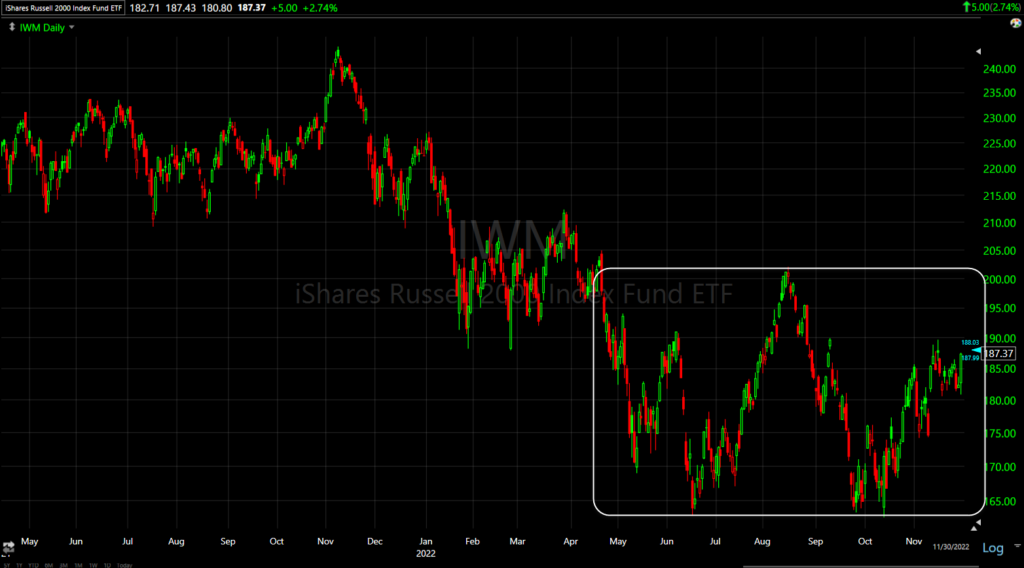
IWM (daily) also struggled at its 200-day (darker blue) in August, but this was one of the first “transitional trend signals” we got way back in august, leading me to believe we’d see a more lateral, wide range rather than a primary don trend. Notice Small Caps also found support at the lighter blue 100-day.
Backing out a little further, you can see the lateral wide-range price trend already developed…
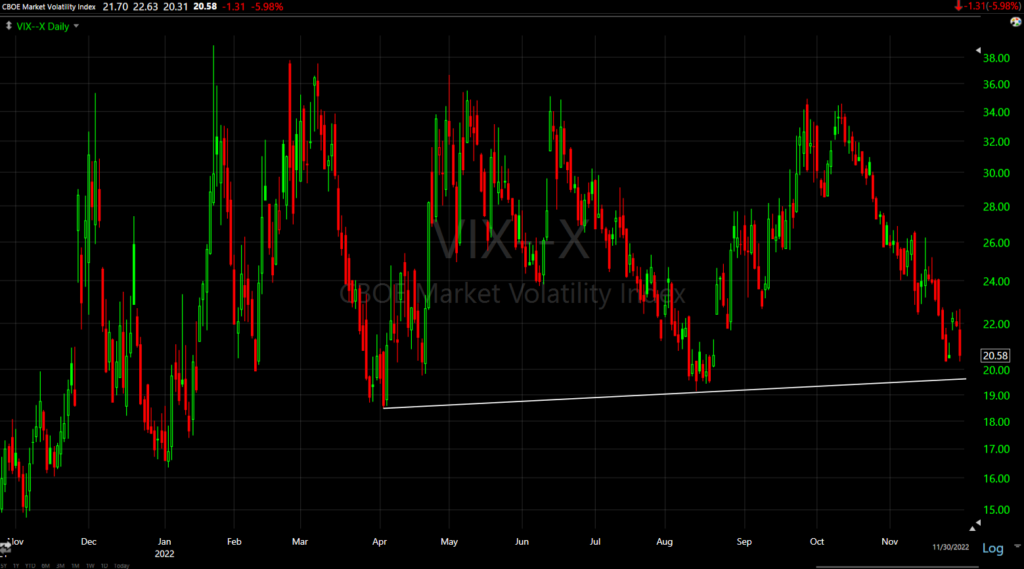
VIX lost 6% on the day, but did show some relative strength this afternoon.
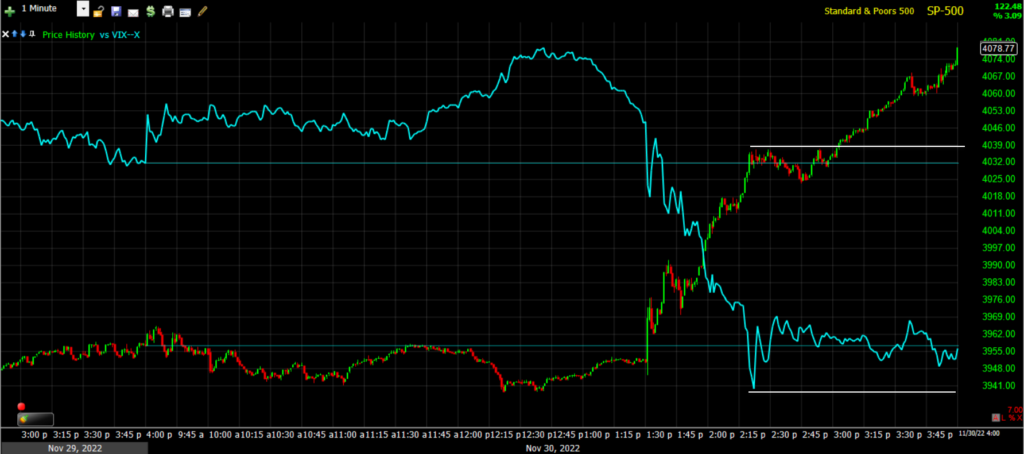 SP-500 (1m) and VIX (blue) notice the S&P makes higher highs intraday, but VIX does not make lower lows. Perhaps it has something to do with this trend line below near the $20 area…
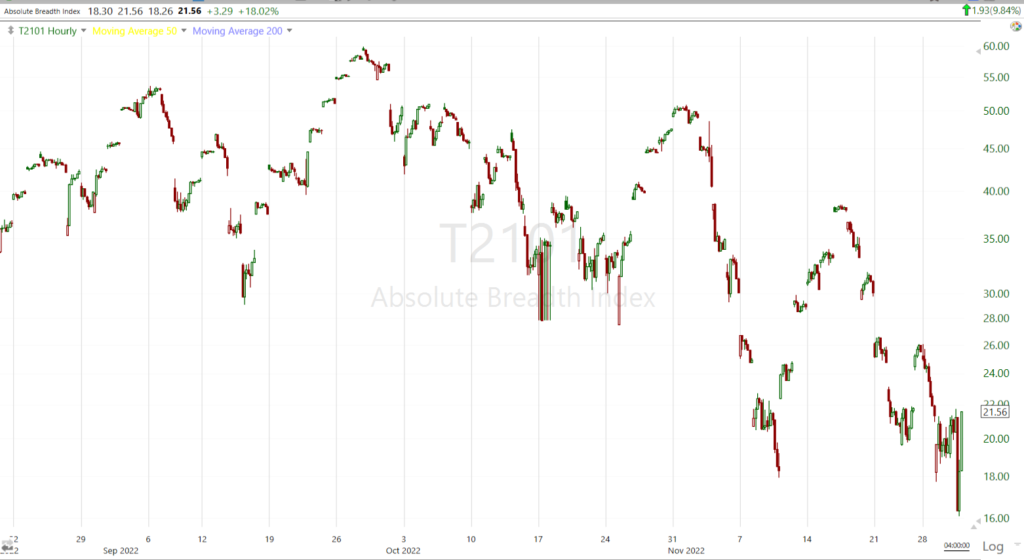
In any case, we did have an interesting development. For years I’ve done research and followed a little known, high probability long volatility signal, when the Absolute Breadth Index makes an extreme low, which I define as below 14. When that happens, we have a high probability scenario of a move of 50% or more in VIX over the next month, typically starting very soon after the sub-14 print. the lower the ABI, the higher the probability. We’ve seen some moves of over 450% in VIX once this signal triggers. We had an unusually large number of these signals last year (typically only 1 or 2 a year), and the last time we had one was in Q1 of this year. The ABI headed down to 16 today before Powell but then jumped back up to 21.50
And a closer look…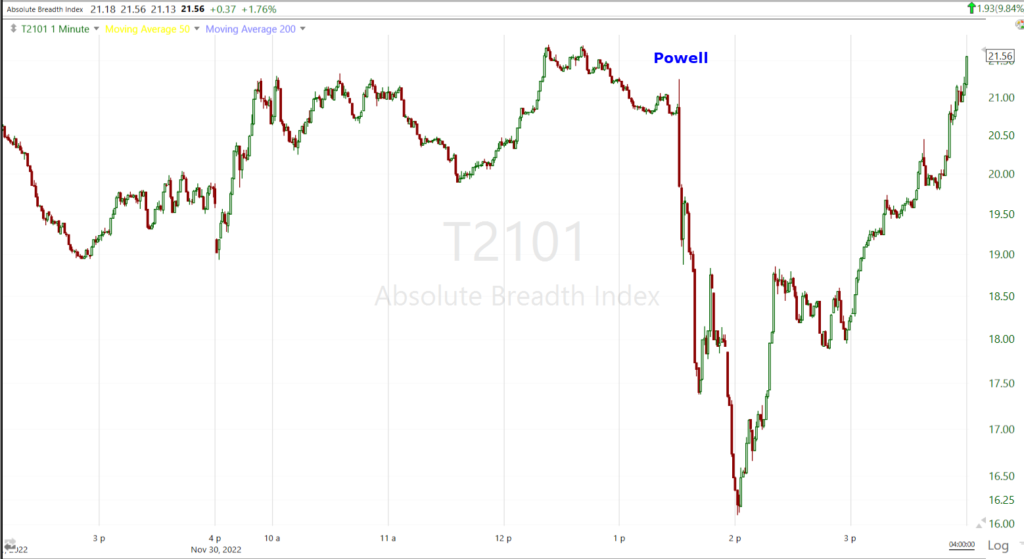 ABI (1m intraday)
We’ll of course want to keep an eye on this. Remember, I’ve expected more on the upside, but I do not believe we are in a new bull market so at some point I think we’ll see the market come back down and a long Volatility ABI signal would be one hint that we may be getting closer to that eventuality.
S&P sectors
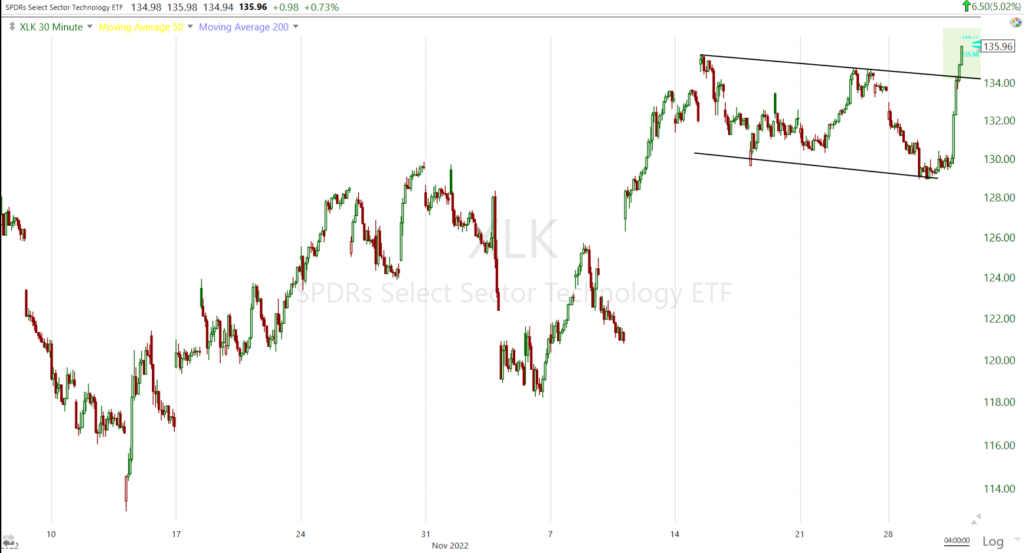
From a mixed day at best before Powell, all 11 S&P 500 sectors closed in positive territory with gains ranging from +0.6% (Energy) to +5.0% (Technology). The 3 mega-cap heavy sectors (Technology, Consumer Discretionary and Communications) performed best on the day.
The Mega-Cap Index (MGK +4.6%) outperformed all day, even when yields were higher before Powell, but really shined after Powell, outperforming the S&P Equal Weight Index (+2.4%) by 220 basis points, benefiting the NASDAQ-100.
Materials ⇧ 2.41 %
Energy ⇧ 0.50 %
Financials ⇧ 1.71 %
Industrial ⇧ 1.65 %
Technology ⇧ 5.02 %
Consumer Staples ⇧ 2.01 %
Utilities ⇧ 2.50 %
Health Care ⇧ 2.39 %
Consumer Discretionary ⇧ 3.45 %
Real Estate ⇧ 2.40 %
Communications ⇧ 4.23 %
Despite the Technology sector having the best gain of the day, the Semiconductors that tend to lead the Tech sector posted even better performance with the SOX Index gaining +5.85%. Like the NASDAQ-100, both began breaking out of their own bull flag consolidations.
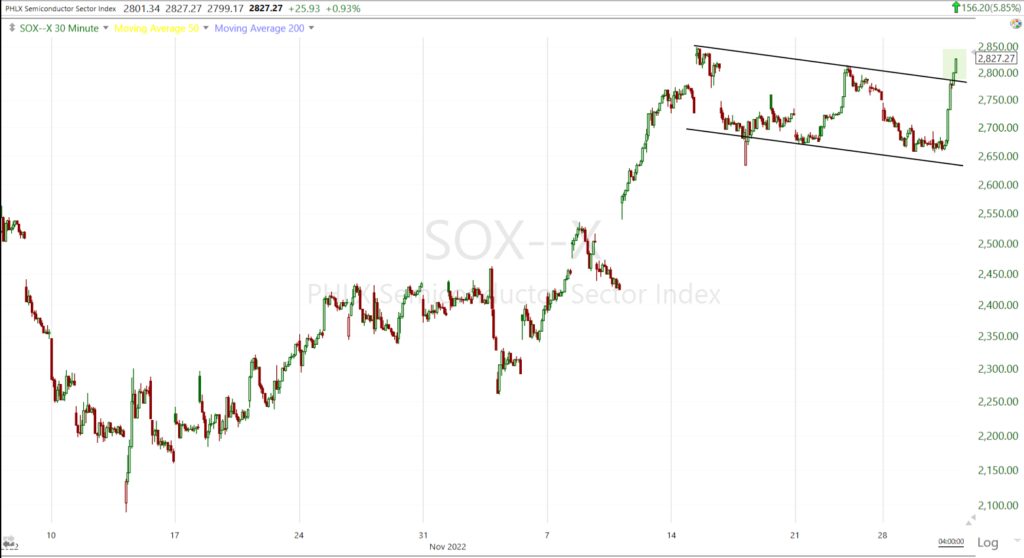 Semiconductors/SOX Index (30m)
Internals
NYSE Advancers (2574) led Decliners (423) by an impressive 6-to-1 ratio on heavy Volume of 1.9 bln. shares. NASDAQ Composite adancers led decliners by a 3-to-1 ratio.
The Dominant price/volume relationship was extremely dominant with 29 of 30 Dow stocks in the category, 99 of the NASDAQ-100’s stocks and 463 of the S&P-500’s stocks, all coming in at Close Up/Volume Up, which is the most bullish price/volume relationship and that rules out 1-day overbought internals.
Market breadth is still plenty strong, but it’s not as strong as we saw the last few months. Here’s one example…
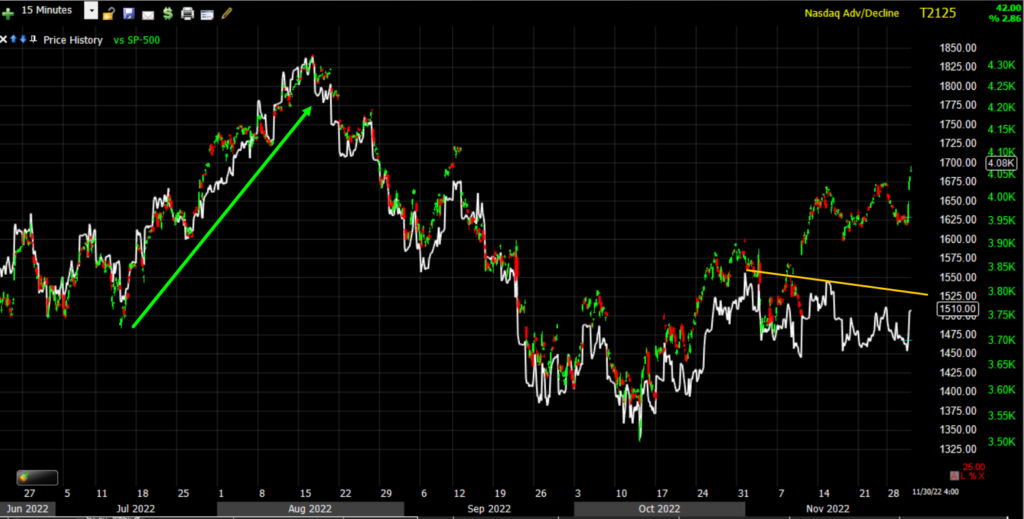 SP-500 (15m) and NASDAQ Composite’s Advance/Decline Line. Notice how the A/d line confirmed the strong rally in august, but it’s not making a higher high here. That’s not to take anything away from the current rally, but when we get to the next measured move, I suspect it will be time to be much more cautious. The strength of market breadth in August was due to a vast majority of stocks participating. If this rally goes the way I think, it won’t be the same vast majority of stocks, but the heavily weighted mega-caps of the NASDAQ-100. The can lift the market further and faster than 1000 NYSE stocks, but eventually you get a hollow, thin market at risk of a breakdown. This isn’t something I’m concerned about yet, but I can see the change in tone and it’s something we’ll have to monitor closely.
On the other hand, we still have plenty of market breadth indicators acting very well. For example…
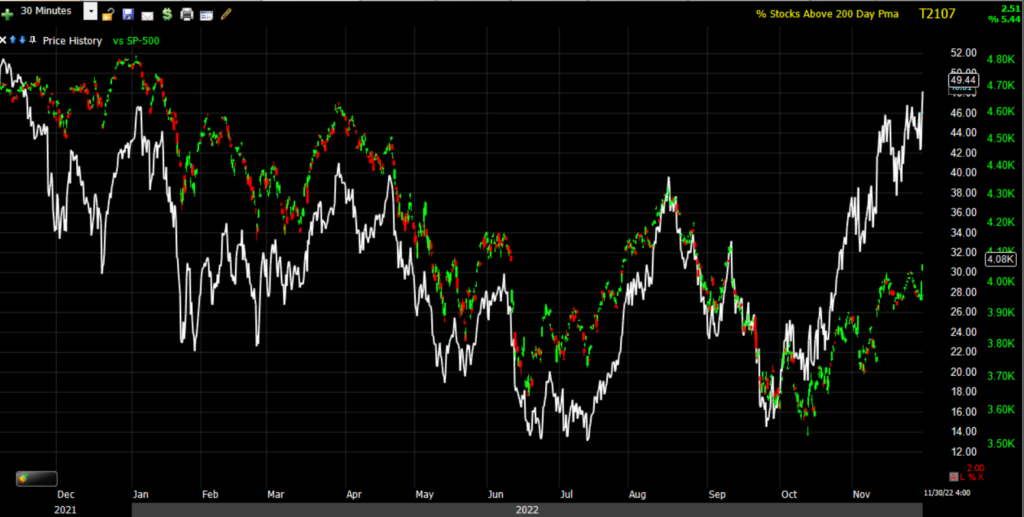 SP-500 (30m) and the Percentage of NYSE Stocks Trading Above Their 200-Day SMA is much higher than the August high, and pretty much the highest in a year when the S&P was trading 14% higher than now. I don’t use breadth indicators for price targets, but this tells me there’s still plenty of market breadth strength, but I am seeing some areas deteriorating a little and we’ll just want to be aware of that to stay on the right side of the market.
Treasuries
After spiking overnight on hopes that China will be coming back soon, yields faced a mini crash on Powell’s comments with the short-end (2y) massively outperforming the long end (2y -9 bp vs. 30y -1 bp) causing sharp yield curve steepening. The 2-year yield fell nine basis points to 4.38% and the 10-year yield fell five basis points to 3.70%. the mega-caps were already acting well when yields were higher earlier today, so this decline after Powell just bolstered them that much more.
Treasury yields are lower on the month (except 2-year which ended unchanged after today’s post-Powell plunge) with the rest of the curve all down around 35 bp in November.
As mentioned above, the yield curve steepened so we should see banks starting to act a bit better in relative performance terms.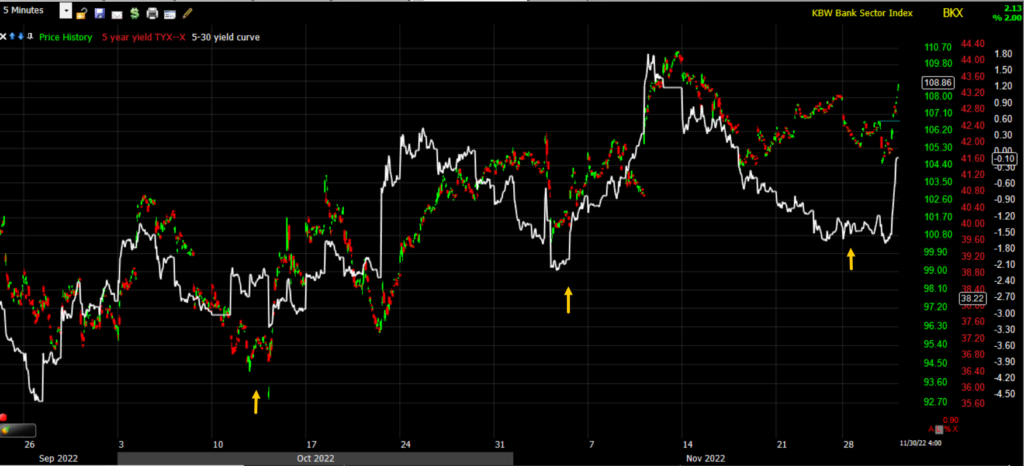 KBW Bank Index (5m) and the 5s-30s yield curve. The pull back (flattening) in the curve and then steepening at the yellow arrows has been pretty typical recently so I didn’t think it was too much out of character, I just preferred to have long exposure to mega-caps or other areas over banks in terms of what will perform the best. As you can see, the curve tends to lead the banks.
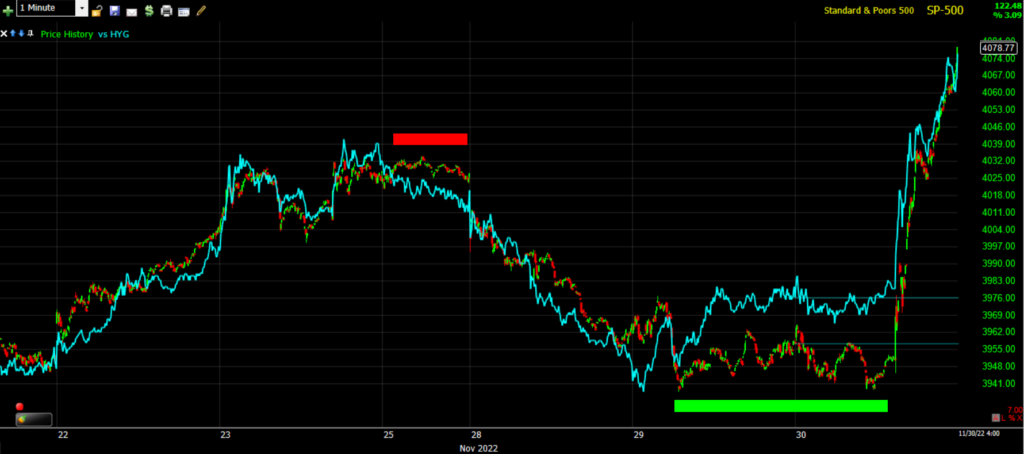
As mentioned in the Early Update, HY Credit (HYG +1.5%) was acting better than it should have with higher yields this morning.
“Surprisingly given higher yields, HY Credit (HYG) is down less than a tenth of a percent, and therefore holding its minor relative positive divergence vs. the benchmark index.
While none of these divergences are more than modest, it doesn’t mean they’re not meaningful as we can see last week with HYG negatively diverging (red) and leading the consolidations in the averages off the top end of their ranges into this week, and the slight relative positive divergence in HYG (white) from yesterday leading the S&P off session lows.”
SP-500 (1m) and HYG which is one of my favorite leading indicators because of its deep liquidity, institutional traders often use it as a proxy for S&P futures. I can’t say for sure, but it wouldn’t surprise me if they had some inside information on the tone of Powell’s comments this afternoon.
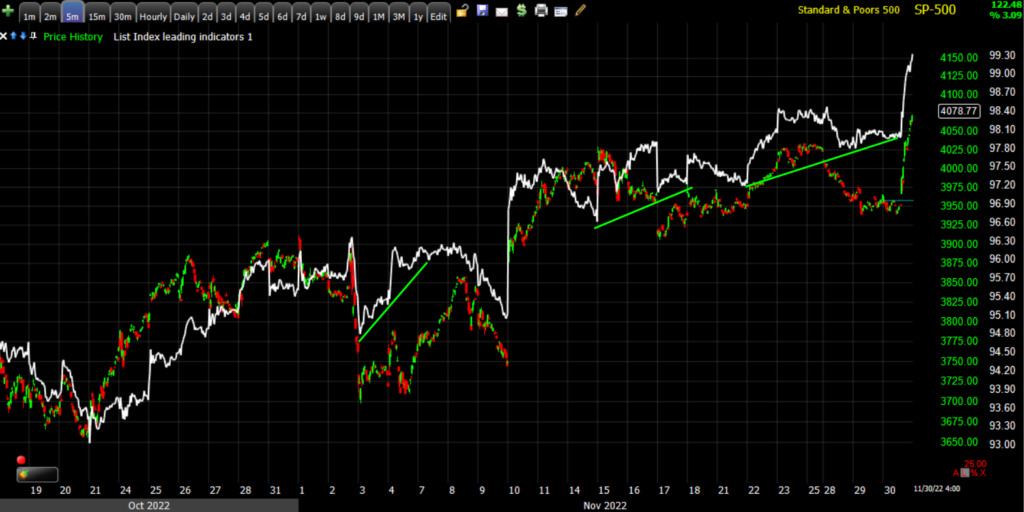
And my own, broader custom credit index has been acting very well, positively diverging with and leading the S&P higher. Credit markets are far more sophisticated and better informed than equity markets.
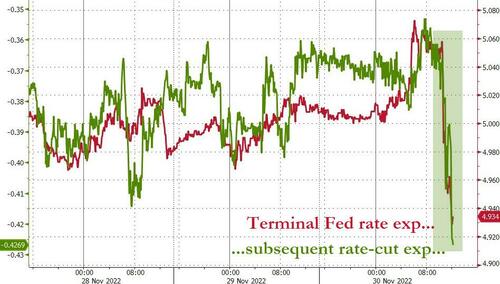
Powell comments oday pushed the terminal rate expectations back below 5.00% and raised expectations for rate-cuts in H2 2023 (despite Powell saying the opposite). Today saw 20 bp of rate-hikes cut off the Fed’s terminal rate and 12 bp of rate-cuts added to H2 2023 expectations, back to basically unchanged on the month.
Source: Bloomberg
Currencies and Commodities
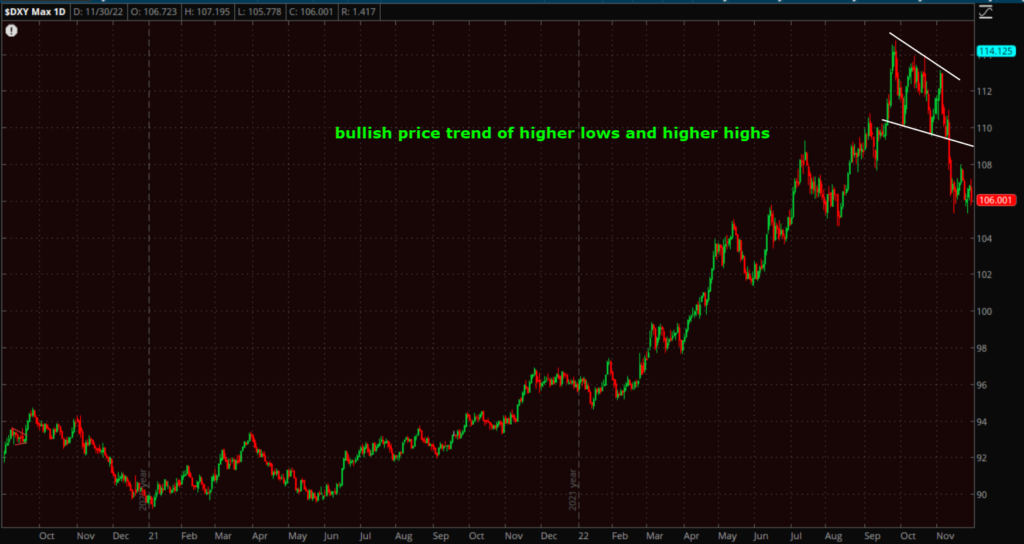
The U.S. Dollar Index fell -0.7% to 106.04. Like credit markets, FX markets are more sophisticated and better informed than equity markets, which is one of a few reasons I always say to watch how the Dollar reacts. It was a clearly dovish reaction, even though Powell didn’t say anything new, he just wasn’t as hawkish as the market feared.
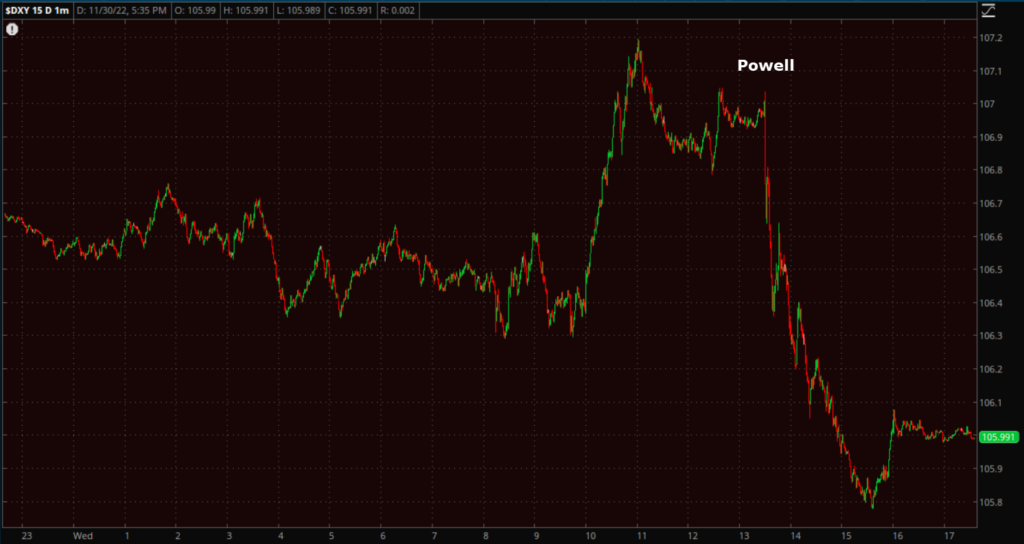 U.S. Dollar Index (1m) falling sharply on Powell’s comments, a clear “more” dovish than expected signal from the currency market.
That leaves us with a price consolidation in the Dollar that is taking on a more bearish bias…
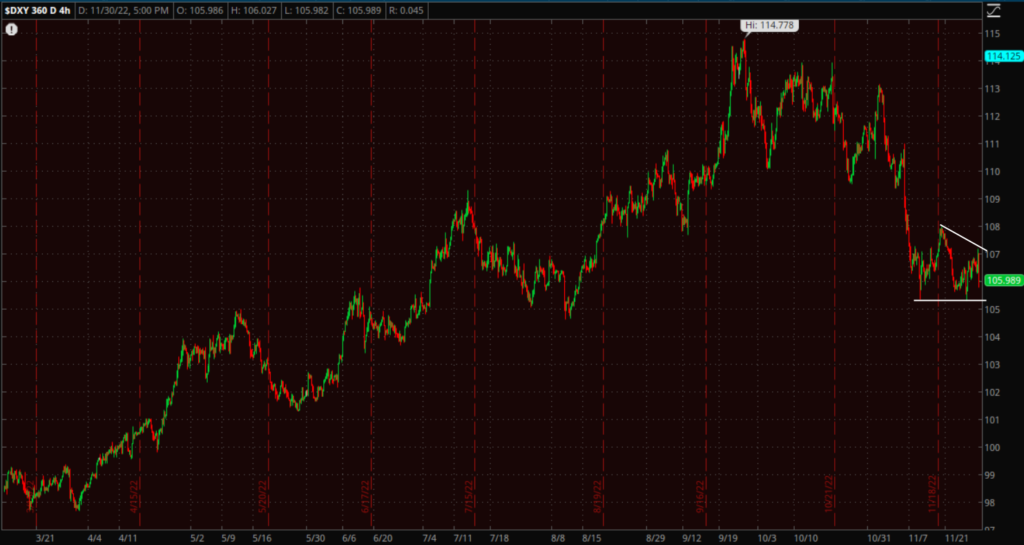 U.S. Dollar Index (4H) appears to be a descending triangle (the opposite of the S&P’s ascending triangle), a bearish consolidation suggesting more downside to come which would benefit stocks and gold because of the strong inverse correlation since March of 2020.
The Bloomberg Dollar Index (which is different than the U.S. Dollar Index above) had its worst month since May 2009, which tells you something about the recently shifting perceptions with regard to Fed policy. Regardless, I’ve noted numerous times that this is the most suspect (toppy-looking) price action in the Dollar since the Fed began tightening policy.
WTI crude oil futures gained +2.6% to $80.49/bbl. after the biggest weekly crude draw since June 2019.
Gold just had its best month since July of 2020. Like stocks, it has a strong inverse correlation to the Dollar and UST yields. You can see that on this chart of the S&P and GLD…
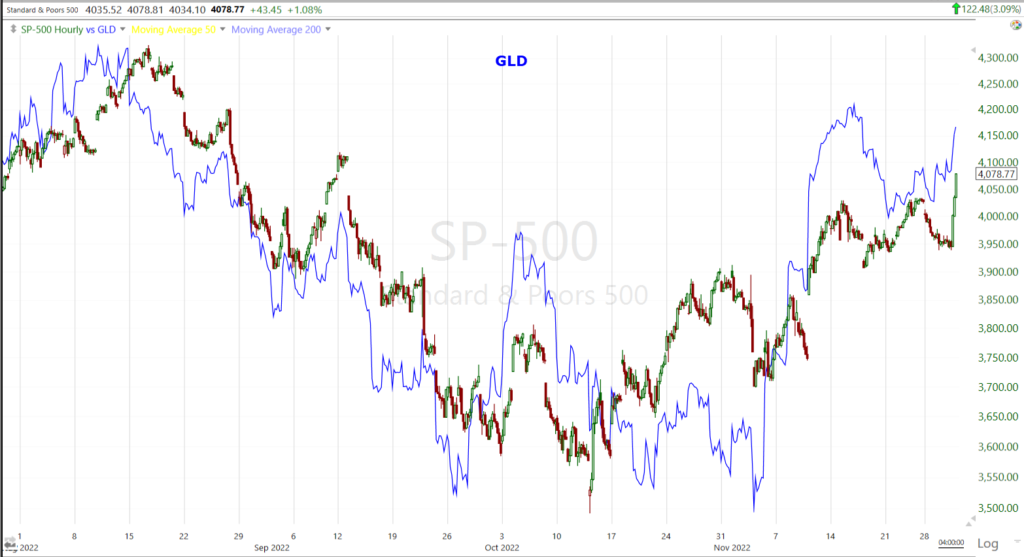 SP-500 (60m) and the Gold (GLD) ETF in blue.
I haven’t liked Gold’s price action for over a year, but we got the first hint of something interesting at the $1620 level…
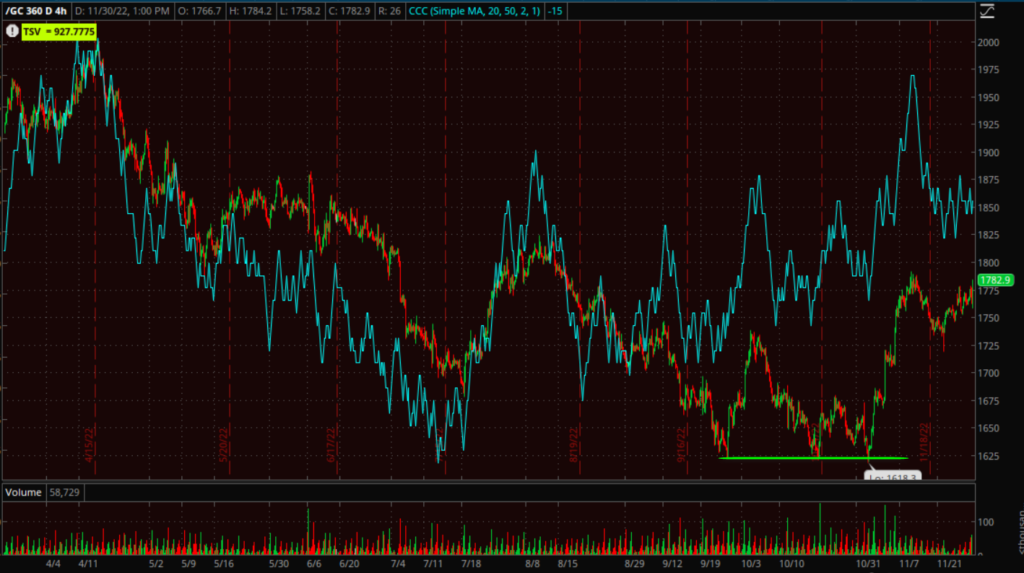 Gold futures (4H) – this “W” base looks very similar to the Dow and small Caps’ and has a decent 3C positive divergence.
Intraday, Gold reversed course on Powell’s comments.
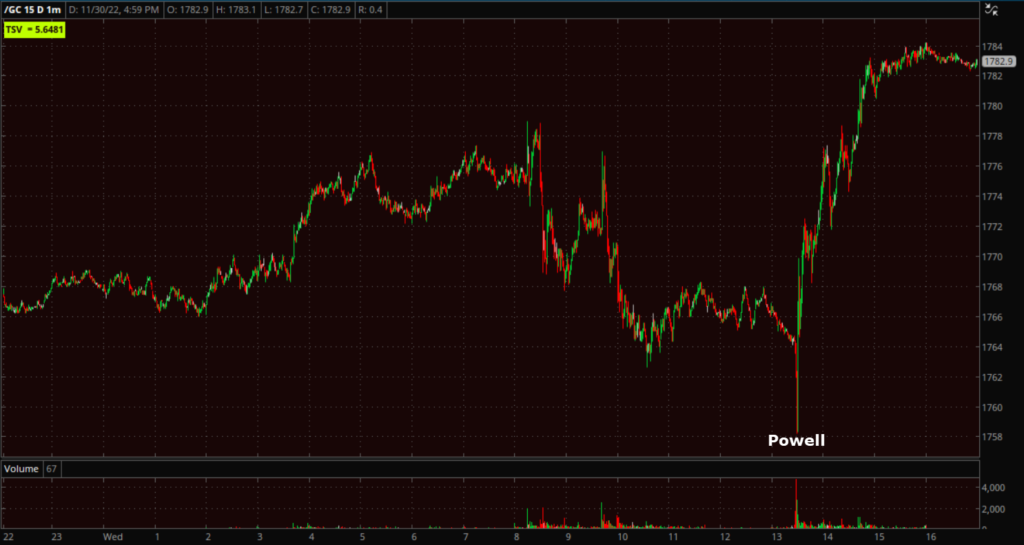 Gold futures (1m) – the next level of importance for gold’s price action to remman bullish is $1800. I suspect gold will rally about as long as stocks for the reasons mentioned above.
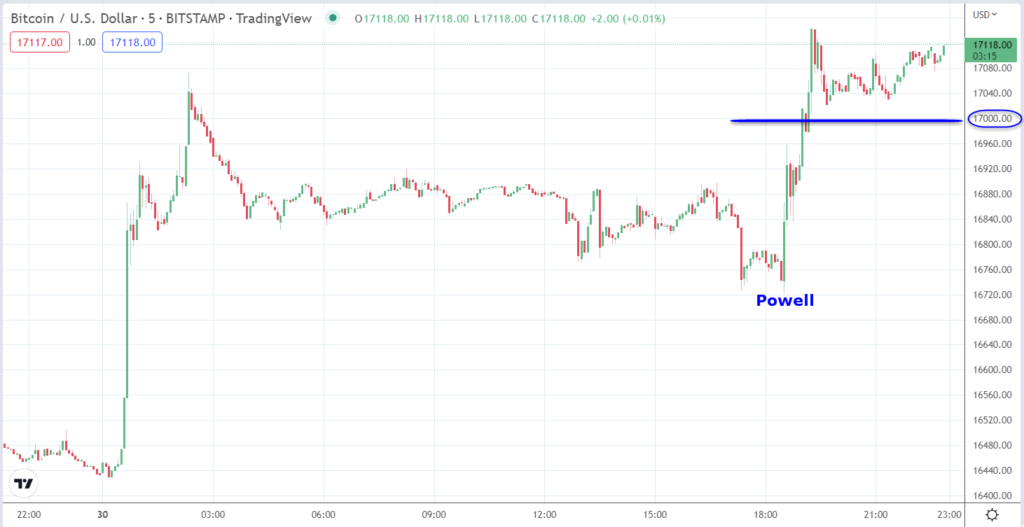
Bitcoin gained about 4% on the day with risk sentiment turning bullish during Powell’s remarks, allowing the crypto to push above $17,000.
However, that didn’t change the bigger picture’s bearish view…
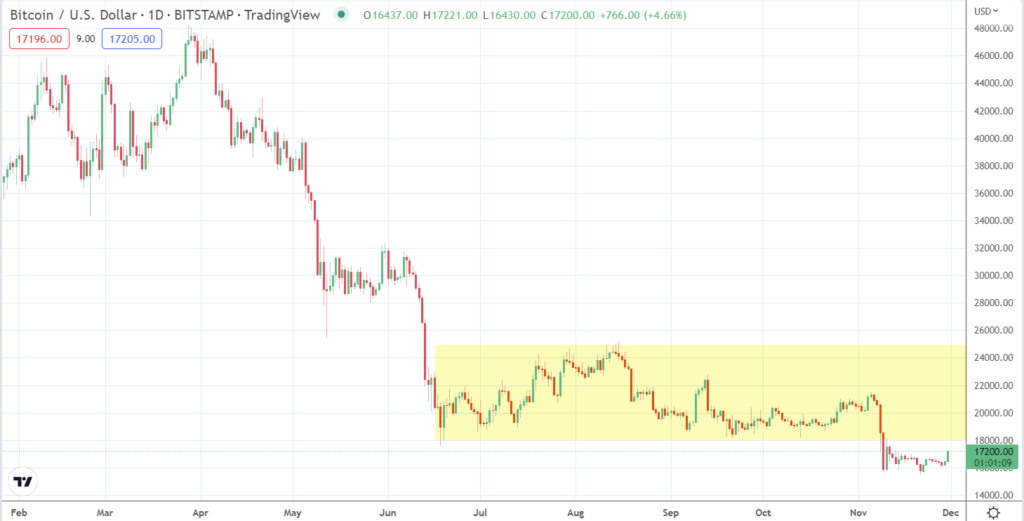 BTC/USD (daily) the next level of significance will be the $18k level just above, which is essentially the bottom of the larger lateral range from mid0-June.
Summary
The bullish price consolidations have been there for the last 2 weeks or so. As you may recall, while price is the most important aspect, volume is important too and I was worried early last week about a breakout from these bullish consolidations amid seasonally low holiday shortened week volume as it would be difficult to assess whether or not volume was doing what it should. Today volume did as it should have and jumped on the breakout so last week’s expansion of the bullish price patterns worked out well.
3C charts looked excellent on the breakout as well and have acted as they should during the consolidation phase.
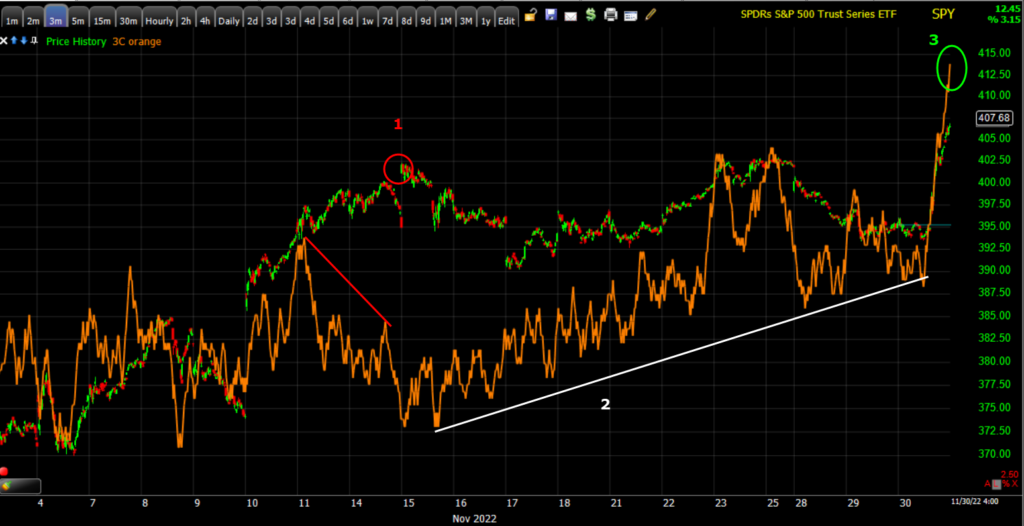 SPY (3m) as the S&P reached the measured move at $4000 (at #1) the market was way overbought and the most common thing to happen once a measured move is nmet, is for price to consolidate in the area. 3C signalled that (in red). then as the consolidation develops and displays a bullish tone in price, 3C should confirm that as well, which it did with a positive divergence (at #2 and the white trend line) and on the breakout, 3C should confirm which it did today at #3 and the green circle, if not actually leading higher. This is pretty much a textbook view of 3C during the consolidation phase.
Even though NASDAQ-100 had a different bullish consolidation (flag) compared to the S&P (ascending triangle), it had the same 3C signals…
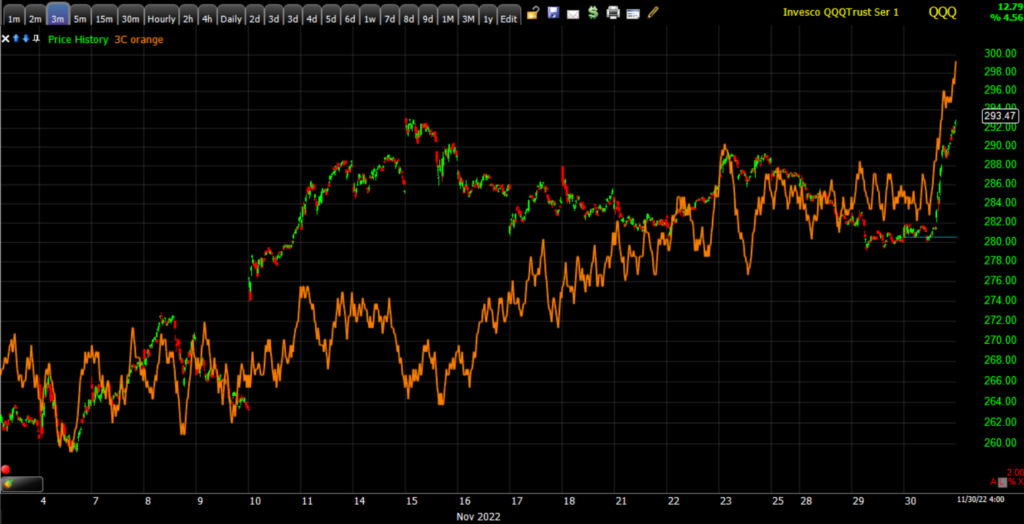 QQQ (3m) first suggesting a consolidation to work off overbought signals and draw new shorts back into the market and shake out weak hands on the long side, then confirming the bullish bias of the price action, and confirming the breakout.
I do expect that the mega-caps and NASDAQ-100 outperform on this leg and that will probably mean rotation to them, rather than the vastly larger number of much less influential cyclicals that carried the market in august. By the time this rally ends, assuming it goes as expected and S&P should be able to easily tag $4150 (NASDAQ-100 $13,000 is a bit higher), I suspect market participation/breadth will thin out and leave the rally more susceptible to a downturn, but we are not there yet. It’s just something to be aware of and keep an eye on.
We do get a lot more economic data tomorrow and then the key Payrolls report on Friday. If the inflation data comes in weaker than expected and Payrolls do as well, that should support this rally just getting under way. When/If we get a small consolidation (with a bullish bias) we can fine tune upside price targets fo the averages based on the recent bullish consolidations, which in most cases will be higher than the measured move targets like $4150 for the S&P, based on the basing patterns into October.
Overnight
S&P futures are up +0.2% tonight and taking a little breather with a very small bullish consolidation – not the type I’m talking about above which should be in the cash market.
The U.S. Dollar index is down another -0.4% which should be helpful for stocks and gold.
WTI Crude is little changed, up +0.1%.
Gold futures are up +1.85% to $1792.90, coming close to $1800.
Bitcoin futures are similar to S&P, up about +0.5%.
Even more helpful for the mega-caps, the 2-year yield is down another -5 bp tonight and the 10-year yield down almost -9 bp
Market participants will receive the following economic data Thursday:
- 8:30 a.m. ET: Weekly initial jobless claims and continuing claims
- 8:30 a.m. ET: October Personal Income, Personal Spending , PCE Price Index, core PCE Price Index
- 10:00 a.m. ET: November ISM Manufacturing Index
- 10:00 a.m. ET: October Construction Spending
- 10:30 a.m. ET: Weekly EIA Natural Gas Inventories


