FOMC Market Wrap-The Whimper Rally Fails
Once again the market underestimated Jay Powell and the Fed. Beyond being oversold, nothing about the market looked any better, not Banks, not Transports, not Credit, Crude was clearly worse this week. All of these “Hope” narratives have failed: Buybacks, earnings, elections, G-20, Trade war, seasonal bias, Santa Rally.
I don’t recall the exact wording, but Powell made some reference to how low rates were in a secular context, and that the Fed was exploring options. I read similar language in one of this year’s Fed Minutes, in which the staff was presenting different ideas to deal with the fact that the Fed is at the ELB (Effective Lower Bound) after 30 years of falling rates. In short, they can’t raise rates enough to be able to use rate cuts alone to deal with the next cyclical recession.
Last night I quoted a CNN Money article from January 2008, the Fed made an emergency rate cut of 75 basis points in one day, and cut by more than 500 basis points, that still wasn’t enough. Then they went to QE (printing money and buying assets). The Fed had more than 500 basis points to cut back then. With today’s 25 basis point they have half of that.
The dot-plot was revised down as most expected, to show a median projection for two rate hikes in 2019, versus three previously.
The S&P had been up as much as +1.5% before Powell, ending at a new low for the year, with a slight bounce into the close ending at 2506.96.
S&P 500 ⇩ 1.54 %
NASDAQ ⇩ -2.29 %
DOW JONES ⇩ -1.49 %
RUSSELL 2000 ⇩ -2.03 %
Earlier in the day the market set aside concerns related to Micron and FedEx earnings, both warning of weaker than expected demand, all eleven S&P sectors were higher.
By the close all 11 sectors closed lower
Materials ⇩ -1.34 %
Energy ⇩ -1.18 %
Financials ⇩ -1.25 %
Industrial ⇩ -1.89 %
Technology ⇩ -1.98 %
Consumer Staples ⇩ -0.97 %
Utilities ⇩ -0.16 %
Health Care ⇩ -1.31 %
Consumer Discretionary ⇩ -1.98 %
Real Estate ⇩ -0.92 %
Communications ⇩ -2.14 %
Defensive Utilities, Consumer Staples and Real Estate lost the least.
Facebook lost 7.3% after a New York Times article alleged Facebook provided technology companies more access to user data than it previously disclosed and following a Washington Post report stating the company is being sued by the Washington D.C. Attorney General over alleged privacy violations from the Cambridge Analytica scandal. Facebook is now down 38.7% from its all-time record close on July 25.
NYSE Decliners were nearly 3:1 over advancers (2102 to 779) on heavier volume of 1.3 bn shares. There was a clear dominant price/volume relationship of Close Down/Volume Up, more than 50% of components among the major averages (Dow=24, NASDAQ 100=74, S&P-500=299). With all 11 sectors in the red, that’s as clear of a 1-day oversold condition as you can ask for. Was it capitulation? My view is that it was not the kind of activity that stands out as capitulation.
Market Breadth has not improved, although percent breadth oscillators are back at the zero line.
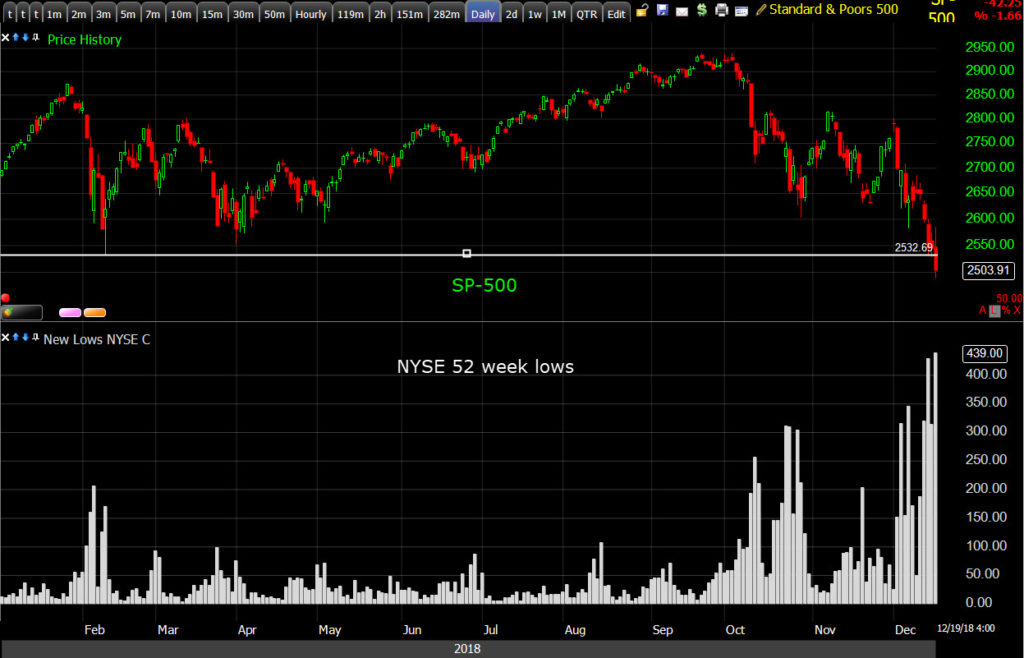
Again just view the count of 52 week lows as selling pressure. You want to see them decrease at a test of price support, but as we have seen for a while, they were well above “successful test” levels back in October.
VIX closed red on the day! Today was the VIX futures contract roll and spot VIX is still above futures, but come on! I’ve always suspected the New York Fed’s Open Markets desk has suppressed volatility on FOMC release days. In any case, the ABI was correct about price volatility, which is what it represents, VIX should tag along and it didn’t today.
Treasuries were bid from yesterday. The Fed-sensitive 2-yr yield lost two basis points to 2.64%, and the benchmark 10-yr yield lost five basis points to 2.78%. This was a little stronger rotation into bonds relative to the S&P’s losses, so we’ll want to keep an eye on yields leading lower. I’m not reading too much into it today because of the Fed and long bond positioning.
TLT soared on the upside. I wish I had gotten in on a pull back, but we’ll get a chance.
The yield curve also flattened (2-10 spread to to 14bp), but above cycle lows of 11 bp. The yield curve flattening was obvious this morning before the cash open. This is also something to keep a close eye on, it was the yield curve on December 3rd leading the market lower and the economically sensitive sectors like banks and Transports started lower with the flattening.
I finally took gains in my small cap short, but I want to be very clear that it wasn’t because I saw something that I thought was bullish, it was because IWM hit my target level I set Monday. No need to get greedy. I did leave the QQQ short in place.
I have been talking about the move lower over the last week in terms of a “Second leg lower”. Here’s an example and hopefully this will illustrate why I choose to take gains in my Small Cap short (TZA long), and leave the QQQ short (SQQQ long) in place.
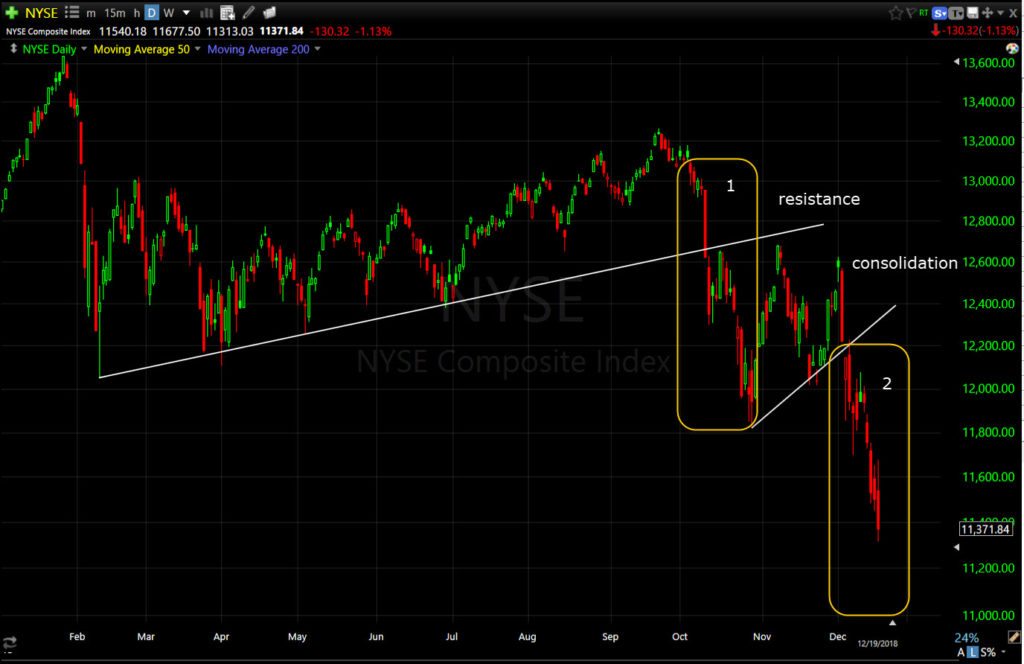
You might remember this from October, a clear uptrend broken on the first leg lower at (1), that became resistance. The 6+ weeks of consolidation failed to penetrate resistance, and/or make a higher high, which means the probabilities of a market top being put in are strong. The second leg lower is the break down from that consolidation. What’s interesting is that the first leg seemed to be more about the Fed and Powell’s “Going above neutral” comment on October 3rd. The second leg was led by sharp yield curve flattening, or lowered growth expectations.
I have also mentioned that my price targets on measured moves for averages like Russell 2000 (IWM) and S&P-500, have been on the conservative side. Above I’ve shown the NYSE’s measured move on a logarithmic scale in terms of “first leg”, “consolidation”, and an equal “second leg”, the second leg is equal to the first.
My IWM and S&P target was more conservative in simply using the measured move of the consolidation between legs, which was hit this afternoon.
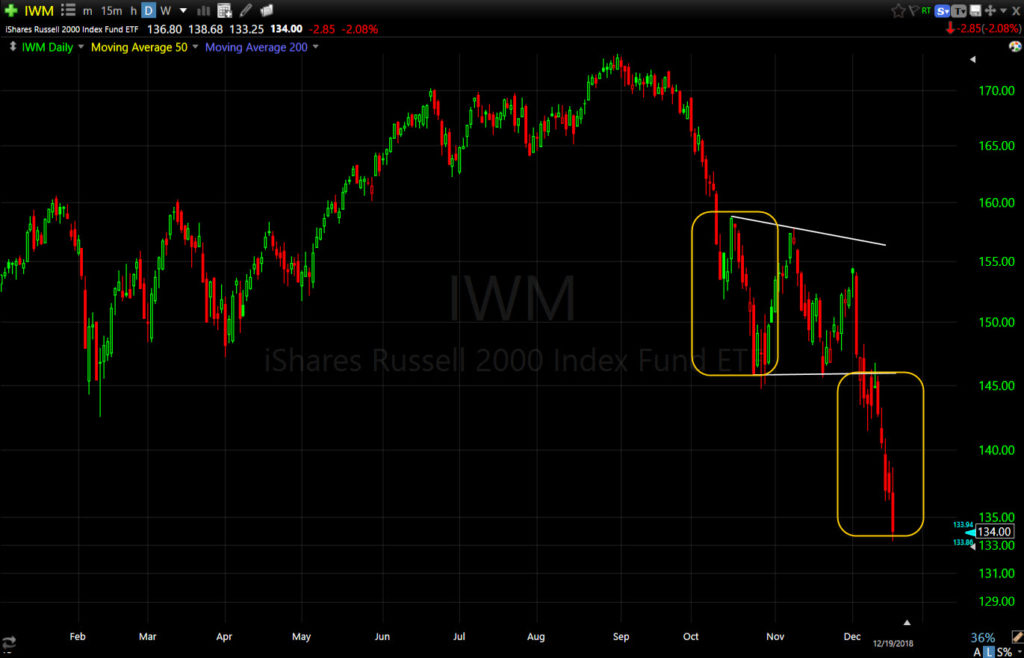
I ended up closing the trade right as IWM was at 133.50, which was the high end of the 132-134 range. The point is that my price target was the more conservative view, there could be significantly more downside, I’m definitely NOT bullish. That’s going to take some evidence and I haven’t seen it.
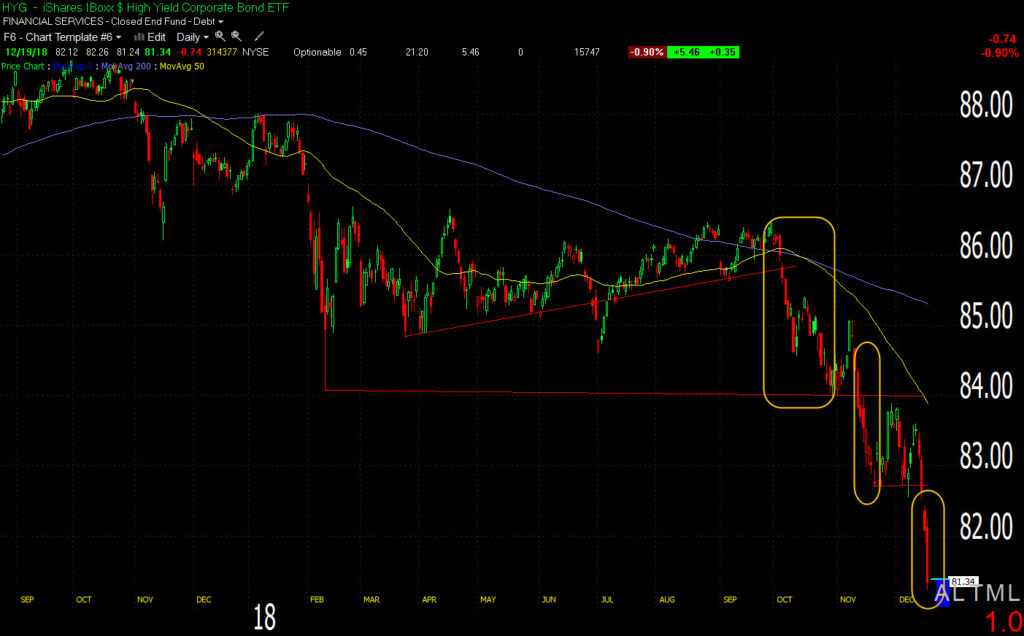
As touched on last night, HY Credit has actually had 3 legs lower. HYG hit its lowest level since April 2016 today.
Regional Banks lost 2.97% today and where one of the early warning signs that tend to lead Small Caps.
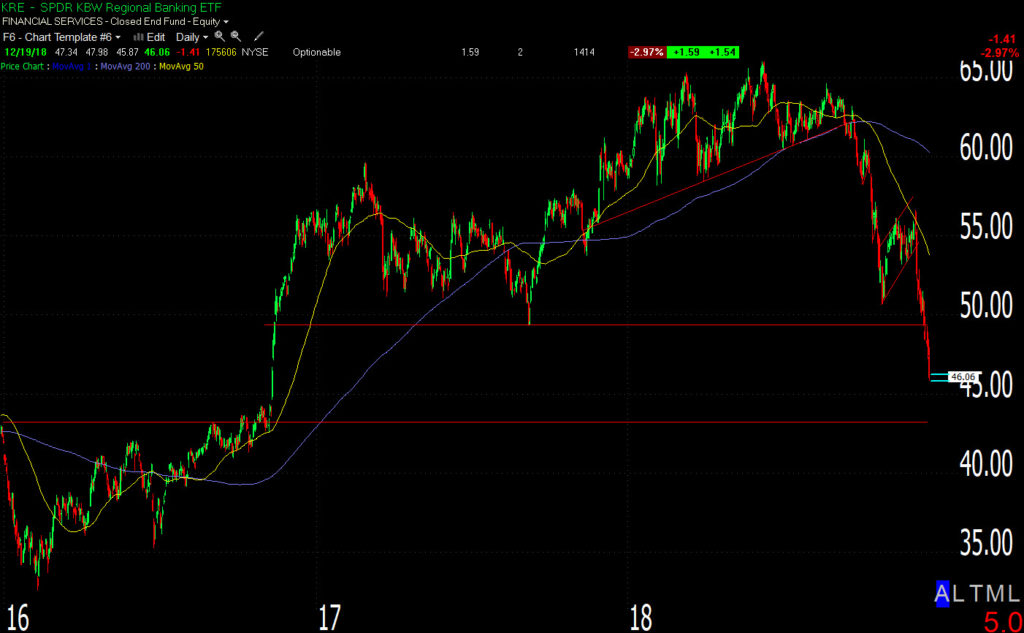
I believe KRE’s target area is close to $43, this is an equal-leg measured move.
For perspective here are some comparative or multi-factor charts normalized year-to-date with the major averages and growth sensitive sectors that tend to lead the averages (both higher and lower)…
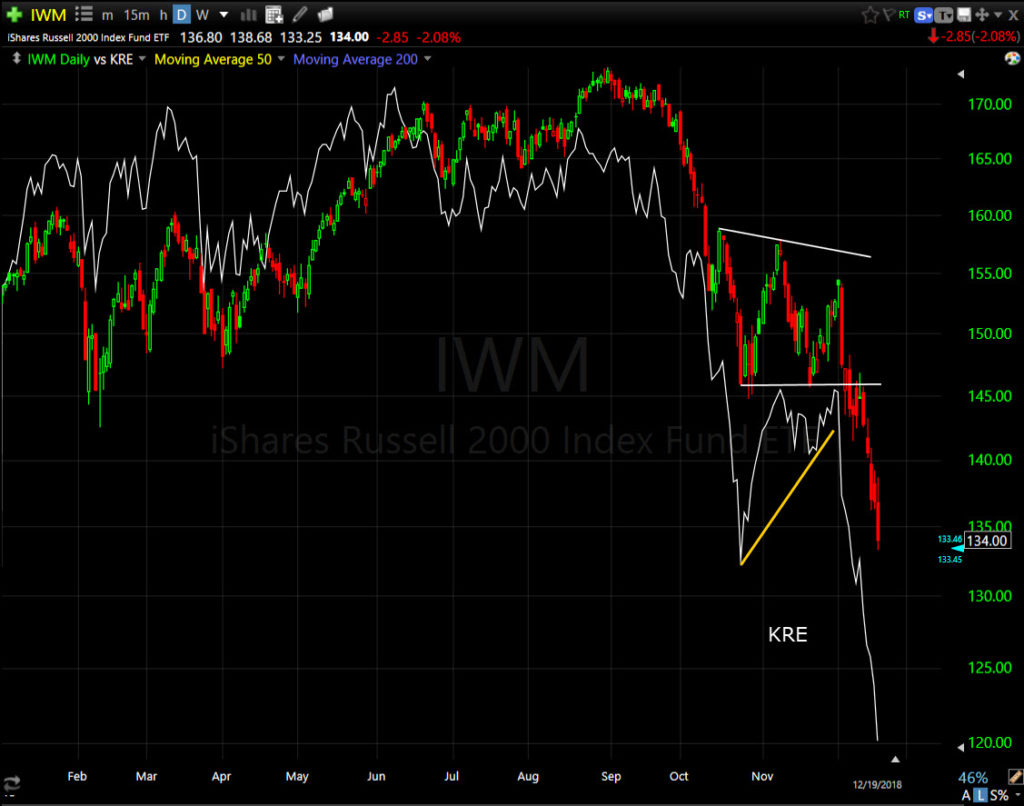
Above you can see KRE’s (Regional Banks) relative performance turning down this summer. I added a yellow trend line to define KRE’s consolidation between leg (1) and leg (2).
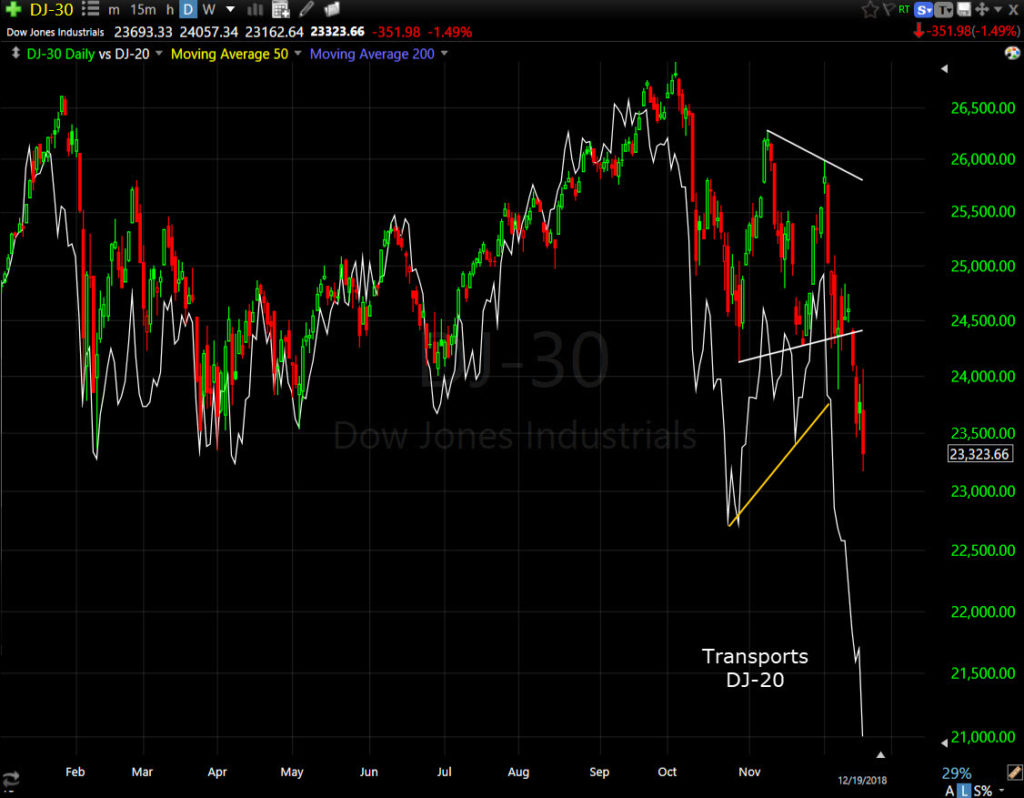
normalized YTD
The Dow’s consolidation is between the white trend lines, the bottom of the Transports’ consolidation is at the yellow trend line. Again you can see the relative weakness of Transports leading the Dow in both January and September.
In the NASDAQ’s case, I’ve been focused on Semiconductors which clearly have been struggling a good part of 2018 and are one of the growth sensitive sectors that lead the Technology heavy NASDAQ.
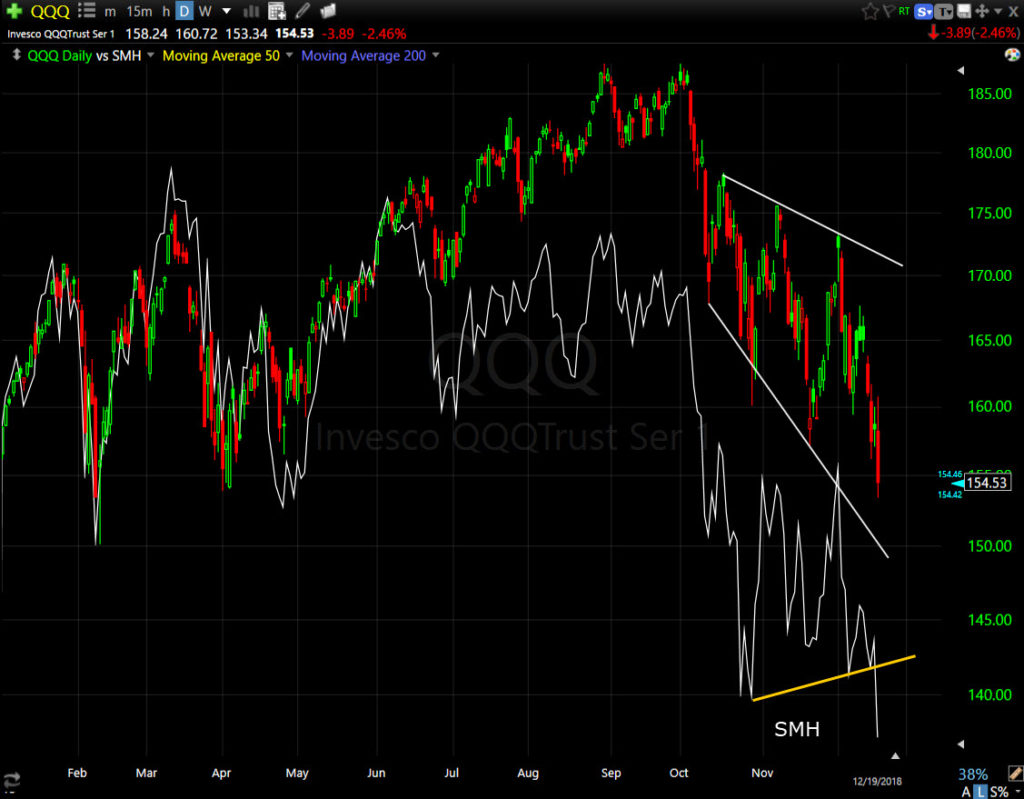
NASDAQ has been more complicated as the FANG stocks that have the most influence on NASDAQ sold off later, Apple being one of the last. So there has been this odd rotation between FANG influence, and Semiconductors. QQQ has had a much less defined consolidation, rather a large, broadening downtrend.
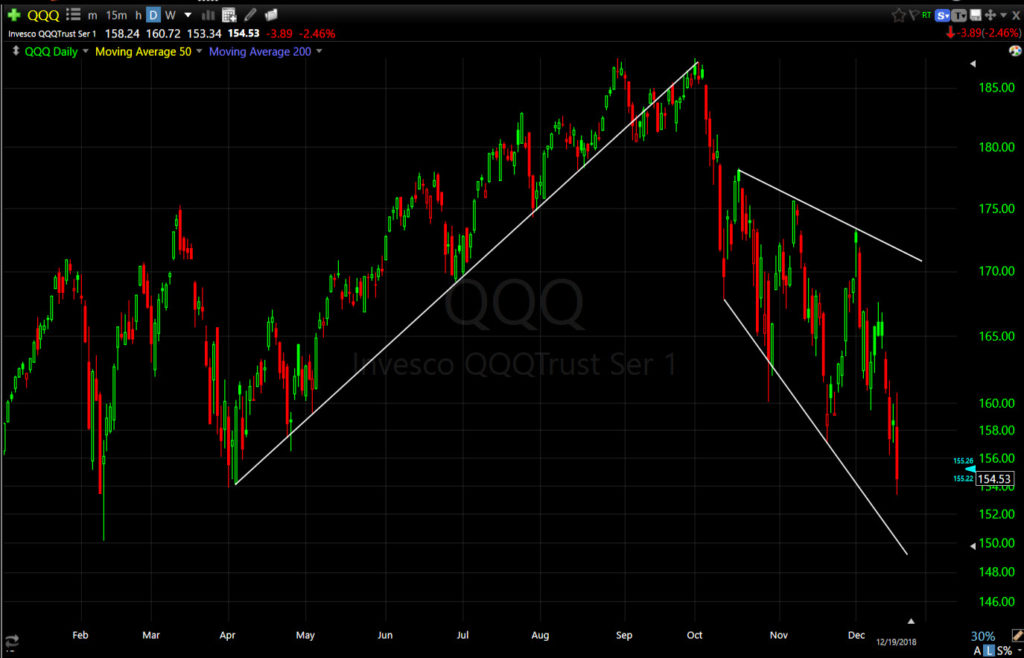
The first change in character was NASDAQ back-testing its uptrend in September. Based on the trend, my QQQ target was 151-154, however I believe Semis have a second leg lower, like Regional Banks, Transports, Credit, even Crude oil.
Semiconductors have a clearly defined first leg down and consolidation.
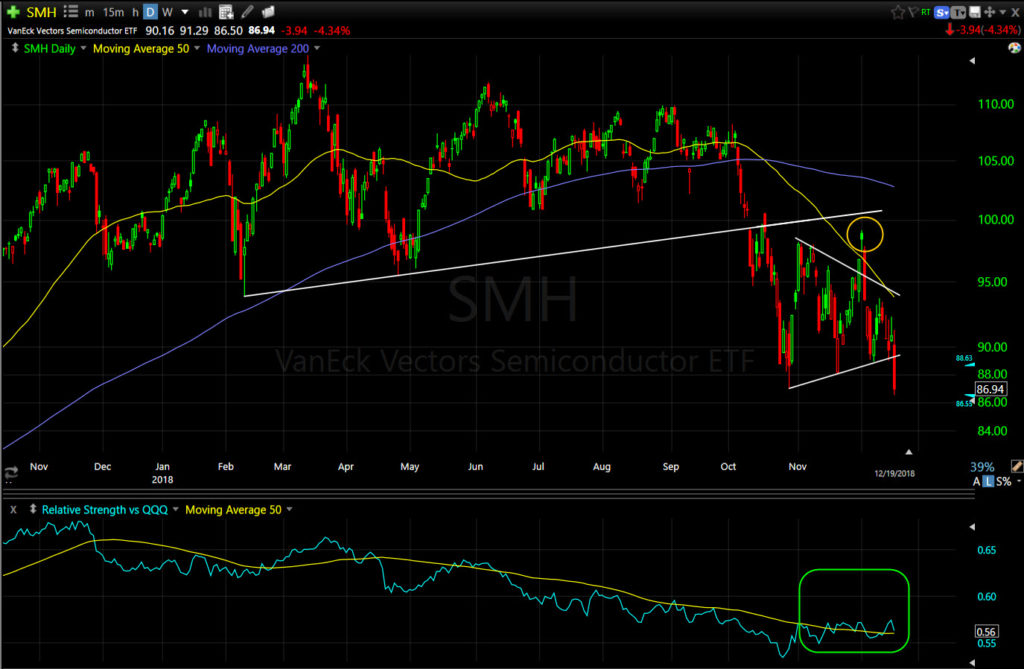
The chart of semis (SMH) shows a clear break of trend in October and a triangle consolidation. The rule of thumb for symmetrical triangles is that they are consolidation/continuation patterns. Since the preceding trend is down, the expectation is for a move lower. Note a period of brief relative strength recently in the lower window (Semi’s relative to QQQ). Also Semis were rejected at an attempted breakout just above the yellow 50-day moving average and former uptrend support, now resistance.
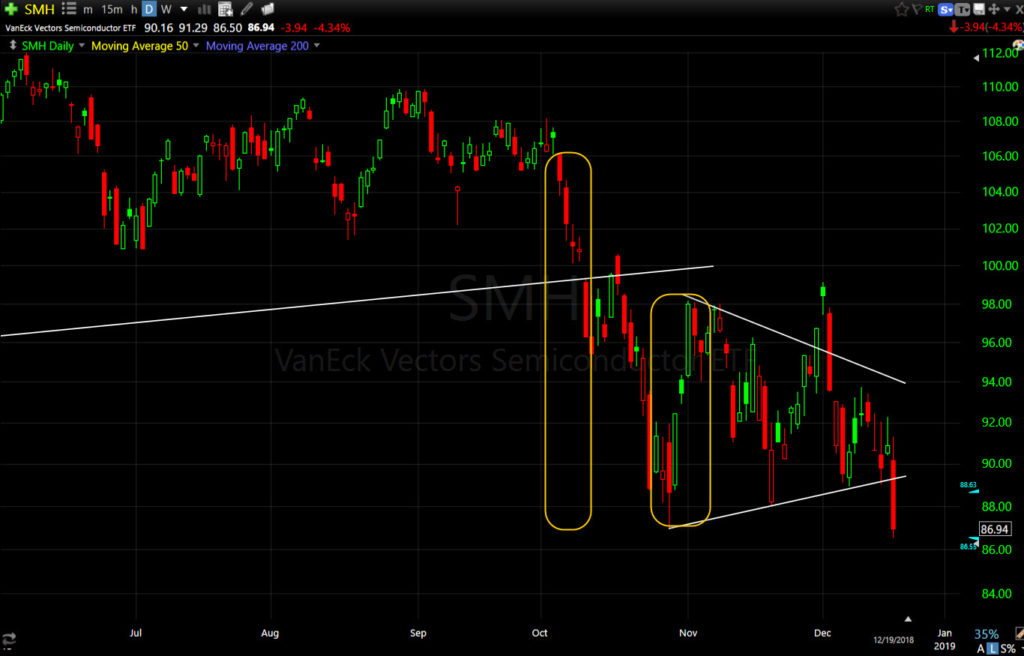
Above I have two measured moves for SMH, the first being the first leg into the triangle, the second being the height of the triangle on a logarithmic price chart. The downside measured move targets are 11 and 19 points lower from the break below the consolidation of the triangle at 89, giving targets of $78 and $70. I lean toward the more conservative target, but that’s just me. Either way, given the second legs lower in Banks, Transports, Credit, Crude, etc… I suspect Semis, and NASDAQ/QQQ have some more to go on the downside.
It may not seem like it now, but there will be a time to be long this market. I just don’t see any reason to try to catch a falling knife right now with very clear distribution, de-leveraging, forced selling, whatever the case may be. I suspect that it has a lot to do with year-end dynamics and eases up into the end of the month/year, but I do ant to see some evidence, relative strength in banks, semis, transports, etc. NOT FANGS. The last place you want to be in a slowing growth environment is growth stocks. Bonds and bond proxies out-perform (Utilities, Real Estate and Consumer Staples). However out-perform doesn’t necessarily mean gain, sometimes it means lose less.
Likewise, there will be a time to sell rallies and that’s my default bias, but we need a rally first. There are some very serious global markets like Crude, Lumber, Copper and Credit that have all been sending deflationary signals, or deflationary earthquakes. I take those seriously. Again, it just comes back to evidence.
I want to be careful not to get hyperbolic, but I have to say that some of the worst crashes in history have had very similar price action as the current market including 1929, 1937, 1987, 2000 (NASDAQ on a larger scale) and even the 2007/2008 analog I have shown in recent videos. I may cover it in a video this weekend if it’s still relevant, the point is simply, if you decide to go long this market, “Know why “, have some solid evidence.
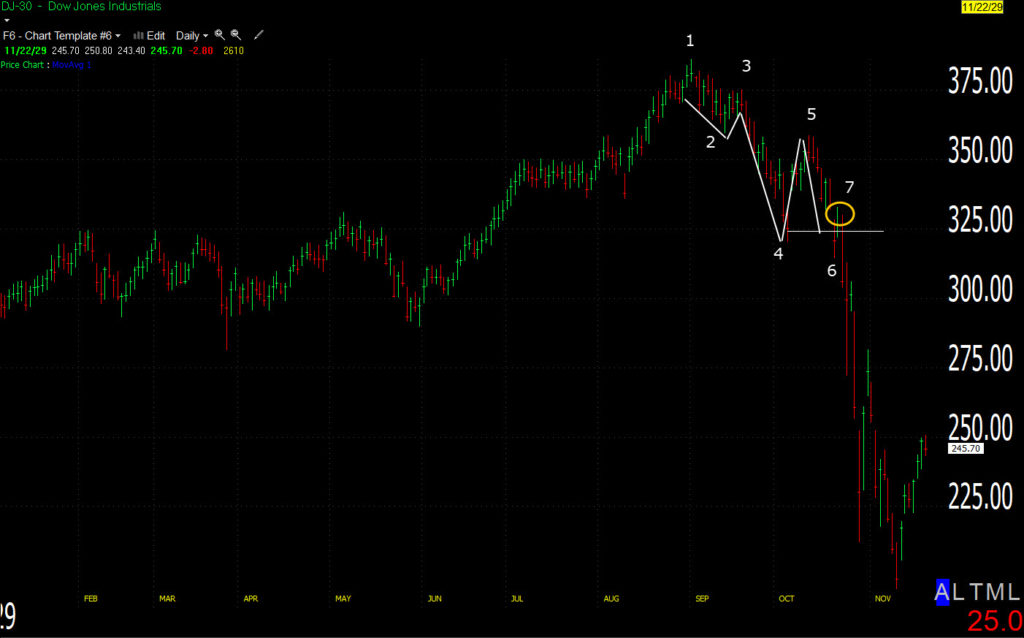
All of these are from bull market highs (1) with an initial sell-off (2), a lower high on a rebound (3), a stronger sell-off (4), another failure to make a higher high (5) and a close below the low at 4, which is (6). And then, a “whimper rally” at “7”
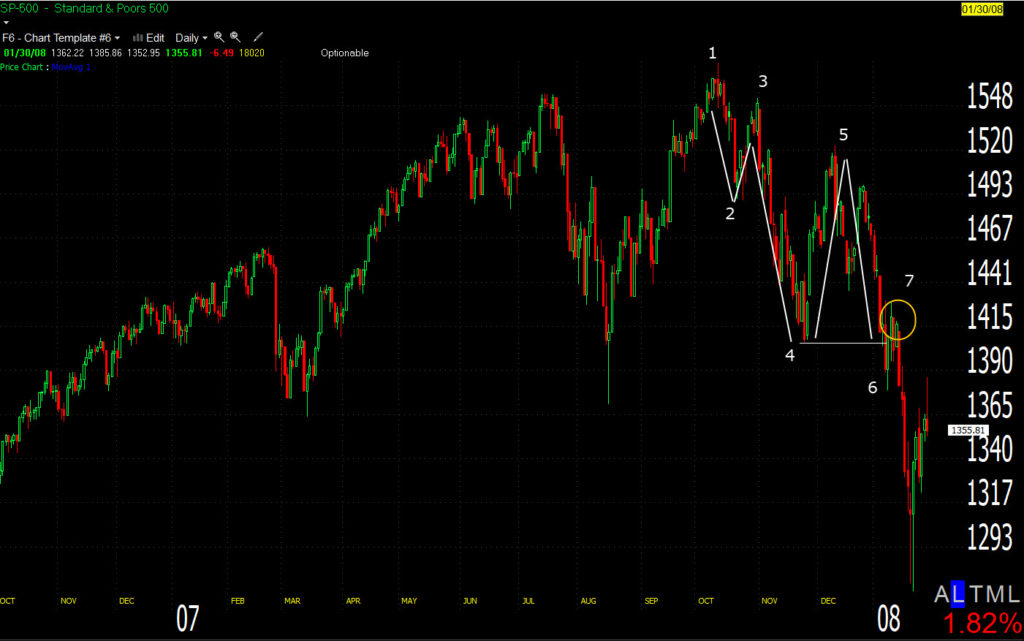
Again note the whimper rally at “7”, I covered it in this weekend’s video looking at the weekly analog.
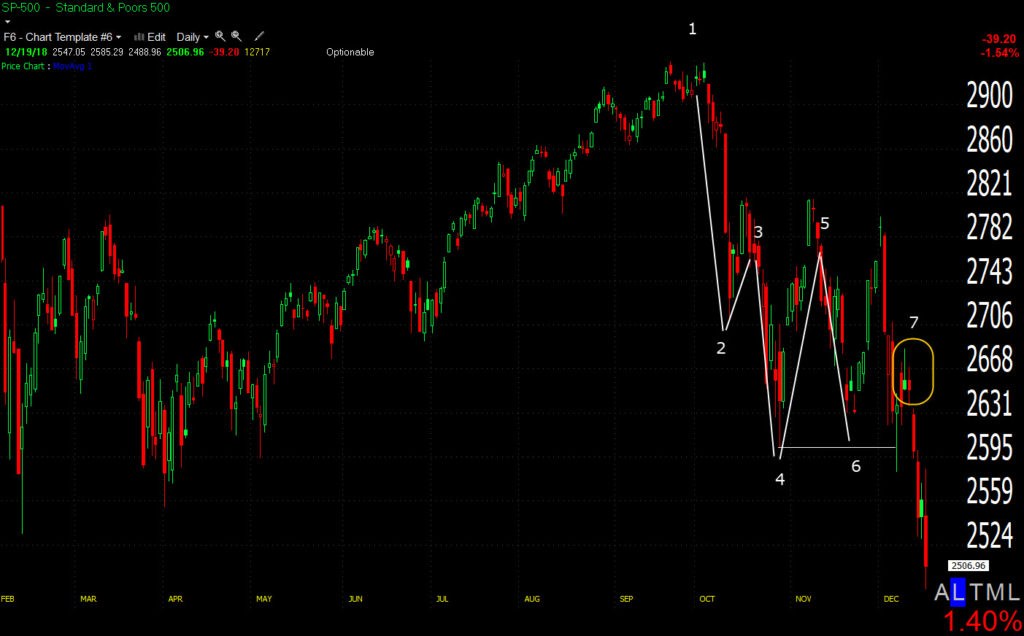
There’s only one minor difference between the S&P now and the other examples (1929, 1937, 1987, 2000, 2008) and that’s 1 days’ close at (6).
The Russell 2000 is EXACTLY the same as those prior crashes. The “Whimper rally” is a notable aspect. Again this isn’t to be dramatic, it’s just to say that this series of failed rallies and the whimper rally have led to some of the most historic crashes.
This afternoon’s sell-off was so fast, just dumping everything, it’s hard to see any changes in character, in fact it’s more of the same, heavy selling and probably 1-day oversold.
Gold got whacked on the Dollar moving up which was a hawkish reaction to Powell, more hawkish than the market expected. I still like gold, but I will have a stop at 117 on options that expire this Friday, then I’ll be looking at get back in.
S&P futures are up fractionally +0.20%, I’ll wait to see what things look like in the morning.

