Head and Shoulders Top


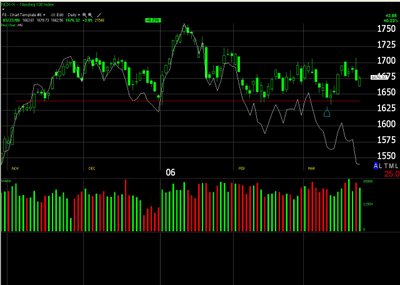
I got a question via the comments about H&S top formations and I thought I’d just briefly go over the basics. I’m going to use the NASDAQ 100 as an example, it’s not a text book example, but it is current. A head and shoulders top is one of the most reliable patterns in technical analysis, however they tend to be mistaken frequently. There are a few components that must occur to make a valid H&S top. The first component of a H&S is an advance, usually on very heavy volume that pulls back to what will become the neckline. The volume on the pullback should be much less than the advance that preceded it. This will form the left shoulder. Next, another advance on good volume that reaches a higher price than the previous advance(left shoulder) and it should be followed by another decline (retracement) on less volume to roughly the same point as the preceding decline. In other words, instead of making a higher high and a higher low, we get the first sign of trouble when the stock fails to make a higher low. This decline to the neckline forms the “head” of the pattern. Next you’ll get a 3rd advance, but this time on significantly less volume, price should fail to attain a higher high than the advance that formed the head. The decline that follows down to the neckline often will come on increasing volume. This failure to make a new high, and the subsequent decline to the neckline forms the right shoulder. Finally, when price penetrates the neckline (support) by approximately 3%, we have confirmation or a breakout. No 2 head and shoulders patterns will look alike, but they must have these basic criteria to be considered a head and shoulders and no formation is valid until it is confirmed by the downside breakout through the neck line. Typically we can get some rough idea of the expected decline from a breakout by measuring the distance from the neckline to the top of the head in price. That amount will usually be the amount of downside from the neckline. In other words, if the neckline is at $10 and the top of the head is at $12, we can expect to see a target of roughly $8. Head and shoulders tops occur in a variety of different formations including complex H&S (more than 2 shoulders and sometimes more than 1 head), they can slope up or down, they can cover a variety of time frames although they are commonly several months. Many times they are symmetrical, but this is not essential. I’d like to briefly go over a couple of ways in which traders will play a H&S setup. The most aggressive way to play it is to short the stock as the right shoulder rally reverses. This puts you in early and you can often use the top of the “head” as a stop. Should the right shoulder continue to rally and close above the head, you would be stopped out and the pattern would be voided. The next common way to play it and a bit safer is to short on the day of the breakdown through the neckline. The 3rd way to play it carries the least risk, but leaves open the possibility of missing the trade. It is to wait for the break through the neckline (confirmation of the top) and wait some more for a rally that will sometimes head back up to the neckline (now resistance) and short it there. In this scenario, a close above the neckline will function as your stop. I like this scenario the most, it has a little less profit potential, but the risk is minimal and when you find this setup, it is almost like bending over and picking up money. Remember, it is not a H&S top until it is confirmed and often people will mistake a rectangular consolidation for a H&S top only to have it breakout on the upside. I’ll continue to point out these patterns as they occur. For the moment check out MTH which is a year long top, also ORCT which is an upward slanting H&S that broke out this month to the downside (this one is actually giving us a pretty low risk short entry and has more downside to come). ORCT isn’t the best example, but I wanted to show you some different types of H&S. SWY is a complex H&S top, although it is currently either getting ready to nullify the top or become more complex. This chart is one reason why we don’t consider them valid until they break. See what would have happened had you shorted it at the original right shoulder in Dec. Also take a look at HOM from Sept to Feb. This is a more or less failed top and was recently on our watch list because of the resistance around the 6.75 area. Had that resistance held, we’d be in good shape for a play at least to the neck line and perhaps more. As it is, it broke out through that resistance and thus is no longer a short, but the premise of the trade was good. We were taking a shot that it’d be turned back at nearby resistance and the stop was of course very close =high probability/low risk, those are the kinds of trades we look for.