THINKING OUTSIDE OF THE BOX USING MACD AND WILDER’S RSI
“To make money in the market is to see what others have missed”Today the market uses technical analysis against you, it’s just to easy. Nearly a century of books, videos, seminars and other technical analysis sources have taught technician’s to use the same indicators, look at the same price patterns and to expect certain outcomes. WALL STREET KNOWS THIS! At our member’s site- Wolf on Street we see these obvious technical patterns manipulated and destroyed all day, every day. The simple fact is that Wall Street knows exactly what technicians will do when presented with a particular price pattern. They know that technicians will place limit orders or stops at support and resistance. We see it day. So I’m providing you with an indicator that no one else is using, an indicator that Wall Street doesn’t know about and won’t manipulate. The readings of the indicator are meaningless, what is meaningful are positive and negative divergences in the indicator. First you’ll need TeleChart, StockFinder or TC2000 Click on the links or tell them that Trade guild sent you and I have more indicators I can share with you. Here’s the code, for Telechart just use the custom indicator function, then just copy and paste this code and set the moving average: RSI.22 +(AVGC26-AVGC52)- (AVG(AVGC26,9)-AVG(AVGC52,9))It should look like this
Here’s how you use it. It’s very effective on intraday charts, the longer the chart, the more meaningful the divergence. A 1 minute chart will show you intraday moves, a 15 minute chart will show you swing moves, a daily chart will give you the big picture. It’s not perfect and you can shorten or lengthen the code to fit your trading style.
Here’s an example chart, just so you know I’m not cherry picking, I’ll just use today’s SPY 1 min chart. The red arrows represent negative divergences and areas where you can expect a reversal down. The white arrows are positive divergences and areas where you can expect a move up. There will be a lot as this will trace out just about every movement intraday.
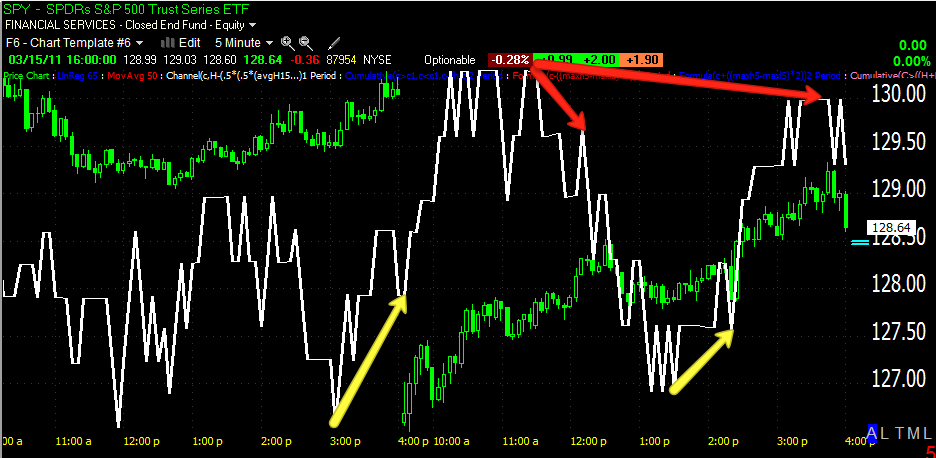
5 minute chart
You’ll notice in all 3 charts, the 1 min, 5 min and 10 min, there was a positive divergence right off the open and the SPY trended up most of the day. The first negative divergence was around 12 p.m. and prices declined a bit from there. The bigger negative divergence was at the close, when price was at the highs for the day, however the indicator didn’t make new highs, a negative divergence and we saw late day selling and the market down in after hours.
1 minute chart
Again, a positive divergence right on the open, several smaller negative divergences that created small pullbacks and the same negative divergence into the close, it’s very pronounced in the last 15 minutes as price makes intraday highs and the indicator heads lower.
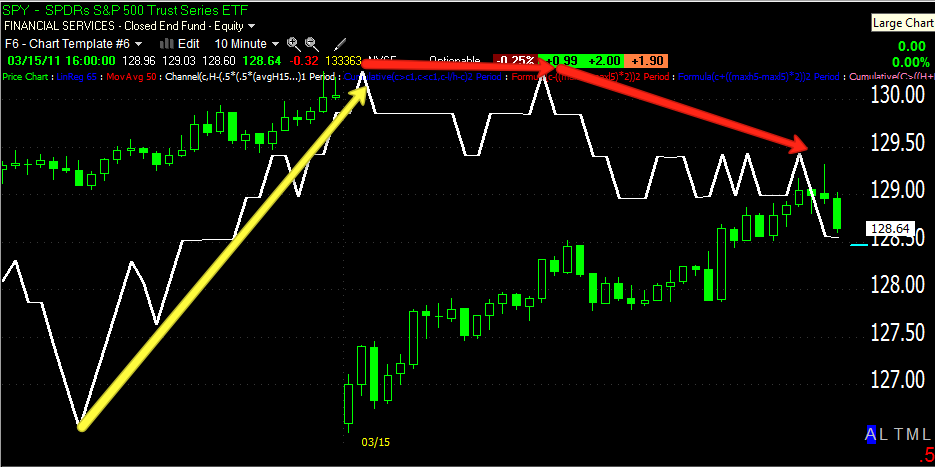
10 minute chart
Here again we see a very powerful opening positive divergence that kept prices moving up most of the day and the negative divergence into the close. Higher prices should see confirmation with the indicator making higher highs, when it fails to do so, you have a negative divergence and can expect a decline. When lower prices don’t see similar lows or you see even higher lows in the indicator, you have a positive divergence and can expect to see prices move up. It’s all about identifying the divergences and understanding that the longer the timeframe, the fewer you will have, but they will be more significant. This indicator uses a combination of longer term MACD and RSI combined.Brandt Uses Worden’s TeleChart and StockFinder 5 Exclusively