The Moving Average Crossover System- 50 day moving average vs 200 day moving averageThe Golden Cross, 50 day moving average crossing above the 200 day moving average and the Death Cross, the 50 day moving average Crossing below the 200 day moving average have long been a standard trading system within Technical Analysis, but how do they really stack up and perform?I used StockFinder to back test the strategy and came up with the following results.First I backtested the typical system using 50 and 200 day simple moving averages. I tested a single symbol, the SPY which is an ETF that mirrors the S&P-500, over a 10-year period (year to date). I used an equity line that starts with $100 (annualized returns for back testing are a deceiving gauge).
Here are the results for the SPY vs simple buy and hold.
The top window shows the results of the system and the bottom window shows the results of buy and hold over a 10-year period. The moving average crossover system went long when the 50-day crossed the 200 and went short when the 50 day crossed below the 200. The strategy produced an equity line yield of $191.41 (starting with $100) where buy and hold produced a gain of $108.77. Also note the strategy produced a fairly smooth equity line with the only significant drawdown in 2010. Some may have concerns that the SPY may not reflect the S&P-500 because it is an ETF, but looking at the 10 year to date returns of each, they were similar. The S&P-500 returned 8.7%% and the SPY returned 9.11%. Here are more results.
Surprisingly there were only 9 trades, 6 winners and 3 losers. The gain to loss ratio was 2.0. So far it sounds like a winning system. Backtesting all 500 of the S&P-500 component stocks over a 10 year period produced a very different result.
The system came in at a return of 39% at $139 whereas buy and hold produced an astounding return of $286.08, a very different result.
Here are the particulars. The gain to loss ratio was strong a 3.1x, but the overwhelming number of loosing trades dragged the system down with a winning % of only 39%. I decided to test a single symbol, AAPL. In this case, the results were dismal.
The crossover system produced an 81% gain to bring the equity line to $181.85, however buy and hold produced a return of $2850 starting from $100! The Equity line is interesting, especially the system around 2005. However, the smooth up trending equity line of a good trading system s patently absent.
Here are the system stats. The gain/loss ratio was excellent at 6.4x, but there were only 10 trades, 6 of which were losers.
Now, lets see what CAT would have yielded.
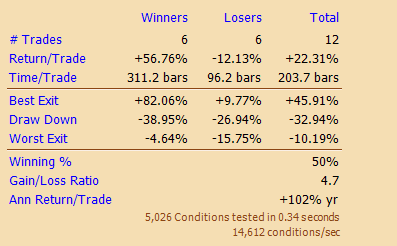
The system came in at 736.36 vs buy and hold at $405.83, a good performance.
Here are the stats. The win/loss ratio was 50%, but winners came in at a 4.7:1 ratio.
Can we improve on the system? One of the biggest drawbacks to a moving average crossover system is the whipsaws or false crossovers. If we add another component to qualify the strength or weakness of the stock at the time of the crossover, we can greatly reduce whipsaws and our winning trades are of higher quality. I added 1 simple condition to the buy/sell short crossover signal, Wilder’s RSI set to a period of 22. Lets take a look at CAT with the new addition of RSI to qualify the strength of the crossover.
Look at our system’s equity line now, $1240 vs the former at $736.36, we nearly doubled our performance!
Here are the stats. Our winning trades went from nearly 57% gains to nearly 78% gains as RSI qualified stronger signals. Our losing trades dropped from 6 to 3. We increased our winning percentage from 50% to 63% and our gain/loss ratio from 4.7 to 6.0.
Lets see what happens when we add one more qualifying indicator, Worden’s Time Segmented Volume (TSV). TSV is a money flow indicator and a darn good one at that. I chose a longer setting of 75 and applied a 50-day moving average to TSV. If the 50-day crosses above the 200 day, RSI 22 is above 50 and TSV75 is above it’s 50 day moving average, we have a long signal. Just invert all of that for a short signal, and how does CAT perform?
Now we have some real performance! The system is now returning $1,550 (starting with $100) vs buy and hold at $405.83 and vs our crossover system without RSI at $736.36 and with RSI at $1,240.
We’ve improved our winning ratio to 71% vs 63% for the former RSI system without using Time Segmented Volume. Our gain/loss ratio improved from 6.0 to 8.7 and we knocked off 1 losing trade. From where we started with the simple 50/200 day crossover system, we’ve also reduced our commissions and more importantly, our opportunity cost by getting better results with 5 less trades. Our opportunity cost was drastically reduced from sitting in 577 days of losing trades vs 236 days.
As you can see, the crossover system applied to an index of stocks like the S&P-500 shows that the famed crossover system is not as successful as many of us have been led to believe. I don’t believe a one size fits all approach as basic as the 50/200 crossover can be consistently successful, however there are a few simple modifications to the system we can add which will enhance the probabilities greatly.
RSI is a simple addition that makes a big difference. Adding
Worden’s TSV, which is available
inTeleChart, StockFinder, TC-2000 and TC-2000 Mobile can also give you that extra boost and TSV has a lot more uses then the simple application I showed you today.
I have several custom indicators that I can share with Worden members that can help you as well.
If you’re not using Worden’s powerful charting platforms, you are missing a lot. Just ask the readers of Stocks and Commodities Magazine who have voted TC-2000 the best charting software for nearly 2 decades consecutively!
Check out Worden, tell them Brandt from Trade-Guild.net sent you and then get in touch with me for some great custom indicators and scanning tools. Also be sure to download TC-2000 Mobile to your I-phone or Android mobile device. Everything you have on your TC-2000 desktop can now fit in your pocket and go with you everywhere-you can even have real time data and best of all, it’s free when you subscribe to TC-2000.