Stock Market Daily Wrap – March 3, 2021
When I was looking at index futures this morning and preparing the A.M. Update, S&P futures had gained overnight and were up +0.5% in pre-market, but there was a negative 3C divergence in the overnight session and index futures fell into the U.S. cash market.
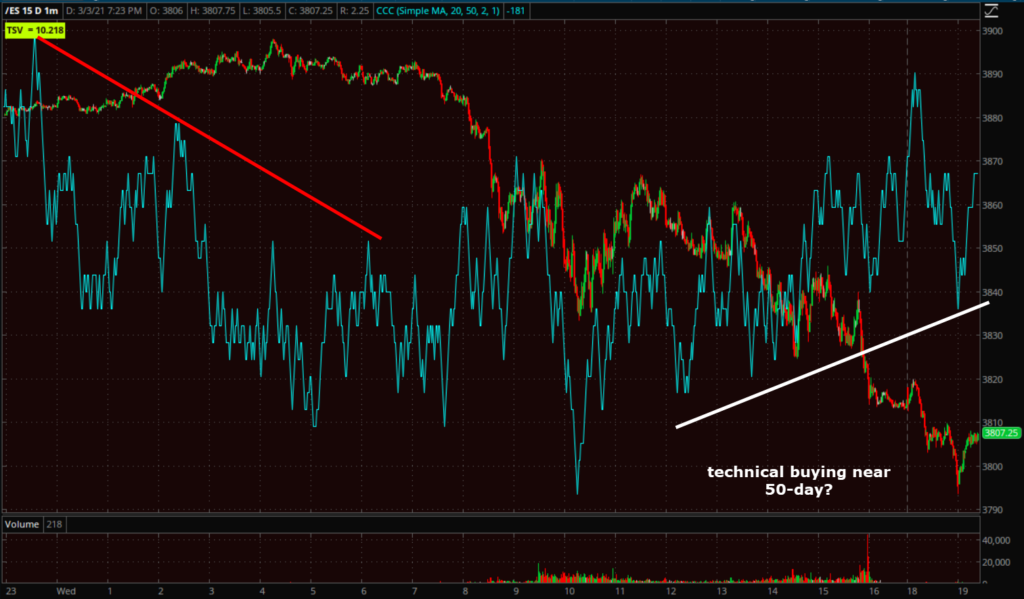 S&P futures (1m) 3C negatively diverging in the Asian session and prices fall shortly after. There was a positive divergence this afternoon as the S&P traded right down to its 50-day.
However, like the cash market, only the S&P/SPY have any hint of a positive divergence. NASDAQ/QQQ ‘s 3C chart is quite ugly.
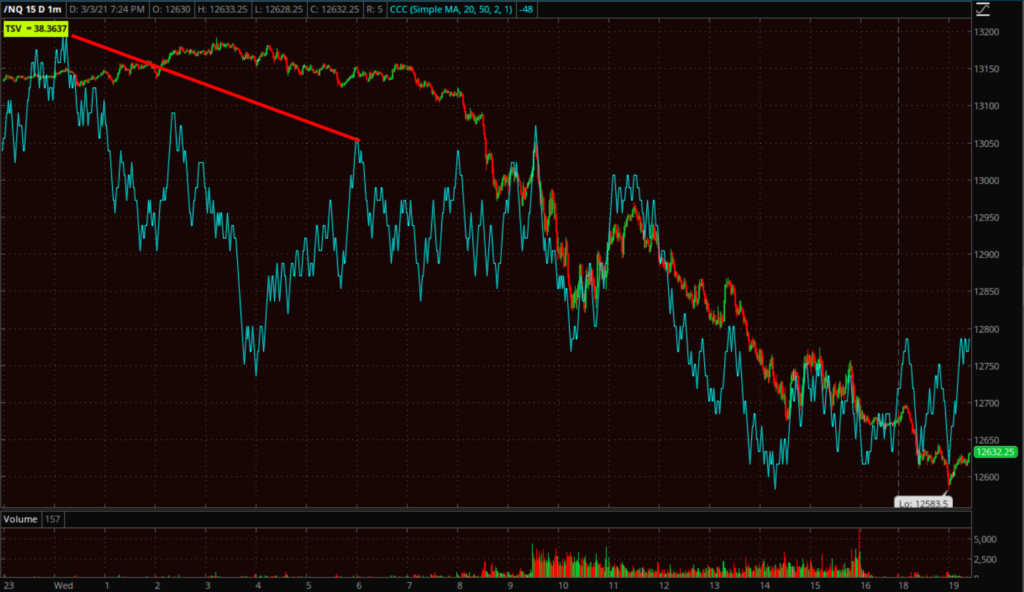 NASDAQ-100 futures (1m) also negatively diverging into overnight highs and 3C confirming to the downside in the cash session.
The change in character was evident in VIX futures as well.
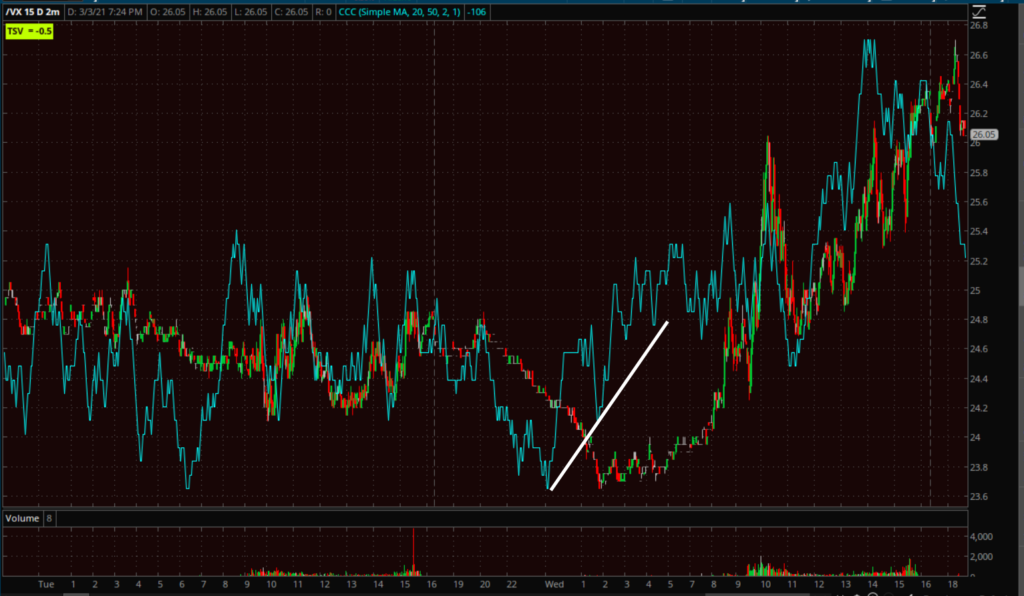 VIX futures (2m) positively diverging into overnight lows and confirming the cash session gains.
And the reason why is no great surprise after several weeks of stocks selling off due to higher yields…
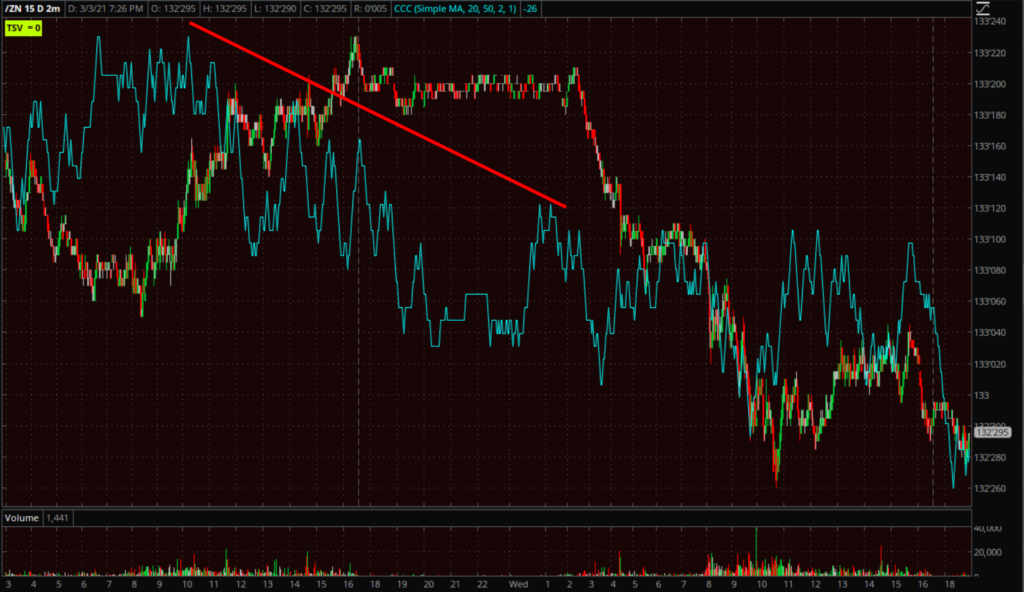 The 10-year Treasury futures (2m) show a negative 3C divergence into Asian session overnight highs and prices fell shortly after sending yields higher. The 10-year yield rose six basis points to 1.47%, although it settled below its intraday high of 1.50% and well below last week’s high of 1.61%.
Contributing to inflation concerns the February ISM Non-Manufacturing Index before the open showed the Prices Index rose to 71.8% from 64.2% in January. Later in the day the Fed’s Beige Book for economic activity in February highlighted that “several districts reported anticipating modest price increases over the next several months”, which caught the market’s attention amid inflation concerns. Chicago Fed President Evans (FOMC voter) said he doesn’t see inflation as a risk at this point.
The ADP Employment Change report came in weaker than expected ahead of Friday’s influential Payrolls report. ADP estimated 117,000 jobs were added to private-sector payrolls in February (Below consensus of +180,000) following an upwardly revised 195,000 increase (from 174,000) in January.
I mentioned earlier today that Fed chair Powell speaks tomorrow at a Wall Street Journal virtual event on Thursday at noon and there’s increasing chatter that he may unveil or allude to an Operation Twist 3 (Fed sells the short end and buys the long end), or announces a shift in asset purchases to target the 10-year yield. During the last Operation Twist (2.0) the 10-year Treasury yield fell from 3.75 percent in February 2011 to a low of 1.44% in July 2012.
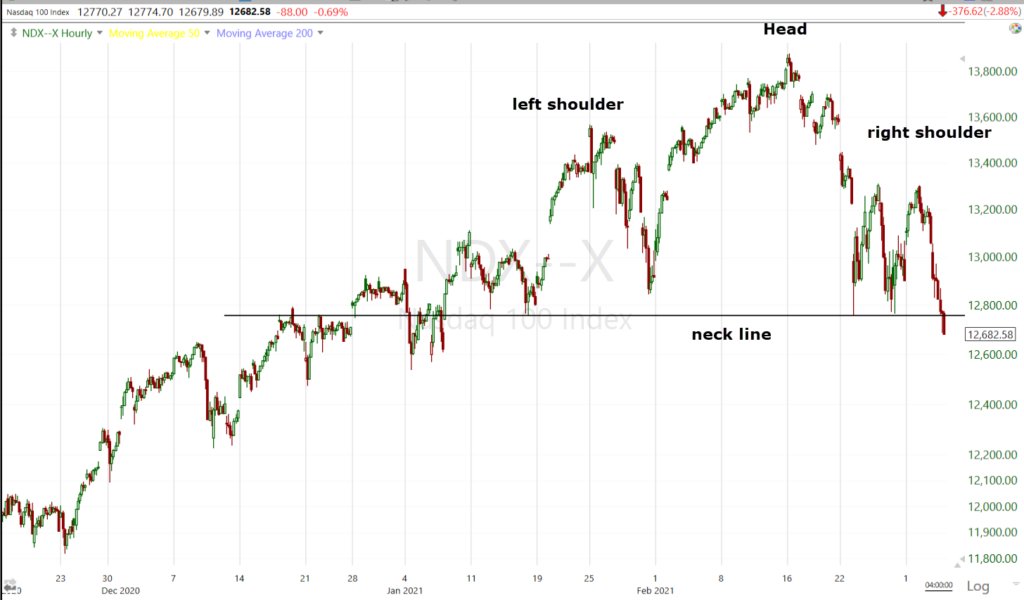
I’m always amazed at how at potentially critical junctures prices are at critical junctures themselves. For instance, there’s a Head and Shoulders top in the NASDAQ-100 with the neckline right in the area at $12,760-ish.
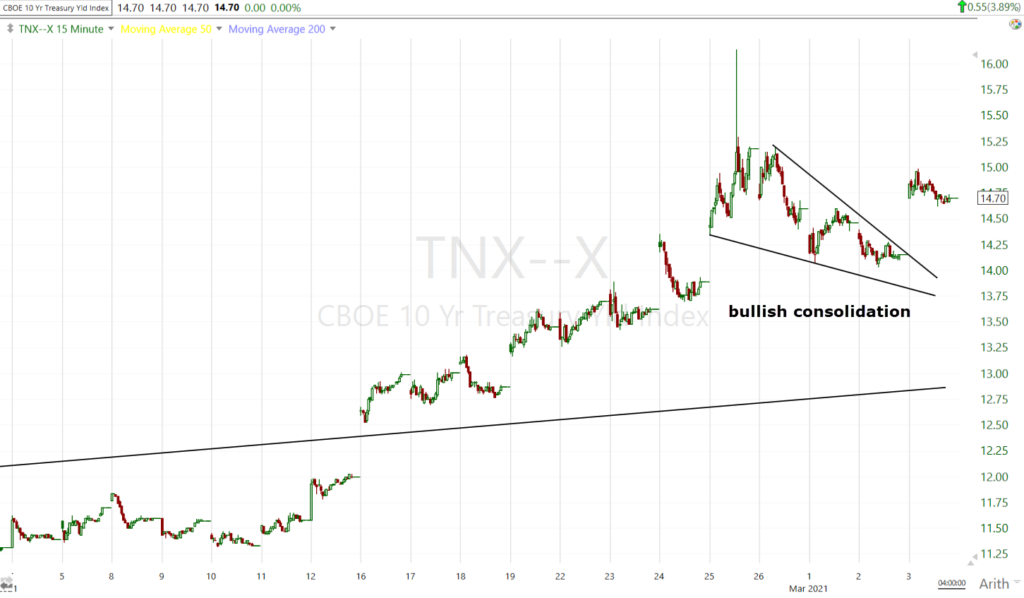
Or how after a huge spike in yields and a minor (bullish) correction the last few days, yields have broke out of that consolidation a day before Powell speaks…
10-year yield (15m)
It’s almost as if the market is threatening Powell, “Crush rates or face a tantrum”. And in my experience over 2+ decades, I’m certain the Fed has expert chart readers (although they’ll never say or admit it) and are very aware of the message the market is sending.
Averages
NASDAQ-100’s growth stocks dragged it lower and the index is now red for both the month of March and the year.
S&P 500 ⇩ -1.31 %
NASDAQ ⇩ -2.88 %
DOW JONES ⇩ -0.39 %
RUSSELL 2000 ⇩ -1.06 %
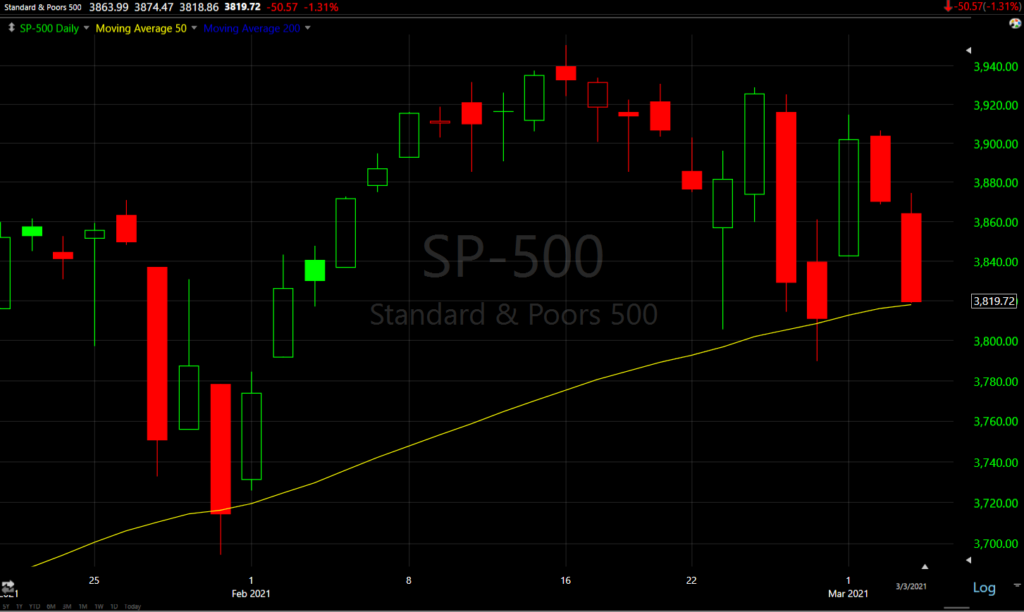 SP-500 (daily) closed right at its 50-day (3818) and at session lows. Another not so subtle threat?
Here are some other technical levels to be aware of for the S&P-500…
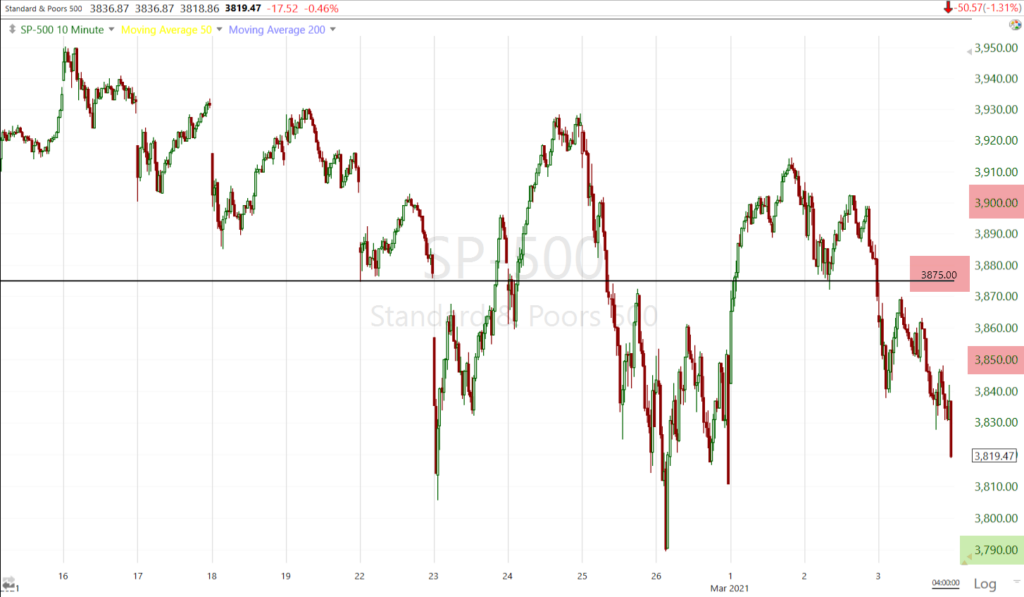 SP-500 (10m) the short term price trend (3 weeks) is down as price has made a series of lower highs and lower lows with the most recent lower high just yesterday with resistance at $3900. The $3875 area also appears to be influential and selling this afternoon accelerated below $3850 which is said to be the pivot for S&P’s gamma. I also highlighted the $3790 area (last week’s low), a move below that would lock in another lower low and the minor/short term downtrend would move to a sub-intermediate downtrend.
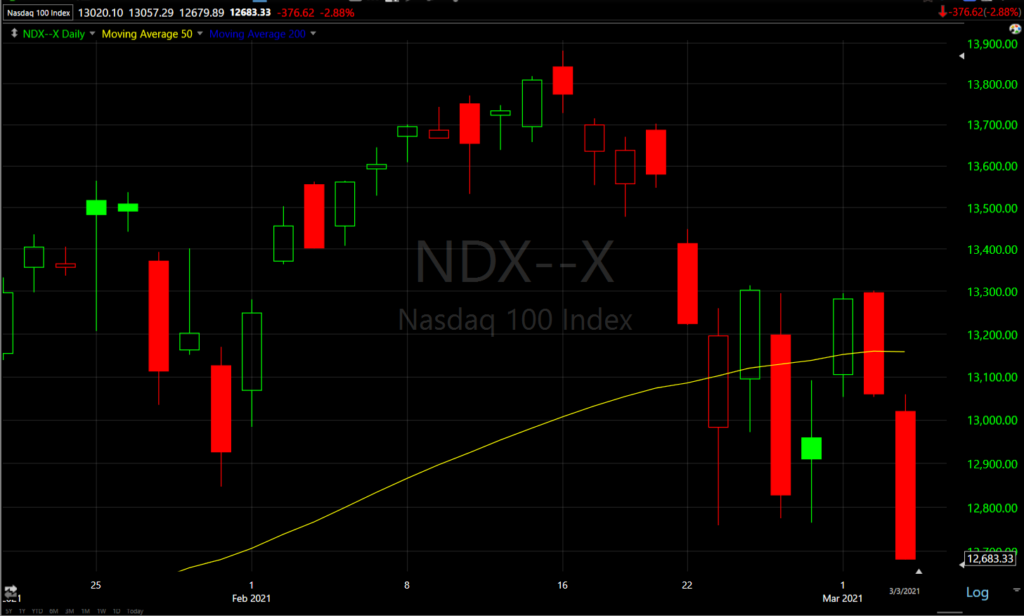 NASDAQ-100 (daily) closed well below after only 1 day above (Monday) and also at the low of the day.
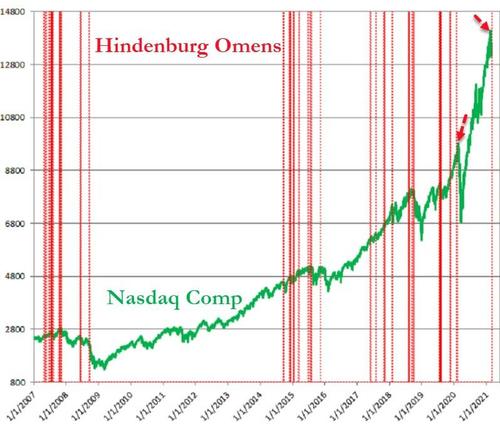
I’m not a huge fan of Hindenburg Omens as there are so many different interpretations, but it is interesting that Refinitiv notes that a more stringent construction of the indicator shows a signal appeared Tuesday in the NASDAQ. They also note that the last signal appeared 12 days before the NASDAQ Feb 19, 202 top preceding the -33% crash. It is somewhat interesting given the Absolute Breadth Index’s extreme low yesterday, a low that hasn’t been seen since January of 2020 from which VIX moved up nearly 600%.
Source: Refinitiv
Tom McClellan (McClellan Oscillator) notes that the NYSE (the broadest index) came close to posting its own Hindenburg Omen (needed 91 new highs to trigger and posted 89).
SPY has the only positive divergence and I suspect that is the result of some technical buying as the S&P nears its 50-day from which it has bounced at the end of January and February.
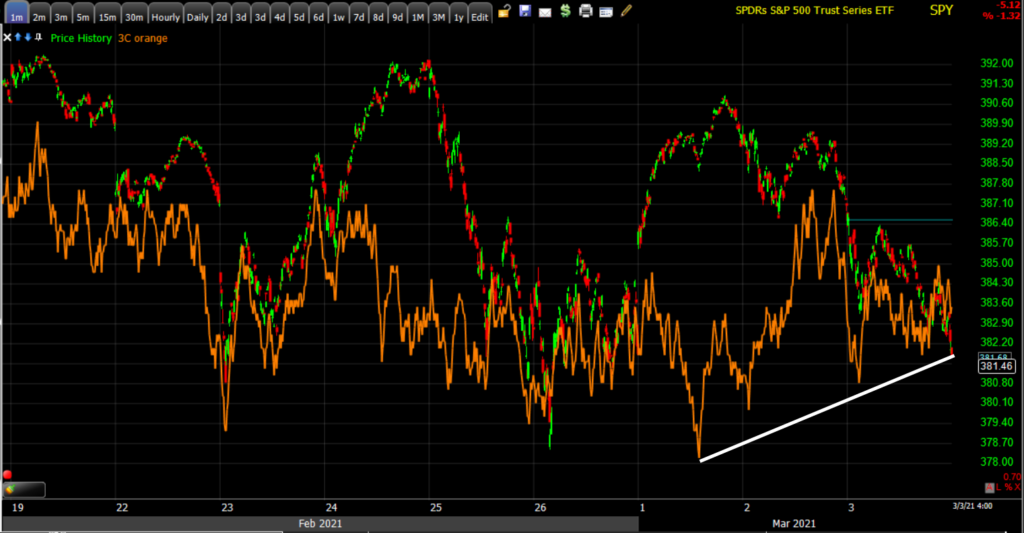 SPY (1m) positive divergence. However, I look for confirmation among the other averages and volatility and I’m not seeing that, which is why I suspect this is the result of some technical factors.
QQQ’s 3C chart looks bad…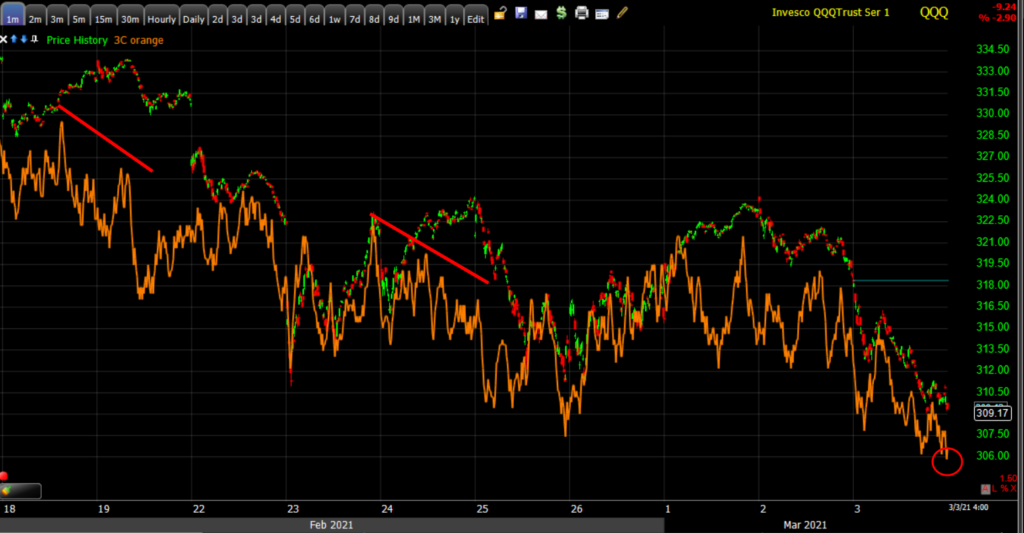 QQQ (1m) 3C was leading lower this afternoon and price followed.
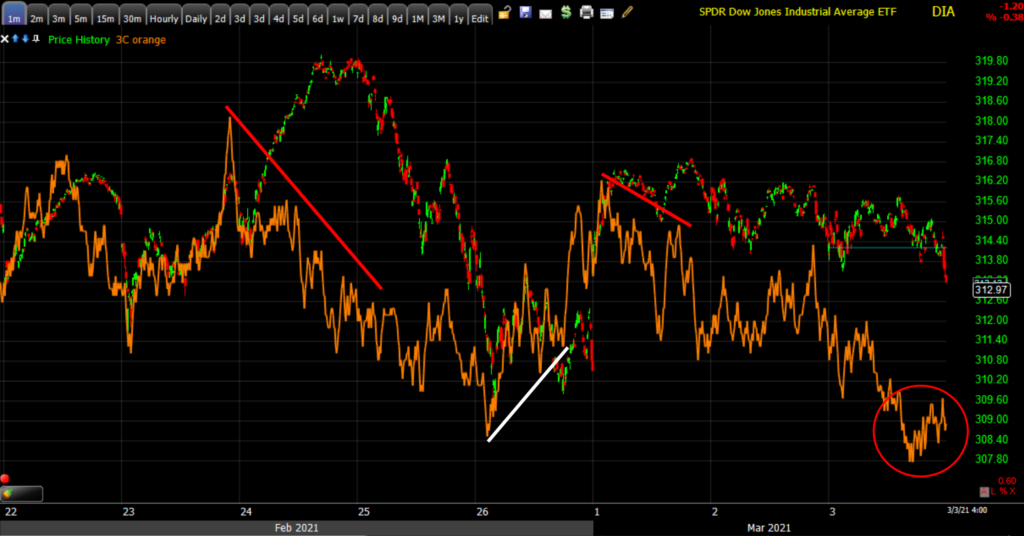 DIA (1m) is also negatively divergent and leading lower.
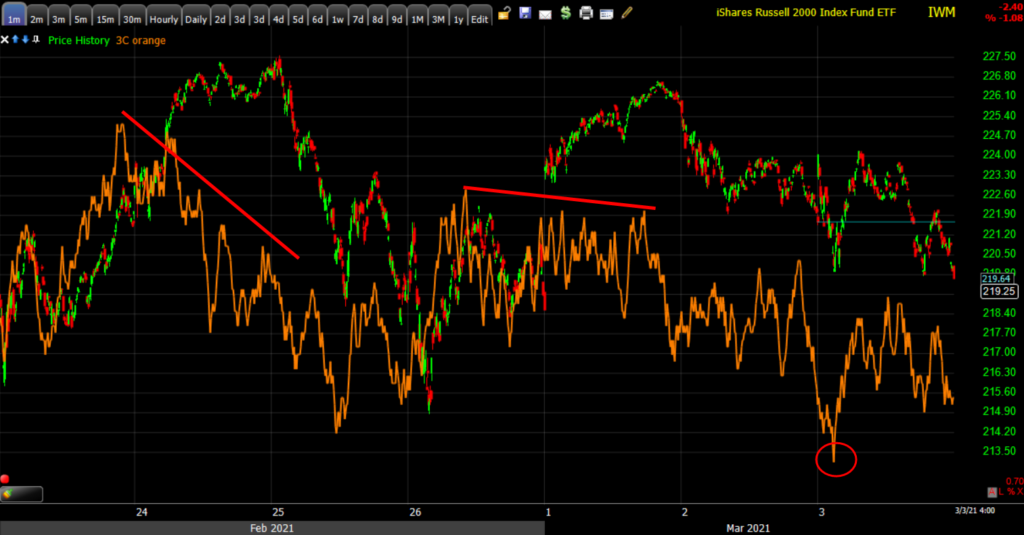 And while not as extreme, IWM (1m) is negatively divergent as well.
S&P sectors
Cyclical sectors Energy, Financials and Industrials outperformed. Banks outperformed (KBW Bank Index +1%) amid higher yields and curve steepening. Growth/mega-caps stocks were among the weakest amid higher yields and valuation concerns leading to NASDAQ’s weakness. The meg-cap heavy Technology, Consumer Discretionary and Communications sectors were the worst. Remember what happened a week or so ago when yields’ rate of change rose sharply – everything was sold including cyclicals as it shocks the market and valuations.
Materials ⇩ -0.99 %
Energy ⇧ 1.47 %
Financials ⇧ 0.78 %
Industrial ⇧ 0.11 %
Technology ⇩ -2.52 %
Consumer Staples ⇩ -0.47 %
Utilities ⇩ -1.18 %
Health Care ⇩ -1.27 %
Consumer Discretionary ⇩ -2.35 %
Real Estate ⇩ -1.24 %
Communications ⇩ -1.44 %
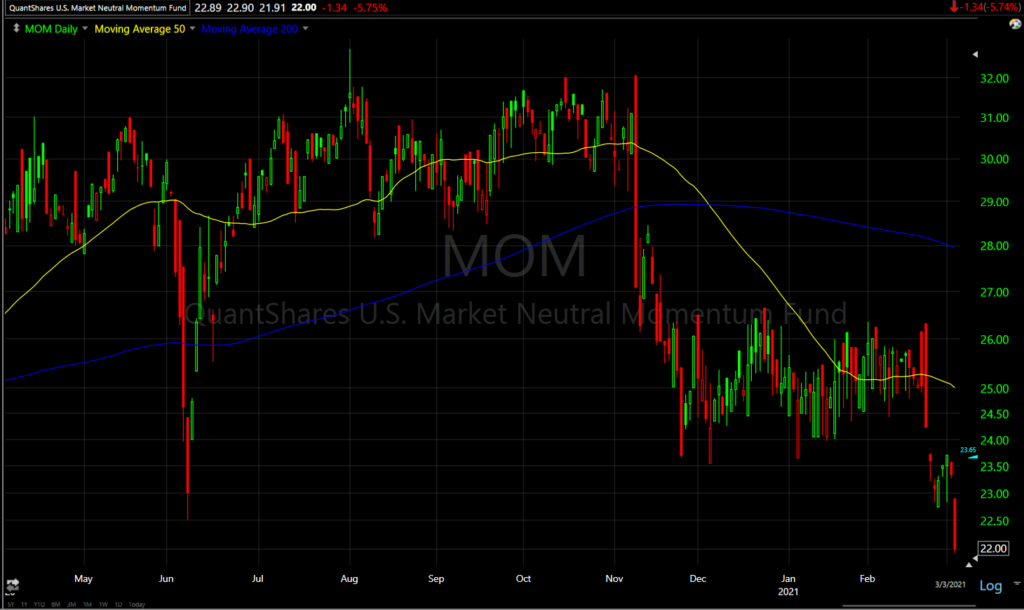
Russell 2000 Value (+0.5%) well outperformed Russell 2000 Growth (-2.6%) as cyclical sectors outperformed. The Momentum style factor that has been so popular for over a decade and that many mega-cap Tech stocks belong to was sold hard today, down -5.75%.
Momentum (daily) sold hard and there’s no doubt as to why. Record high stock valuations in these stocks that have been so popular for more than a decade were deemed “justified” by market participants due to low yields/rates. Rising yields are now threatening that perception.
As such, the heavily weighted and influential mega-cap Tech stocks suffered and continue to lead the S&P lower amid higher yields and concerns about historic valuations…
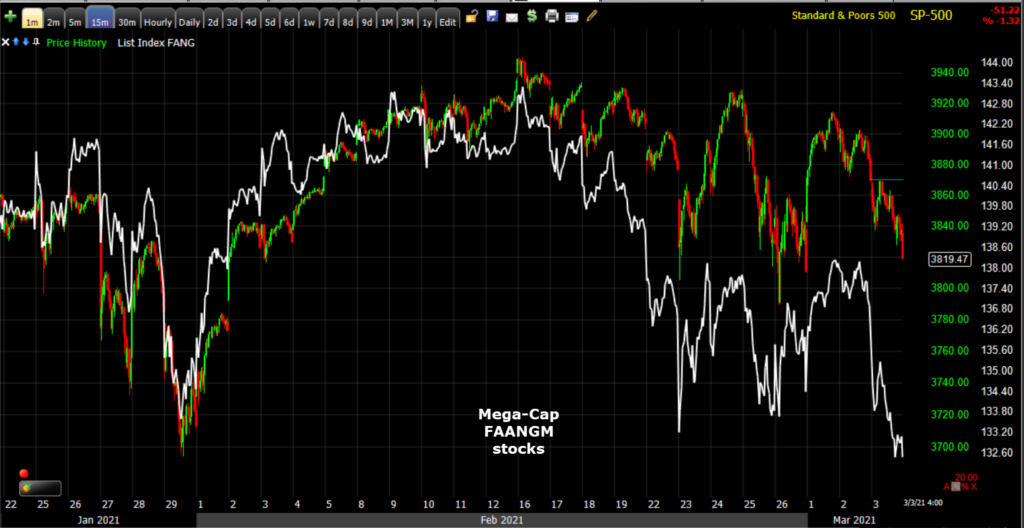 SP-500 (15m) and an equal weighted index of market darlings: FB, AMZN, AAPL, NFLX, GOOG and MSFT. Note the mega-cap index has made a new lower low relative to the end of February. Today was the second biggest drop for mega-cap FANG stocks since the Presidential election.
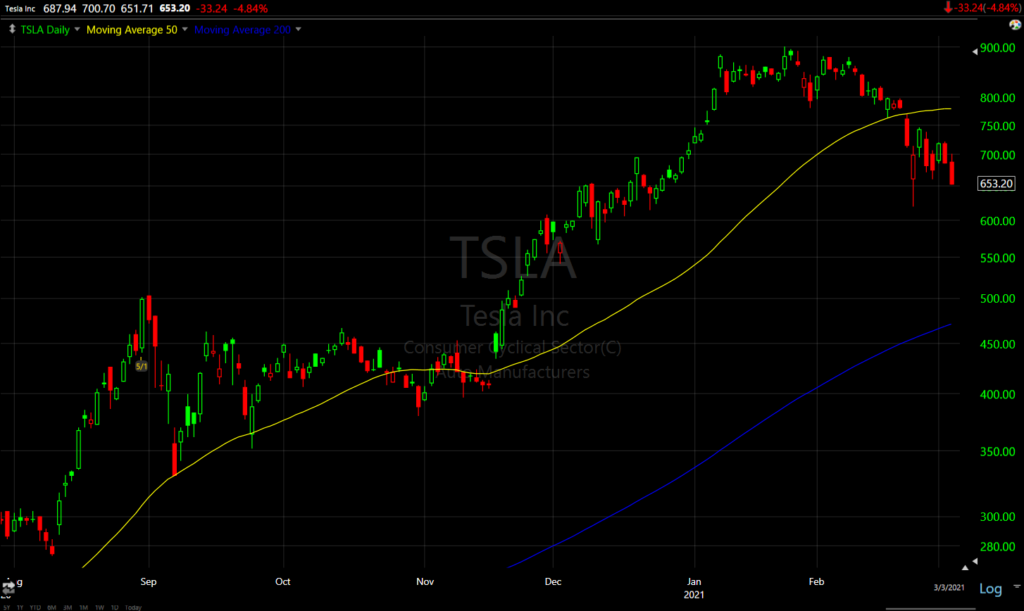
Tesla (TSLA) tends to be a decent proxy for risk sentiment and was down sharply (-4.84%) for its lowest close in nearly 10 weeks (and below its 50-day).
TSLA (daily)
Internals
NYSE Advancers (1524) and Decliners (1683) were fairly close highlighting the influence of the heavily weighted mega-cap Tech stocks’ weakness again today. Volume was a little heavier on today’s selling (NYSE 1.2 bln shares).
The price/volume relationship leaned toward a dominant reading of Close Down/Volume Up, which is often seen at market lows or short term capitulation (1-day oversold), however it was not extremely dominant across the board.
Eight of 11 sectors down leans toward a 1-day oversold condition, as does the price/volume relationship, but decliners need to be at least 2-to-1 over advancers and that was not the case today so there is no 1-day oversold condition from internals.
The Absolute Breadth Index closed a little higher at 16, but the signal for a probable increase in volatility over the next month was locked in with the sub-14 print this week.
Treasuries
The 10-year yield gained six basis points to 1.47 and the Fed sensitive 2-year yield increased two basis points to 0.14%.
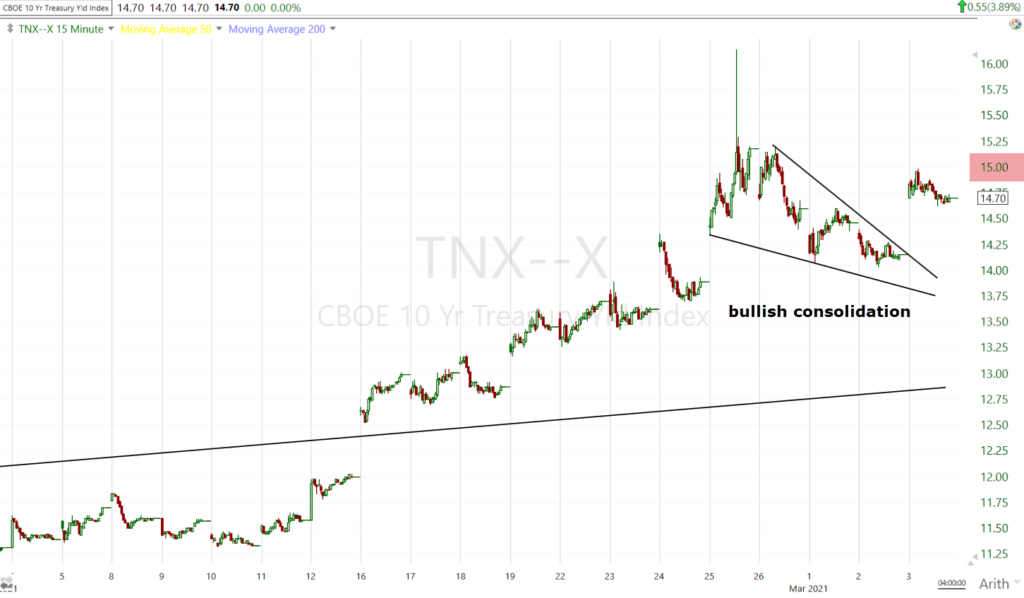 The 10-year yield (15m) broke out of the 3-day correction/consolidation and ended just below the key 1.5% level (S&P dividend yield) where selling in stocks accelerated last week. Another not so subtle message to Powell and the Fed?
Credit as a whole does not look as bad as it has recently in leading the S&P lower, but that could change very quickly should yields resume their advance.
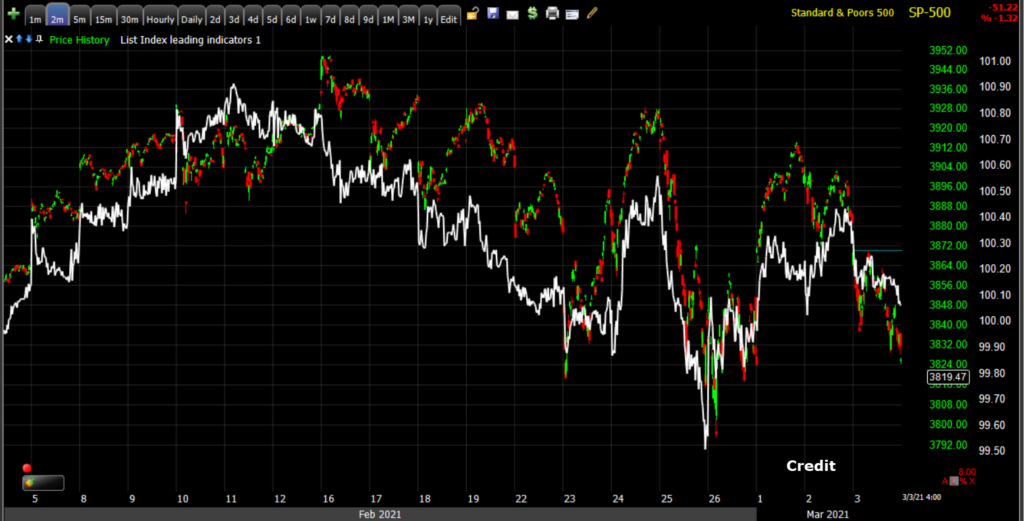 SP-500 (2m) and an index of credit assets including HY and IG credit.
Currencies and Commodities
The U.S. Dollar Index increased 0.2% to 90.96.
WTI Crude oil closed higher by +2.5% to $61.31, but as noted in the last week WTI crude is now confronting a decade-plus downtrend.
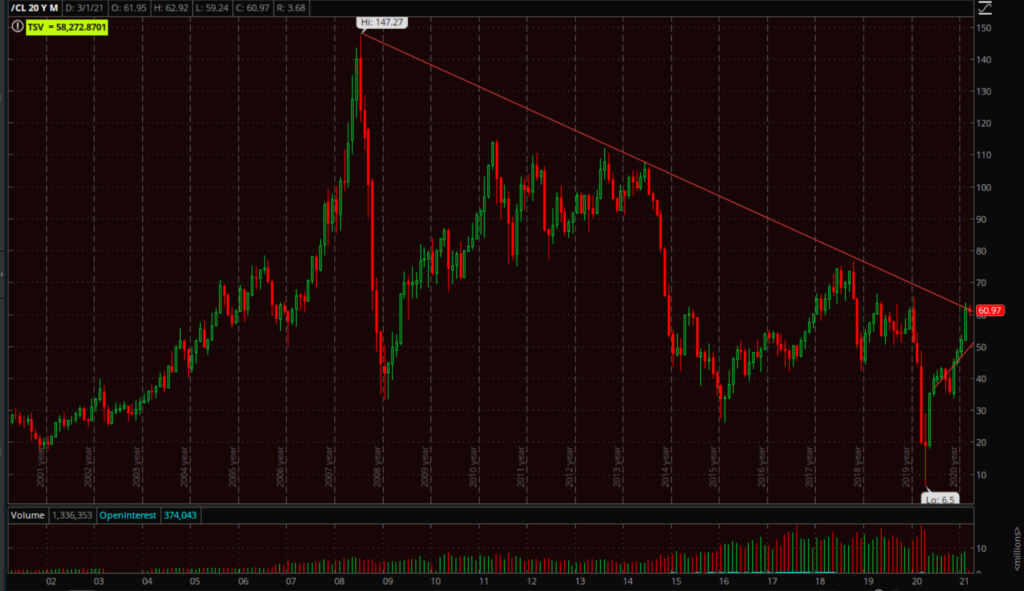 WTI crude oil (monthly) trading at a 13 year down trend line.
Here’s a closer look…
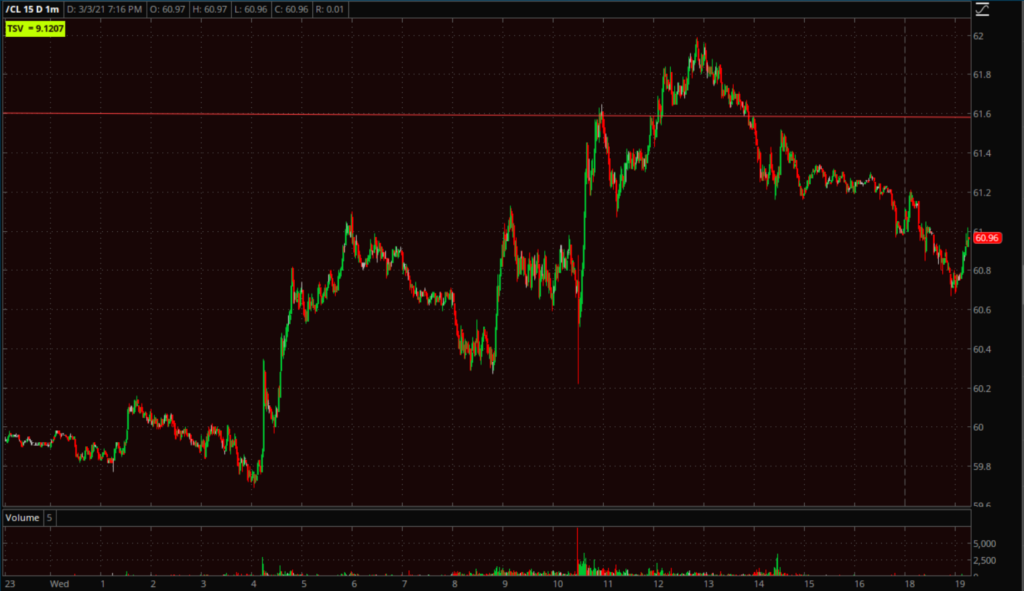 WTI crude oil (1m today)
Gold futures closed -1.0% lower to $1,715.80/oz, and traded under $1700 for the first time since April 2020
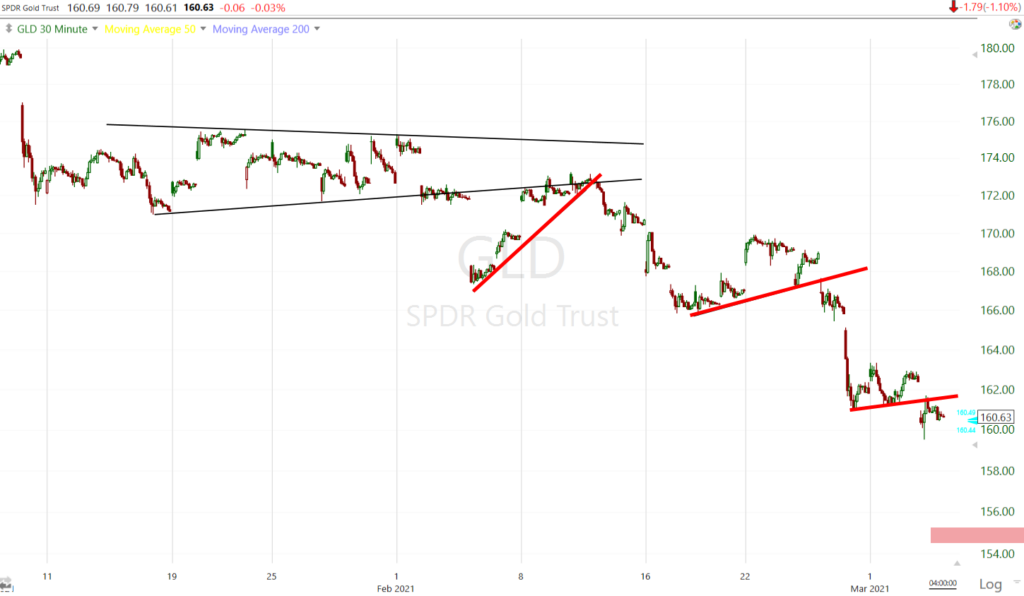 GLD’s (30m) price action continues to be intermediate term bearish. Price action (bearish flags) implies there could be another -3.5% of immediate downsie (GLD $155 area). Rising yields/real yields are a major headwind for gold as it has had an inverse relationship with real yields (nominal yields less inflation).
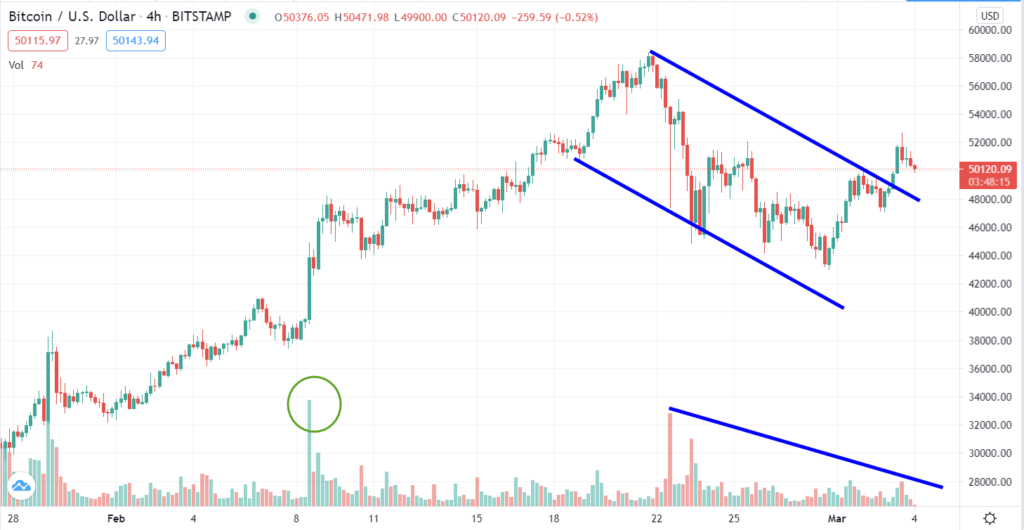
Bitcoin moved back above $50k today in what appears to be a breakout from its recent consolidation/correction, but volume hasn’t confirmed a breakout yet.
BTC/USD (4-hour)
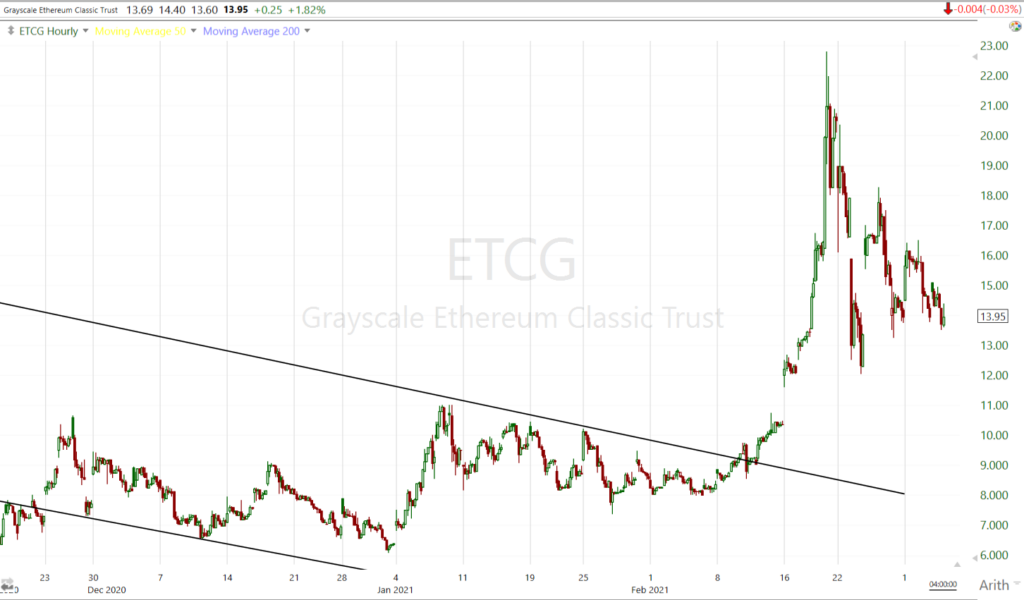
GBTC gained +4.6% and the Ethereum ETF (ETCG) closed about unchanged.
ETCG (60m) correcting/consolidating in a well formed and tightening symmetrical triangle (bullish).
Summary
Volatility tends to come under selling pressure ahead of Fed events and Powell will be speaking tomorrow at noon as part of a virtual event hosted by the Wall Street Journal. As mentioned earlier and above, there’s increasing chatter that Powell and the Fed may make some changes to deal with rising yields at the belly and long end, which could come in the form of adjusting asset purchases to target the 10-year yield, or an Operation Twist style program (selling the short end as yields there are close to negative) and buying the long end to put downward pressure on rising yields at the long end. Of course I have no idea what Powell may say or do, but I did note last week that the near parabolic spike in yields (10-year above 1.,61%) seemed like the market demanding the Fed do something about rising rates/inflation expectations. However, Powell and just about every Fed speaker including Chicago Fed President Evans (FOMC voter) today, have been downplaying inflation concerns, but clearly central banks can’t afford higher rates with global debt so high. I’d think at some point they may be forced to act. Market chatter is that this could happen tomorrow, but conversely if it doesn’t, the market’s reaction could be very ugly.
In any case, tomorrow we’ll know more and volatility may be under some downside pressure which may present an opportunity to start buying long volatility exposure which I intend to do due to the extreme low ABI reading with an expectation of a move up in VIX over the next month.
More broadly the NASDAQ, which is market’s current focus of inflation concerns, has a Head and Shoulder’s top in place. As highlighted last night, it appears Emerging Markets (EEM) may be forming one too with a neckline around $53.50. For now the cyclical stocks that have exposure to the economy are faring well, but if Powell disappoints and the bond market throws another tantrum, even the cyclicals could be sold again if yields start rising rapidly. It sure seems like the market has issued the threat with the way the NASDAQ and yields traded today.
Overnight
S&P futures are down -0.25% with a positive 3C divergence which is likely the result of technical traders doing some buying near the S&P’s 50-day sma. NASDAQ-100 futures display relative weakness (-0.5%) and 3C is in line to the downside – no positive divergence. VIX futures are unchanged as the VIX index displayed some modest relative weakness this afternoon, but 3C is in line and confirming the afternoon advance in VIX futures.
The U.S. Dollar Index is modestly higher (+0.15%).
WTI Crude futures are little changed (-0.1%) at $61.20 trading just below the decade-plus downtrend around $61.60.
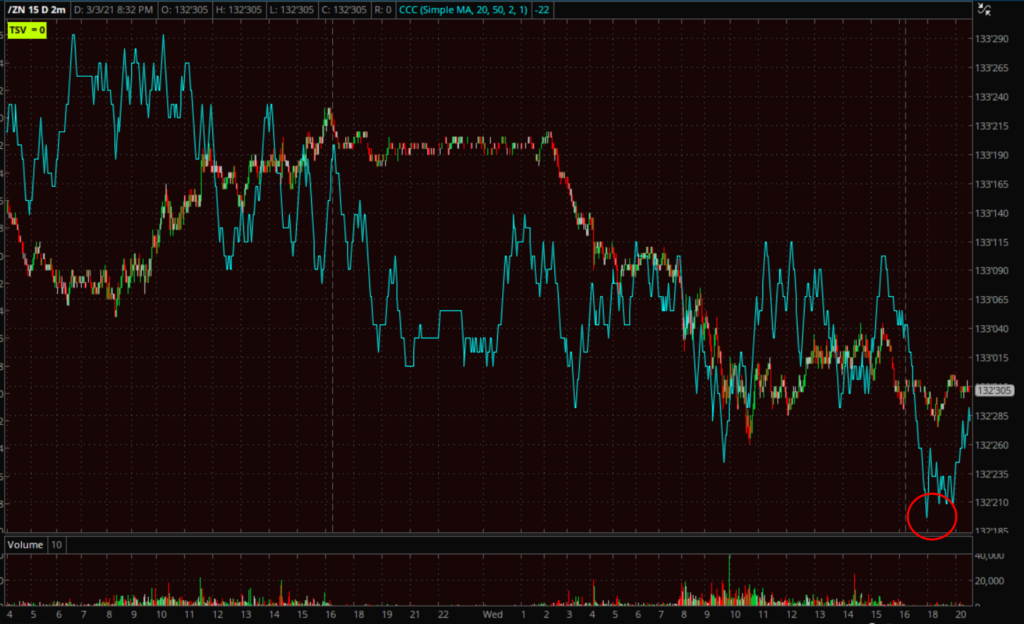
Most importantly treasury futures at the belly and long end (5-year to 30-year) aren’t looking great tonight, which was the initial catalyst that caused index futures to give up last night’s gains and continue selling in the cash session.
10-year Treasury futures (2m) with 3C leading lower (5 year, 30 year futures look the same). 2-year futures have a small positive divgernece.
Looking ahead, investors will receive the weekly Initial and Continuing Claims report, the revised Q4 readings for Productivity and Unit Labor Costs, and Factory Orders for January on Thursday. Powell saking at noon should be the main event and market’s focus.


