Stock Market Update – March 18, 2021
“I almost always warn before FOMC days to beware the knee jerk reaction right after the (FOMC) policy statement, as the market often reacts, then takes a day or two to let everything sink in and the subsequent reaction can be quite different.”
Today we see that concept come to fruition in less than 24 hours. Yesterday for a couple of hours it seemed that Powell and the Fed placated the market, threading the proverbial needle by saying… well nothing different that the market hasn’t already recoiled at.
The evidence of the market’s change of heart… well it was also fairly obvious. Again from last night’s Daily Wrap,
” the 10-year yield added to yesterday’s breakout and closed above key resistance at 1.624%. I would not be surprised to see a negative reaction in growth/momentum/mega-cap and NASDAQ should yields keep rising and judging by the action in the 10-year, I expect it will rise to at least 1.72% on this leg.”
The 10-year yield jumped as high as 1.75% or 11 basis points, which is a huge move which we know from the past few months is going to have a negative impact on the mega-cap Tech stocks of the NASDAQ…
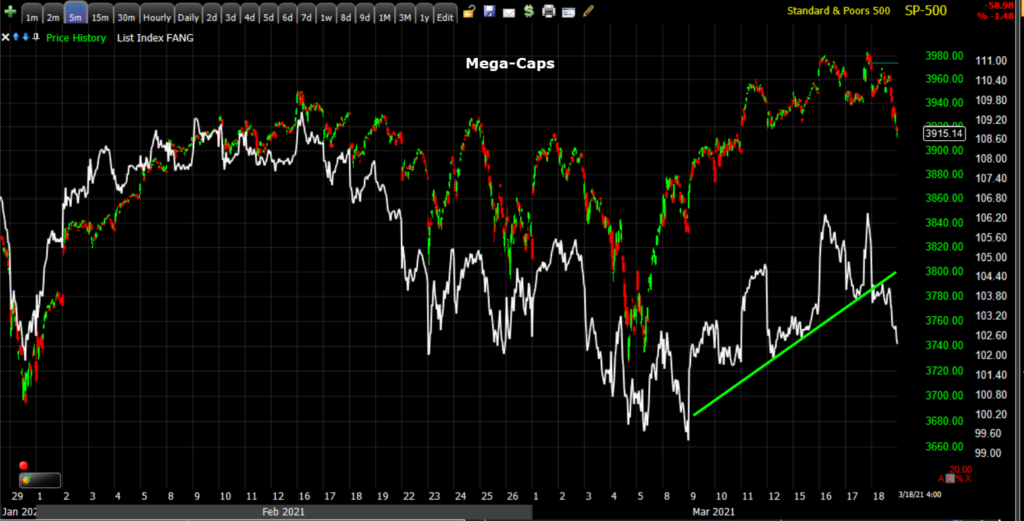 SP-500 (5m) and equally weighted index of mega-cap stocks breaking the oversold bounce trend in reaction to rising rates like mid-February.
…but the rate of change of the move should have had a negative impact on most all stocks. I expressed some surprise earlier today that this hadn’t been the case yet, but by the Afternoon Update,
“All of the averages are at or near session lows, all are red including the Dow and Small Caps did some major catching down around 2 p.m. ET, which suggests to me that it’s not just higher yields today, but the sharper rate of change with the 10-year jumping 9 basis points.”
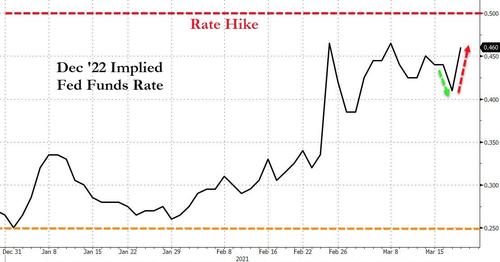
A day after Powell tried to maintain the status quo, expectations for a hike by the end of 2022 are soaring…
Soure: Bloomberg
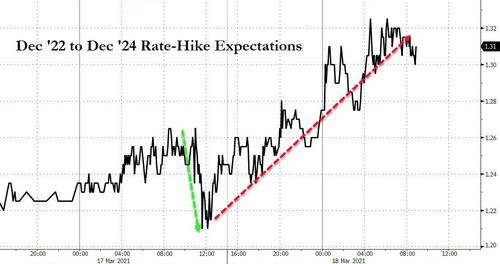
From Dec ’22 to Dec ’24, the market is now pricing in 130bps of hikes…
Source: Bloomberg
Averages
This was the NASDAQ’s second biggest single-day loss since October and back into the red for 2021. Small Caps had held up fairly well early on which was surprising to me given the size of the move in yields, ut by this afternoon they too plunged.
S&P 500 ⇩ -1.48 %
NASDAQ ⇩ -3.13 %
DOW JONES ⇩ -0.46 %
RUSSELL 2000 ⇩ -2.94 %
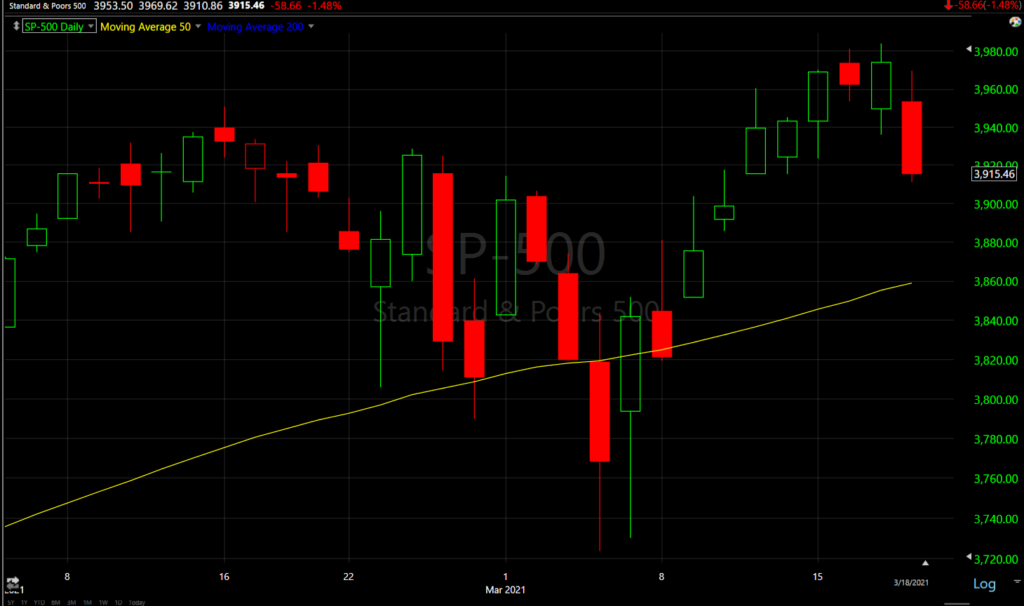 SP-500 (daily)
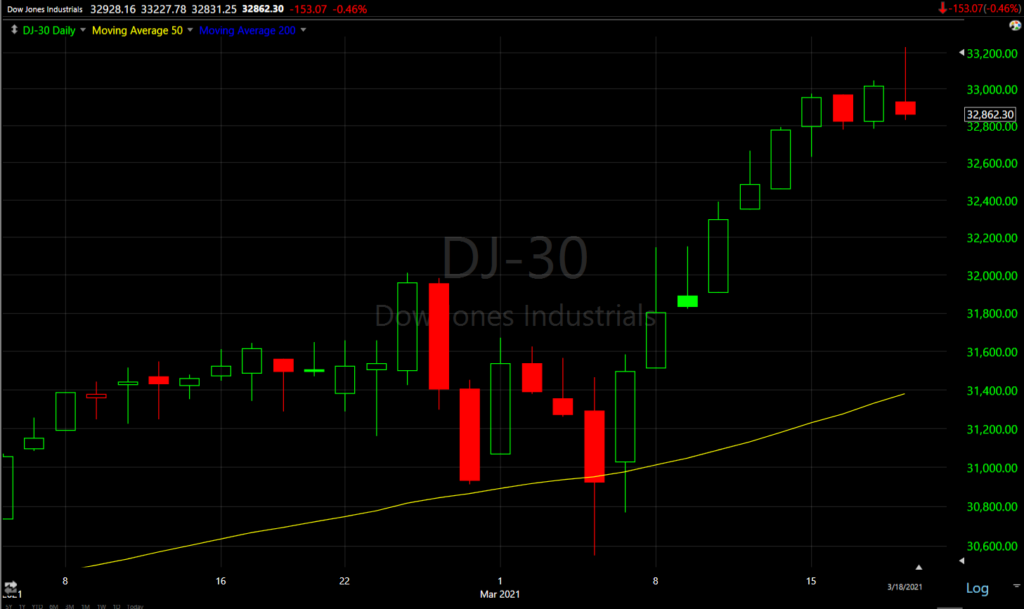 Dow (daily) has been outperforming since the tag of its 50-day and deep oversold conditions, but today posted a bearish Shooting Star candlestick which in Japanese candlestick vernacular = “Trouble overhead”.
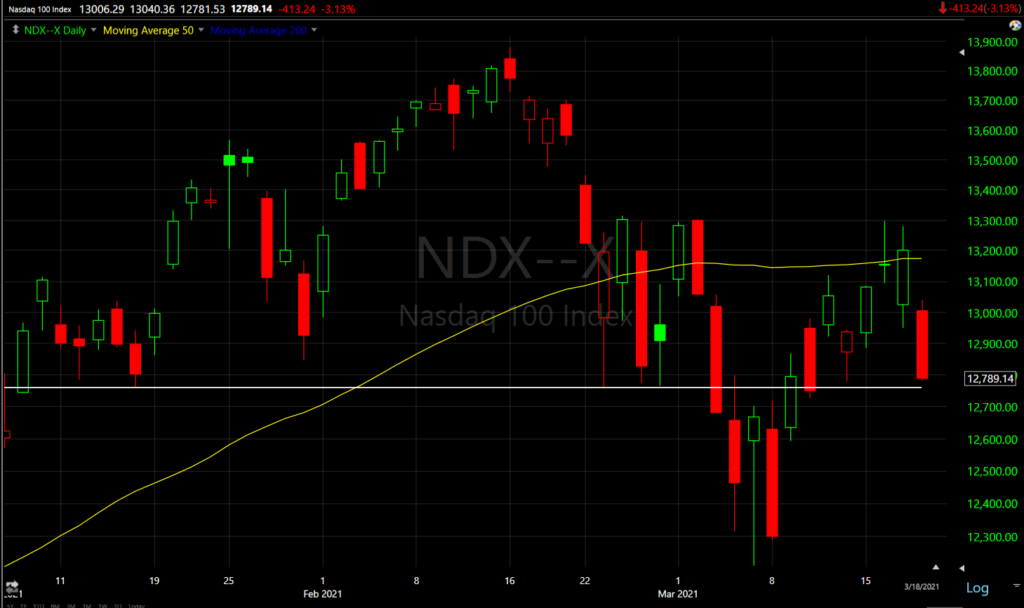 NASDAQ-100 (daily) found resistance at its 50-day and closed quite near to the H&S neck line.
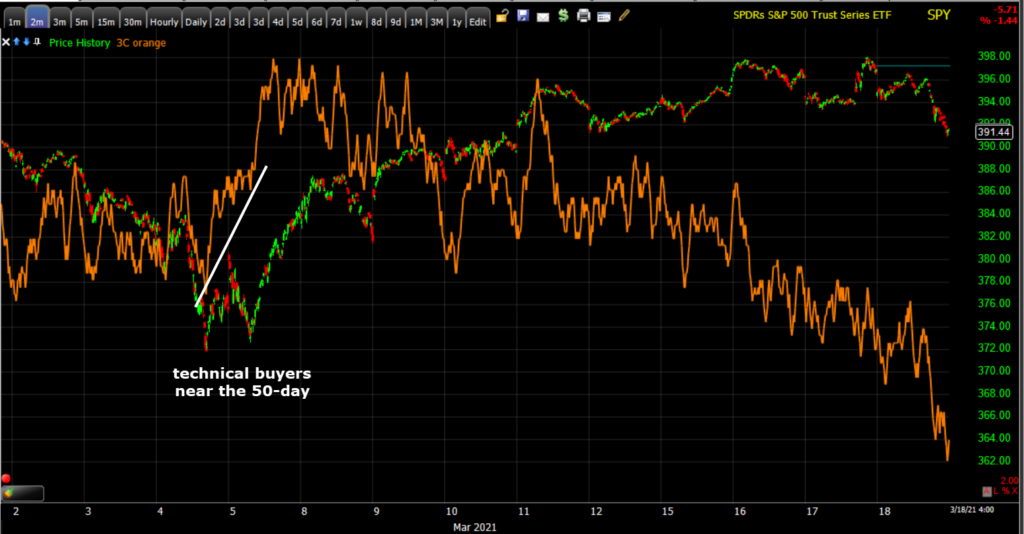
3C charts have not been great during the oversold rally, especially NASDAQ/QQQ, but many had at least had some sort of confirmation within larger relative negative divergences. Today saw some serious deterioration.
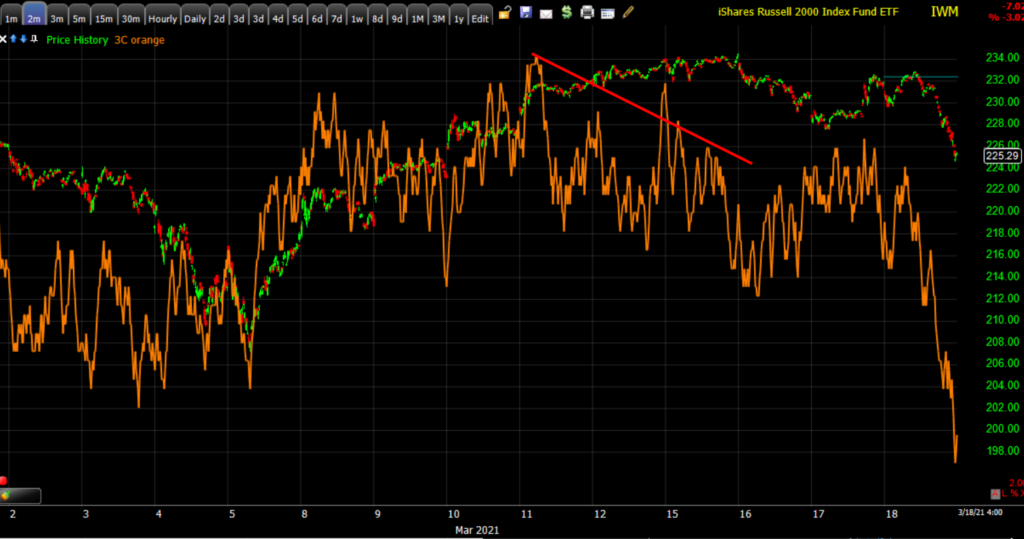 IWM (2m) leading negative with some heavy selling action this afternoon.
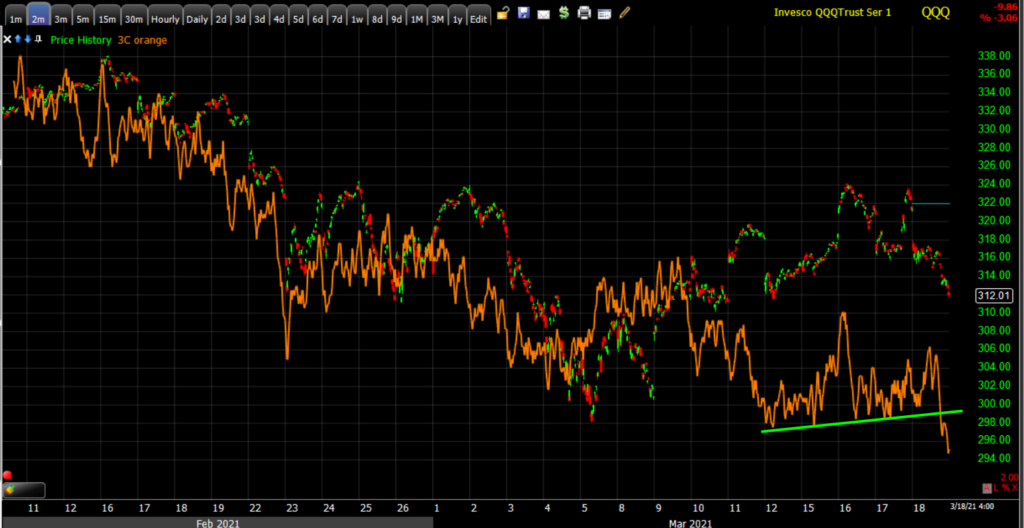 QQQ (2m) has been the worst looking, but it at least had short-term confirmation (green), that broke today and is now leading negative again as it has been most of the time since the February highs and 10% decline from the same.
Just a day after the FOMC and VIX futures contract roll, VIX had its biggest day (+12.25%) since the February 25th +35.5% gain. VIX futures and VXX’s 3C charts did show early improvement since the selling pressure ahead of the FOMC yesterday.
As a side note I’ve mentioned that Emerging Markets (EEM -1.84%) looked like it was putting in a right shoulder of a head and shoulders topping pattern (like NASDAQ-100’s completed one).
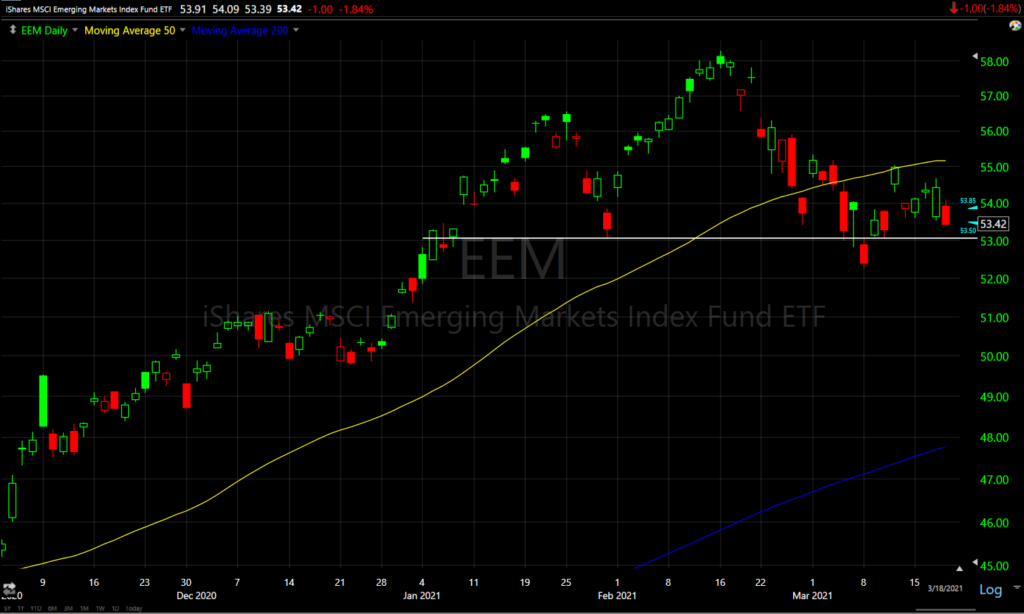 EEM (daily) that’s still the case with the 50-day appearing to be resistance forming the right shoulder. Like NASDAQ-100, the measured move to the downside comes in right around the blue 200-day moving average.
S&P sectors
10 of 11 sectors ended lower with only Financials higher as Banks (KBW Bank Index +1.25%) outperformed amid rising yields, but even the Bank index ended with a Shooting (Doji) Star, a higher probability reversal candle. Additionally, the Financial sector gave back a lot as it was up +2.5% earlier. The mega-cap heavy Technology, Consumer Discretionary and Communications sectors were influential laggards as they’ve been the most negatively reactive to higher yields, but even Energy fell sharply as Oil fell over 7%.
Materials ⇩ -0.56 %
Energy ⇩ -4.49 %
Financials ⇧ 0.52 %
Industrial ⇩ -0.09 %
Technology ⇩ -2.77 %
Consumer Staples ⇩ -0.41 %
Utilities ⇩ -0.37 %
Health Care ⇩ -0.21 %
Consumer Discretionary ⇩ -2.45 %
Real Estate ⇩ -0.63 %
Communications ⇩ -1.66 %
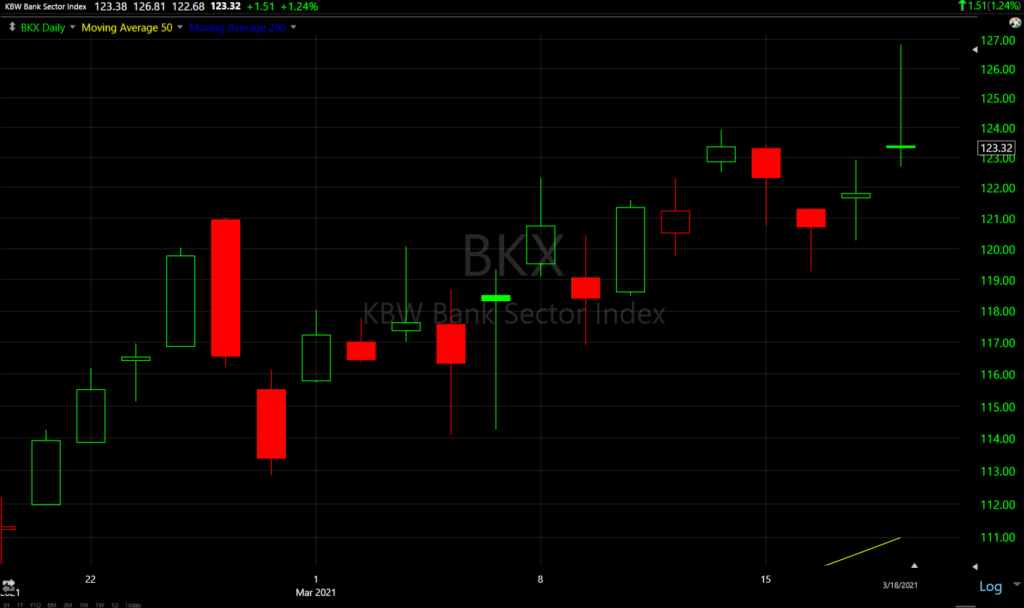 KBW Bank Index (daily) one of the few sectors that will tolerate rising yields and benefit, as long as the rise is not too sharp. Note the bearish shooting (doji) star posted today as earlier gains of +4.1% were given up.
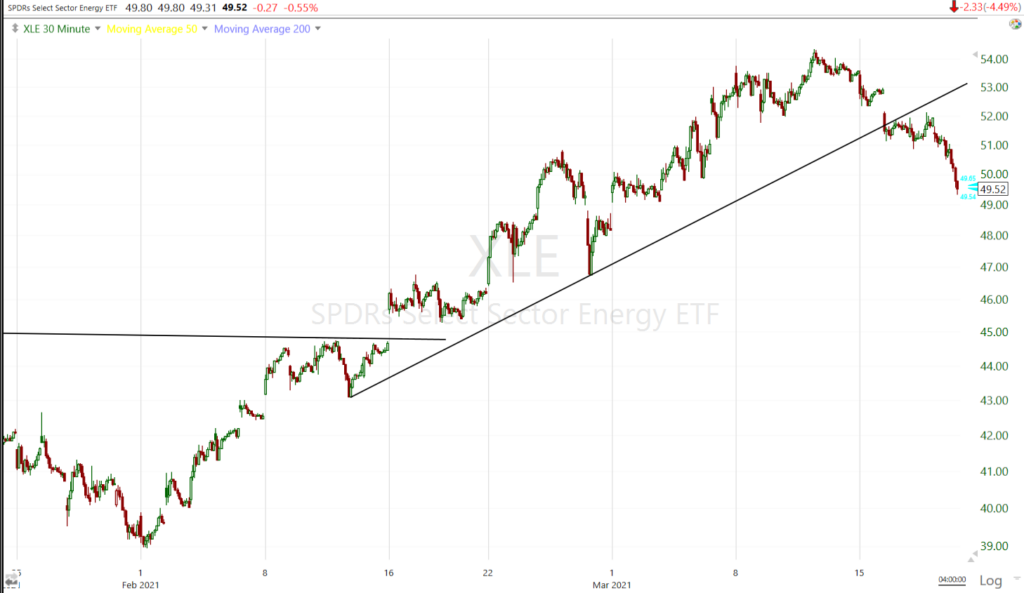 Yesterday I mentioned that the Energy sector (30m) which has been on a tear to the upside had just broken trend. Today the trend was broken more convincingly amid the drop in oil prices and risk-off market tone.
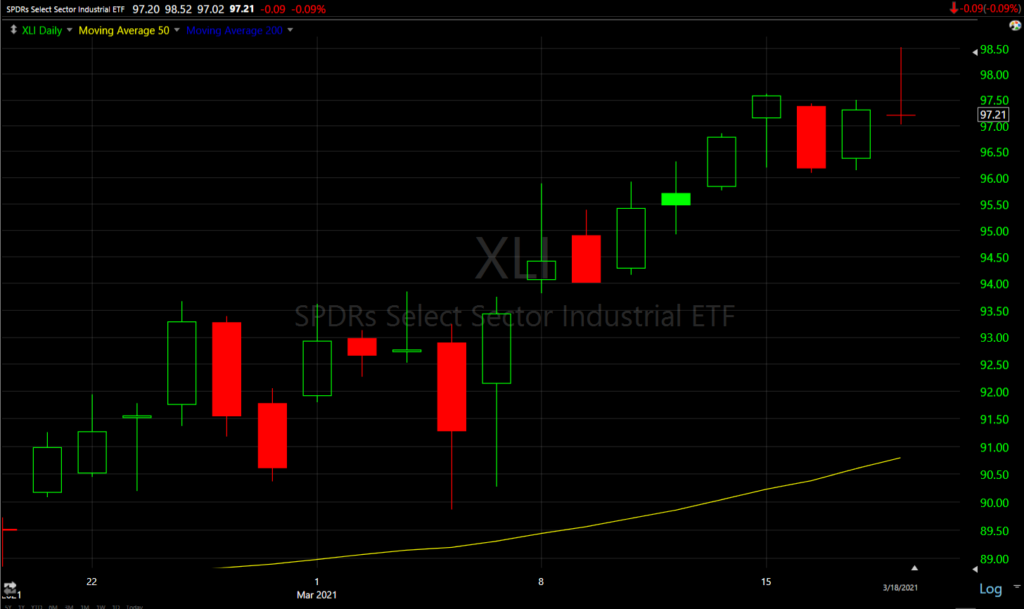 Industrial sector (daily) also posted something akin to a bearish shooting star and inside day, a high probability reversal candlestick.
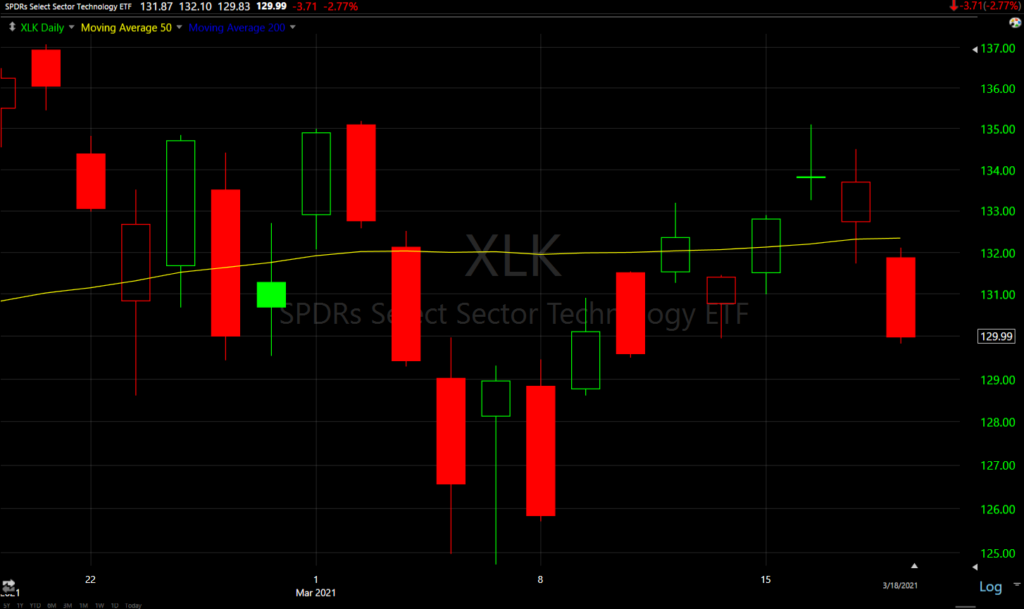 The Technology sector (daily) crashed back below its 50-day sma
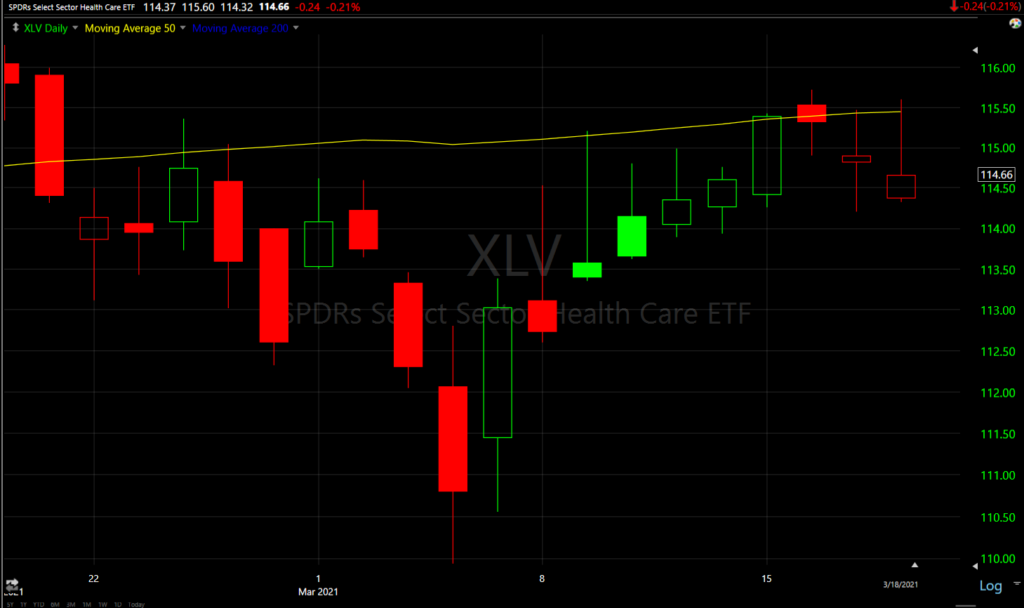 Health Care sector (daily) posted an inverted hammer (bearish) with the 50-day sma acting as resistance since price broke below in mid-February.
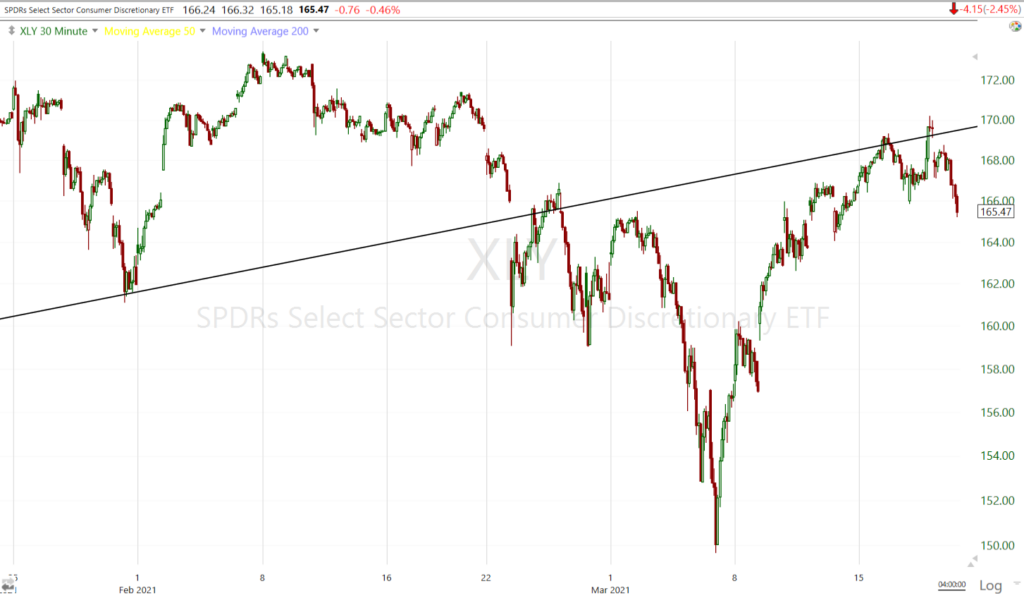 Consumer Discretionary (30m) tested up to its own broken trend line and found resistance there, it also closed below its 50-day like Technology.
Internals
NYSE Decliners (2574) outpaced Advancers (697) by better than a 3-to-1 margin on heavier Volume of 1.1 bln shares.
The price/volume relationship of the component stocks within each of the major averages leaned toward Close Down/Volume Up, which would complete a 1-day oversold condition, but it wasn’t truly dominant.
In recent days we’ve seen a marked deterioration in market breadth again like mid-February, suggesting a downside pivot among the averages is more likely.
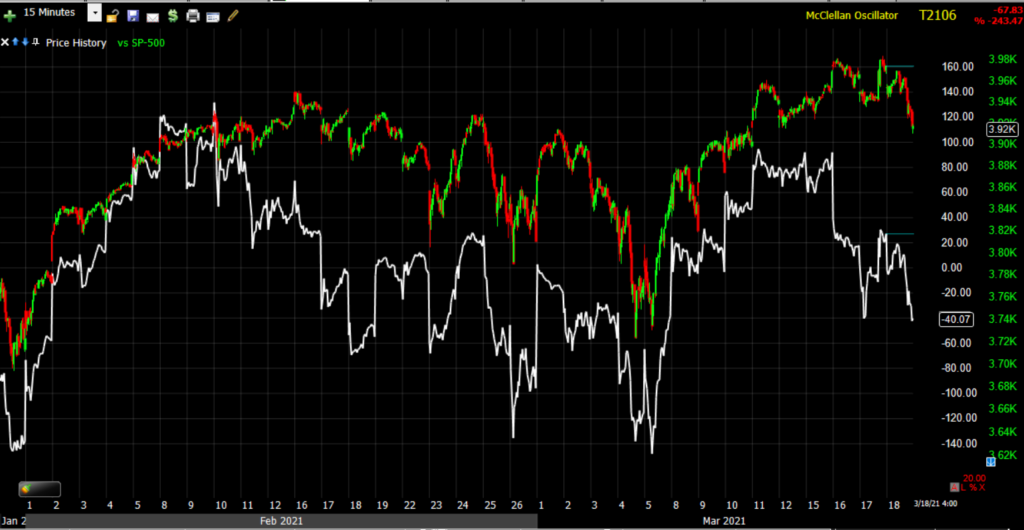 SP-500 (15m) and MCO – this is just one of dozens that have given similar warnings including advance/decline lines.
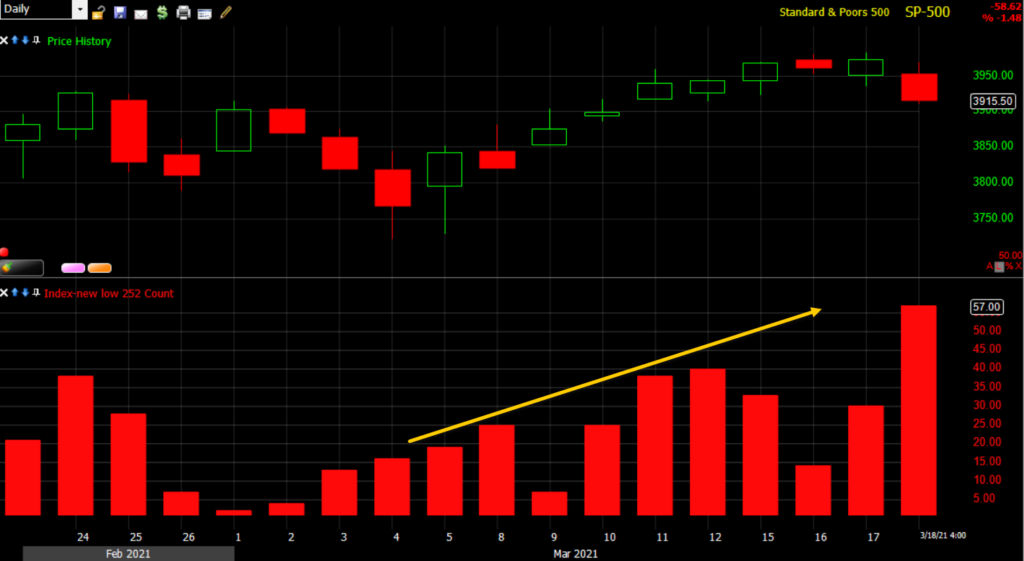 Or the rising number of NYSE 52 week lows. On a day like today with the S&P down it’s no surprising, but the number rising while the market rallies is never a constructive sign.
Treasuries
The Fed sensitive 2-year yield increased three basis points to 0.16%. The 10-year yield topped 1.75% today before backing down a little and settling up 9 basis points to 1.73%, but easily met the chart-implied measured move target for this leg at 1.72%.
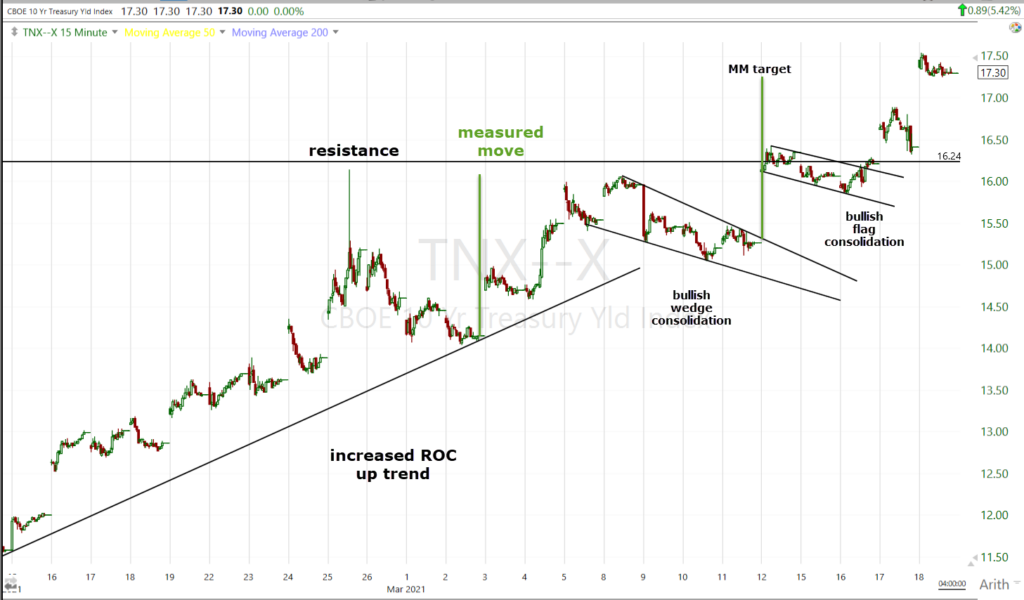 10-year yield (15m) -although meeting the measured move, there’s nothing to suggest yields won’t continue higher, perhaps they’ll consolidate a little in the area after meeting the measured move. Remember that the Copper:Gold ratio suggests the 10-year could trade up to 2.9% to 3%, nearly double what it is now.
Pretty early on in the day high yield credit dumped back toward 2 week lows (leading the benchmark S&P index lower), by the close it reached the lowest level since November.
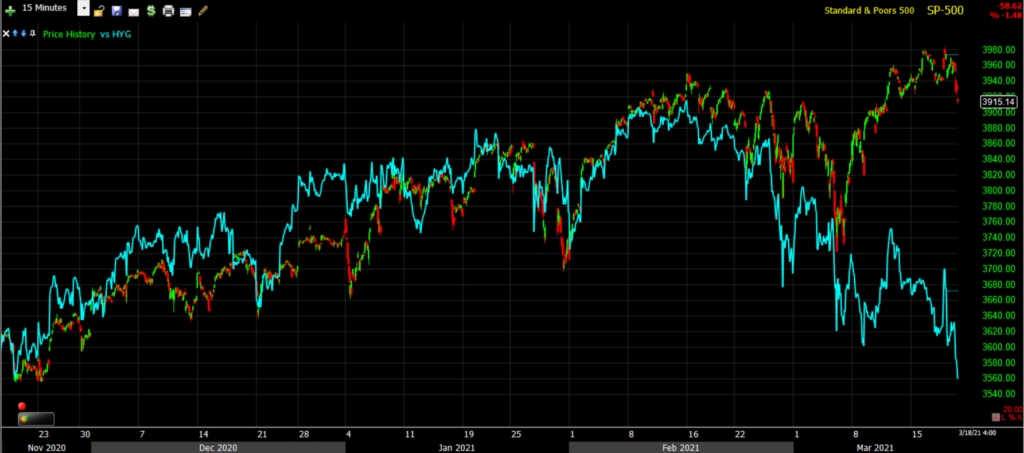 SP-500 (15m) and HYG – this is a very ugly chart and one of the worst divergences I’ve seen in a while.
Currencies and Commodities
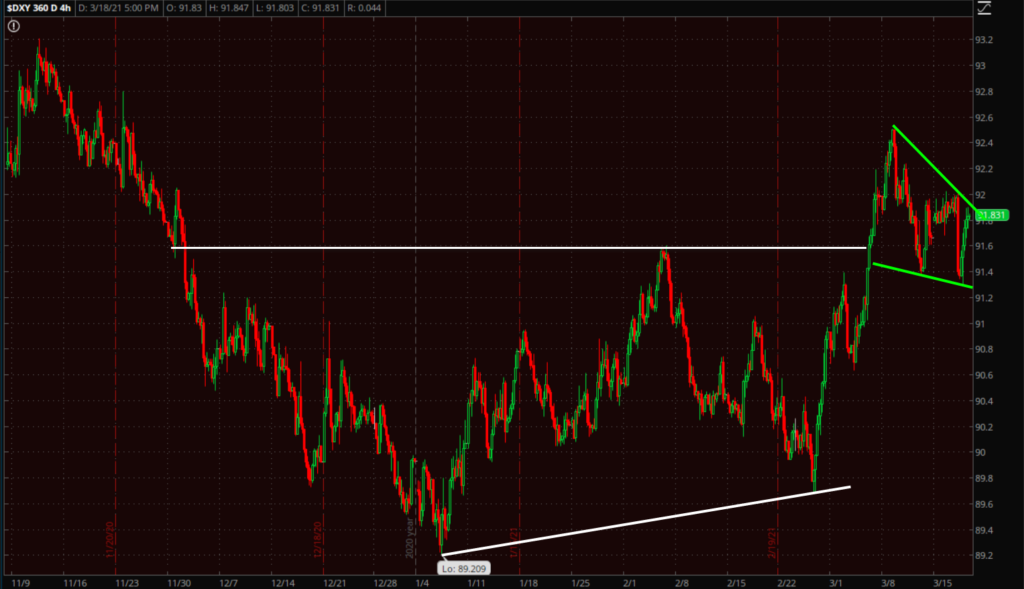
In yet another sign the market rethought the FOMC and Powell, the U.S. Dollar Index jumped +0.4% to 91.85 and erased most of yesterday’s dovish reactionary loss.
U.S. Dollar Index (4h) – the chart here looks pretty bullish with a recent flag/pennant consolidation hinting at more upside as likely. I’d guess at least 2.5% more upside which is a big move for the Dollar, and would almost certainly accompany rising bond yields. The Fed cannot afford a rising dollar as it will dramatically tighten financial conditions along with higher yields.
WTI Crude oil closed down for a 5th consecutive day, the longest losing streak since February of 2020. WTI fell -7.1% to $60/bbl.
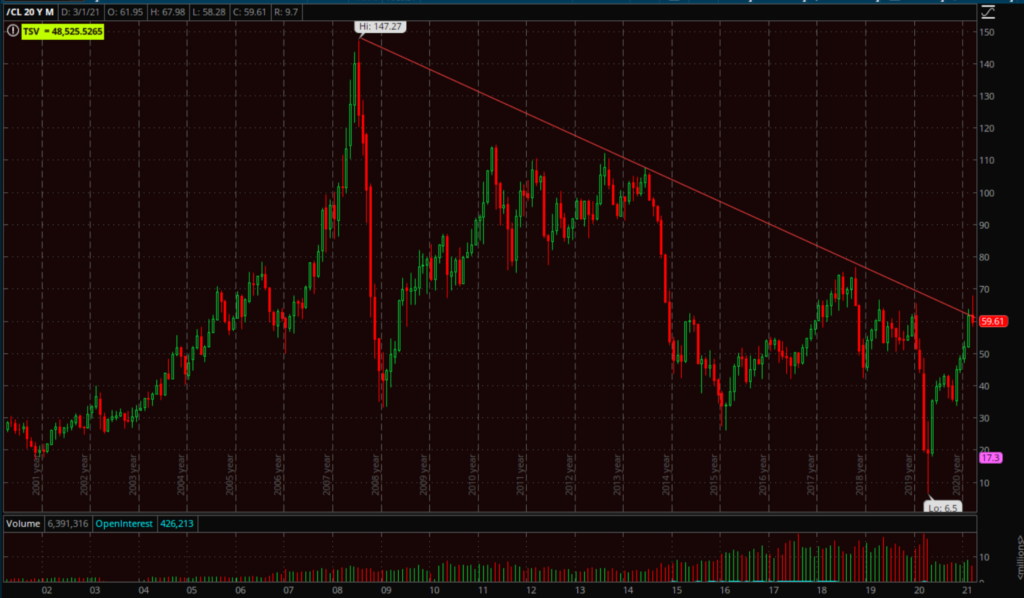
Remember that decade-plus trend line that WTI crude has had trouble escaping the gravitational pull?
Prices virtually crashed through it today and on an increase in volume coinciding with France’s Prime Minister Castex announcing a new month-long lockdown in 16 regions, including Paris, stirring some concerns about the recovery in global oil demand.
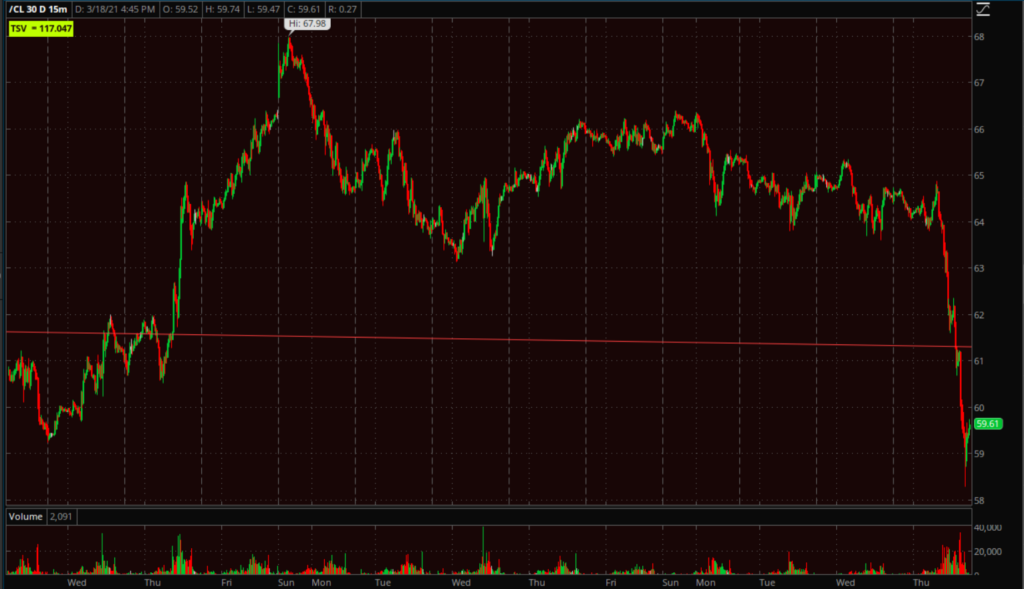 WTI Crude (15m)- this is the biggest decline since June of 2020.
Gold futures gained +0.3% to $1,732.50/oz, escaping from earlier losses despite higher treasury yields and a strong dollar. However if you believe as I do that yields are likely to head higher and the Dollar could as well, it’s hard to get bullish gold until the Fed takes some action. For instance, if the Fed squashed the 10-year (through mechanism like asset purchases or some kind of curve control), while inflation expectations rise, that would send real yields (nominal yields less inflation) more deeply negative and gold has had an inverse relationship with real yields. In the meantime I’ve suspected that the recent bounce in gold is just a larger bearish consolidation forming.
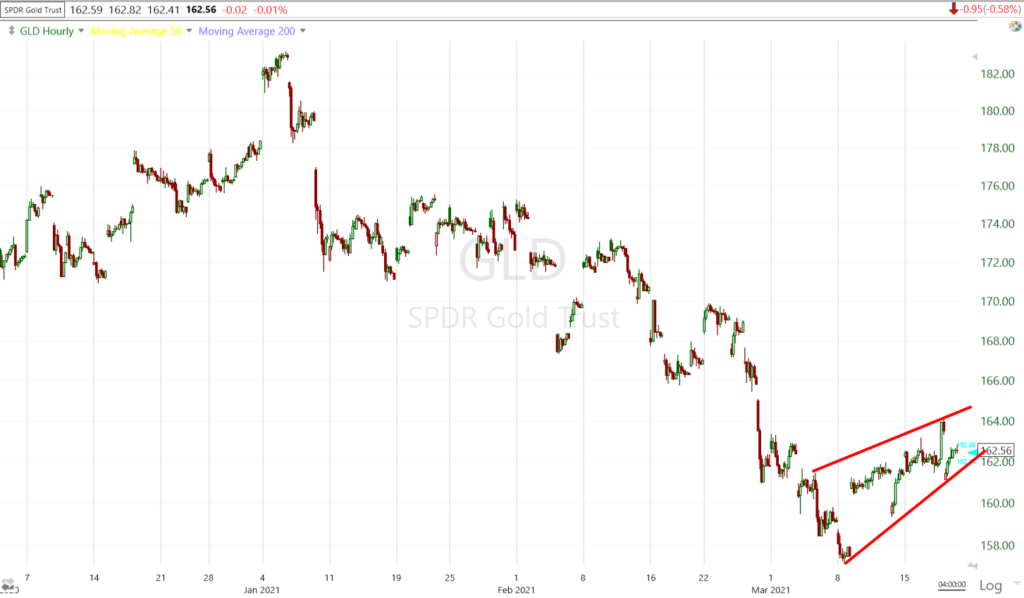 GLD (60m) looks like a larger bear flag/pennant/wedge consolidation and would have a deeper downside target than the prior series of small bear flags that were invalidated with the bounce. I’d expect 6-7% of downside from break below the consolidation (as opposed to the roughly 2% downside that was previously expected).
The cryptocurrency ETFs I’ve been updating fell -2.25% to -5.5% today after some bullish breakouts yesterday. I’m not too concerned yet, but we don’t ant to see those bullish breakouts fail.
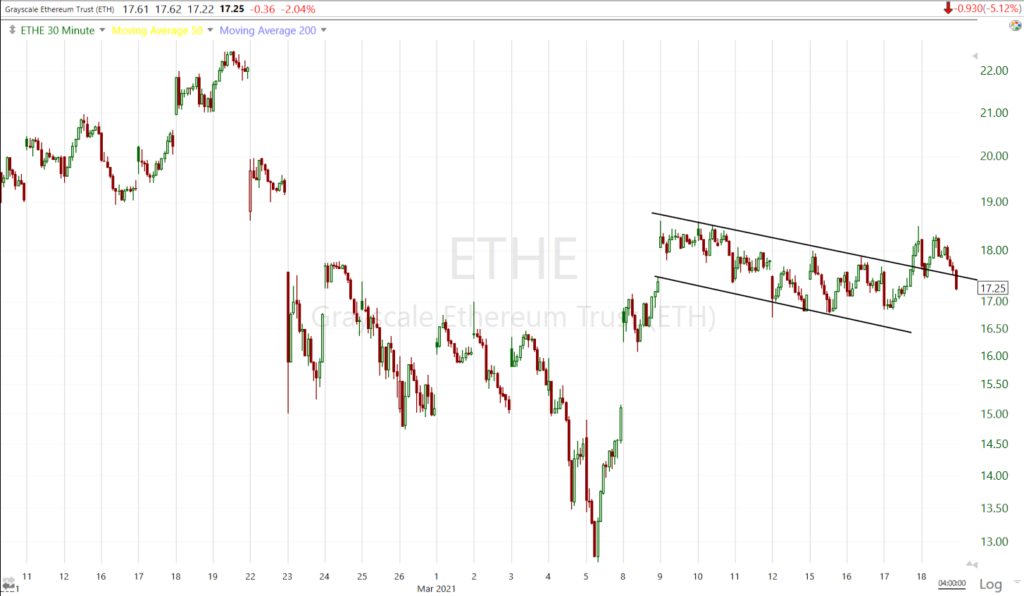 ETHE (30m) as long as it does not make a lower short term low (i.e. below $16.85) or more so below the flag (under $16), I’m not too concerned, but failed or false breakouts often lead to more intense and fast reversals so if you are long (like I am GBTC and ETCG) you’ll want to pay close attention and be ready to consider your stops.
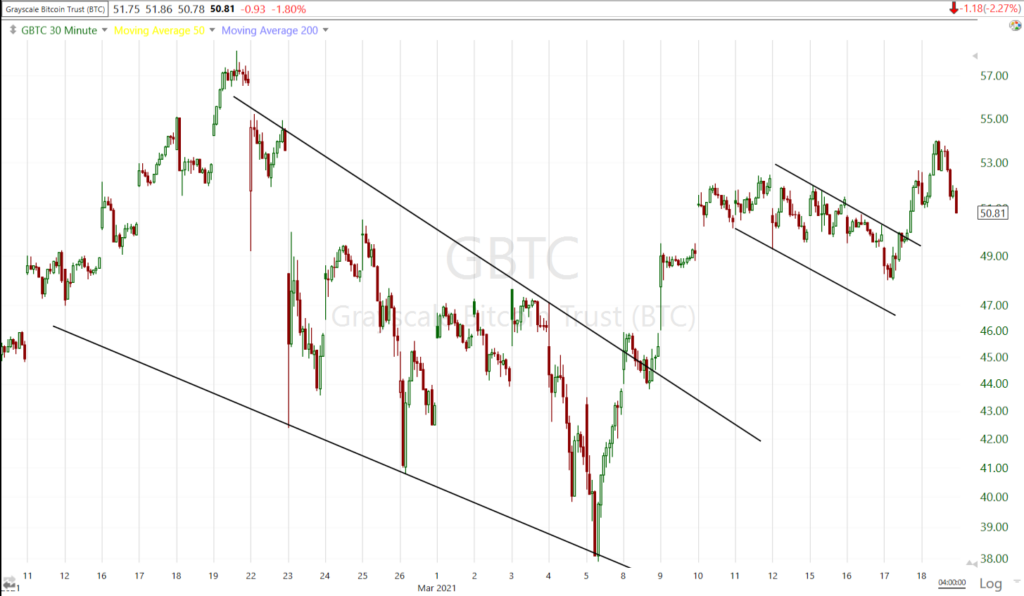 GBTC (30m) the same concept applies. I don’t want to see GBTC trade below the last pivot low around $48, and certainly not below the flag (under $46). Otherwise it’s just a day of correction and I’m not going to overreact, especially considering how strong the up trend has been since entering last June with a 370% gain.
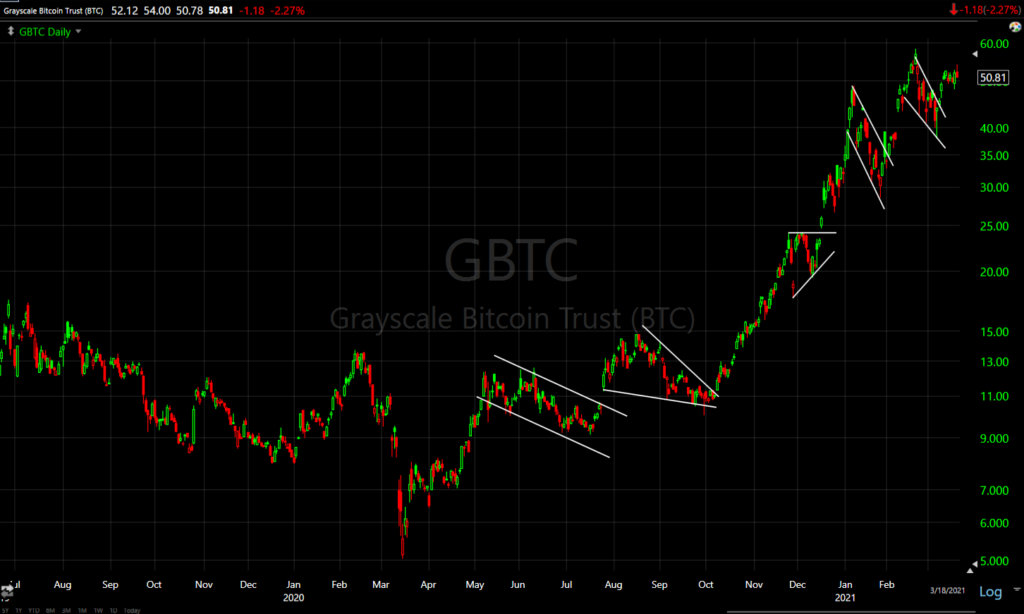 GBTC (daily) the bullish trend and consolidations are reminiscent of Gold from early 2019 to July of 2020, or TLT/bonds from early 2019 to March 2020 when the Fed’s actions in reaction to COVID killed the trend.
Summary
Outside the path of yields, with both stocks and bonds down, it’s likely that hedge funds and risk-parity funds took a beating today and may be forced to do some further de-leveraging. A rise in volatility will also force them and other systematic strategies like CTA’s to deleverage.
The Copper:Gold Ratio and yields’ price action all suggest higher yields, but it’s not uncommon once a measured move is met to see a new consolidation. In the Afternoon Update I also mentioned that the NASDAQ-100 meeting its H&S neckline may be an area of temporary support where we get a little consolidation. Otherwise, I still think the most likely scenario is that the NASDAQ-100 leads the way lower and meets its H&S downside measured move near its 200-day moving average which is about -7.5% lower from here. A consolidation/bounce would provide an opportunity to enter a NASDAQ short, although I’ve heard from many of you who entered short yesterday. With the look of 3C charts, I’d have no problem leaving that short open.
Internals were close to 1-day oversold, but not a truly dominant 1-day oversold condition, and market breadth is coming off strong overbought levels, it’s nowhere near the deep oversold readings from early March. In the short term haps tomorrow or the next day or so we get a 1-day oversold condition in internals, a bounce or consolidation would work that off and provide an opportunity to enter or ad to shorts (I prefer NASDAQ 100 short). A correction or consolidation in yields would likely offer the same opportunity, but again I see no evidence they won’t continue higher.
We also have quad witching options expiration tomorrow so that may provide a short term influence on stocks Friday.
I’m happy with long volatility position I started last week and will look to add to it on a potential consolidation in yields/the averages.
The bottom line is that the Fed said and did nothing new. The market is in deep disagreement with the Fed much like 2013, 2016 and 2018. The old adage goes, “Don’t fight the Fed”, but in each of those scenarios the market was right and the Fed was fighting the market. Most recently you may recall in October of 2018 Powell made an illusion to the neutral rate being higher (that the Fed would continue hiking rates), the very next day the S&P (and broader market) began a sell-off that ultimately saw the S&P lose 20% into December and Powell and the Fed were forced to go from hiking rates just 3 weeks earlier, to halting the rate hike cycle and begin a rate cutting cycle. While the Fed is not hiking rates presently, they are sitting on their hands as rates rise and financial conditions tighten, so it’s effectively the same scenario. As yields rise and the Dollar (which still has a large consensus short position and is susceptible to a short squeeze), financial conditions tighten. The market has been screaming since February that the Fed has to do something, whether more asset purchases, targeting asset purchases more toward the 10-year (which is the key rate setting tenor) or starting Operation Twist 3.0 (selling the short end and buying the long end), and thus far Powell and the Fed have said, “Don’t worry about inflation and rising yields, it’s transitory and we’re not worried”. As you can see from the first few charts above, the market doesn’t feel the same and is pricing in more a more aggressive rate hike cycle and sooner to tame inflationary pressures. I suspect that the market wins and forces the Fed’s hand, but like October-December 2018 it may take a sharper sell-off in stocks to get the Fed to act.
Powell and co. must have felt pretty good yesterday that they stayed on message and the market seemed to buy it this time, but from today’s price action (and what yields’ price action has been saying for months), that’s not the case. the market is still not happy with the Fed and I expect it will continue to throw a tantrum until it gets its way.
Overnight
S&P futures are up +0.2% and have a positive divergence since the close. From the Afternoon Update…
“I suspect that the NASDAQ-100 is heading for the H&S neckline around $12,760 or so and may find some brief, temporary support there, but ultimately I still think the 200-day is its downside target.”
Or the divergence may just be the early stages of an overnight consolidation in both index futures and bonds, or be an influence of Quad-Witching options expiration tomorrow. If I had to guess, based on index futures’ 3C charts and S&P looking the best rather than technical buying making NASDAQ look the best, I suspect it has to do with either a consolidation phase overnight in bonds or Quad-Witching op-ex or both.
For some additional context…
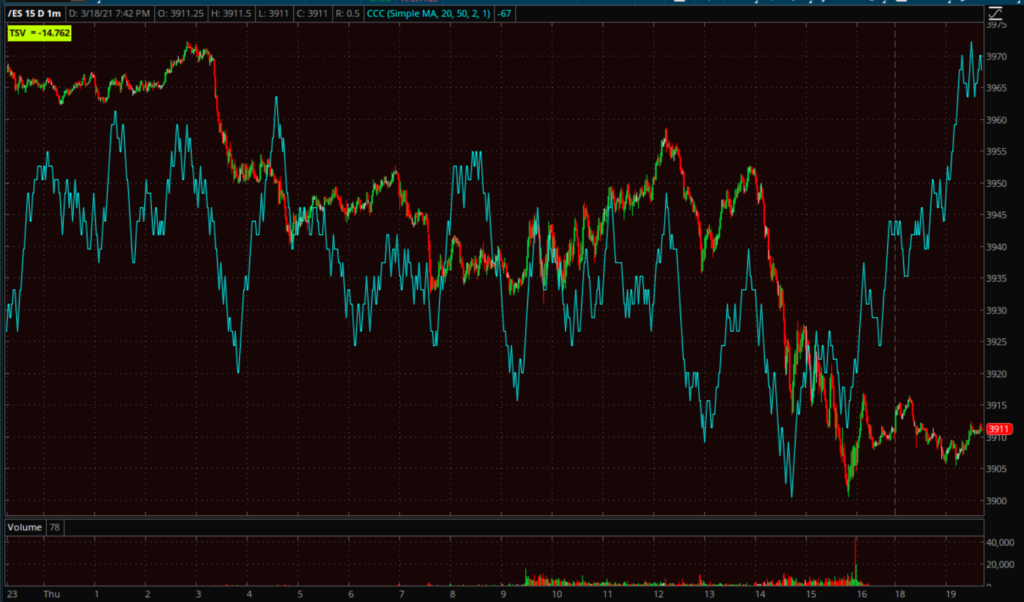
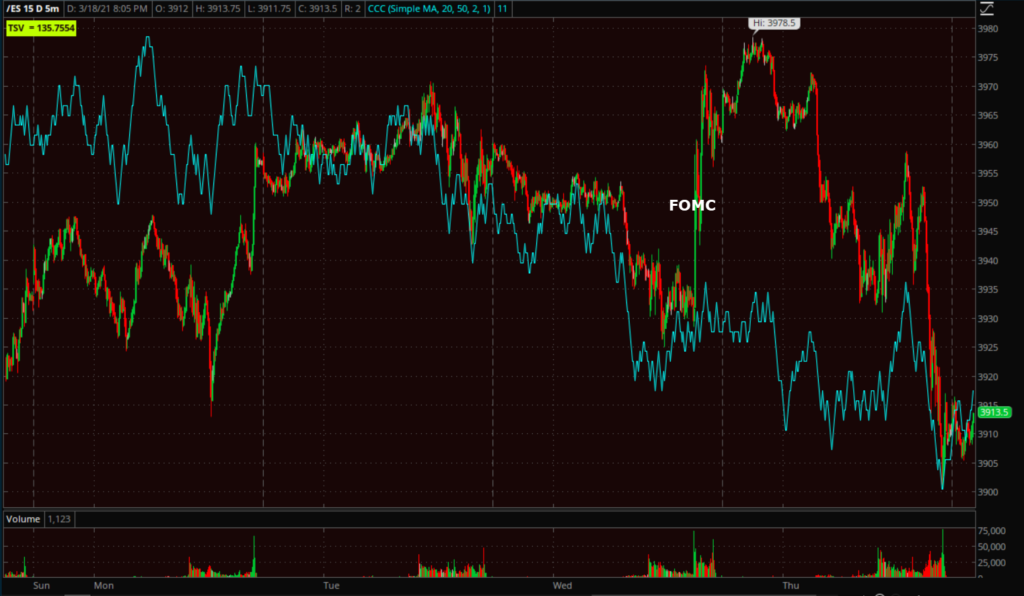 S&P futures (5m) note the strong knee-jerk reaction upward n reaction to the FOMC, but no 3C confirmation of the gains.
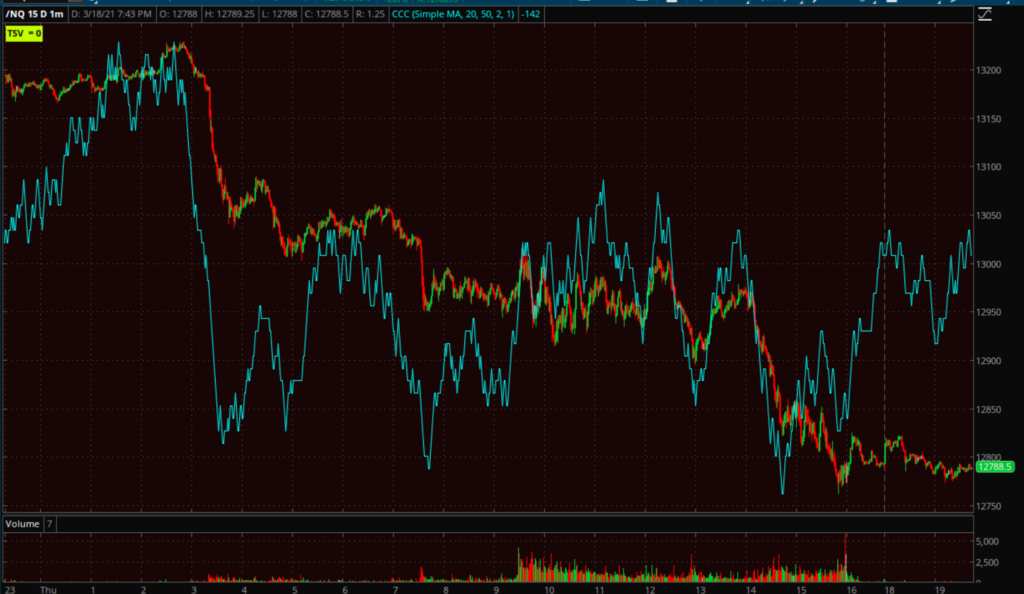 NASDAQ-100 futures / NQ (1m) – I would think that if this were a reaction to technical support near the NASDAQ’s H&S neckline, NQ would look better than ES.
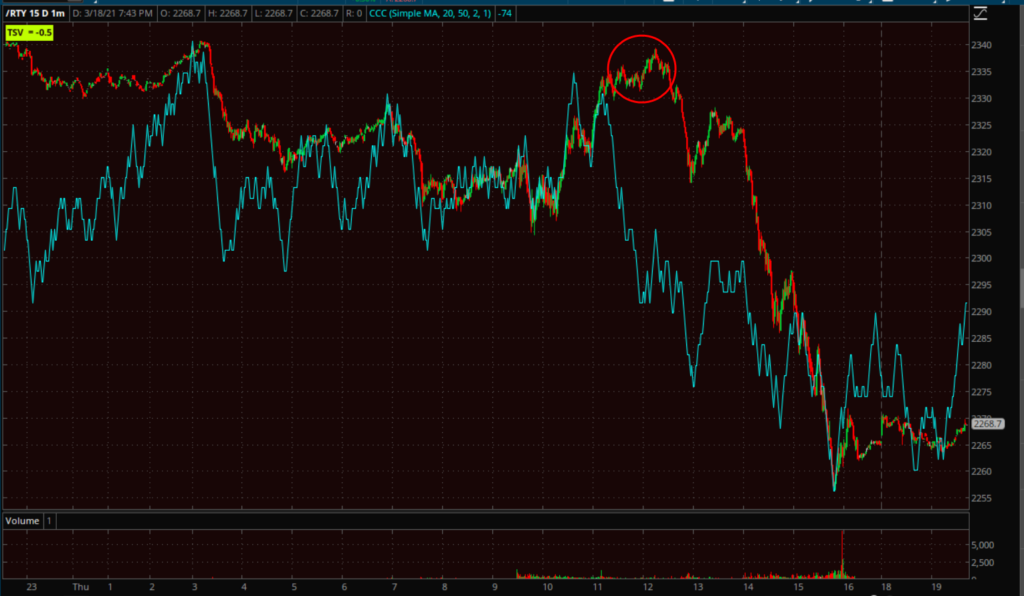
Russell 2000 futures/RTY (1m) note the heavy underlying selling in 3C this afternoon (red), and weaker 3C chart tonight vs. ES.
VIX futures displayed selling pressure on 3C yesterday before the FOMC as if often the case, but positive divergences earlier today along with VXX.
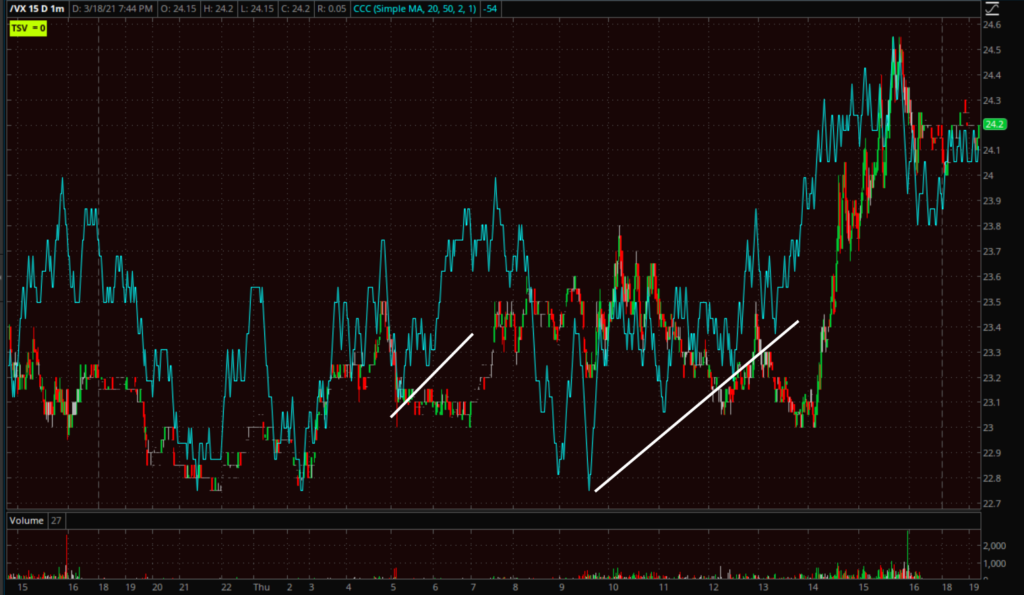 VIX futures (1m) positive divergence earlier before and into the cash session, and in line (confirming) tonight.
I think a consolidation/correction in Treasuries – having met the measured move target – is the most likely reason index futures looking a bit better heading into the overnight session.
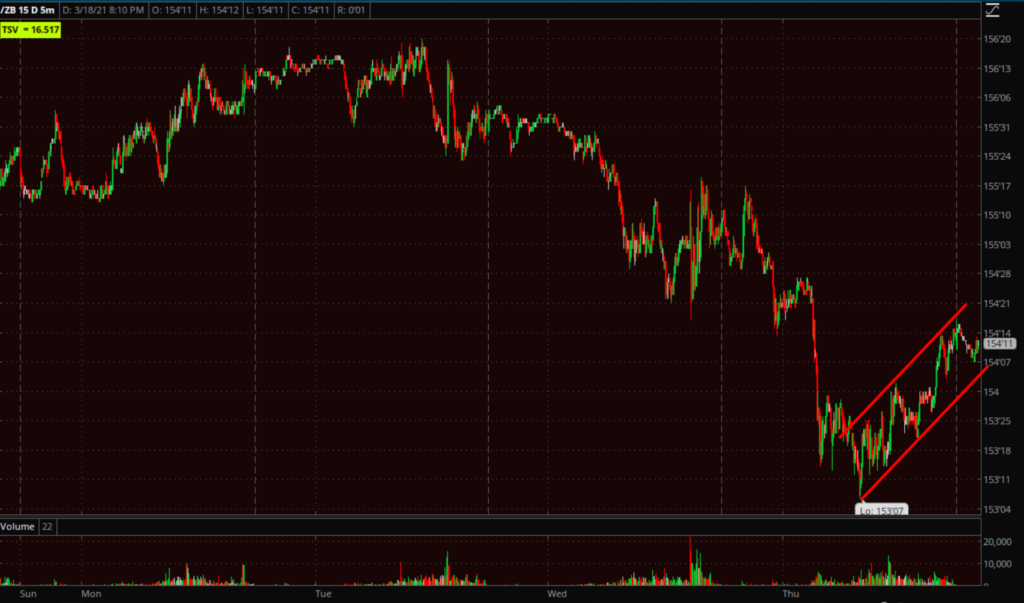 30-year Treasury futures (5m) note the bounce off session lows but it’s a clear bear flag. A break below the flag should be a net-negative for stocks, particularly the NASDAQ-100 Technology, momentum and growth style factors. This is a bearish consolidation which tells us that probabilities are Treasuries head lower and yields higher, but with the 10-year yield having met the measured move target of 1.72%, this is a very reasonable place to expect a correction/consolidation.


