Strange Signals Are Back
After a pretty much flat week last week, this week all of the averages gained a similar amount. The S&P gained +1.1% , DJIA +1.1%, Transports +2.2%, Nasdaq-100 +1.2%, and Small Caps +0.55%.
Small Caps rebounded +2% today due to short covering and gains in Regional Banks (+3.45%) to get them green on the week.
As for the divergence in the S&P/SPY today that I mentioned earlier, it didn’t change by the close.
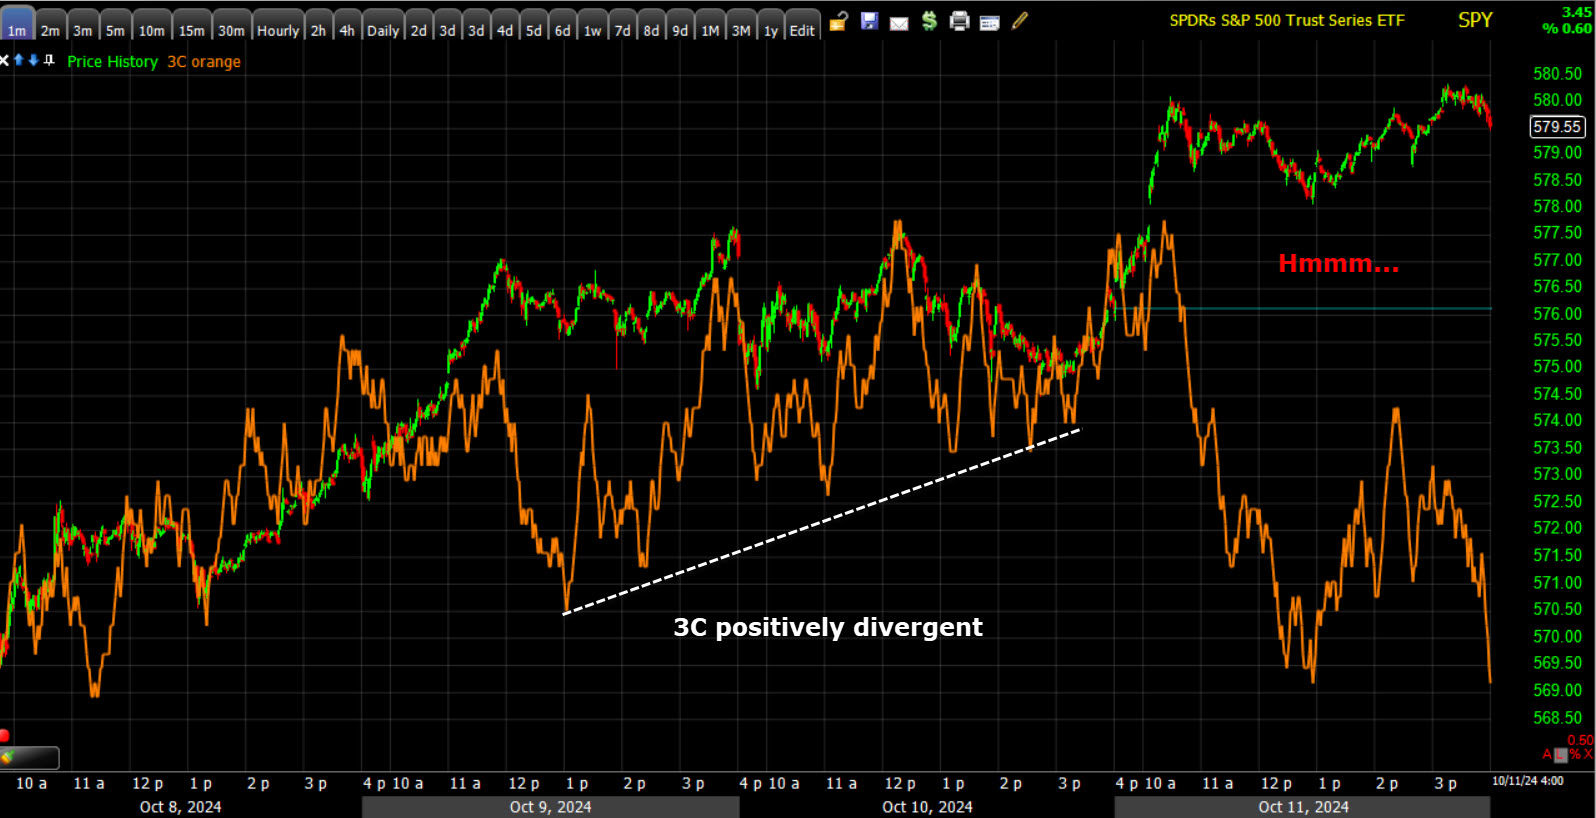 SPY (1m) – Today was a very different character than the modest positive divergence of the last 2 days leading to today’s +0.6% gain. It looks to me like the same dynamic mentioned earlier in the week in which there’s profit taking in to price gains, or opportunities to do so.
The S&P has 3 days above the lateral price range since the day after the FOMC…
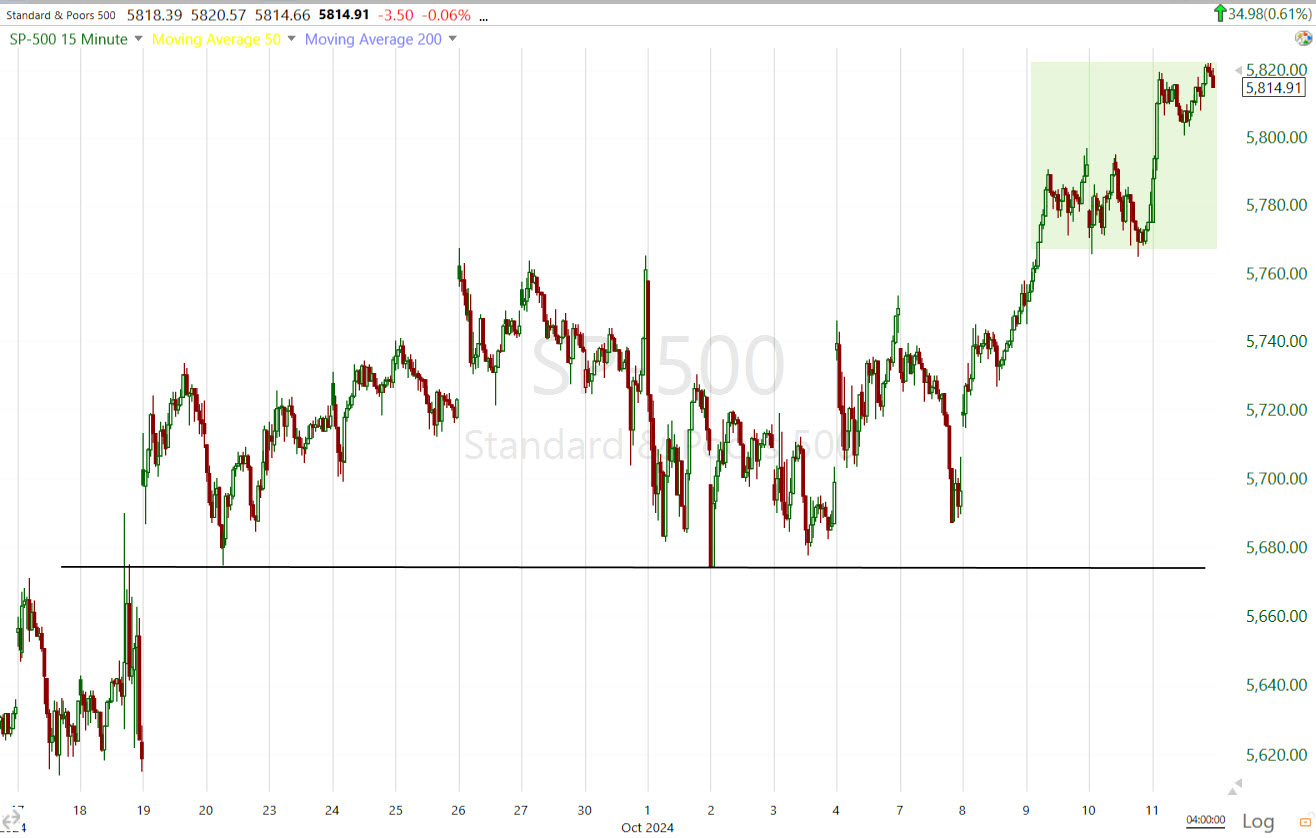
SP-500 (15m)
The 3C chart covering this period shows the range as somewhat weak, even the 3 days above the range.
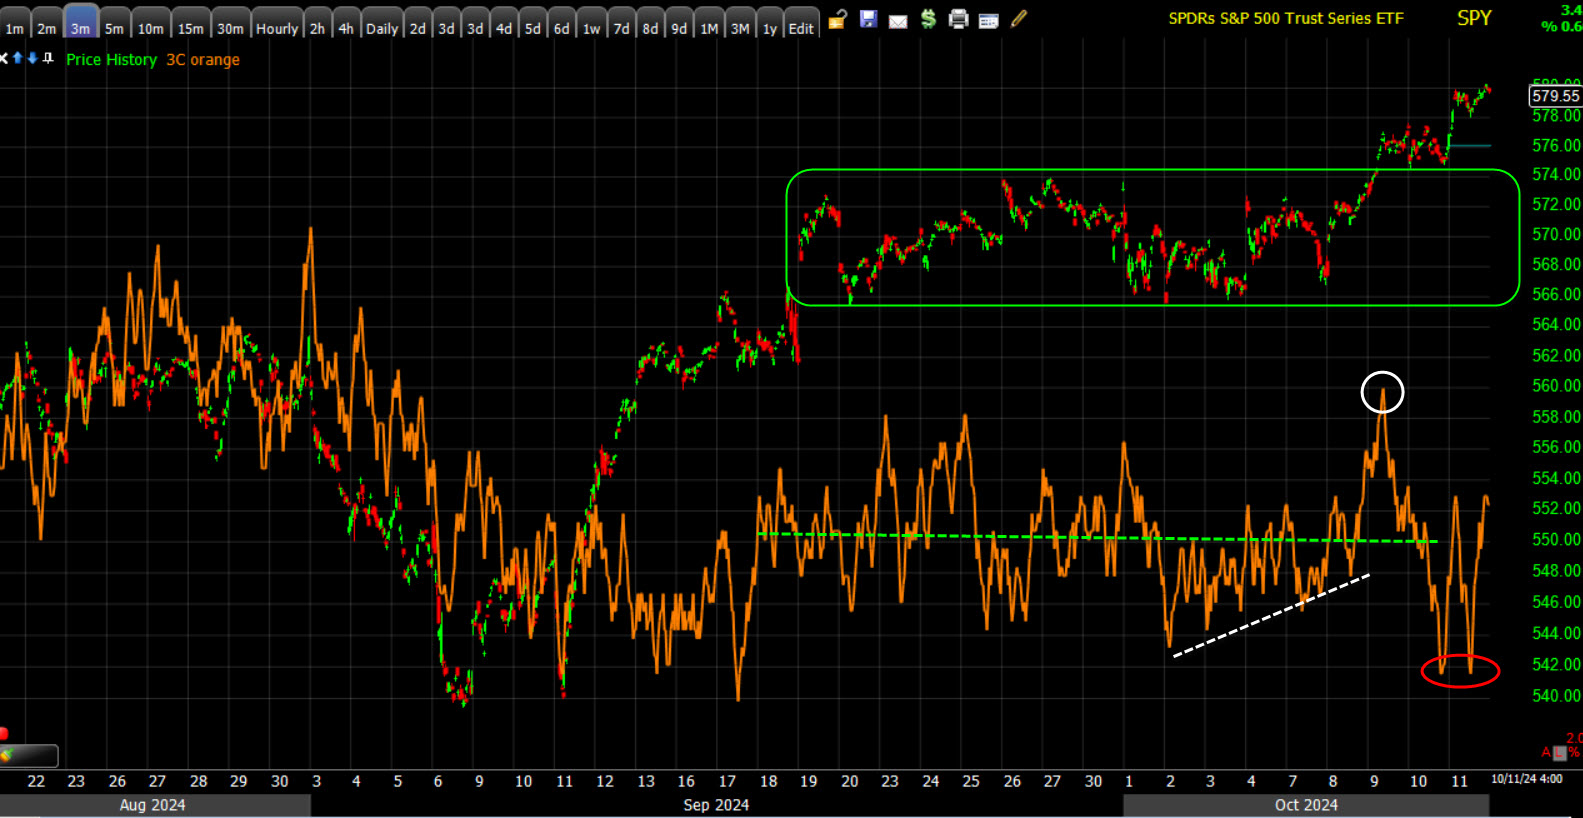 SPY (3m) 3C’s overall trend is lateral (green box). There is a hint of the same positive divergence (white line) as the shorter-term, more detailed 3C chart above, and there’s a weaker close to the week on 3C (red) reflecting Friday’s intraday negative 3C divergence. This still doesn’t look like the kind of heavier selling of June into mid-July’s market correction. This is a good example of why I’ve been saying that it looks like investors are taking some YTD profits on price strength, but we’re not quite seeing the heavier distribution from mid-June into early Q3 that saw the NDX fall -15% from the July 10th high.
*These charts can change pretty quickly, but so far, this has been the trend post-September-FOMC.
Nasdaq-100 remains in a lateral price range post-FOMC that’s defined by the trend line and the gap-up open from September 26th.
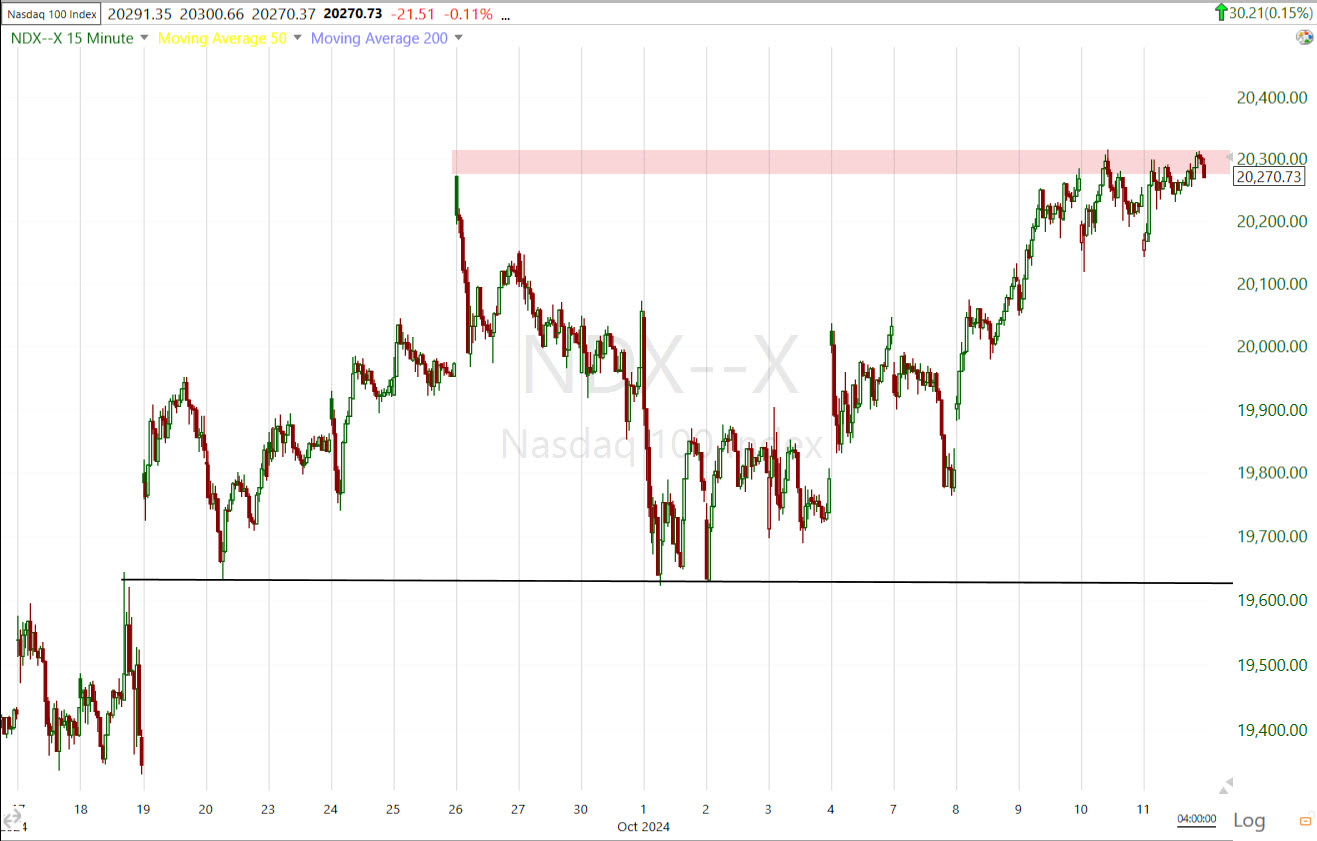 NDX (15m)
NDX/QQQ’s 3C chart (trend) has been weaker toward the top end of that range this week.
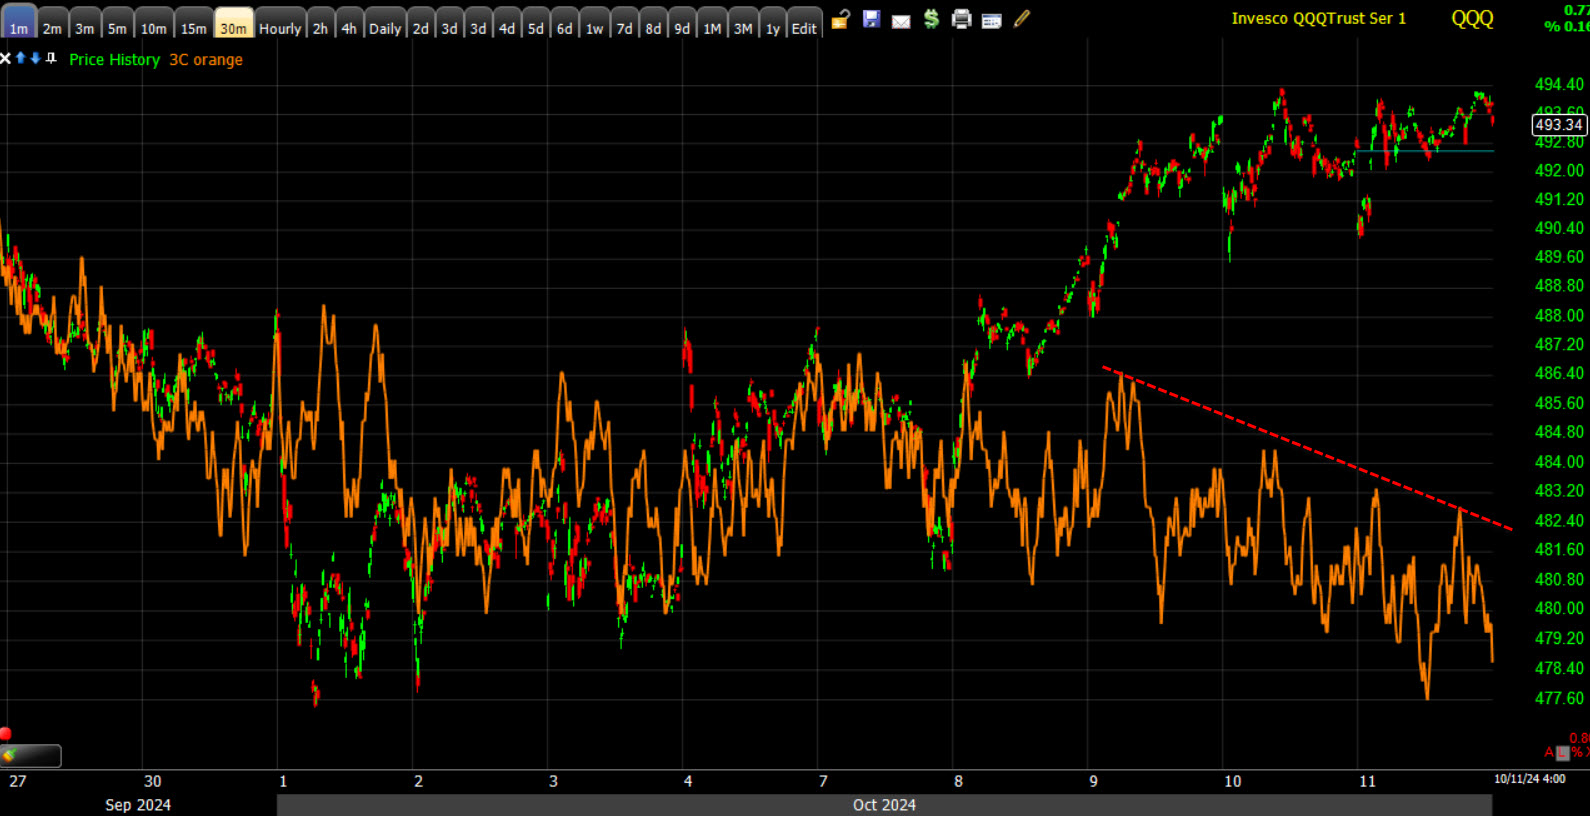 QQQ (1m) with a more negatively divergent 3C signal than SPY over the same period.
VIX continues displaying relative strength with a +6.5% gain on the week despite the SPX closing up +1.1% for the week and a new record high.
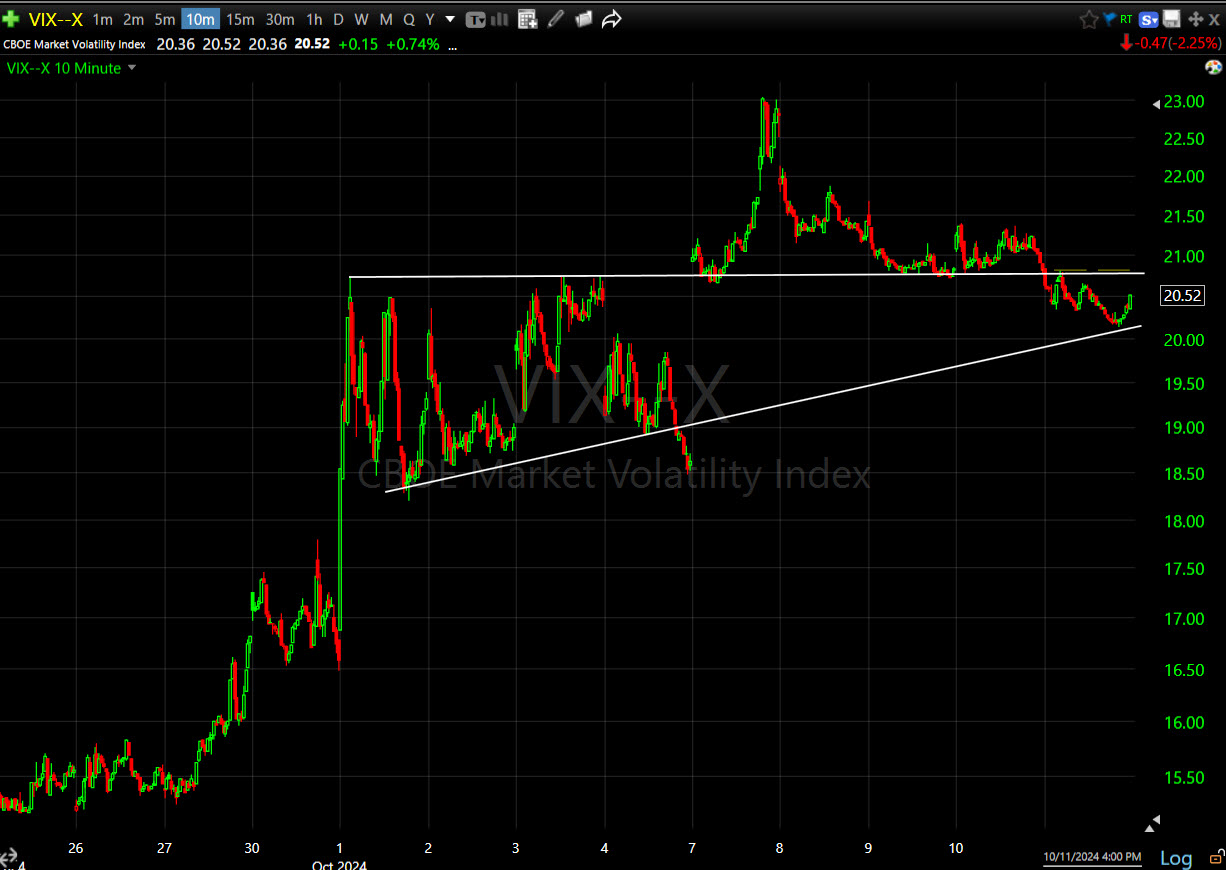 VIX (10m) May not be a textbook bullish ascending triangle, but its a far sight better than it should be considering.
If we add SPY to the same VIX chart…
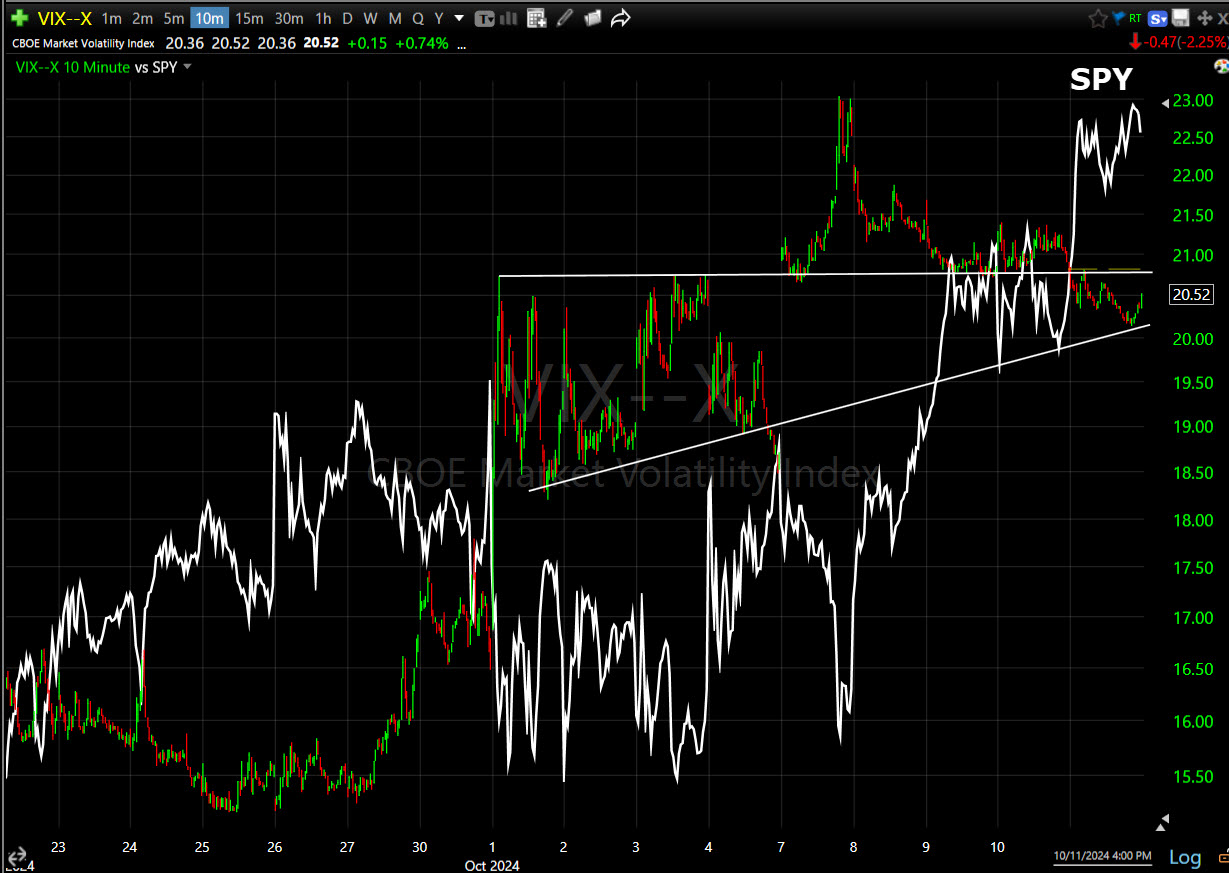 VIX/SPY (10m) We’ve got some of the same positive correlation building that was apparent during the mid-June into July (Q3) period before the market’s nasty correction (NDX down > -15%).
The positive SPX/VIX correlation signal was one of the “Stranger Signals” that you knew about weeks ahead of when I posted the video on July 14th (very timely as the worst part of the sell-off was 3 days after posting the video).
Here’s another way to visualize how VIX’s relative strength is leading the SPX…
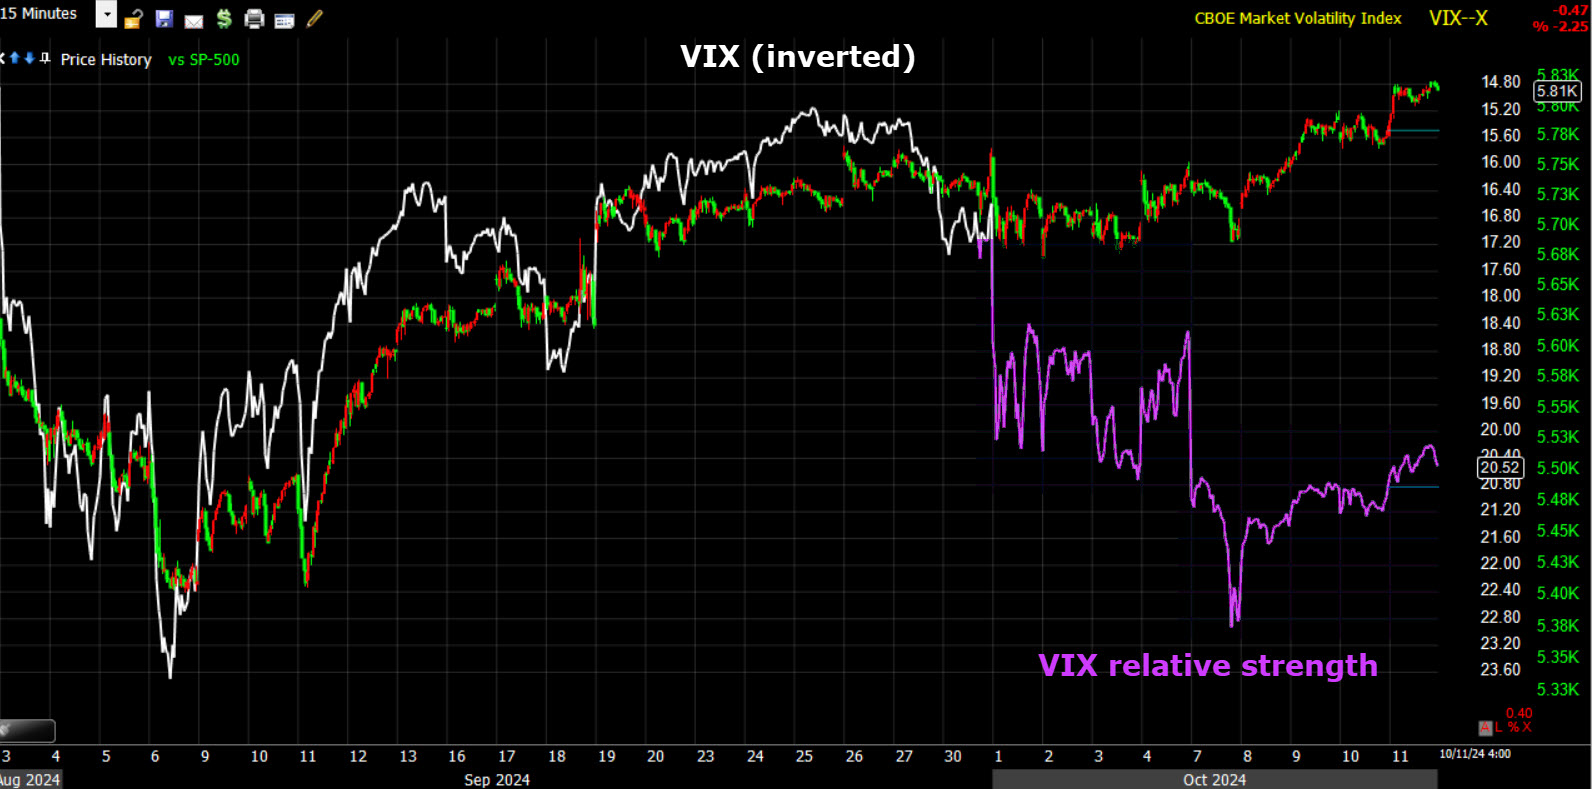 SPX 15m) & VIX (inverted). VIX’s relative strength has been throughout the month of October and all of Q4 thus far.
As for the positive correlation aspect, we’re not there yet, but we’re heading in that direction.
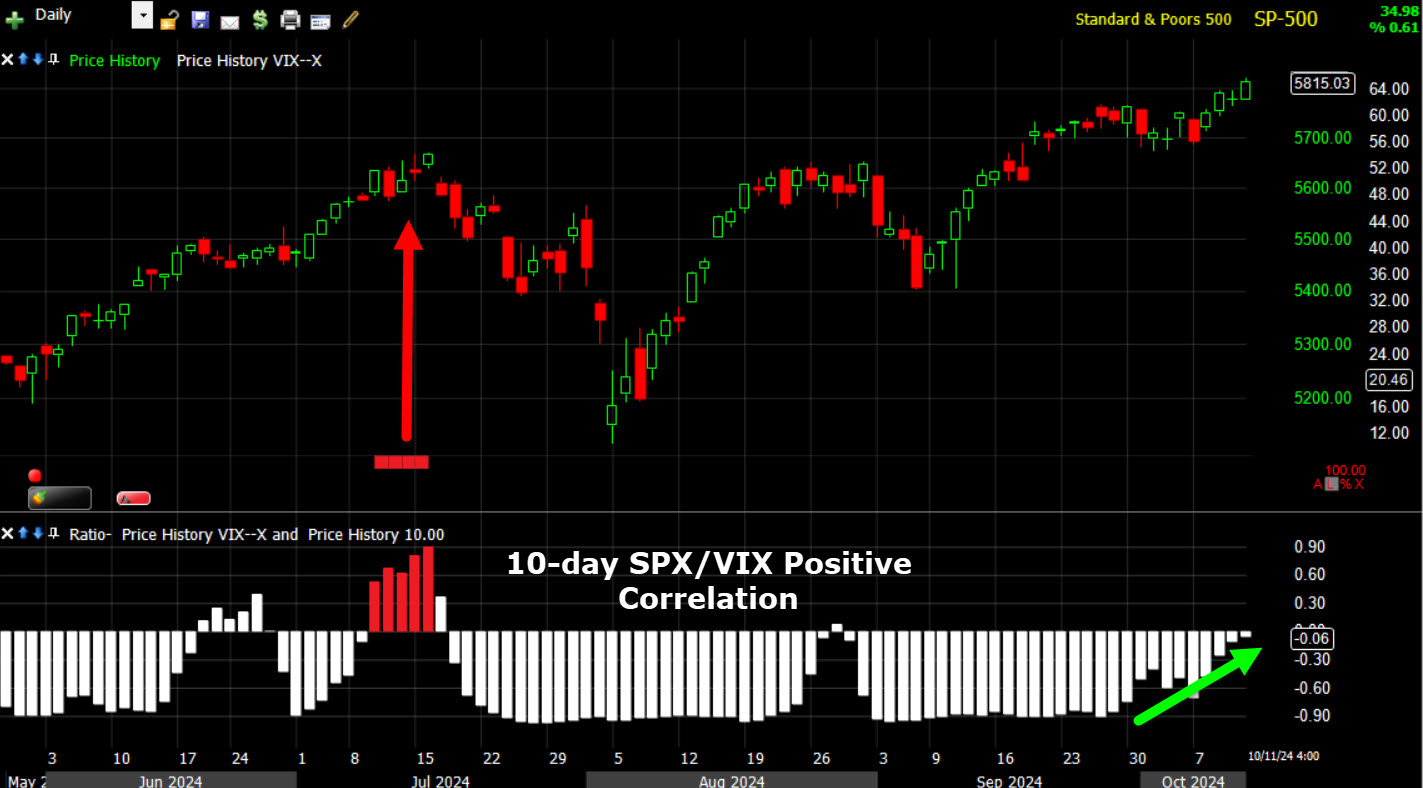 SPX (daily) and below the SPX/VIX correlation with my back tested signal level in red. Notice the 10-day correlation (far right) is rapidly moving toward positive (Green arrow). 10-day correlations correlate to market corrections.
And then we have the long-term 30 and 90-day correlation that have called major market events like the top as the Dot.Com Bubble burst, the Great Financial Crisis that almost turned from recession to depression, 2018’s Vol-mageddon that saw numerous hedge funds that were shorting volatility go out of business overnight and the XIV volatility ETF experienced a termination event , and one this year.
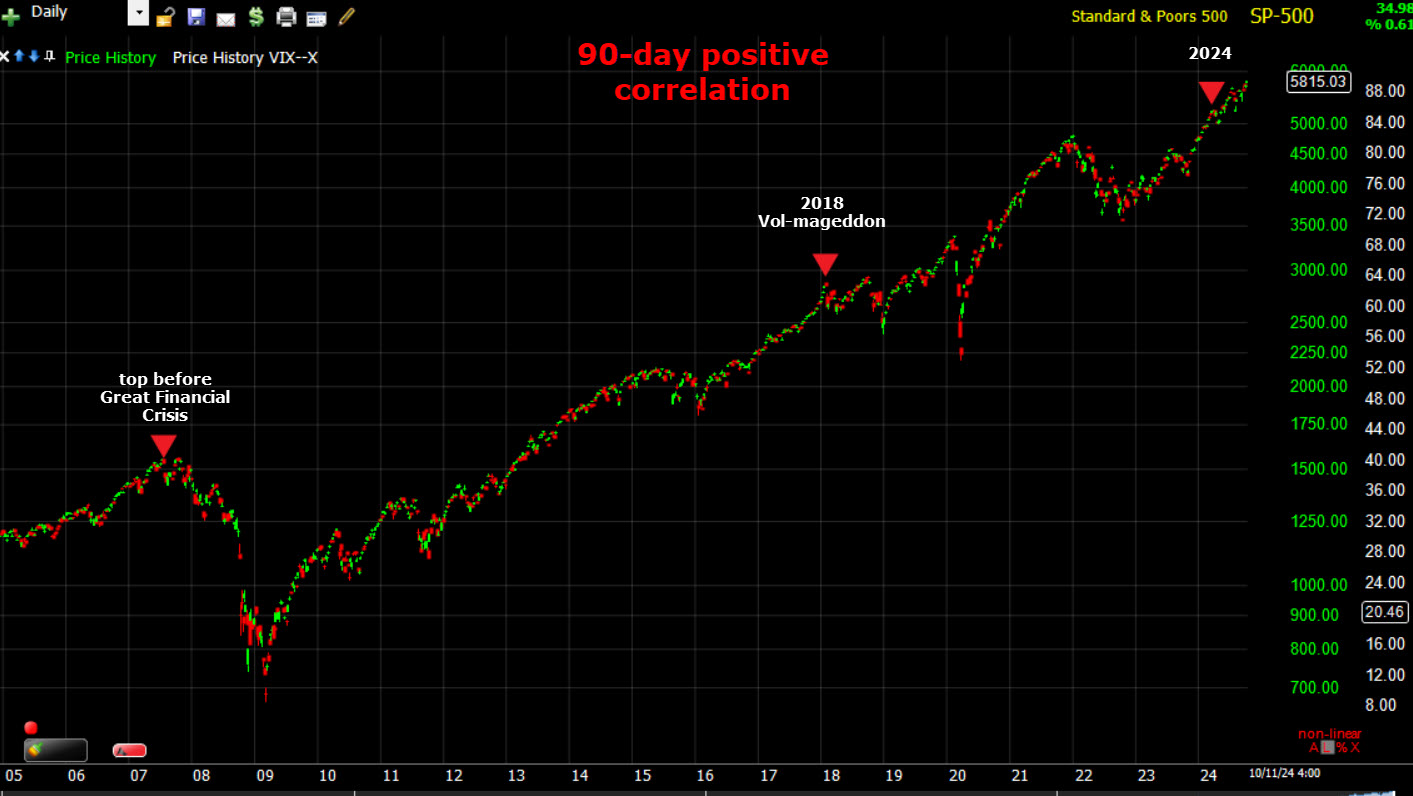
These can be timely, but they also tend to lead the event. They’re a blunt instrument, not a scalpel, but they tell us something big is coming. For instance, the one in 2007 was as the market was making all-time new record highs, but preceded the GFC.
By the way, the Nasdaq-100 has its own volatility index (VXN) and its subject to the same correlation signals…
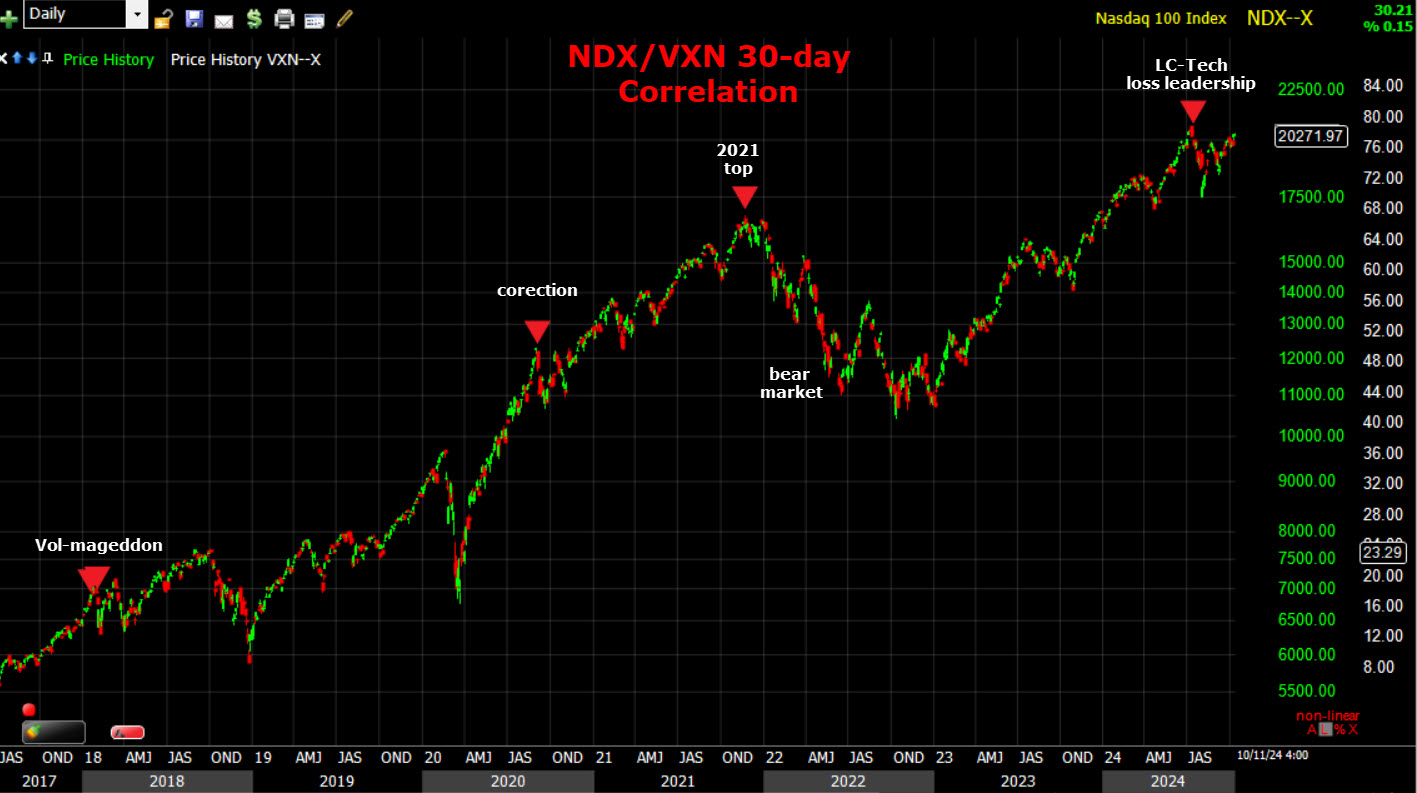 NDX/VXN (daily) 30-day correlation signals marking 2018’s Vol-mageddon, a nasty correction in 2020, calling out the 2021 market top leading to 0’s bear market in which mega caps were the most hated stocks, and we got a signal in July as mega caps and the AI frenzy both lost leadership and have not to this day regained it.
More to the point, we got a rare signal today (Friday). Several of our members had huge winning trades in July to early August; whether QQQ puts or long volatility with $50,000 to $100,000 gains on this signal alone.
The Absolute Breadth Index closed below my signal level (< 14) at 13..28 providing a high probability long volatility/market correction signal that typically takes place over the next 30-days. We went more than 2.5 years without a single signal and now we have the second signal since June/July.
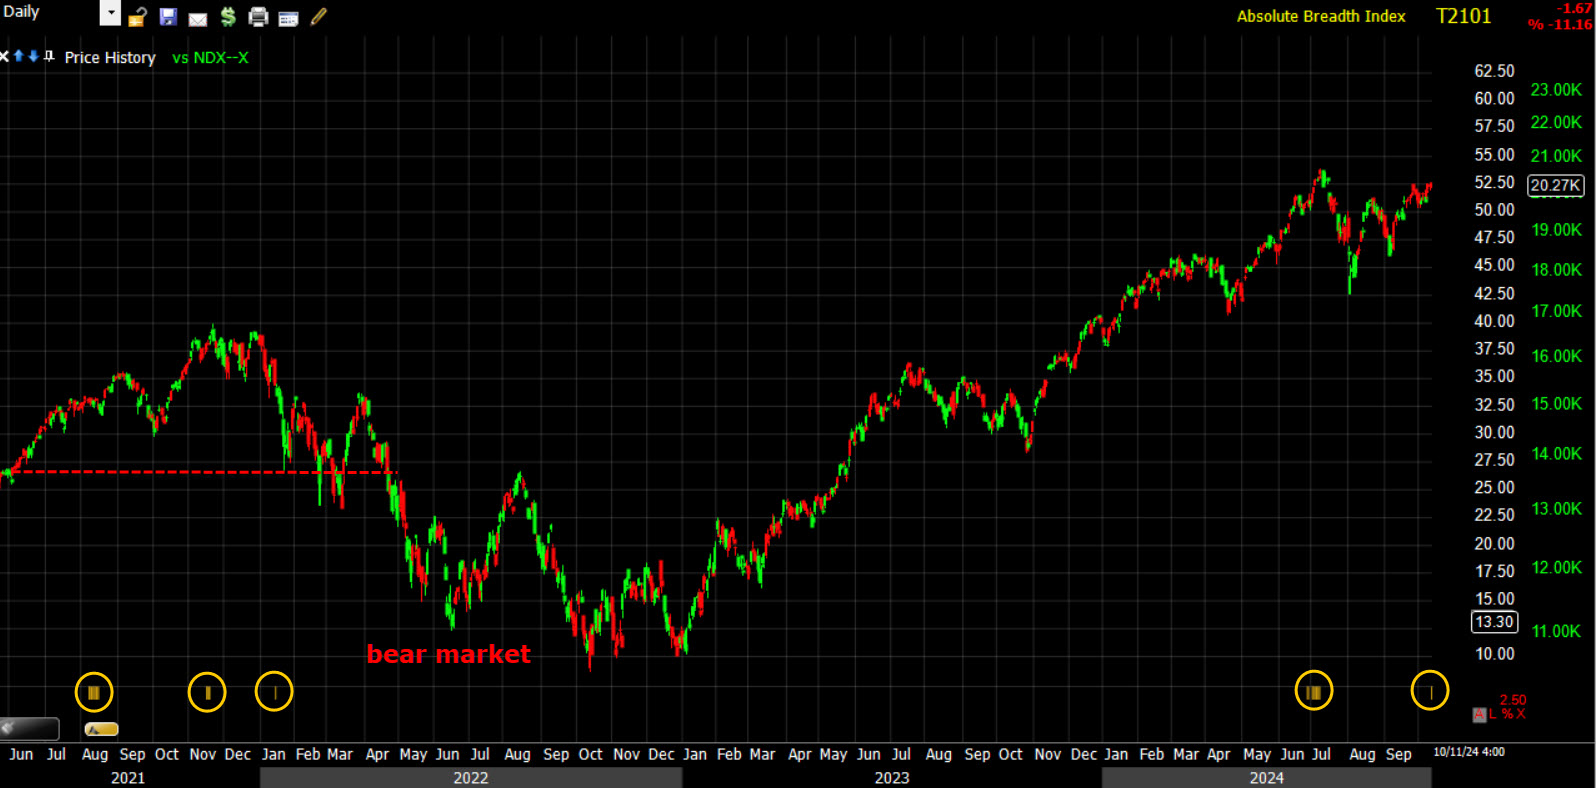 SPX (daily) with ABI signals in yellow. The last set of them prior to June/July was as the market topped in late 2021/early 2022 before 2022’s bear market with the last signal being in January of 2022- that is, until late June and into July ahead of the market sell-off. Now (as of Friday) we have the next one.
The June/early July signals this year led to VIX surging to $65 for only the third time in its history, or over 200% on a close-to close basis, or over 400% on an intraday basis. This is the trade that I know at least a couple members had gains of $50,000 to $100,000. This also happens to be probably the most reliable signal in my arsenal. I’d estimate that it has a 90% hit rate.
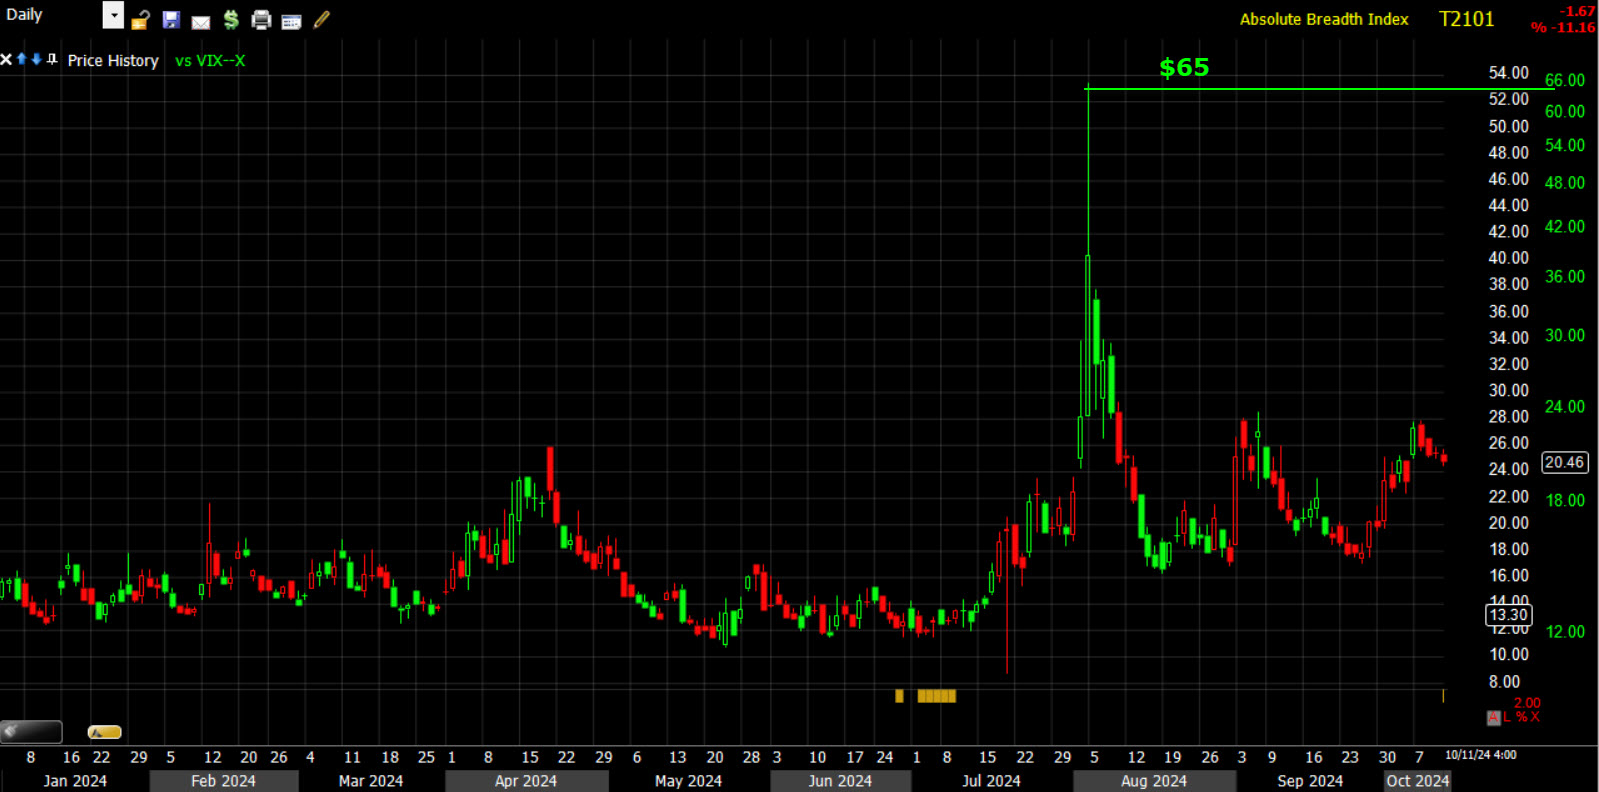 Last cluster of ABI<14 signals (yellow) led to this move in VIX. I think we had 8 or so signals in 10 days, followed by a huge move in VIX and a -15% decline in the NDX from a record high that it has not since regained. The more we get, and the deeper they are, the larger the moves tend to be, but it only takes one. I suspect the fact that we’re getting them fairly quickly again after such a long period of no signals, says something about the overall state of the stock market.
Long-term 3C charts, especially in the Tech-heavy Nasdaq-100/QQQ, suggest the same.
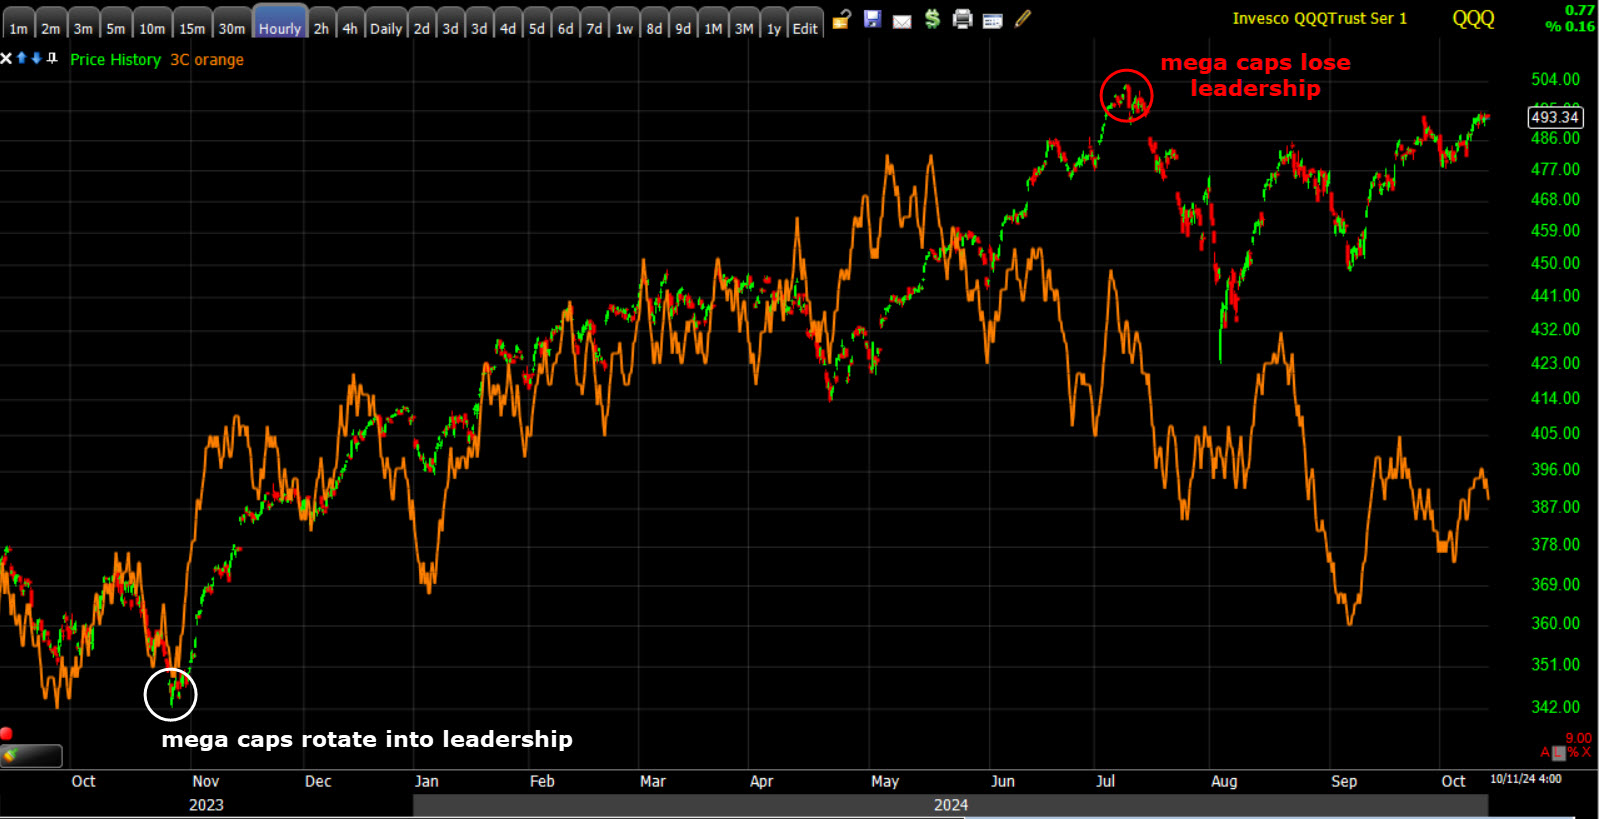
QQQ (60m) – While the bear market put in a low in October of 2022, the Dow led the market off that low for 1 month until November. There was no leadership after that until January of 2023 when the mega caps took over the role of leadership and leadership role had been intact until July of this year. We got the cluster of ABI signals in late June right up until a few days before the NDX’s -15% decline in July. The mega caps lost leadership. That leadership vacuum hasn’t been filled yet, although Small Caps briefly tried to fill the role at the same time large-cap tech lost leadership, and Small Caps failed.
Here’s what that looked like, literally to the day…
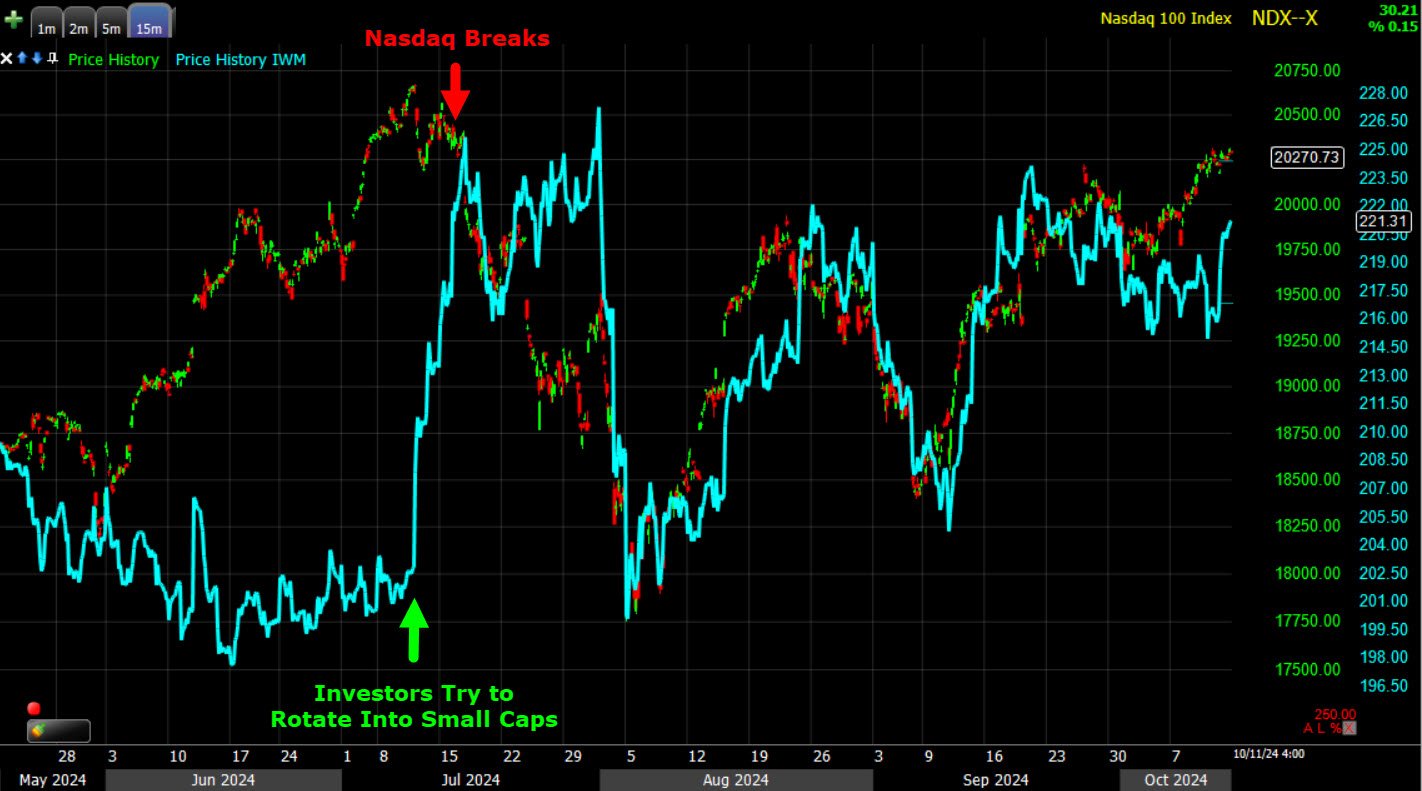 Investors rotate out of Large-Cap Tech-heavy Nasdaq-100 (red arrow) and try to rotate into Small Cap IWM (green arrow). The rotation to small caps failed.
Speaking of the Mega Cap leadership and their importance as the most heavily weighted S&P stocks…
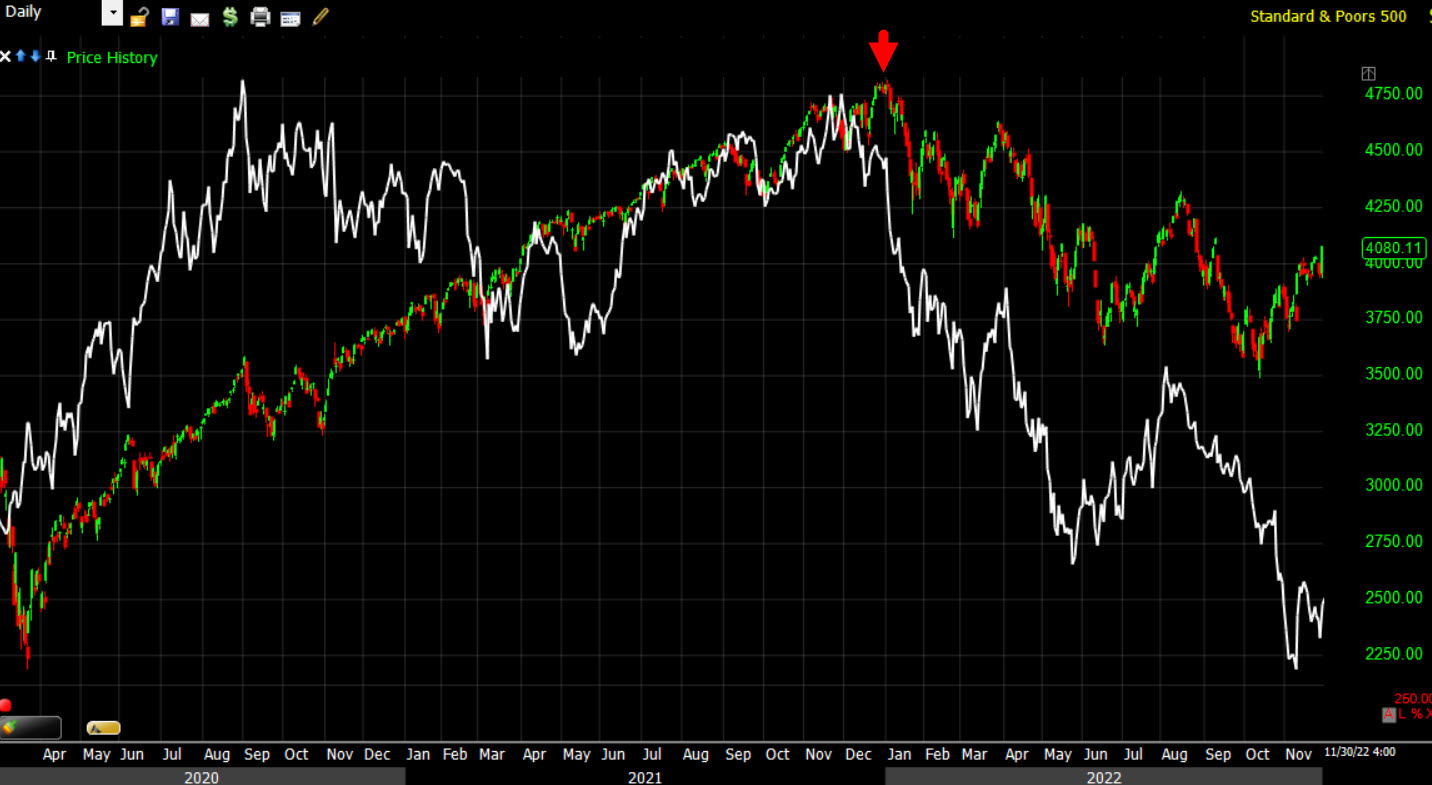 This is the S&P and the relative performance of the mega-caps vs. the S&P (white) into 2021’s top. Notice the mega caps’ loss of leadership in late 2021, and then their severe underperformance in 2022’s bear market. I often say that mega caps were the most hated stocks of that bear market, until they reestablished their leadership role in Jan. of 2023.
Here’s the same chart rolled forward to the present…
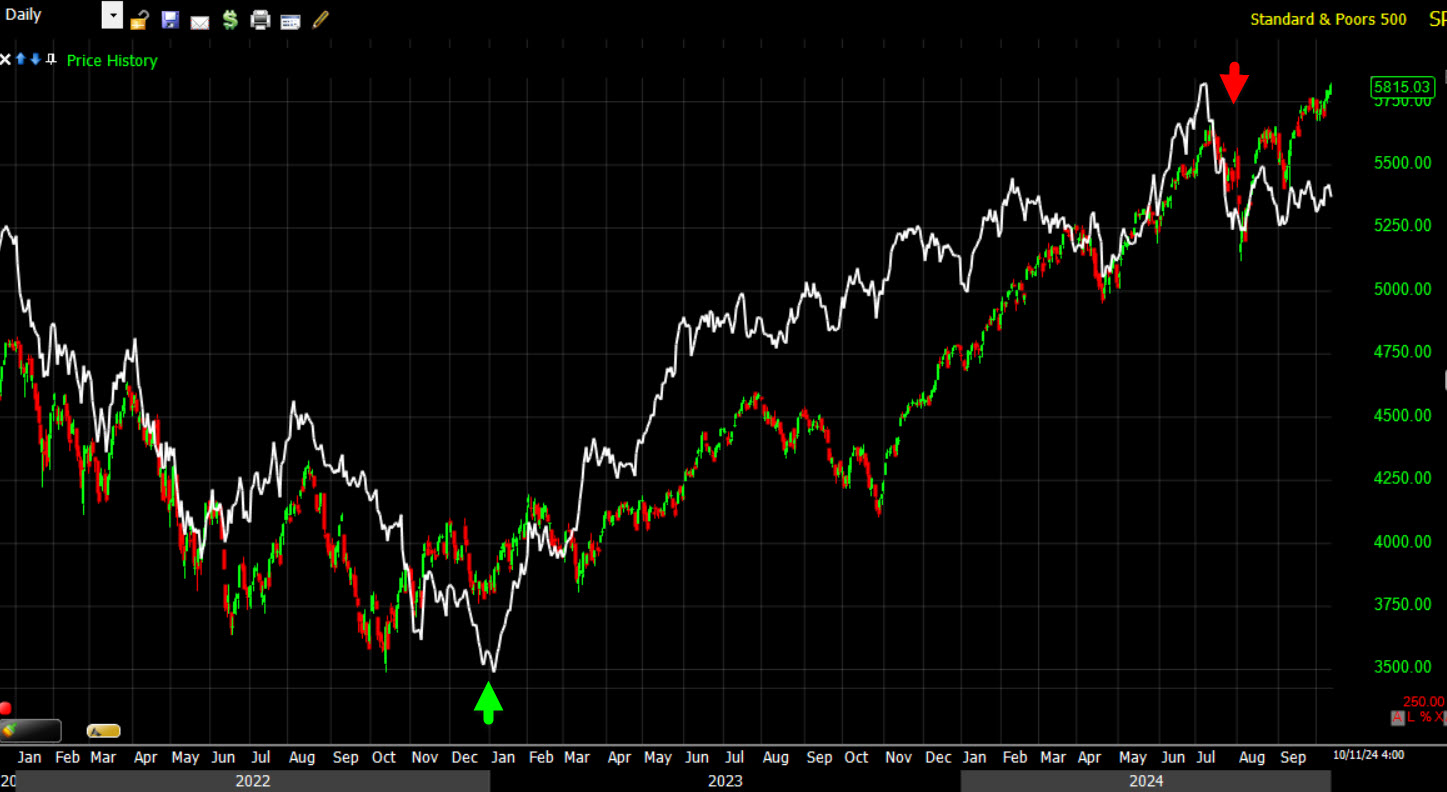 Mega Caps reestablish leadership in Jan. 2023 (green arrow) and lead the benchmark index higher, but notice what happened in July (Q3) of 2024… their leadership cracked like late 2021’s top.
This is where I remind that Small Caps “tried” to rotate in from a nearly year-long range and that lasted all of 2 weeks before failing and leading into 2022’s bear market. This is a late stage bull market dynamic seen over and over. These are the two most recent examples. Because investors are only interested in mega caps, Small Caps do nothing but trend in large lateral ranges. The example from 021 was a near year-long range. The current example is a lateral range over years.
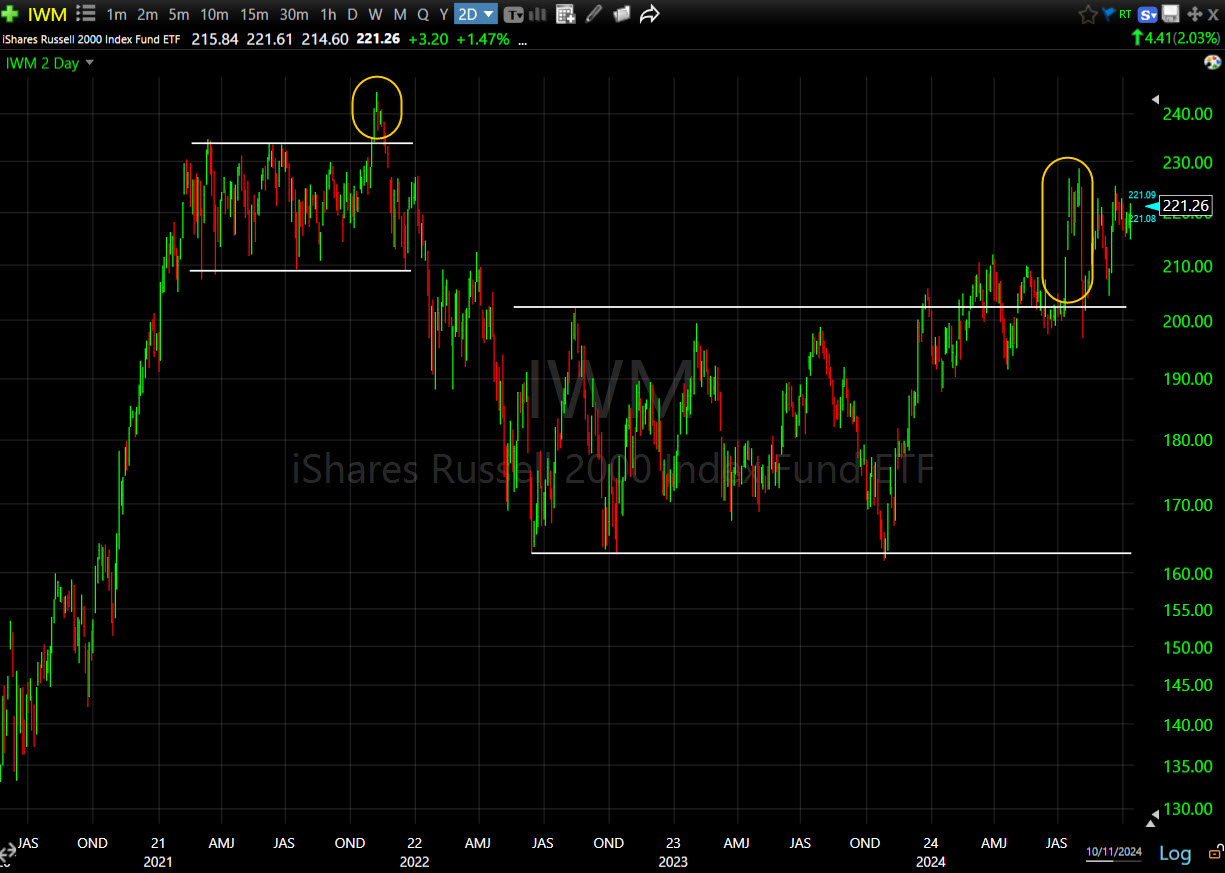 IWM (2D) You can see it highlighted in yellow at the end of 2021, and again the attempt in July of this year in yellow to the right.
While we’re looking at fractals, there’s this eerily timed fractal that I highlighted earlier this week in a Daily Wrap post of the Fed cutting rates for the first time in the economic cycle on the very same day, September 18th, 17 years ago to the day in 2007, and the exact same 50 basis point rate cut as we got in September. Even more eerie is the S&P making a new record high the same day as this week (Oct. 9th) except in 2007. Back then it was the final record high before launching into the Great Financial Crisis and recession. As I’ve often said, the Fed tends to cut rates right into a recession. The very loose rule of thumb is, “Sell the third rate cut.”
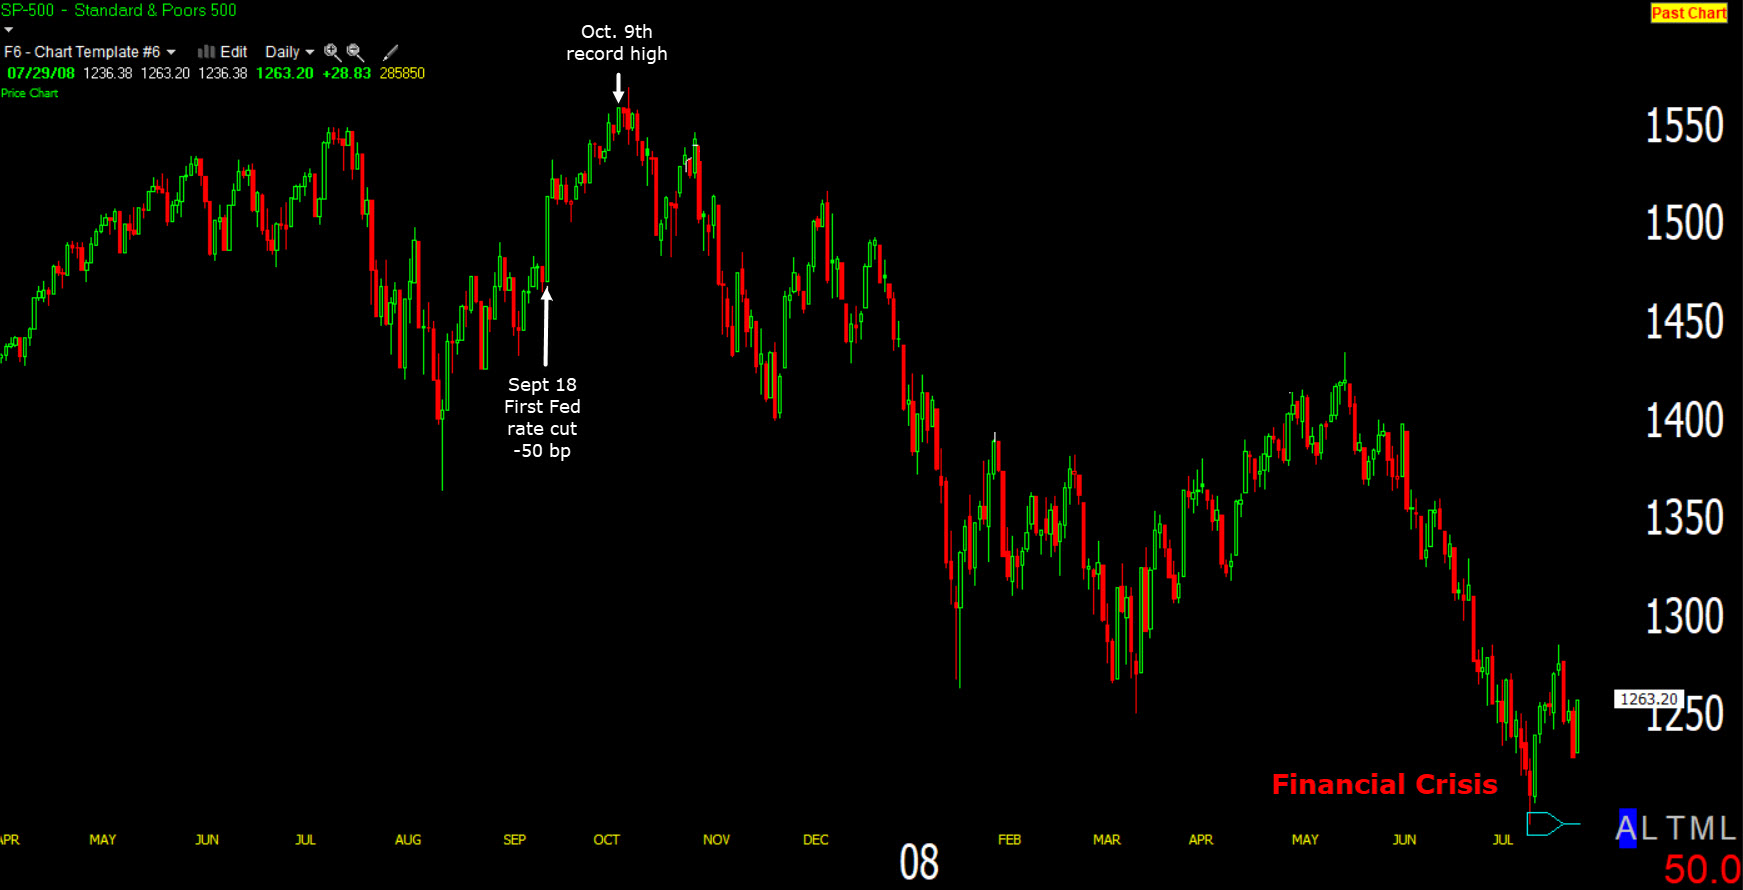 SPX (2007-2008) showing the Fed’s first rate cut on the exact same day, September 18th, but of 2007. And the SPX topping in October – this same week 17 years ago.
The charts above show that while history may not repeat, it often rhymes.
Speaking of leadership, the AI frenzy driven by several key semiconductors names, broke in July too – led by the same cluster of ABI signals. You know what I think probabilities say about this price pattern and volume confirmation…
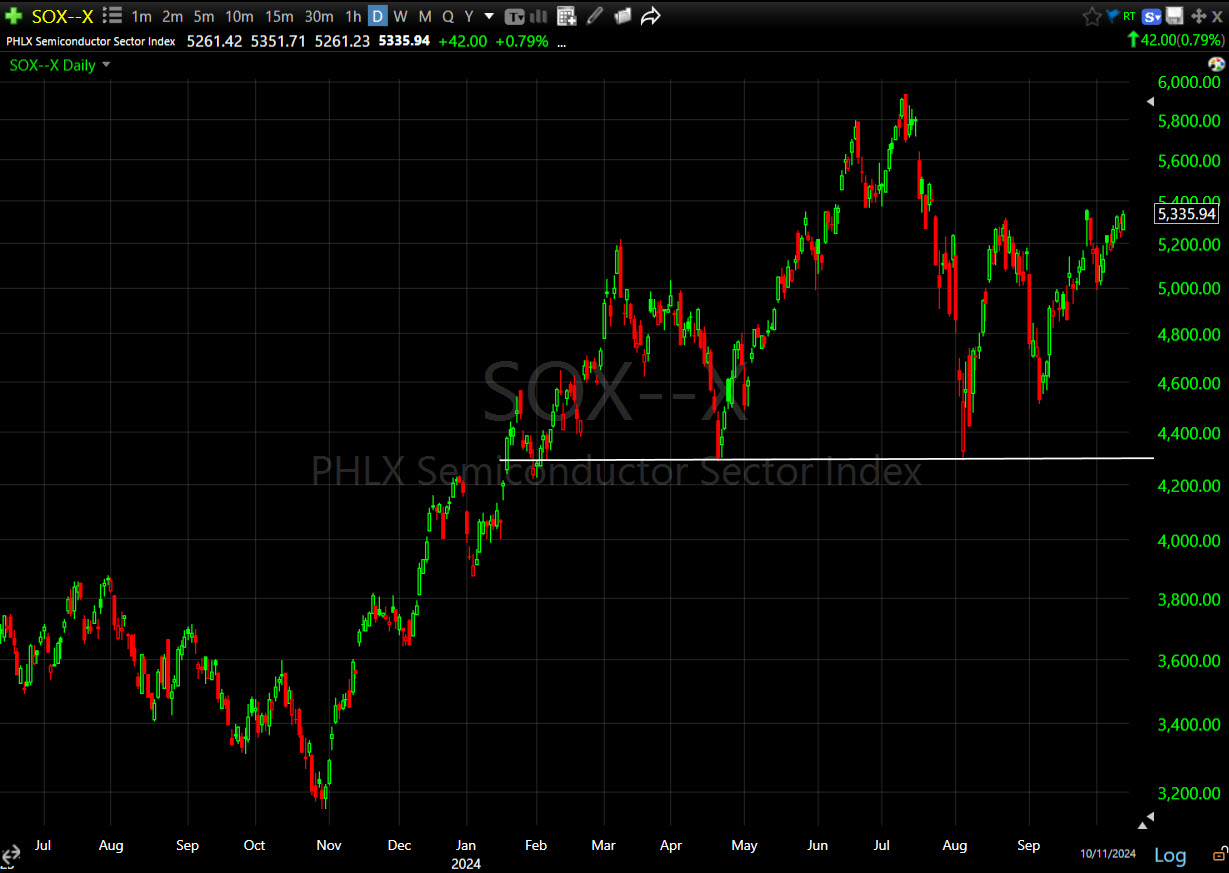 SOX Index (daily) – If we don’t see a new higher high soon, and price turns down near current levels, then the H&S looks very likely with a measured move that retraces all gains since the October/November pivot low. That would be a huge move from current levels – over 2,000 points.
Gold looks set for its next breakout attempt, which is even clearer on GLD’s price chart…
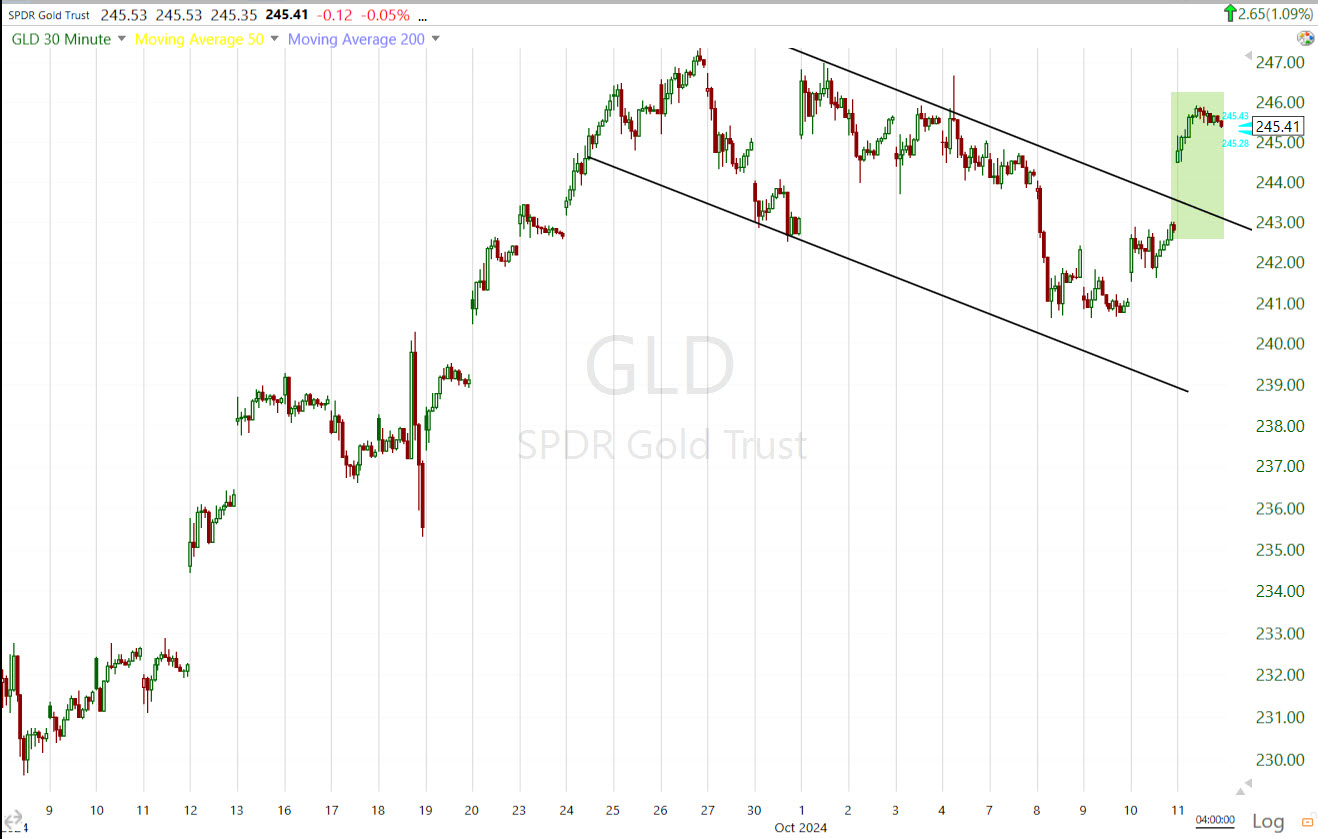
GLD (30m)
EZA (S. Africa +1.55%) also looks like it’s starting its breakout from a bull flag.
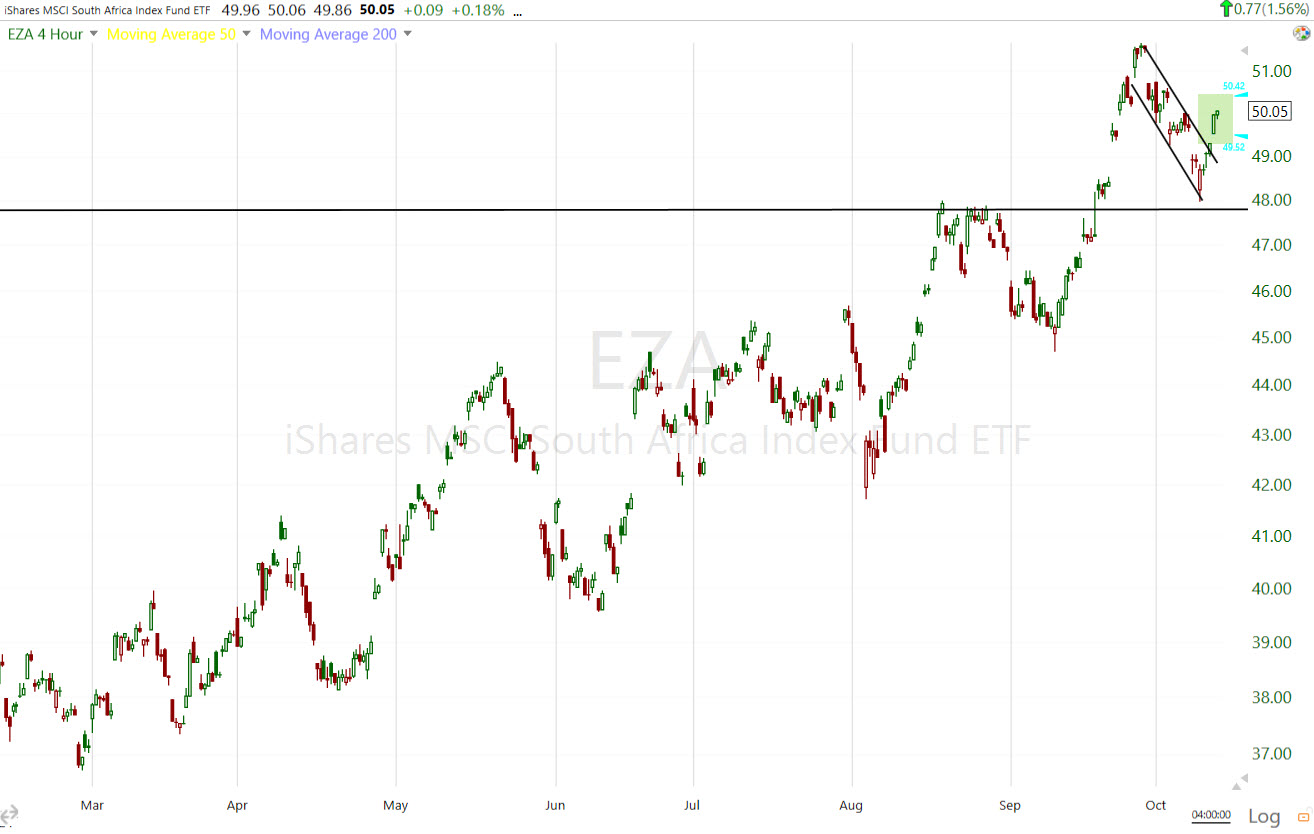
EZA (4H)
The U.S. Dollar’s strong bounce from Sept. 30th (starting with a safe-haven bid as Iran retaliated against Israel) is starting to slow in momentum with the last 2 days posting Star or Doji Star (loss of momentum) candlesticks.
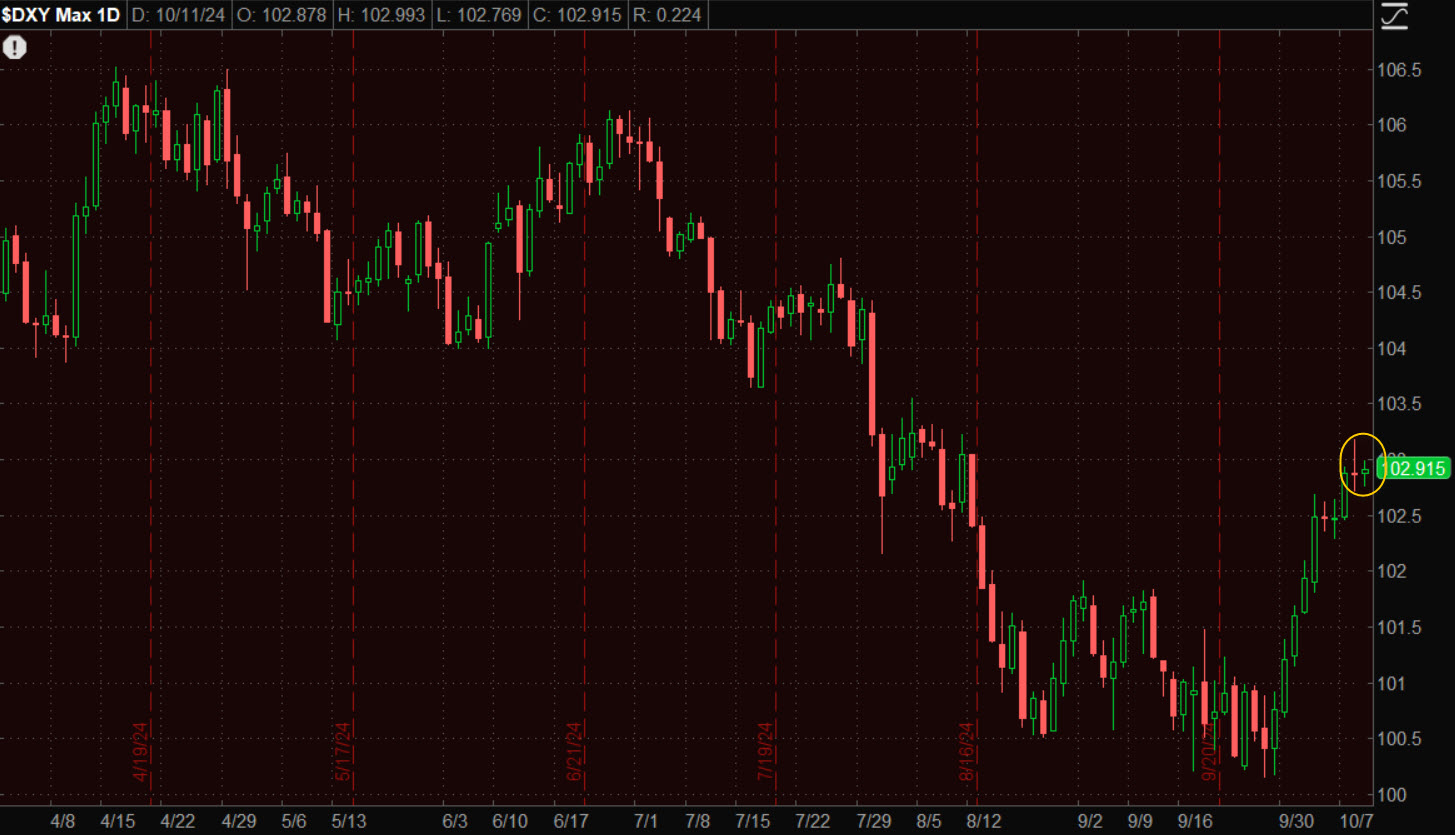 Dollar (daily) testing near August’s high.
And price’s rate of change is slowing…
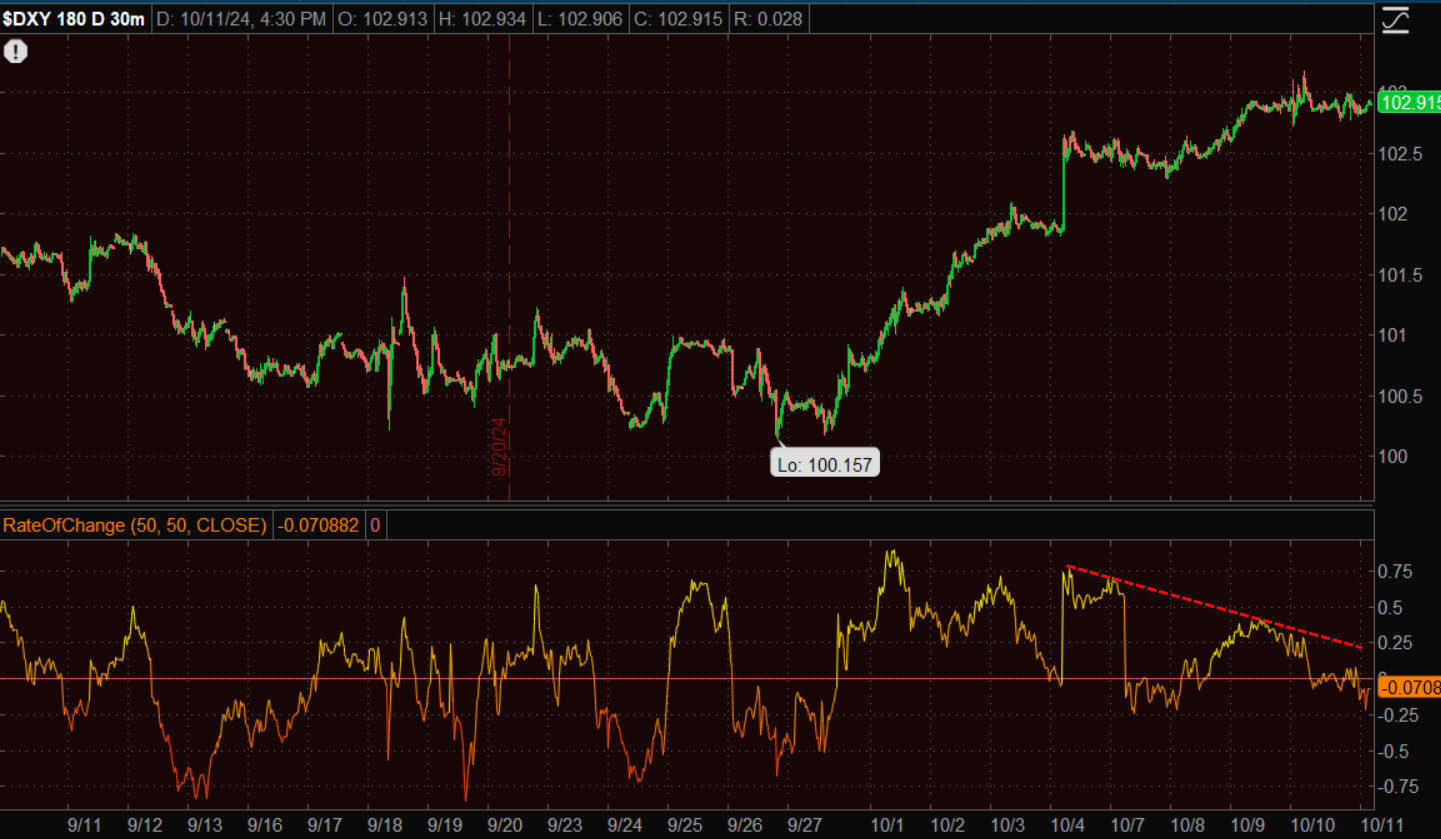 Dollar (30m) & Rate of Change.
If the Dollar’s advance loses momentum, we should see commodities like Copper, Crude, PM’s like Gold and Emerging Markets start to gain more upside traction, and that would resume the reflationary forces we’ve seen since shortly after the FOMC rate cut that’s sent yields higher since!
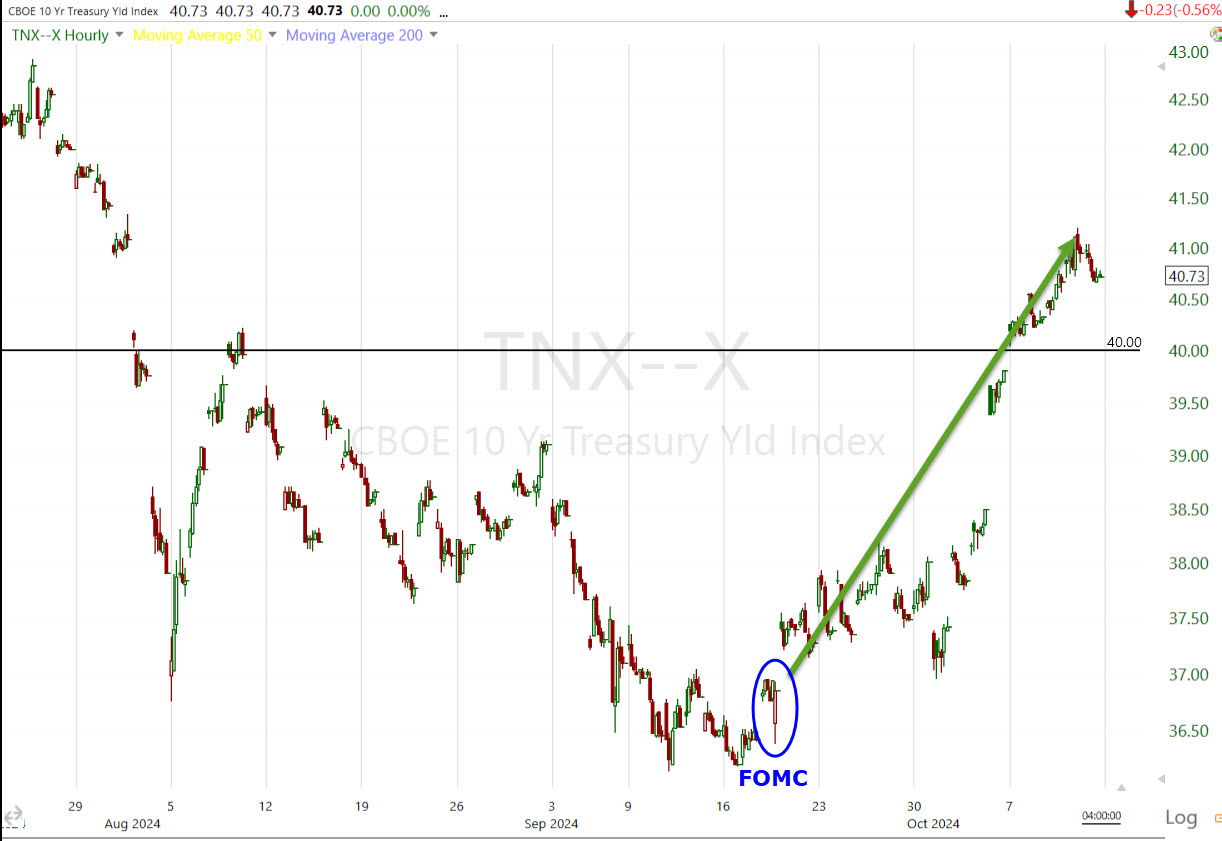
10-year yield (60m)
It’s these same reflationary forces that have completely knocked a 50 basis point rate cut off the table for November’s meeting (from what was a probability just over a week ago, and even has the market pricing in less than (2) 25 bp rate cuts for the rest of 2024’s November and December meetings), catches on again, the Fed is going to have a hard decision to make come November/December as it was this same kind of reflation that killed the market’s expected 7 rate cuts for 204 starting March
China was an absolute mess this week coming back from the Golden Week holiday. Chinese stocks saw the most intense volatility since their meltdown in 2015 as investors demanded even more stimulus than Beijing “pledged”. I suspected this would happen, writing about it as early as Sept. 26th…
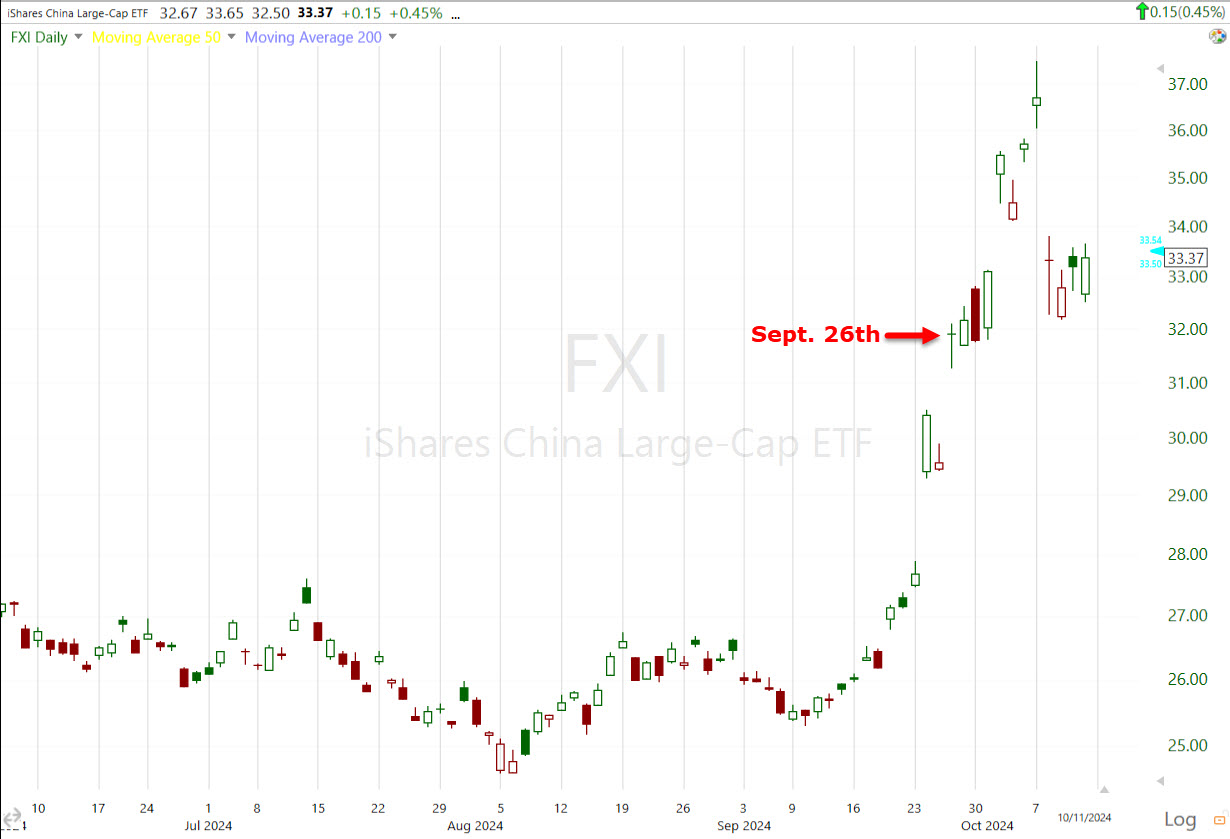
FXI (daily) dropping -9.15% Tuesday, Oct. 8th.
In the Daily Wrap of September 26th I wrote,
“The Fed opened the door to global policy easing and China pranced through it. After 2-days of monetary policy easing from the PBoC, China’s politburo stepped in with a rare September meeting, vowing to save the private economy, stabilize its property sector from further slumping, boost its stock markets and ensure necessary fiscal expenditures.
The problem so far is that these are vows, not actions, although it’s very likely they will follow through, but the market will want to see the scale. Once the hype and chasing die down, traders may force Chinese stock prices lower to force the Chinese government to take the actual actions and gain more concessions on easing.”
That’s exactly what happened. On Thursday China’s finance ministry revealed plans to hold a press conference this Saturday. If China announces more stimulus measures this weekend, that too could send commodities like Crude and Copper higher. I suspect they will announce more, the question is whether it’s enough for investors to buy as the rally we had seen on PBoC cuts and fiscal stimulus pledges, was mostly short covering.
Moving forward, we should see a relatively dull overall trend, but some intense day-to-day volatility, as earnings season kicked off on Friday, October 11th with the big banks. That also leaves the market in buyback blackout window, but then November and December comprise the best two month period of the entire year for stock buybacks.
We cannot know what happens with earnings growth yet. We can’t know what happens in the middle east with most still expecting Israel to retaliate against Iran. The question in my mind is whether Israel does so before the U.S. elections, and whether it’s another face-saving retaliation with no real teeth. Or does Israel go after Iran’s oil infrastructure (going after the money) and send oil prices soaring? That would obviously compound the reflationary dynamics we’ve seen since the Fed’s 50 bp cut. We cannot know what happens with the U.S. Presidential election, and potentially as important, the Senate. What party wins has very different implications for the stocks/sectors that benefit and those that don’t. The Republican’s have a chance to flip the Senate. If they do so and Trump also wins, the stocks that perform and those that don’t are very different than if Harris wins and the Republicans don’t flip the senate.
What I suspect is that the Fed cut too aggressively — unless, as Powell and the FOMC Minutes hinted at, the Fed is relying on their contacts and the beige book because they don’t trust the government Payrolls data — and it’ enough of a reflationary bump to keep the Fed’s rate cut path much shallower than the soft-landing crowd hopes for. Combine that with weaker Payrolls than what’s being reported (we did just see nearly a million jobs revised away for the year ending March 2024, so there’s precedent) and you have the perfect storm in which the Fed can’t hike to fight a bump in inflation because it risks the labor market, and they have trouble cutting to support the jobs market because of the risk of reigniting inflation (1970’/early 1980’s dynamics).
What we do know right now is that we just got one of those very rare, and very accurate ABI signals. Do we get more in the coming days? And are they deeper than what we saw today? Today’ signal alone suggests we have some serious volatility ahead – within the next month – which ironically covers earnings, the elections and the November FOMC!
I’ll keep you updated on developments with that signal and any others as a few are building. In the meantime, recent action continues to suggest to me that traders/investors are taking some profits on strong YTD gains, but also still seem to be hoping they can run out the clock and hold YTD gains by year end. With that ABI signal now on the chessboard, there’s a reasonable chance that opportunistic profit taking turns into something worse. If investors see those gains rapidly dwindling, they’ll be more apt to take profits in a more aggressive way and we could end up with a feedback loop that eventually mirrors the kind of distribution we were seeing on 3C in Large-Cap Tech around mid-June and into the start of Q3. Ironically that’s the last time we got a cluster of these ABI signals.
Interesting things are happening again… Strange Signals.