Understanding the Bull Trap
What is a bull trap? Take a look at this chart of XLF
About the second week of October XLF broke out through a healthy resistance level. Luckily for those paying attention the next day it formed a Harami reversal (Japanese call it “mother with child” we cll it an “inside day”. Many traders will but the breakout thinking a new trend or leg up is starting, but once it falls back below the resistance level, those who bought are now at a loss. The longer they hold and the more price declines, the bigger the loss.
Back to AAPL….
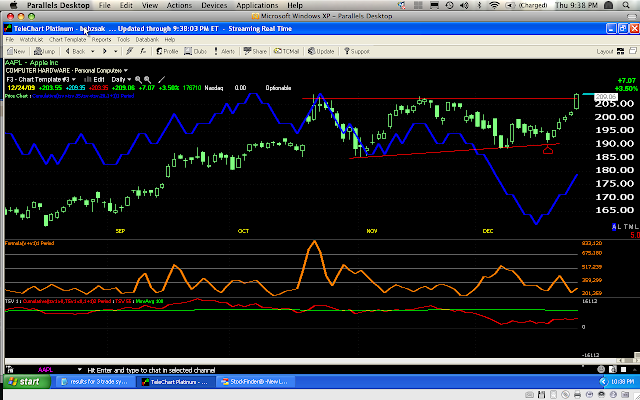
As you can see, on a closing basis AAPL broke out, however, 3C is extremely divergent. The middle window is cumulative volume and in early December it started falling on the rally and rising on the declines-another bad signal and in the bottom window is a long term TSV55 which is also negatively divergent. I’ve had my suspicions about the overall market forming a bull trap. Other than the breakout, there is nothing I see to support this as being a strong and valid move. Those who bought it should keep a close eye on it and dump it quickly should it close back under former resistance, now support, around $207.00
If this is a bona fide breakout, the 3C should move up quickly and TSV as well, volume should start to move up and price appreciation or follow through should be evident in the next week.


