Weekend Update: Bull Trap Setting Up?
I was going to put out a video this weekend. I spent most of Sunday outlining the key points to cover on a Word document. I like to have an outline so I’m covering relevant information and not stumbling through a video. What I realized was that so much has happened the last month, and with so many December cross-currents, the average non-member viewer would have no context to understand the video, but members would, as you get bits and pieces of context every day.
Here are some key points I was going to cover in the video.
1) Mass Psychology/Sentiment – I can’t overemphasize how much mass psychological sentiment plays into the current market environment. Price is almost always a representation of mass psychology, but when mass psychology gets to extremes, it becomes even more important as a driving force in price action. I’m sure you can remember back over the last month and recall at least a few instances of me talking about the “pendulum swinging from overly bearish, to overly bullish.” That describes the current market environment as a result of overly bearish sentiment at the October low, heading into the November-December rally.
Here’s an example of extremes in sentiment. I’m using the Fear and Greed Index as it’s easily accessibly to anyone, but JPM and Goldman’s proprietary sentiment indicators closely match the F&G Index.
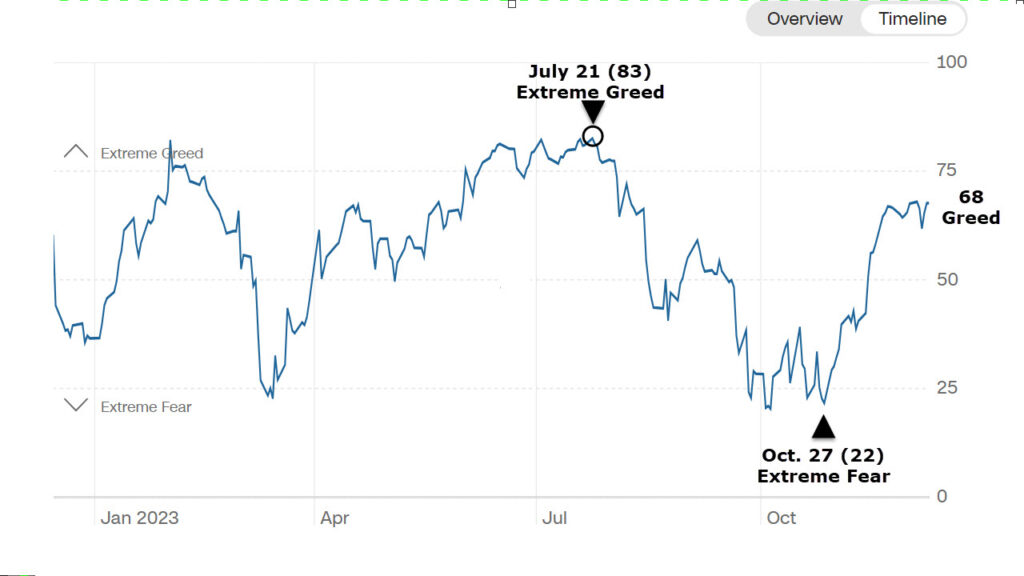 Fear and Greed Index (daily). The Extrema Greed reading of 83 is late July, just days before the S&P’s failure at $4600 and its Key Reversal Dat, which was also the very top/high of the H&S pattern in SPX. The F&G decline to Extreme Fear (22) by October 27th (as numerous averages fulfilled their Head and Shoulders’ downside measured moves) is the pivot point, even though the index hit 18 earlier in October. This is a perfect example of the extreme mass psychological sentiment swing from extreme bullishness (at SPX $4600) to extreme bearishness following 3 months of a sub-intermediate downtrend down to $4100. It was less about the price decline, and more about the steady 3 month sub-intermediate downtrend that drove hedge fund bearishness to extremes.
This is just 1 measured of Sentiment, but generally speaking, and watching many other assets, sentiment is getting frothy, even early stages “euphoric” and moving toward Extreme Greed, but is not there yet. With so may local resistance ranges, like the SPX $4600 level, all near by, it creates an almost irresistible bull trap. SPX would sail through $4600 in a bull trap scenario, but just not holding the level for very long.
Beyond mass psychology/sentiment extremes, the main drivers of November’s rally are:
1) Corporate buybacks. In the month of November (according to Goldman Sachs Prime data, and others) Corporate buybacks hit a record high as the buyback window fully reopened late October as earnings season wound down. The corporate buyback window just shut Friday so that’s a source of support that’s of the chess board for now.
2) Hedge Fund Short covering. My Most Shorted index was at the lowest level in late October since 2018. According to GS Prime (and other sources), by the end of October hedge funds were the most net short in the history of GS records (circa 2010).
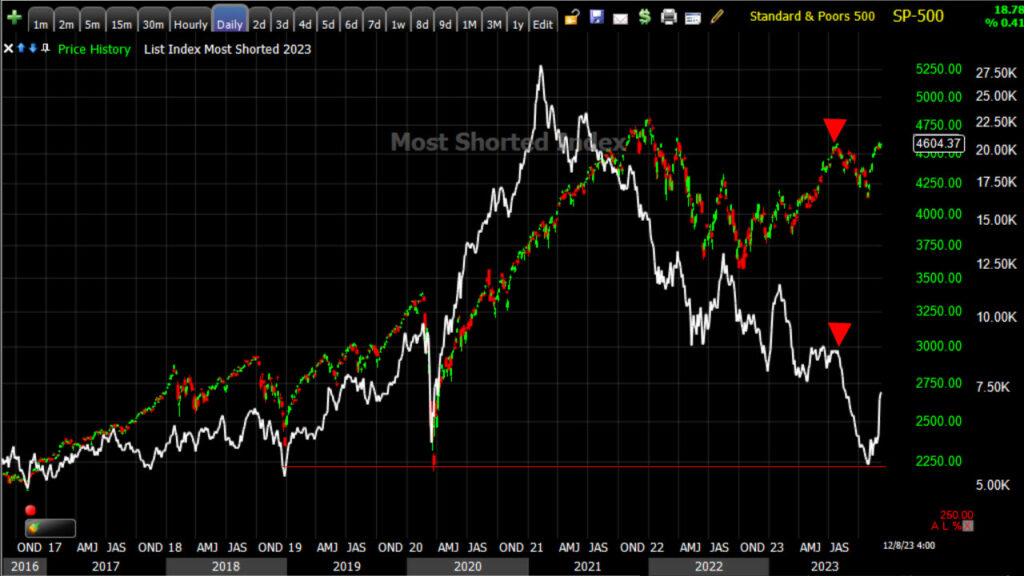 SPX (daily) and my Most Shorted Index was at the lowest level in years by the end of October. The most intense shorting occurred at the end of July (S&P’s Key Reversal Day and top of H&S patterns as SPX failed at $4600 on July 27th) and ran right into the end of October (the two red arrows).
Shorts had been piling in from late July to late October during the 3 month sub-intermediate downtrend (between the two red arrows). By the end of October hedge funds were the shortest since 2010, and mostly in the worst performing stocks of 2023 – the cyclical and defensive sectors (as mega-caps led 2023 gains).
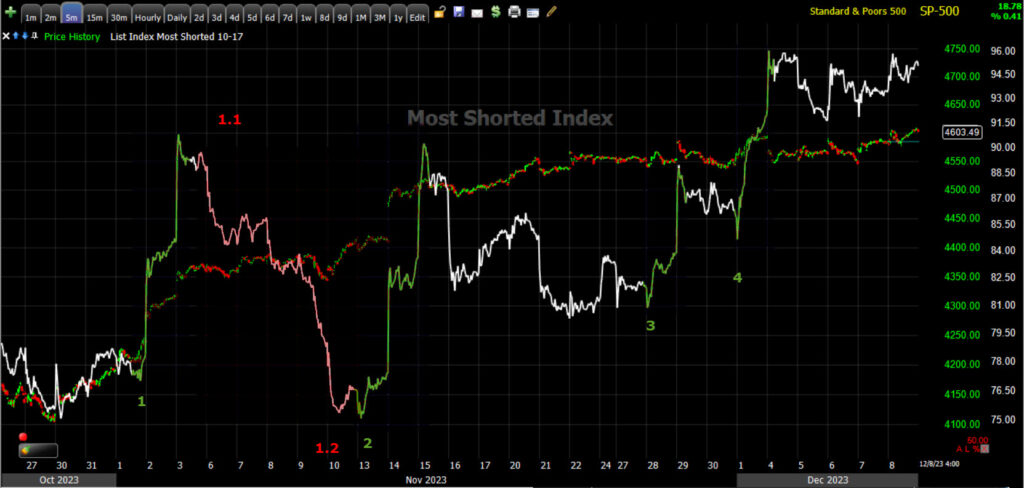 SPX (5m) and my Most Shorted Index (white, but color coded).
1) We saw one of the strongest short squeezes in years. Remember the hedge funds had been aggressively, non-stop shorting the weakest performers of 2023 from late July to late October and were massively squeezed.
1.1) I didn’t understand the hedge fund reasoning to aggressively short the market again, other than, “Look how much the market rose after the first short squeeze, so lets fade the gains”. From my perspective, there was no market signal and no logical reason for shorting the market again, but the hedge funds did it. The degree of short selling sent my Most Shorted Index all the way back to October lows, or the lowest/most short in years (since 2018). Perhaps it was due to a massive bearish bias the preceding 3 months and a week or so of rally/short covering wasn’t enough to break their bearish bias of the prior 3 months. This led to another powerful short squeeze event.
2) The hedge funds were short squeezed a second time in 2 weeks.
3) Another short squeeze
4) Another short squeeze. The first two short squeezes at 1) and 2) were the most powerful and 3rd and 4th less so, which has led me to wonder, “Are the hedge funds finally getting the message after having their faces ripped off numerous times on four short squeezes?”
What were they shorting all of that time? The worst performers of 2023. These were largely stocks within cyclical and defensive sectors.
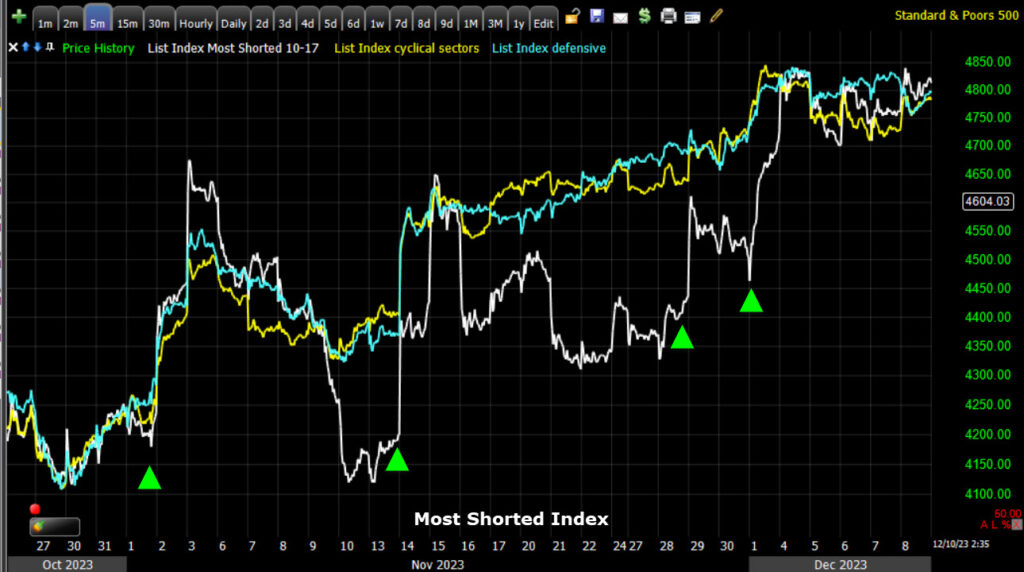 My Most Shorted Index in white, Cyclical Sectors (equal weight) in yellow, and Defensive sectors (equal weight) in blue. As you can see, the bulk of their gains in most hated cyclicals and defensive stocks were driven by short squeezes.
Now…
“Hedge Fund flow is shifting. Overall hedge fund positioning is starting to flip and was net bought for the first time in four weeks last week, driven by both long buys and short covers (1.5 to 1). Net buying in Macro Products was the largest in nearly 5 months, driven by long buys and short covers.” Goldman Sachs Prime
It “seems” like hedge funds have started giving up on shorting price strength seen all November, and are starting to flip long.
As such, hedge fund short covering responsible for a large part of the rally of late October lows, “may not provide” the intense short covering that’s largely driven November’s gains.
My MSI shows that hedge funds haven’t covered “all” of their short selling from late July (see second chart above of SPX and my MSI and the red arrows) so there’s still a potential for them to do more covering if we get a head fake/bull trap scenario defined by me as: SPX clearly above $4600; Dow above its ascending triangle around $36,300; NDX above 4 week range at $16,200; Small Cap IWM breakout above $188.
The key takeaway is, Hedge Fund short covering has most definitely exhausted a large portion of its upside potential.
4) CTAs (Commodity Trading Advisors) – The third major driver of November rally gains was CTA leveraging up long. CTA’s are not discretionary like Retail or Hedge Funds, but trend followers. Certain price levels are hit and they leverage up or down. It’s a rules-based trend following system.
The latest CTA data (per Goldman Sachs) shows that CTA’s added $225bn worth of equities, and their long exposure is at the highest in eight years. I expect this means that CTA’s are “full” or near full long net exposure and if they have any room, I suspect they don’t have much room to add much more long exposure. Last week CTA models suggested that CTA’s were now at a point they were just as likely to sell/go short here as add further long exposure, but this depends on where price is relative to their models/triggers. A head fake or false/failed breakout could see them rapidly deleverage long exposure and start moving toward short exposure.
5) RETAIL BUYERS – Retail is almost what you might consider, “The dumbest money” in the market and they, “contrarian”, but there have been examples in which they’ve actually been positioned better than the “Pros”. Generally speaking, however, extremes in retail positioning are often a contrarian signal.
Retail has been feeling the FOMO and not wanting to be left behind. Years ago (late 1999’s) I discovered through a number of scans and trading systems I was developing, that at the end of a bull market (or in the current context, the end of a massive rally) – retail bought the crappiest, cheapest (sub $5) stocks and they did so with conviction.
According to Goldman Prime’s data, “Volume in the sub-$1 stock is surging, with exploding retail participation, accounting for 30% of the total trading volume on Friday, compared to the 30-day average of approximately 10%.” -GS
I’ll just point out that if you follow retail flows like this, they closely mirror sentiment indicators like the Fear and Greed Index.
Corporate buybacks are no longer a driver of immediate further upside, hedge funds are starting to capitulate on their bearish positioning and starting to go long, CTA’s are either at MAX-LONG, or near max-long, and Retail FOMO is kicking in.
The key points are that most of the factors that drove November’s rally, are fading or are no longer part of, the equation, while others signify that we are nearing the mass psychological “euphoric ” stage.
You already know what the 3C charts look like…Some of the latest updated 3C charts are here in Friday’s Early Update.
The gist of them is that the strong support for the November rally has faded. The support at SPX $4600 now vs. the support when it failed in late July, in NOTABLY lower. This sets up a kind of blow-off scenario, which I think could manifest in a big head fake/bull trap.
The Fed…
The market is pricing in a 71% probability of a Fed cut at the March 20th FOMC, and 100% probability May 1st meeting.
Historically, what happens in this scenario? When 1st Fed rate cut precedes recession, and comes after 3 months of falling oil prices & inverted yield curve (check on both), the Fed’s 1st cut triggers lower Treasury yields, stronger US dollar & lower US stocks (examples – 1973-74, 1981, 2001, 2007
This is the situation today and plays into expected Phase II nominalization of rate/equity relationship as economic data turns more recessionary.
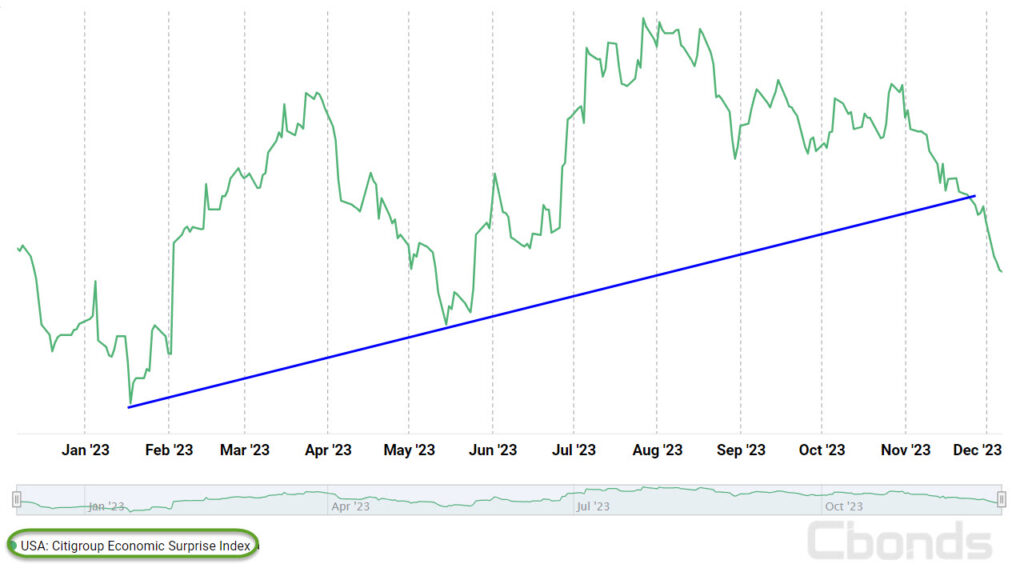 Source: Citigroup Macroeconomic Surprise Index
As you can seen the trend and the rate of change in the trend of the macroeconomic surprise index has turned down (economic data serially missing expectations). The economic surprise index is turning downward and correlates well to my “PHASE II in H2 2023”
While I’ve long expected the rates/stocks inverse correlation from March 2022 to normalize to the historical correlation, I’m open to ether scenario.
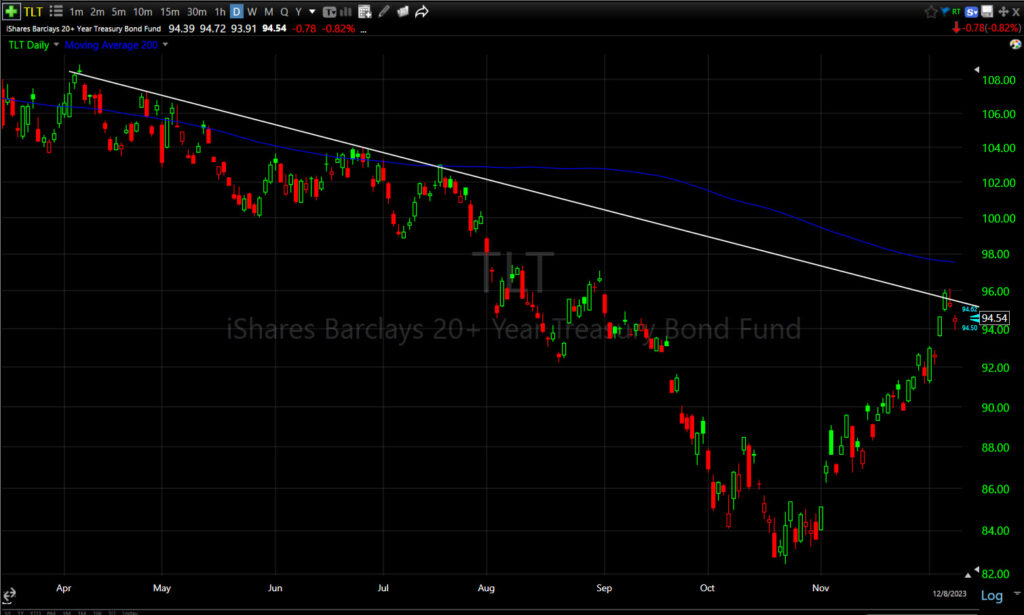 With TLT (daily) at this down trend line and the 200-day sma just above, we may see bonds turn lower and rates higher and the negative correlation between stocks and rates remain in effect as a leading market indicator, potentially confirming what looks like a Dollar leading market signal developing.
Right now the Dollar, and a breakout from the base it’s been forming, is the key leading market signal to watch for.
A strong indication of a bull trap would be stocks rally above levels laid out above, while the Dollar breaks out from its base and 3C charts are where they are now, or worse.
With the FOMC this week, and nearly all of the financial condition tightening Powell applauded since the last meeting, having been nearly erased (financial conditions loosening), Wednesday could be a key day, although thus far the Fed has been towing the same line.
We still have a lot of end of year/December cross currents – like year end repositioning, tax selling, holidays/vacations, seasonality, and window dressing. I think it’s still going to be a complicated month with a lot of short term price volatility and general craziness, but we need to look through all of that to the emerging trends. Remember that the mega-caps, the worst performing stocks of 2022, were dumped hard in December 2022, only to become the biggest market leaders by a wide margin in 2023. In other words, things you see in December are not always what they appear.
See you Monday morning. Enjoy the rest of your Sunday night!

