2021 Market Update – Happy New Year
Hey everyone, I just wanted to take a break from my busy New Year’s schedule of burning the candle at both ends. I’ve had a great new year thus far, watching live music just about every night and staying up way too late, but might as well enjoy the 3-day weekend.
I’m thinking that the December doldrums (with the exception of Small Caps and NASDAQ to a lesser extent), or really the lateral-ish range since the first Monday morning Pfizer vaccine news on November 9th, is going to break up into the new year and provide some much better trading opportunities.
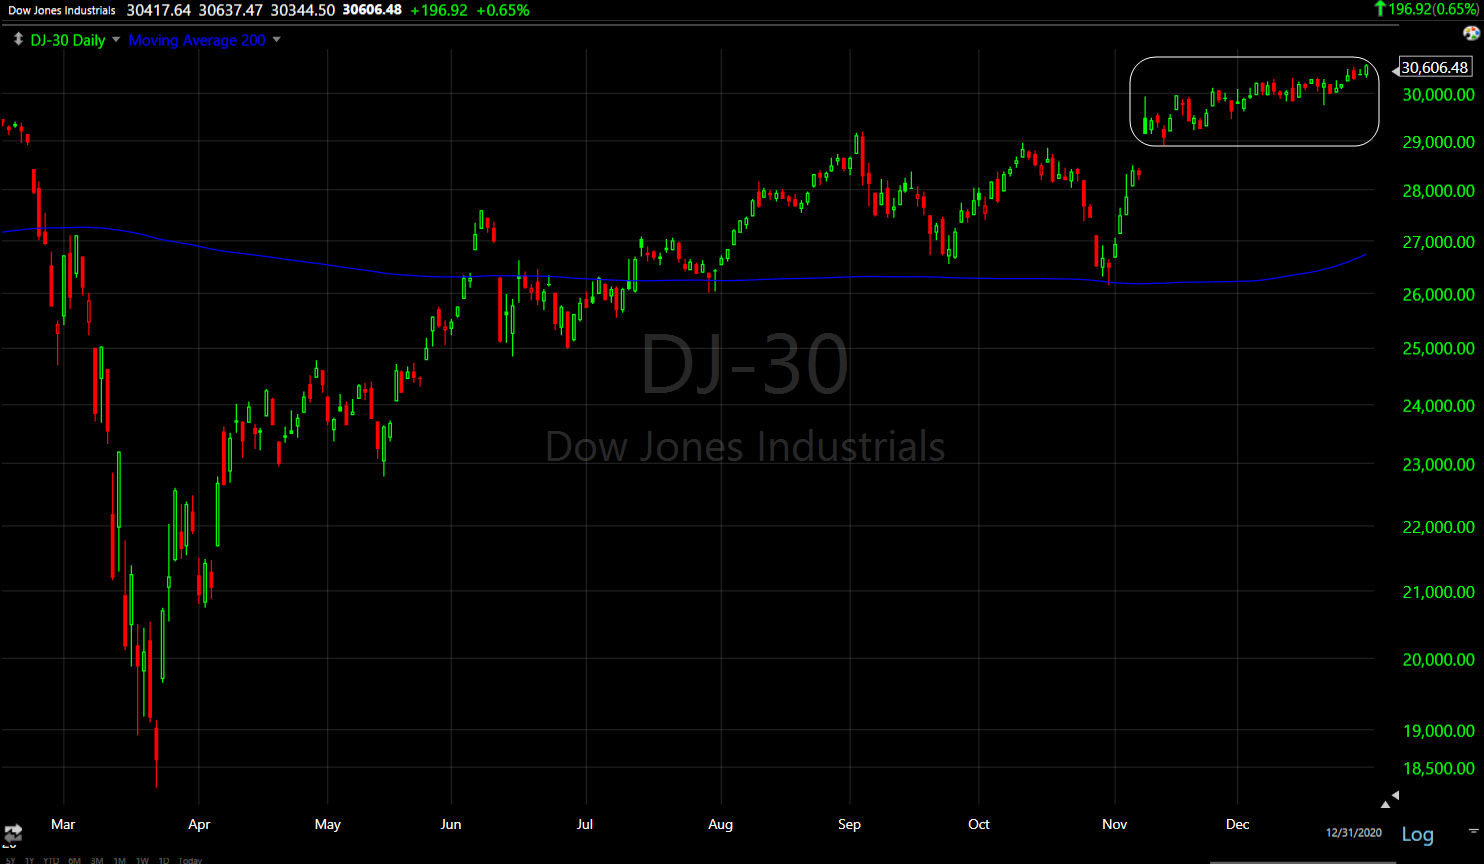
Dow (daily) about 2% from the November 9th high in a very compressed, lateral range. Eight weeks of that kind of rangey trade is the doldrums in my book.
I have a feeling things will get a little more interesting on the price action front for stocks into 2021. The Absolute Breadth Index is at extreme low levels (lowest since January) that much more often than not, precede double digit moves in VIX over the next month, which is why I started buying some long volatility exposure on Thursday. No indicator is flawless and 2020 has been quite a rollercoaster between COVID and umpteen trillions in central bank liquidity, not to mention fiscal stimulus. However, the lesson I’ve learned over time is when ABI hits an extreme low (for my purposes below 14), it’s a signal I never ignore.
The CBOE SKEW Index, also known as the Black Swan Index, closed out 2020 on Thursday at an extreme high reading of 147.83 and 148.27 on Christmas Eve. That’s the exact same level it reached in June. Both readings were the highest since December 2019 (150.14). A month later the S&P dipped some 3%, not much, but in retrospect we know that was smart money – including a few U.S. Senators who got caught trading inside information related to COVID briefings – had a head’s up of what was coming with regard to COVID. Three weeks later and the S&P plunged nearly 34% from an all-time high in just 4 weeks.
I’m not saying, or even thinking anything like that is on tap for early 2021, that was a truly historic situation, but it does seem those in the know are aggressively hedging downside risk by buying deep out of the money puts as indicated by the very high SKEW levels into year-end.
There are a few other yellow flags or contradictory signals, for instance between commodities/precious metals and rates like the Copper:Gold ratio vs. bond yields.
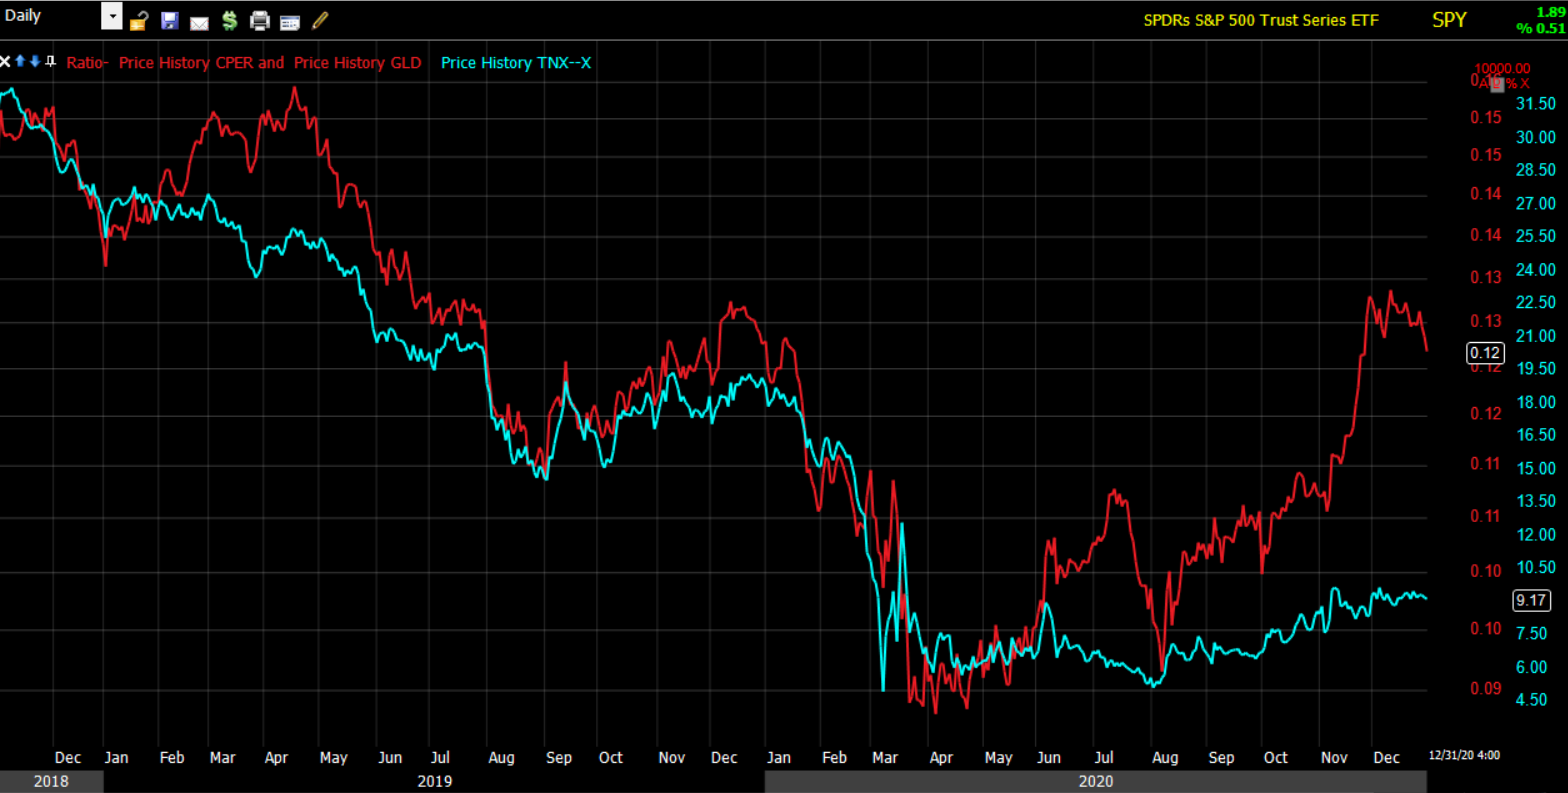 Copper:Gold ratio in red (daily) and 10-year yield in blue. This chart means Copper (a growth-sensitive commodity) has been massively outperforming Gold (more of a safe-haven asset), and the reasons why are easy to see. Central banks have flooded the system with more than $16 trillion dollars in liquidity, governments have pumped trillions more in fiscal stimulus and COVID vaccines have been developed in record time. Still, the bond market hasn’t quite bought into it. Of course part of that is central bank policy, but that’s almost always a factor.
In my experience when there’s a big disagreement or divergence like this, more often than not the bond market is right. You can see that by following some of the past divergences on the chart above. The only really notable exception was in 2018, and it was completely expected.
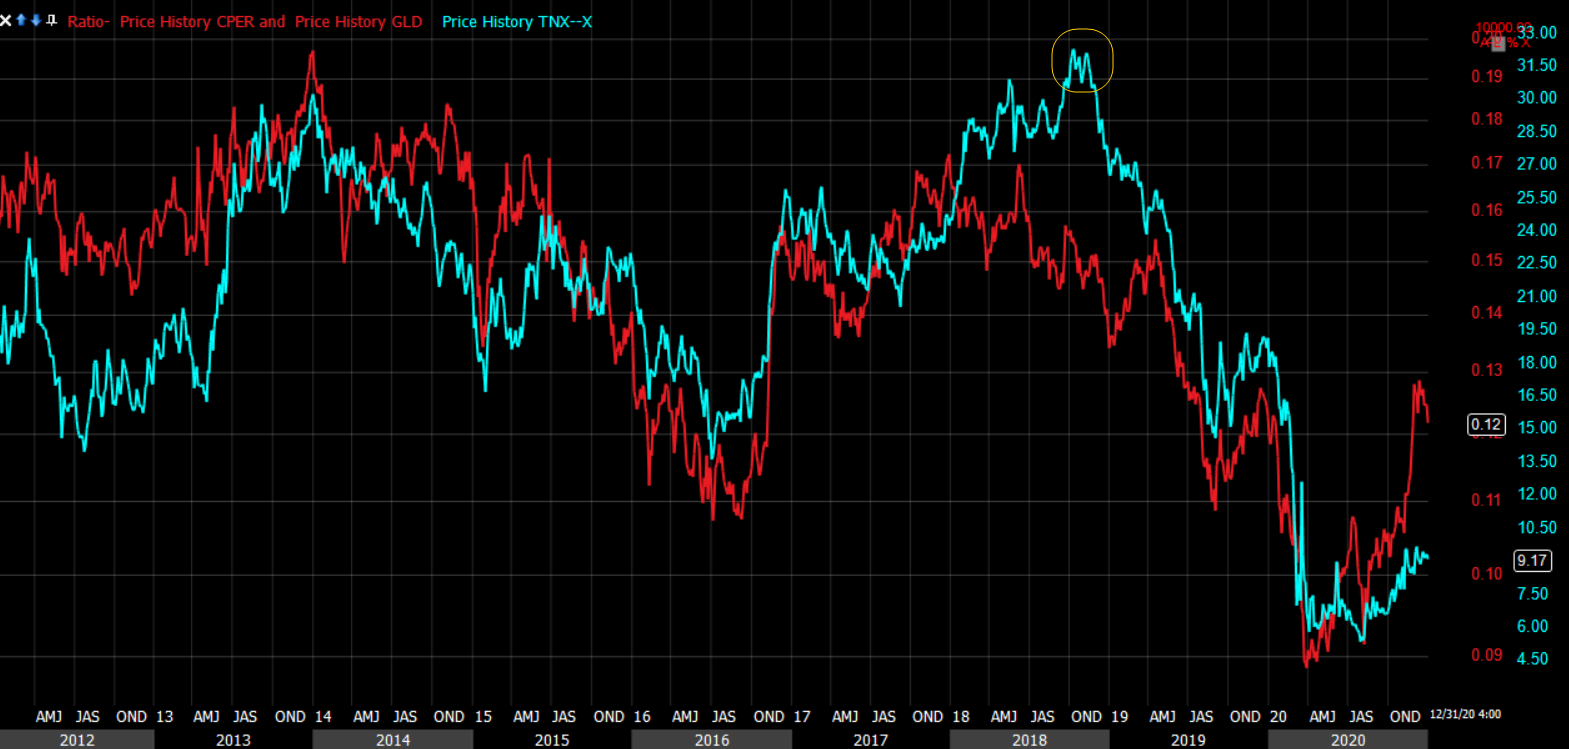
In 2018 (yellow) yields were leading higher, but you may recall that Powell was hiking rates and the market didn’t believe he’d keep going. He called the market’s bluff and maybe made a mistake by hiking one too many times. The price action in yields at the time was bullish and I was 100% expecting yields to breakout higher in 2018, but unlike now – higher yields now would be a sign of the bond market looking forward to economic growth – back then I was expecting a breakout in yields to lead to a shock to stock valuations and it did when Powell pushed it too far. The S&P fell nearly 20% in 2018 starting the day after Powell hinted there were more hikes to come, or that the neutral rate was still higher.
In any case, this is a big disagreement/divergence that is unresolved and these disagreements tend to be resolved.
Real Yields (nominal less inflation) plunging again should be very supportive for gold prices, and hints that the Copper:Gold ratio comes down toward yields (copper underperforms gold) amid a less optimistic economic outlook than what the market has already priced in, whether that be due to COVID or a new incoming Biden administration or something else. Gold is another asset that could be very interesting in 2021 after going a little too far, too fast on the upside in July, and spending the last 5 months correcting.
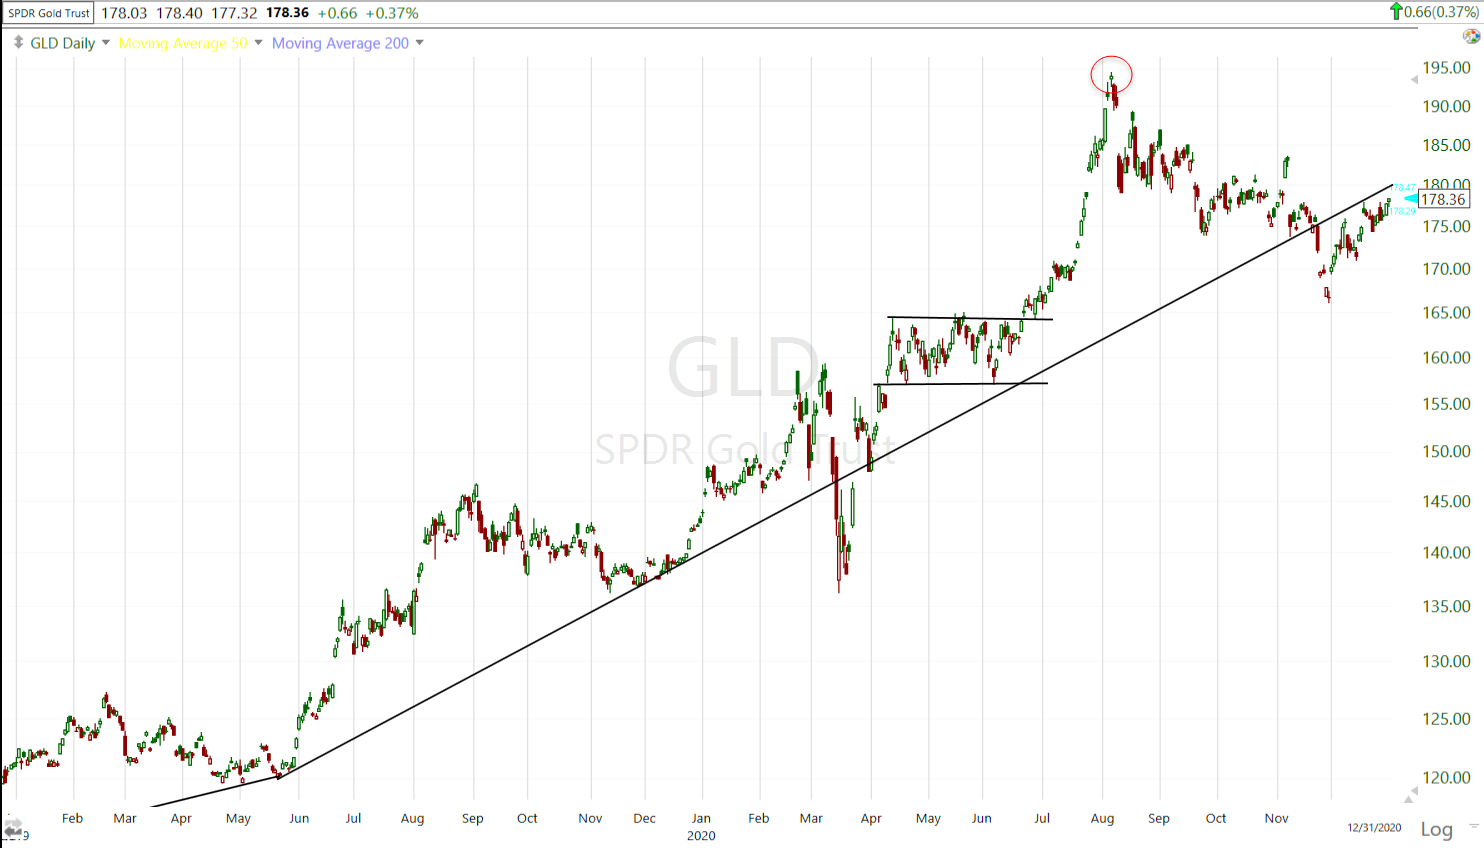
GLD (daily) too far too fast without consolidation, and rising volatility (red circle). As you can see by prices still below the primary trend line, gold (GLD) still has something to prove before resuming its advance, but after falling below its 200-day moving average in November, and bouncing back above its 50-day mid-December, the price action has improved noticeably.
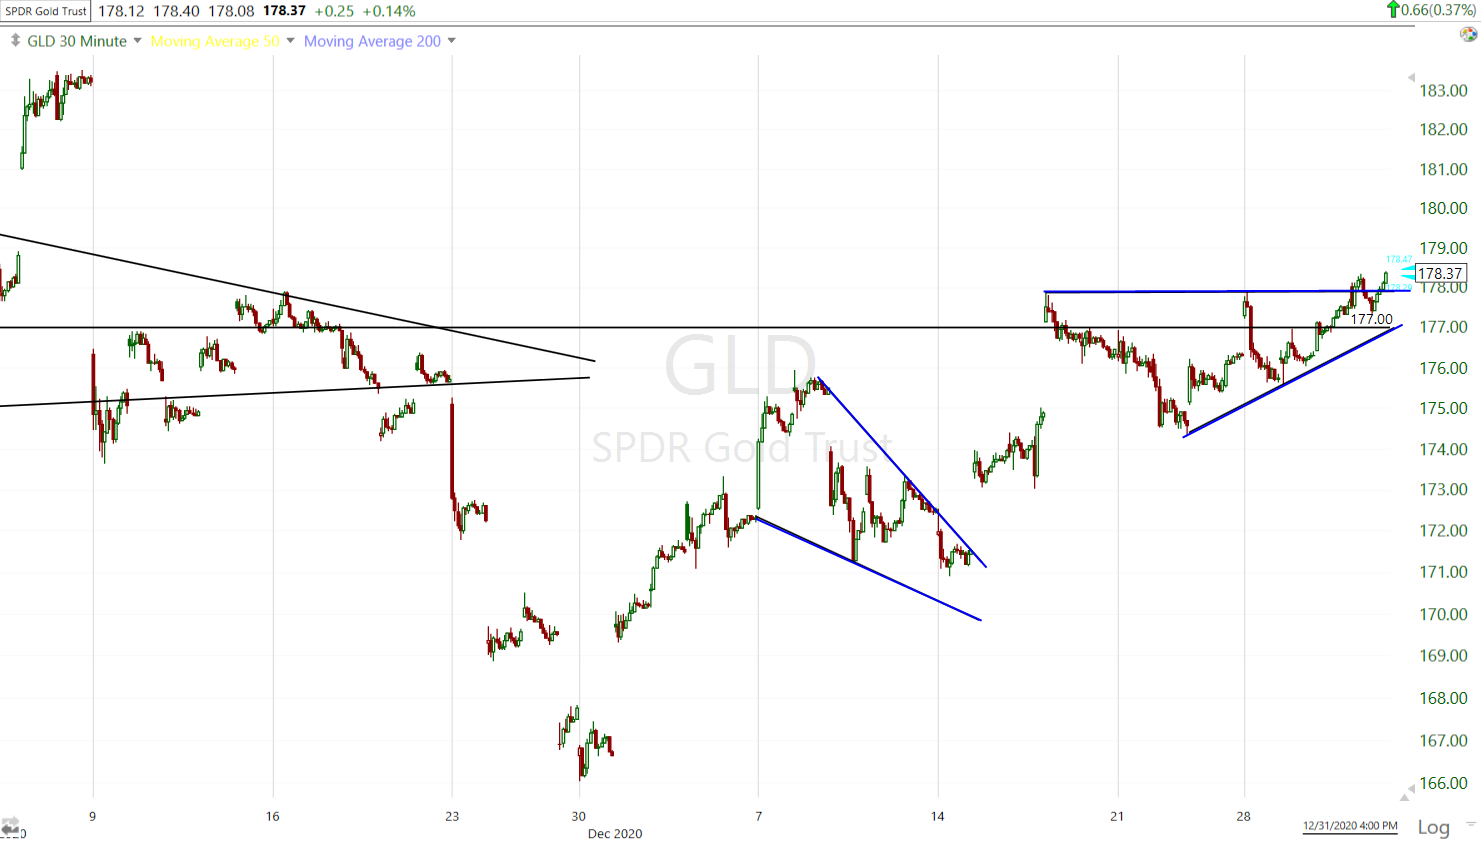 GLD (30m) bullish wedge consolidation, now a bullish ascending triangle on the cusp of a breakout.
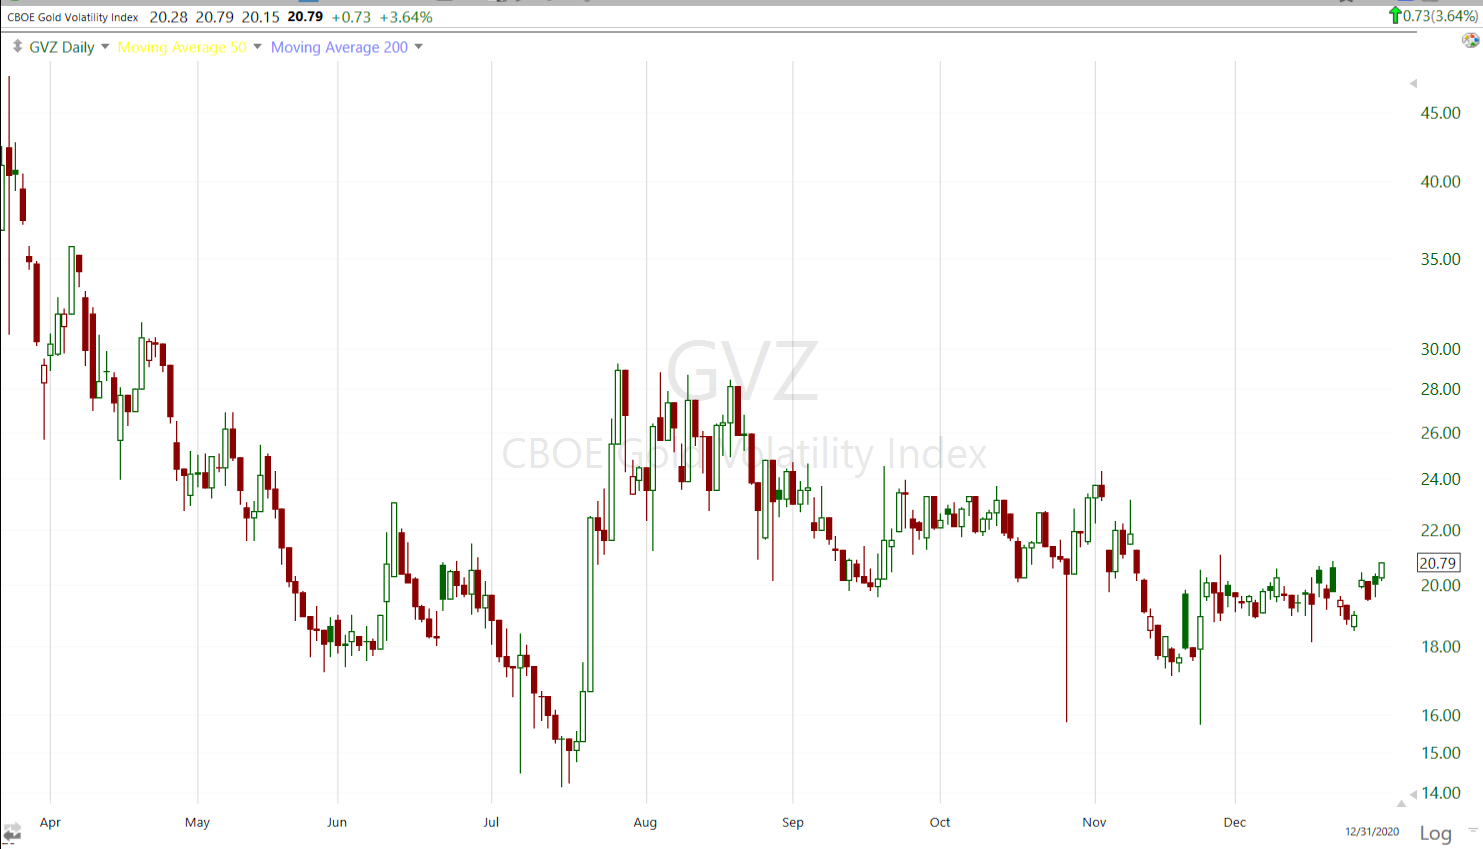 Gold’s volatility (daily) spiked in July (not bullish) and has since come down as gold spent the time to consolidate the last 5 months.
Gold/GLD is at a major crossroads/proving ground just as we enter 2021.
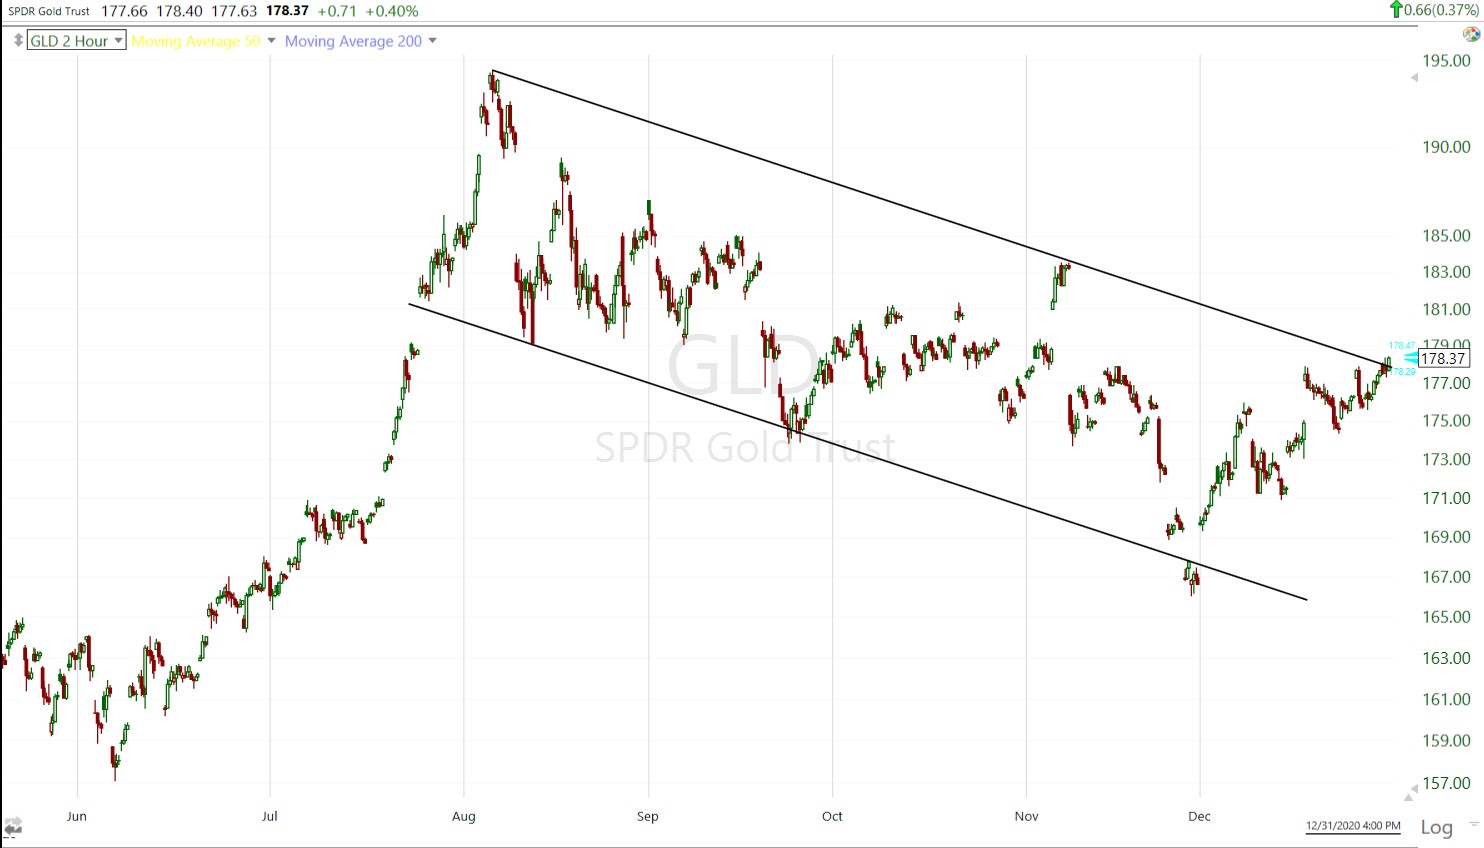
GLD (2 hour), much larger than the typical bull flag, but it’s still a technically attractive longer term pattern, again on the cusp of a breakout of a different, larger pattern on a longer time frame just as we enter 2021.
In 2018/2019 TLT or bonds and GLD or gold were some of my favorite assets based on price action. They have tracked in similar fashion.
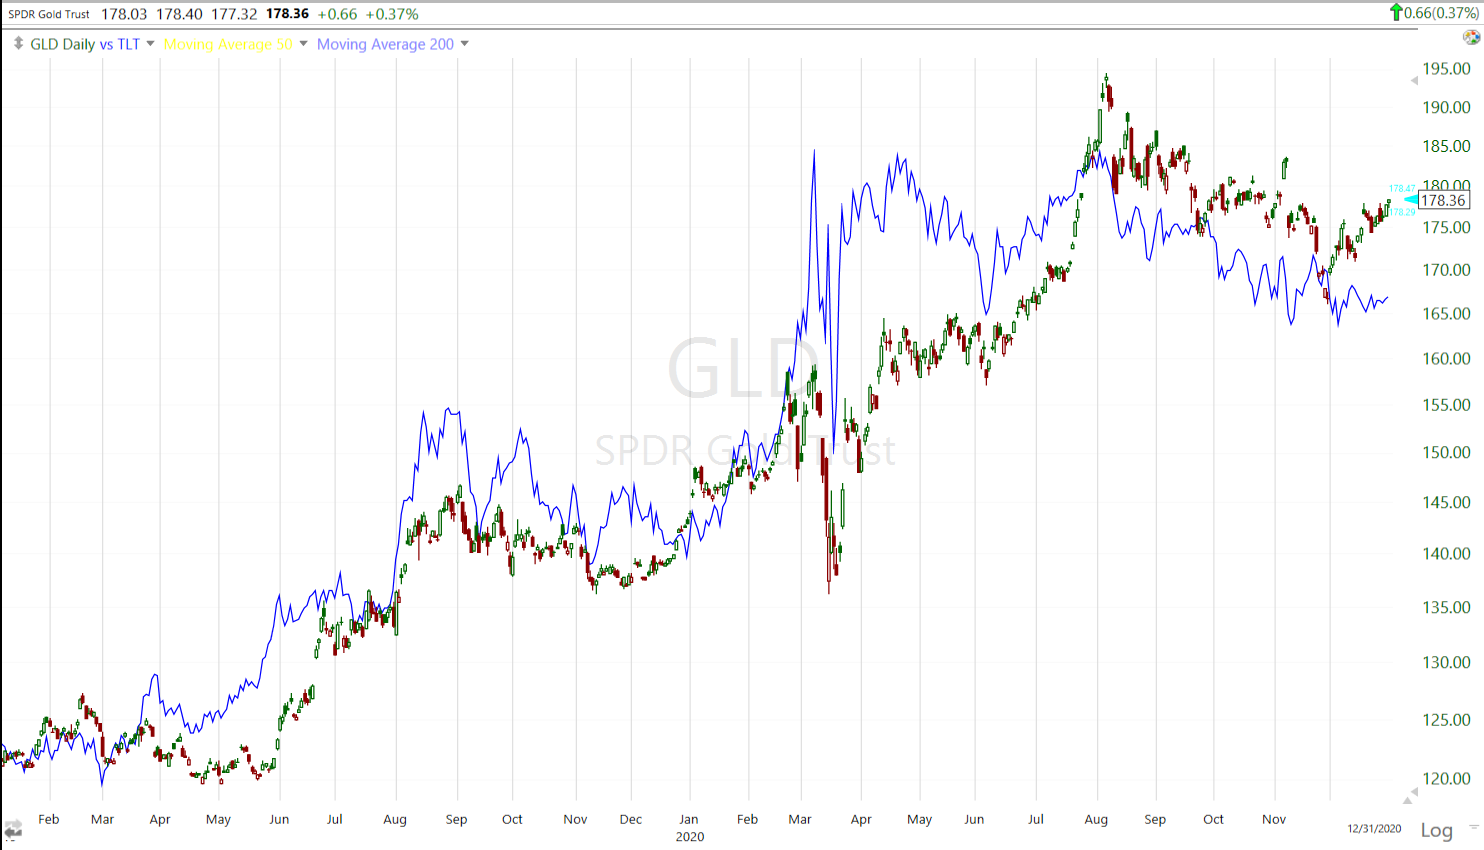 GLD (daily) in candlesticks and TLT in blue.
Getting back to the Coppper:Gold ratio vs. yields, the bond market is also at a very interesting crossroads as we enter 2021.
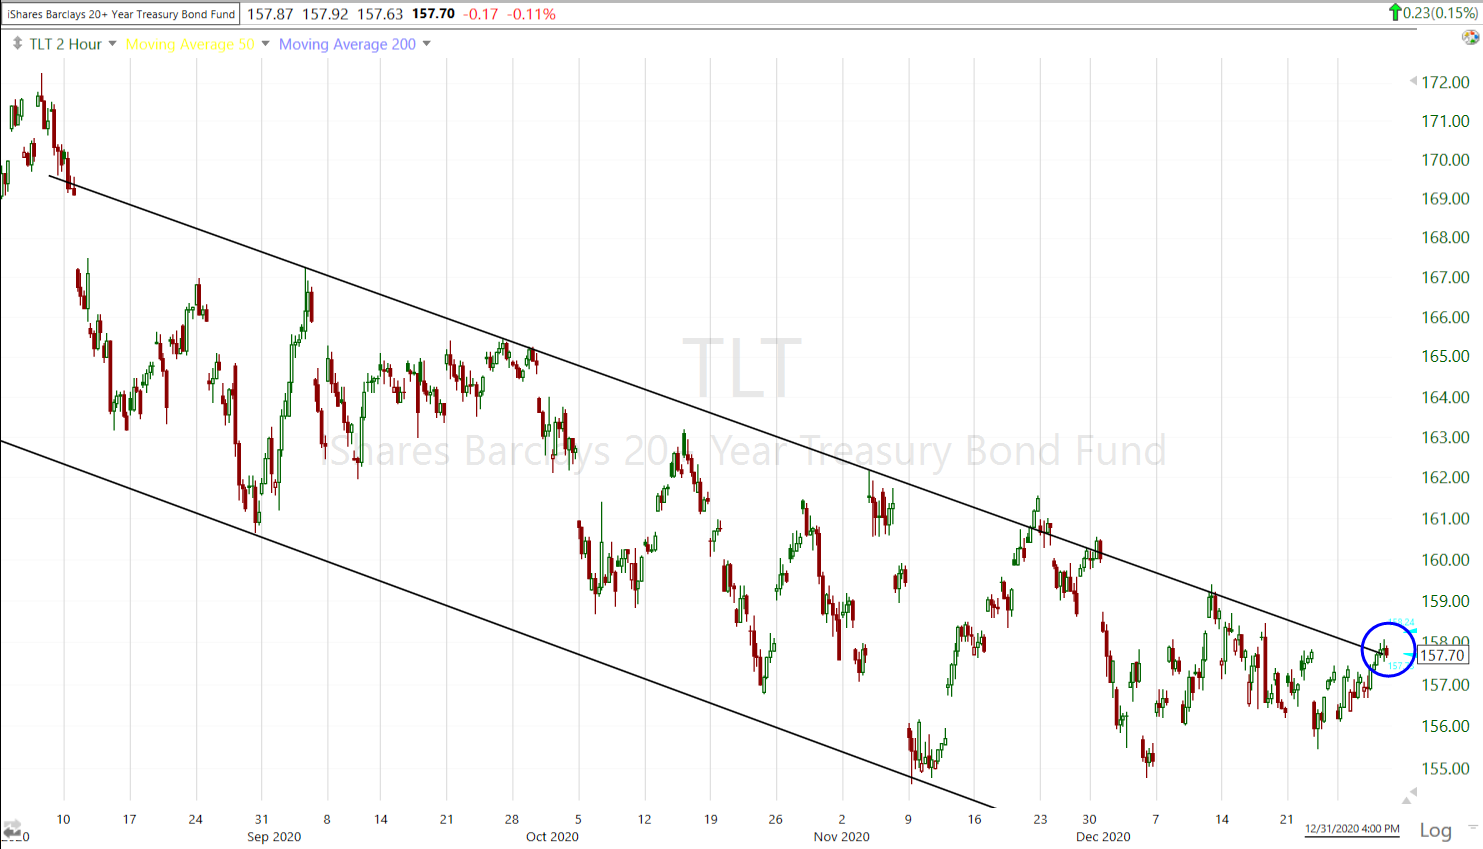
TLT (2 hour) has been spending a lot more time toward the top of this 5 month channel (similar time to gold’s 5 month consolidation and channel). A breakout above would be a dramatic change in trend that should see gold outperform copper, and the recent small cap outperformance from the November 9th Pfizer vaccine news would almost certainly reverse.
We’re obviously not there, but we a at some very interesting intersections as we head into 2021.
Bonds and Gold had the most beautiful bullish price action in 2018/2019, but in 2020, at least since the spring, it has been Bitcoin. If you’ve followed me for a few years (many of you have), you know I did not like the 2017 parabolic bubble in Bitcoin one bit. Everything about it screamed that we were in a historic euphoric bubble – whether the price action, the euphoria with people selling their homes to live in a tent so they could buy Bitcoin, to listed companies like an Ice Tea maker changing their name to incorporate “Blockchain”. It was a silly time and I didn’t trust it at all. Over the next year Bitcoin fell from $19,666 to $3122. It took years to consolidate the gain and the loss, but there was a notable improvement in price action in Spring of 2020. I’ve been long Bitcoin via GBTC since June and it has been one of my favorite assets from a price-only perspective.
This weekend Bitcoin has soared once again, reaching $34,800!
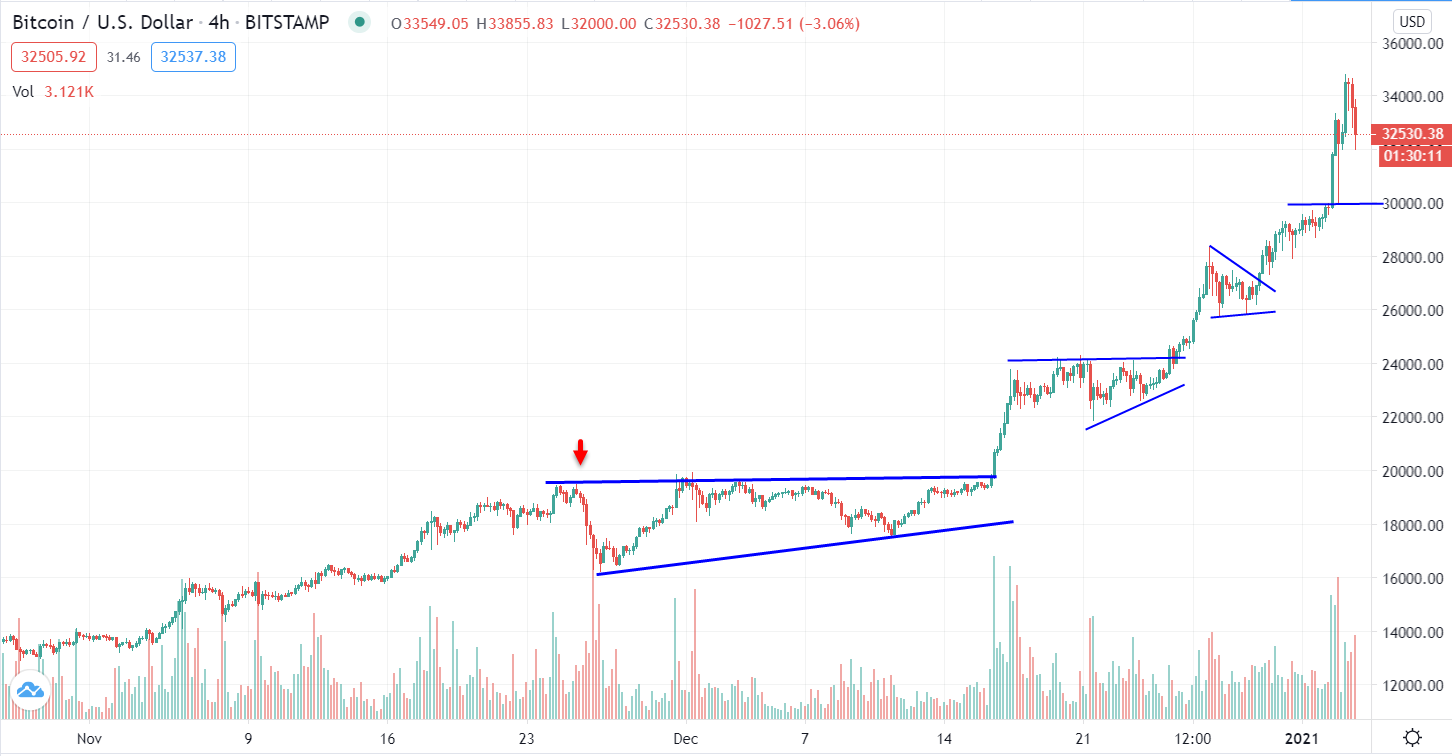
BTC/USD (4h). The price action from the March low just got better and better, until some really heavy price volatility in early December (red arrow). At the time I said I thought it would take a bigger/larger consolidation to absorb that volatility as Bitcoin was challenging the 2017 all-time highs. We got that bigger stronger consolidation in the form of a bullish ascending triangle, price broke out on a big pick-up in volume and has been great since with bullish triangles along the way and increased volume on breakouts. Note the volume this weekend as price broke out above the psychological $30k.
I’m not one of these people who have 100% faith in crypto. I really don’t know that much about it. I like it for one reason, and that’s the price action and when I no longer like or trust the price action, I’ll be a seller, but right now I don’t see any concerns on the visible horizon. This has been my best performing non-leveraged position by far and I expect to be in it until price says differently.
I’ll keep this short. I just wanted to touch base and lay out some of the broad strokes and interesting crossroads as we enter the new year. I have a feeling the December doldrums are going to be shaken up, and I’m really looking forward to that from a trading perspective. Enjoy the rest of your weekend. I’ll see you Monday morning.
Happy New Year!