3C Leading Higher Near Today’s Session Lows.
This is a Free Content Re-post of an intraday post from today (Thursday, September 1, 2022) at https://wolfonwallstreet-trade.com/. Below the timestamp is the original post as sent out to subscribers as of 1:27 p.m. ET. This is when the entire market’s tone turned toward the bullish this afternoon. This leading positive 3C signal is what I’ve been telling subscribers we need to watch for if and when this 2+ week correction in the market averages is going to morph into something else. While 1 day is certainly not a trend, in today’s case this leading 3C signal preceded a pretty significant change for the S&P, from down -1.3% to a green close. Here’s the post…
1:27 p.m. ET
It’s been an ugly session again, but the S&P 500 tested the 3,900 level, where it found some support, and currently moves sideways just above that level. Market breadth reflects the heavy selling bias with decliners leading advancers by a nearly 6-to-1 margin at the NYSE and a greater than 3-to-1 margin at the NASDAQ at midday.
3 of 11 sectors are higher with the second most heavily weighted sector, Health Care, up +1%.
I mentioned earlier the possibility of 3C starting to lead higher on the intraday (1m) charts and that looks like it may be starting to happen now.
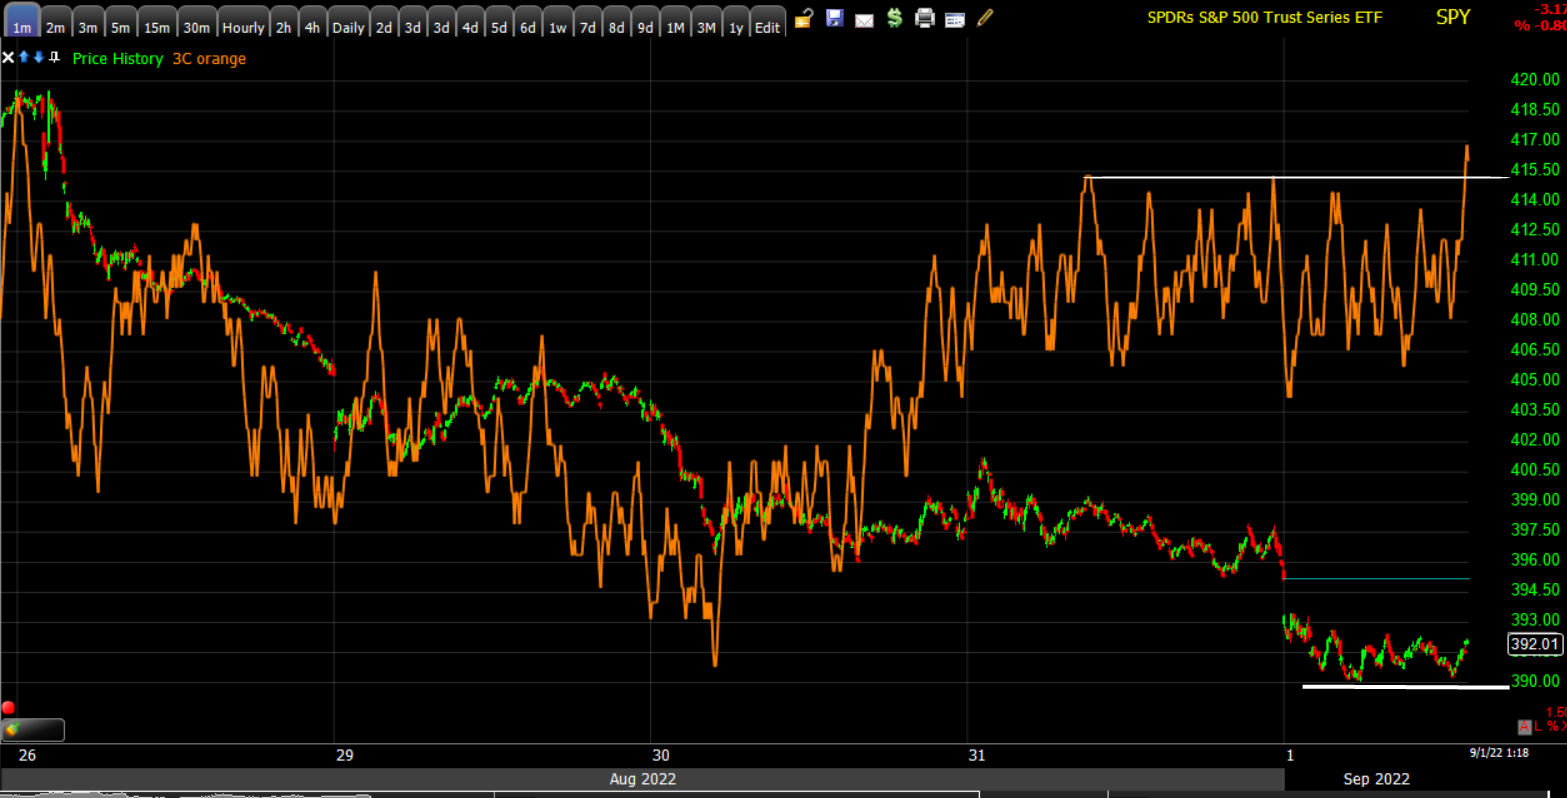 SPY (1m) the white trend line is the approximate S&P $3900 area, but notice how 3C is creeping higher above its recent highs. This was the example I gave several days back, or at least the start of the example of a leading positive divergence. So far it’s only on SPY’s chart, but there is some intraday improvement on other averages like QQQ’s intraday chart, and in NASDAQ-100 index futures, which as noted earlier, were not among the positive divergences like S&P futures.
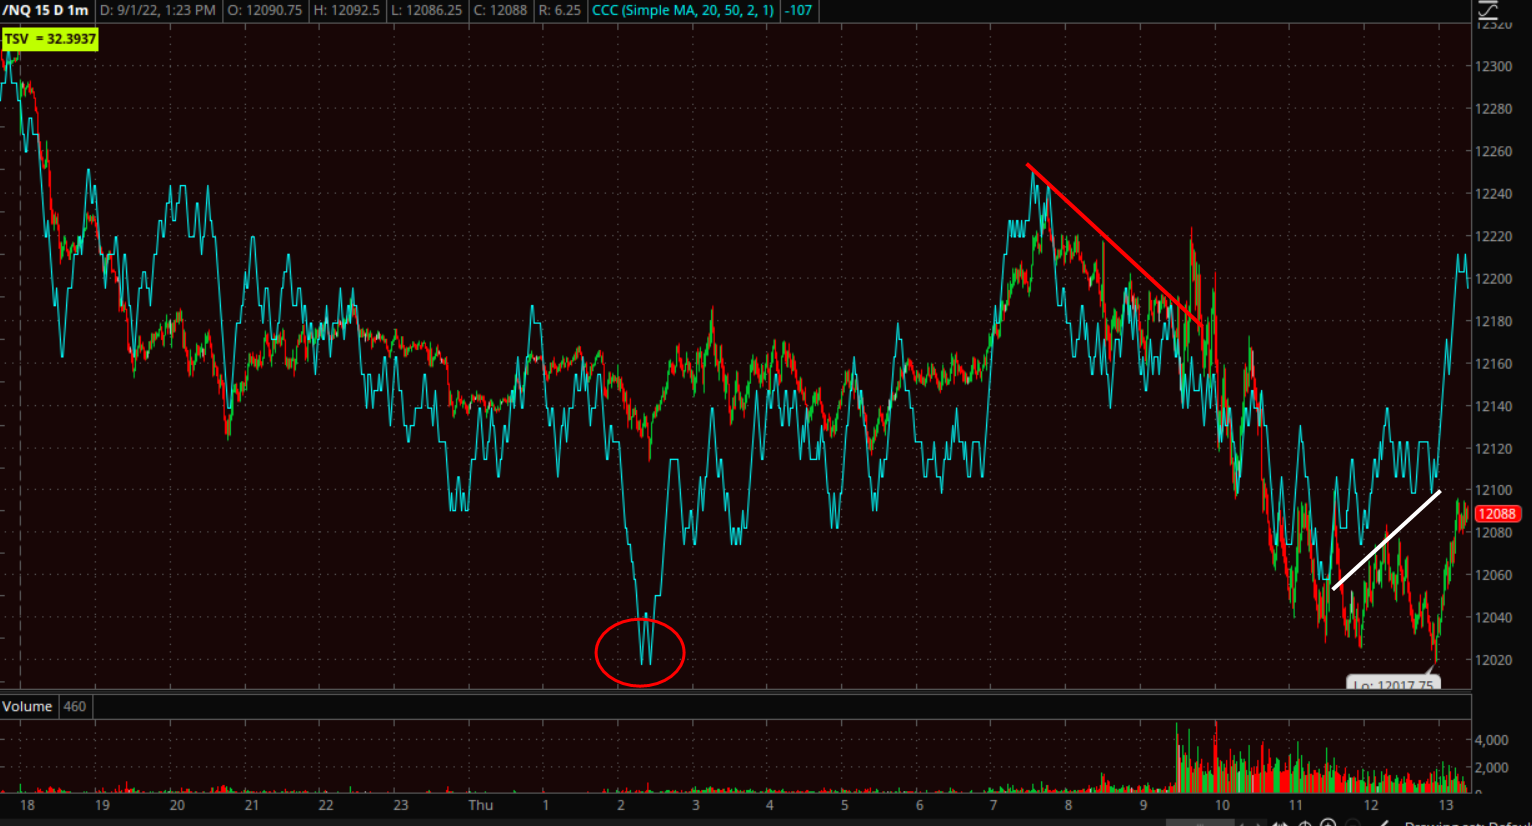
NQ (1m) 3C was leading lower (red circle) and negatively divergent into the open (red trend line), now it’s starting a positive divergence (white trend line), although this is nothing like the SPY chart above in importance, it is a change in character on the day.
If these divergences continue, and the SPY chart is the one I’ve been saying to be n the lookout for, then we could be finally seeing a low put in place here on the first day of the new month.