Daily Market Wrap
Last week market legend, Jeremy Grantham said,
“‘My confidence is rising quite rapidly that this is, in fact, becoming the fourth, real McCoy, bubble of my investment career. The great bubbles can go on a long time and inflict a lot of pain but at least I think we know now that we’re in one. And the chutzpah involved in having a bubble at a time of massive economic and financial uncertainty is substantial.”
The stock market has rallied to bubbly valuations in the midst of a global pandemic, while the U.S. is in a recession with tens of millions of people unemployed and an uncertain futures in terms of rising corona-virus cases, yet the market sells off last night over the phase I trade deal, a deal in name only as the chart below makes clear.
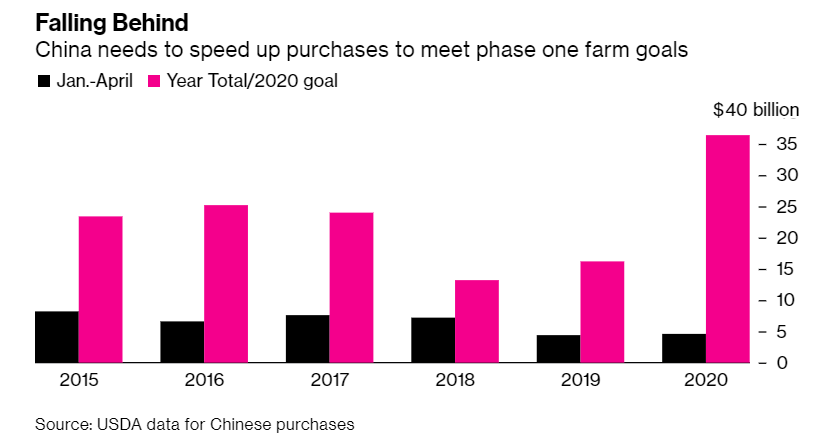
For the period from January to April, China’s purchases of U.S. goods are not only nowhere near the $40 billion deal, they’ve fallen behind the average or norm as compared to years with no deal whatsoever. I thought it was a little comical that the market sold ff last night on THAT.
Small Caps attempted to take a leadership role this morning, which in my view would be bullish for the market near term, but once again failed to hold onto leadership shortly after the cash open. This is the third or maybe forth time they’ve tried to lead over the last week and failed. In fact outside of maybe 1 or 2 days, small caps/cyclicals haven’t been able to lead since the u-turn following Payrolls.
The NASDAQ 100 actually started the day lagging behind. However the recent norm has been that when small caps try to lead and fail, investors fall back to the mega-caps. It sounds odd to say, but in this current market environment (last 3 weeks), the mega-caps are more of a defensive play, and are clearly becoming a very crowded trade. The fact that the NASDAQ Composite has been up 10 of 11 days since Payrolls is evidence of that.
The chart below depicts the rotation. It is the benchmark S&P, Dow, NASDAQ 100 and Small Caps normailized. For purposes of illustration, NASDAQ 100 is synonymous with the mega-caps and secular growth. Small Caps are synonymous with growth sensitive cyclical/value stocks.
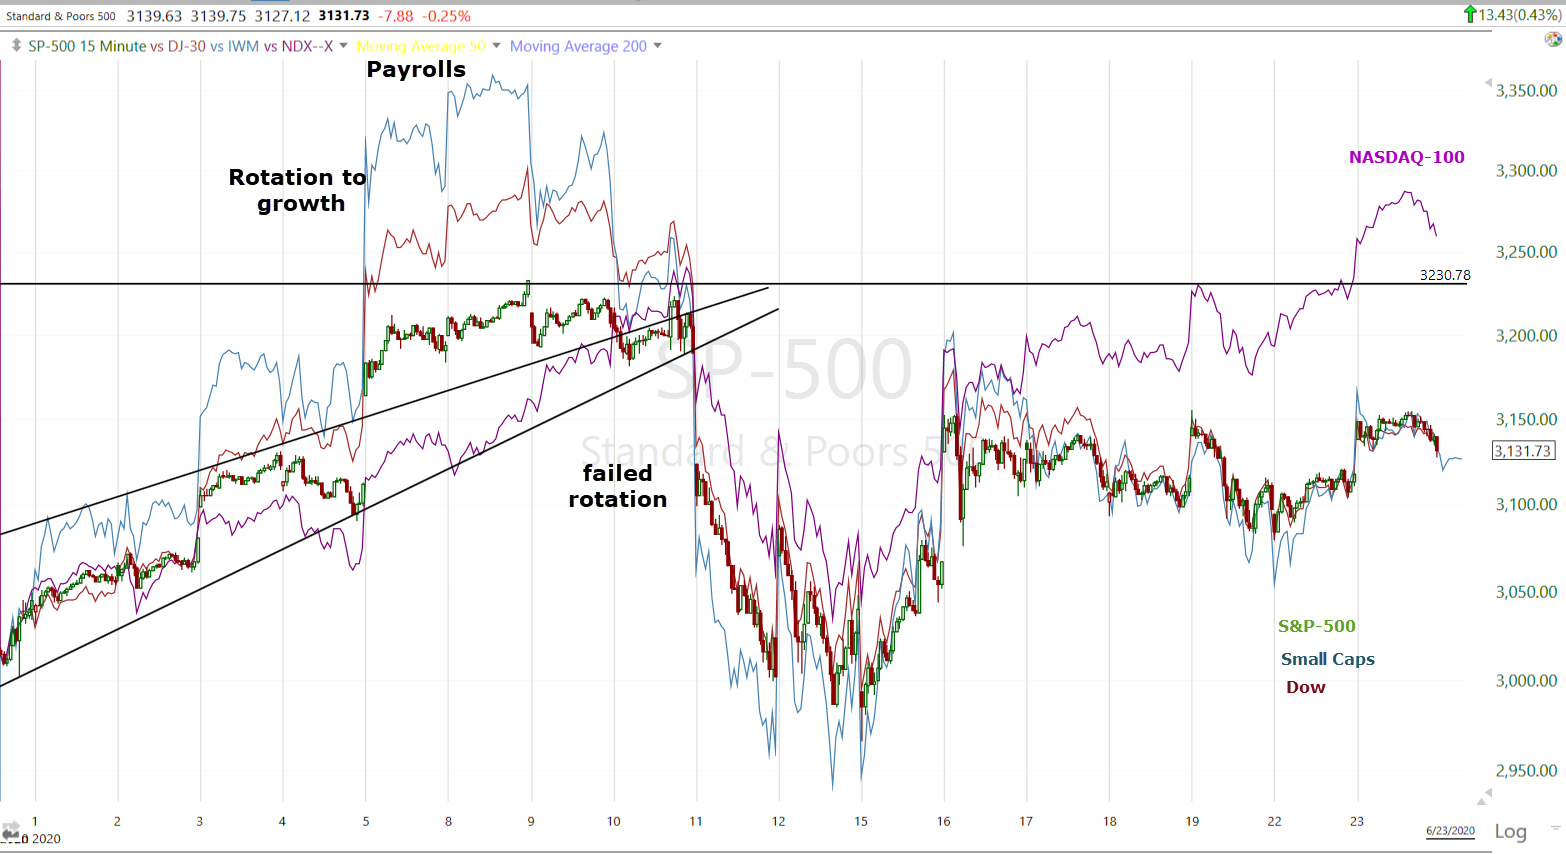
The S&P was trading in a rising wedge. As prices moved toward the apex of the wedge, Small Caps and Dow out performed heading into Payrolls amid a rotation to economically sensitive cyclicals/value, while NASDAQ 100 under-performed.
That rotation was an expression of investor conviction in re-opening and renewed economic growth. The bond market briefly got onboard too. The rotation attempt ended with the Payrolls report, and soon after the S&P (market) dropped over 7% from the rising wedge’s apex. The market has been correcting/consolidating since then, and NASDAQ has been outperforming as investors abandoned their confidence in economic growth and moved back to the old standby favorites, the mega-caps, synonymous with secular growth.
It should be noted that USD/JPY sent its flight -to-safety or risk-off signal the very next trading day after the Payrolls report as the S&P’s wedge reached its apex, and a couple of days before the market’s sharp decline. I suspect the reason for the failure of the rotation was the increase in COVID cases, and that may be the same reason USD/JPY saw safe-haven flows.
The most notable aspect of today’s trade was a similar flight to safety in USD/JPY this morning.
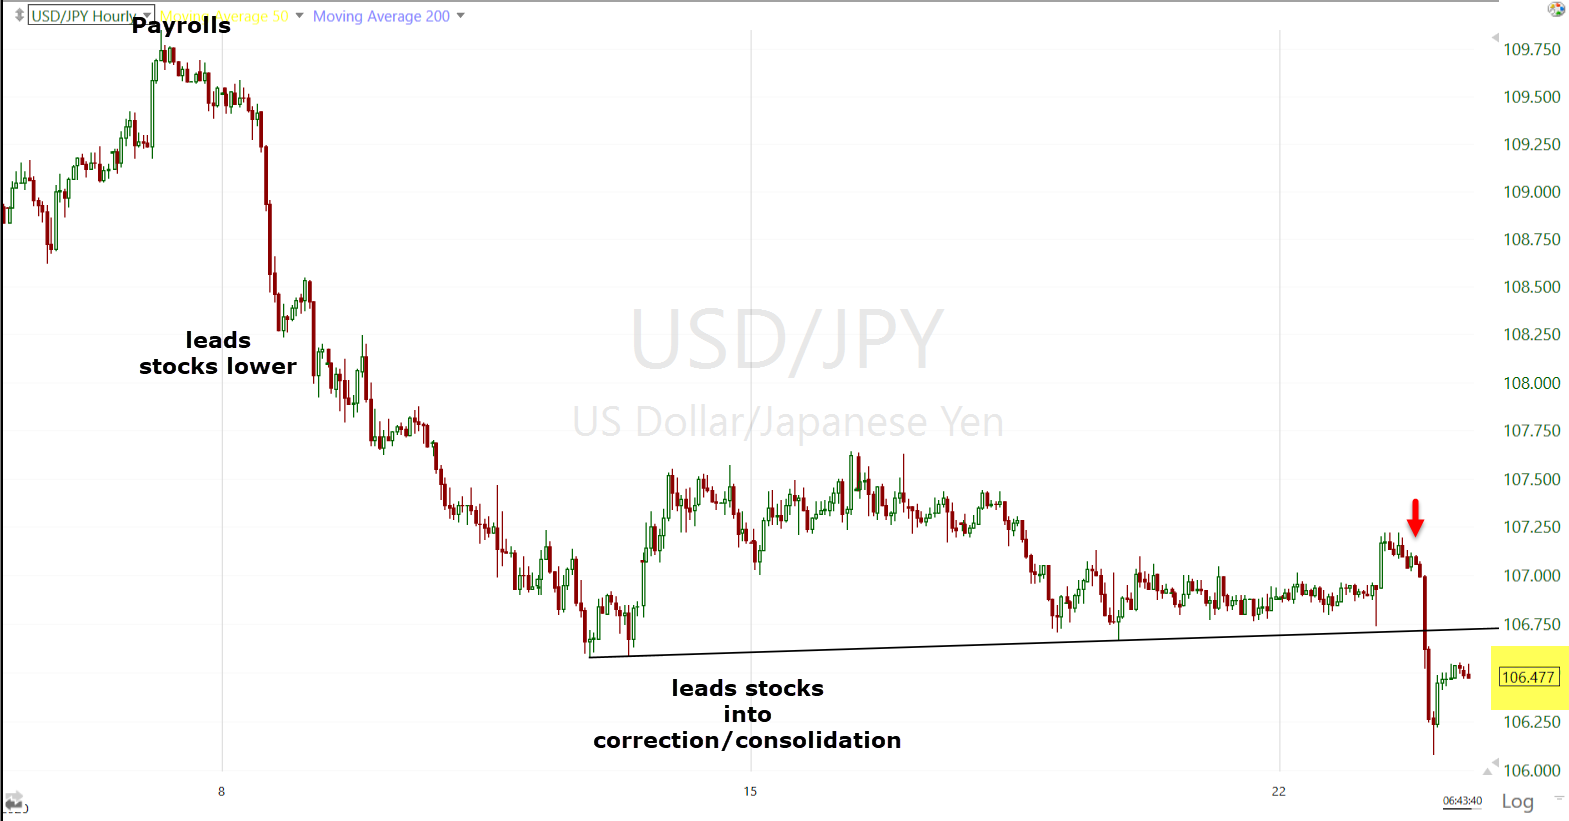
USD/JPY (60m)- price action leading up to today suggested a high probability of a second leg decline following the consolidation. The safe-haven Japanese yen was strongly bid before the open and the currency pair broke below the consolidation and the $106.50 level I flagged as a meaningful market signal. Gold was also strong.
Averages
The NASDAQ composite is up for the 8th consecutive day making two consecutive record closes, while the S&P, Dow and Small Caps have been consolidating sideways as seen on the chart above. The S&P’s closed +0.02% (2 basis points) from where the lateral consolidation began a week ago, last Tuesday morning. The sheer weight of the mega-caps is providing a lot of support for the S&P. I’ll show some examples below.
S&P 500 ⇧ 0.43 %
NASDAQ ⇧ 0.78 %
DOW JONES ⇧ 0.50 %
RUSSELL 2000 ⇧ 0.41 %
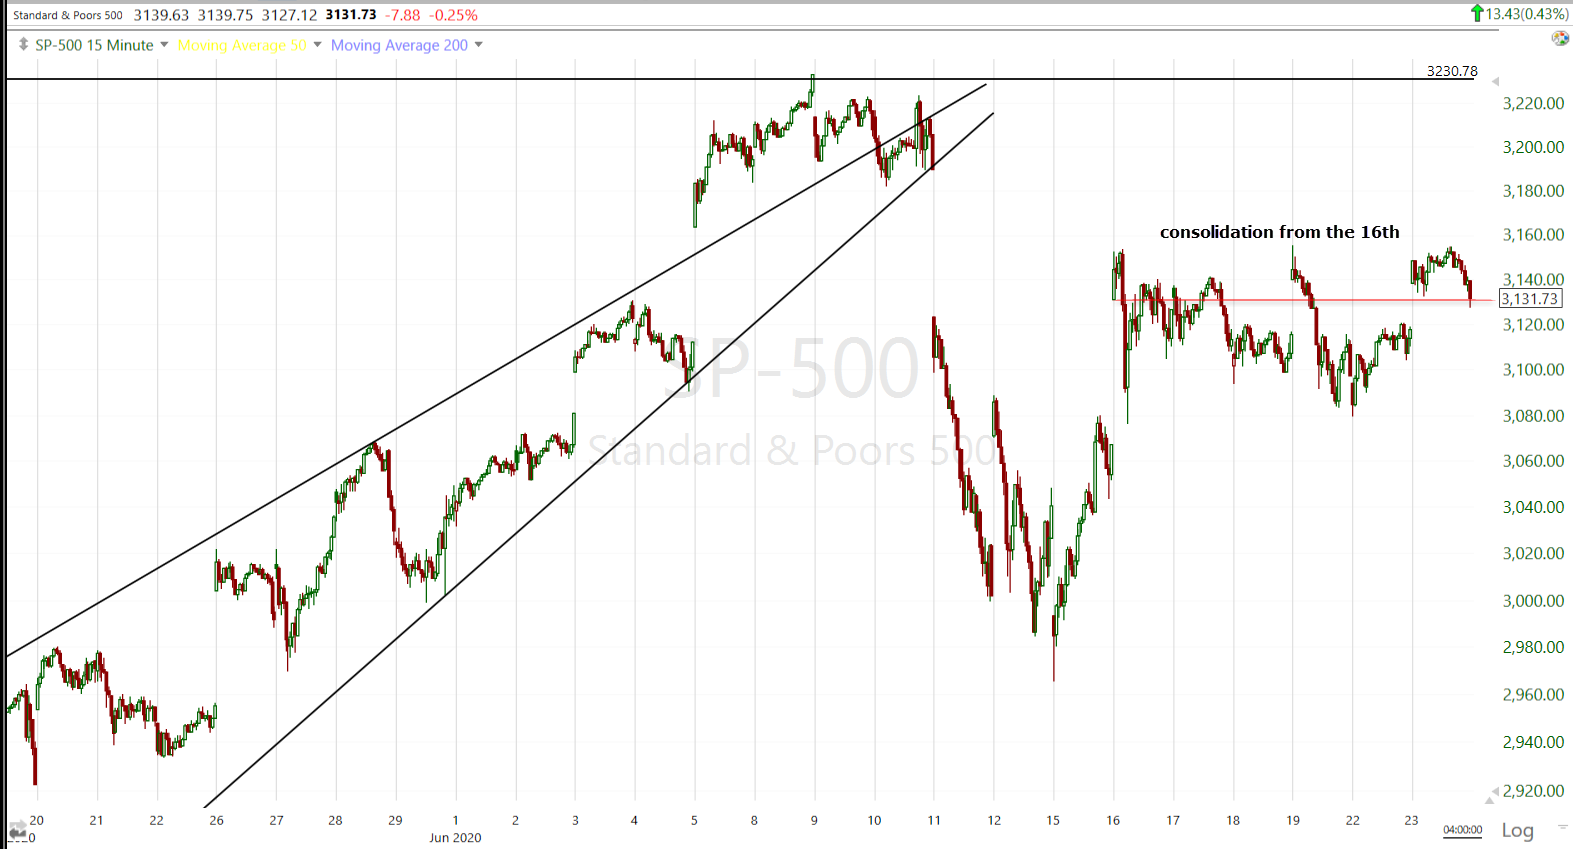 SP-500 (15m) unchanged since last Tuesday’s open when the consolidation phase began.
The S&P is sideways over the last week, which is a consolidation. Because the day before was a strong up day the consolidation gets the benefit of any doubt and is considered a bullish consolidation. However, an equal weighted index of S&P stocks adds some more color and illustrates just how much influence the mega-caps have on the S&P (and Dow)…
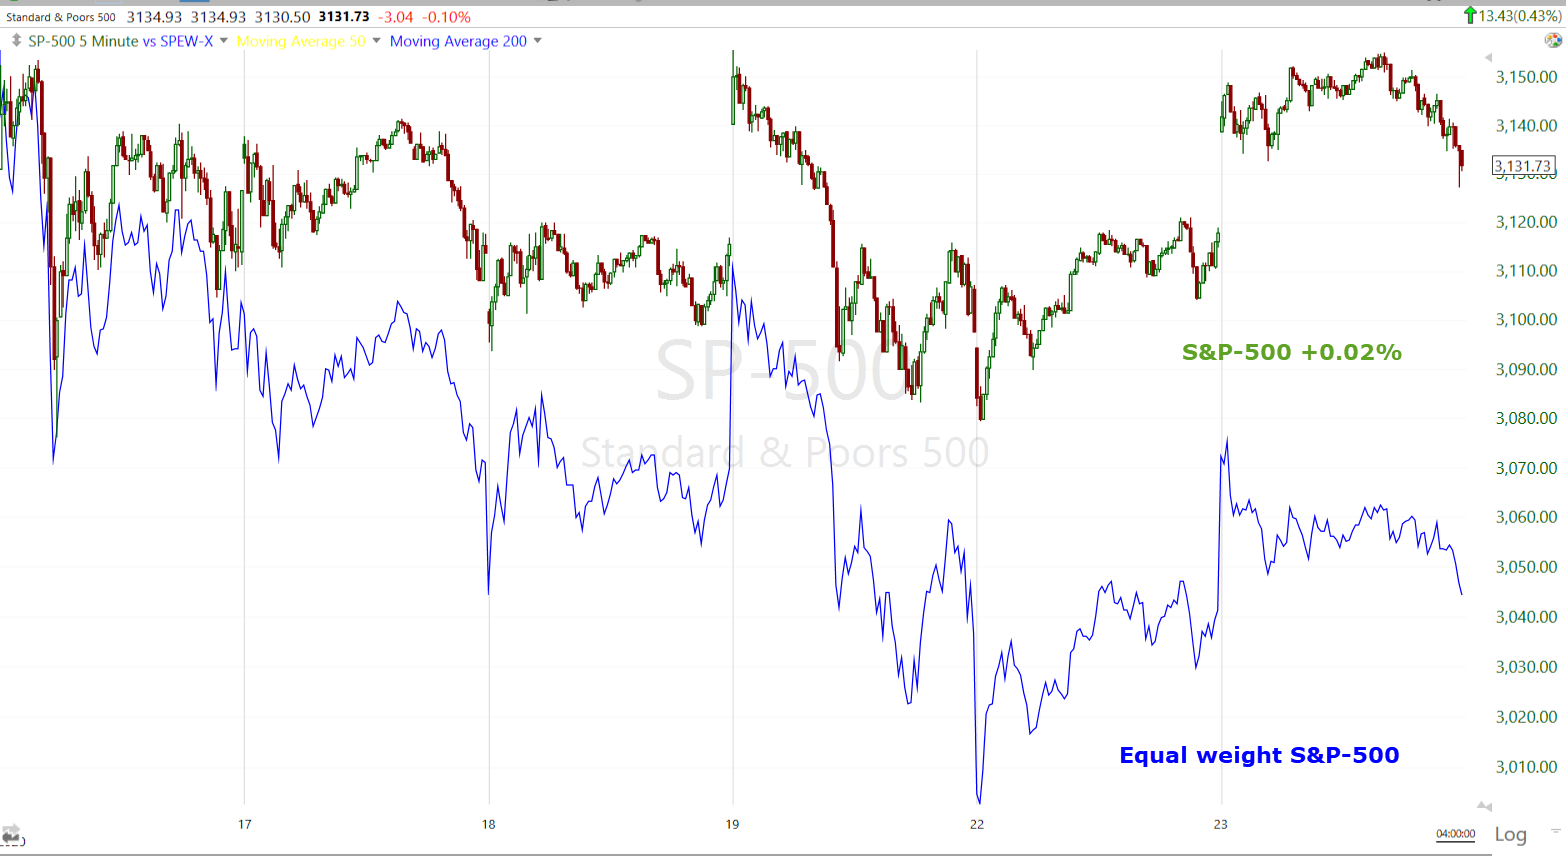 This is the lateral consolidation range from last Tuesday’s open. The S&P is nearly unchanged (+0.02%). The equal weighted S&P index is down -3.2% over the same period.
And on a daily chart…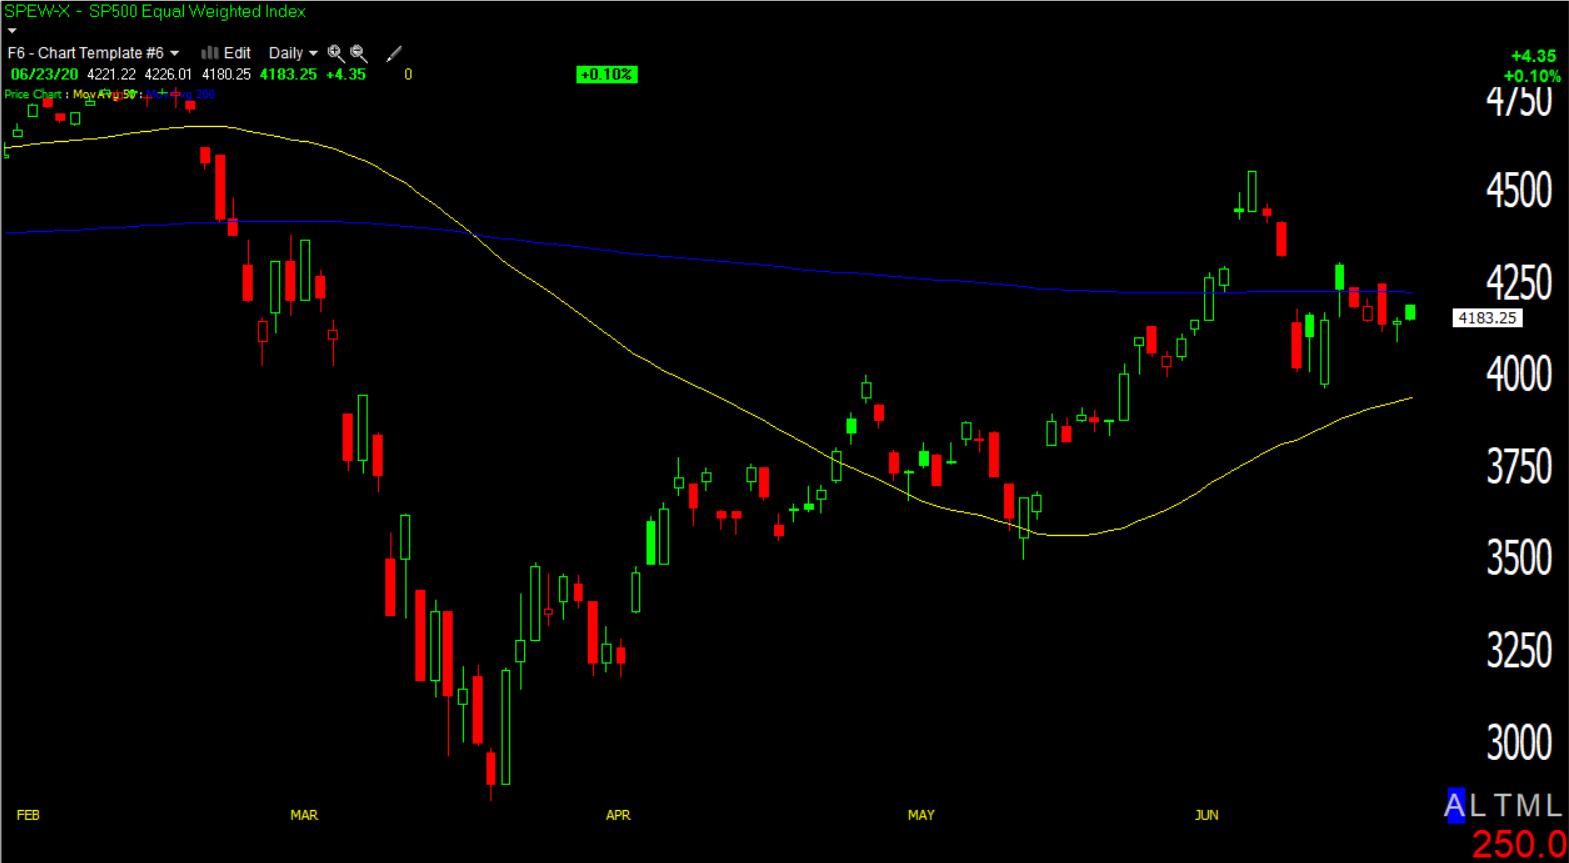
The S&P’s equal weight index is below its 200-day moving average, more similar to the Dow and Small Caps. The S&P is down -3.1% YTD, the equal weight S&P is down -10.8% YTD.
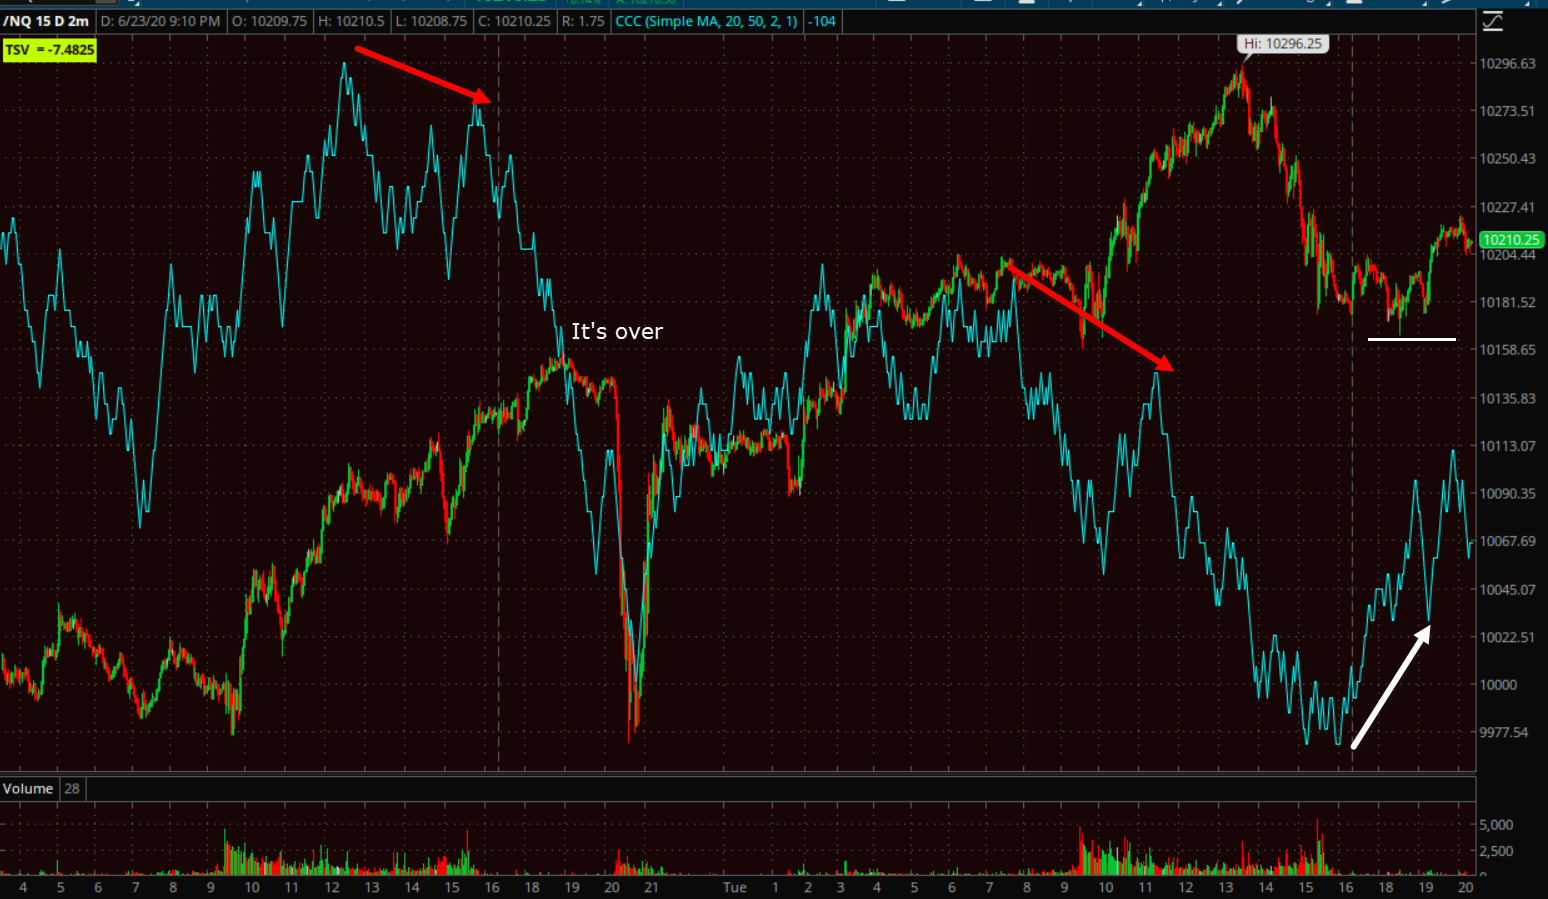
3C charts have been pretty quiet during the consolidation phase. In the overnight section of Monday’s Daily Wrap some negatively divergent 3C signals began to appear, not long before Navarro’s “It’s over” comments with regard to the phase I trade deal. sent index futures plummeting in one of the fastest declines since the crash.
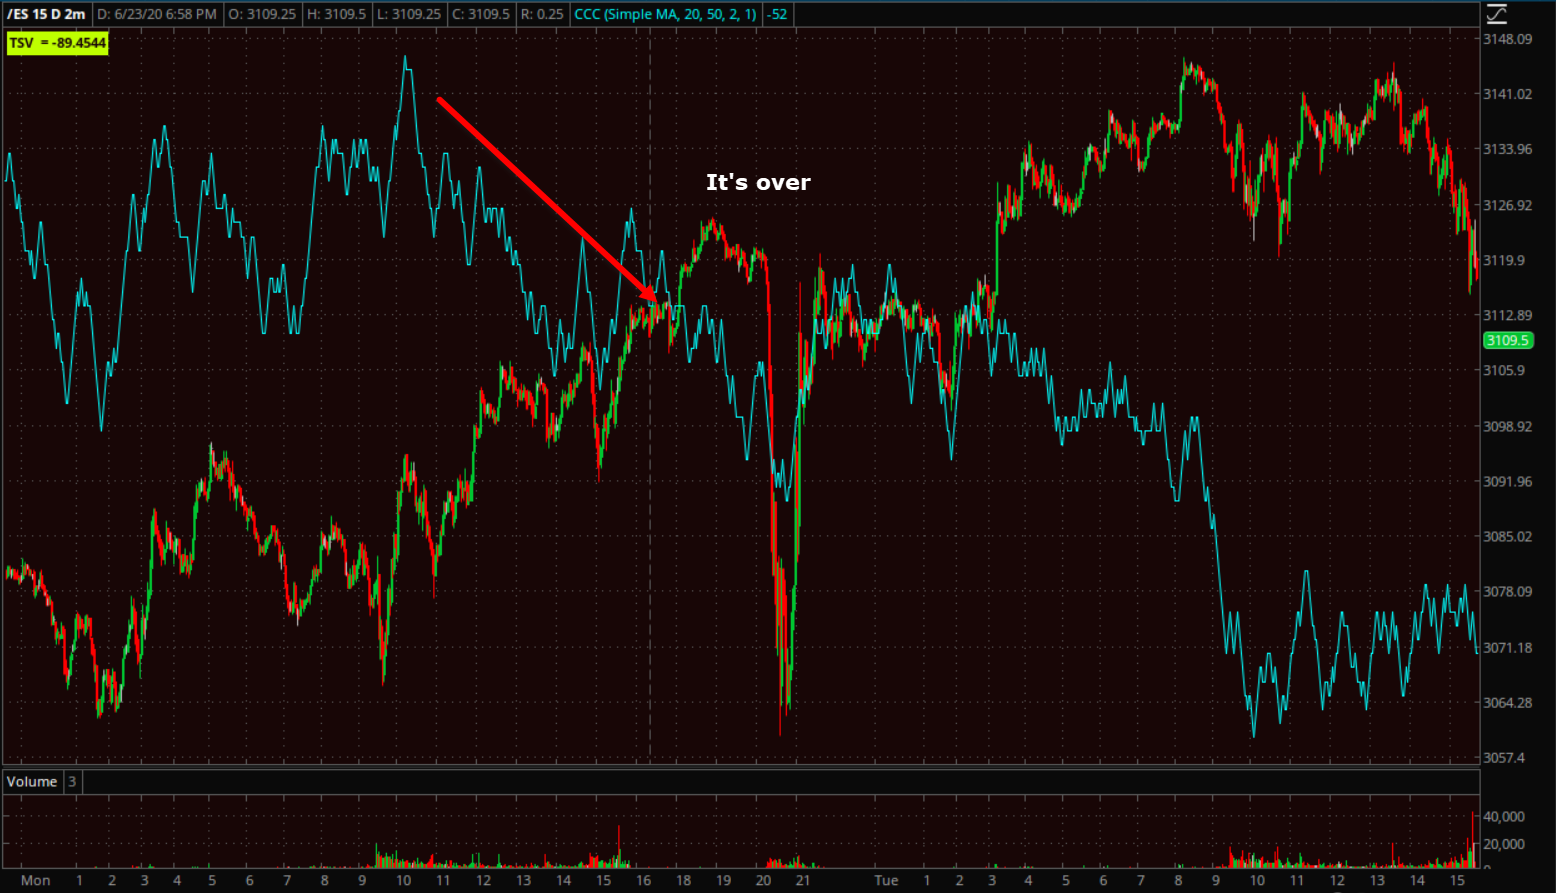 S&P futures (2m)- While Navarro quickly recanted and prices rebounded last night, the negative divergent 3C trend continued into today’s cash session.
This afternoon I noticed buying conviction start to fade in the NASDAQ/QQQ. The divergence marked the intraday high and prices faded into the close. The averages closed near session lows.
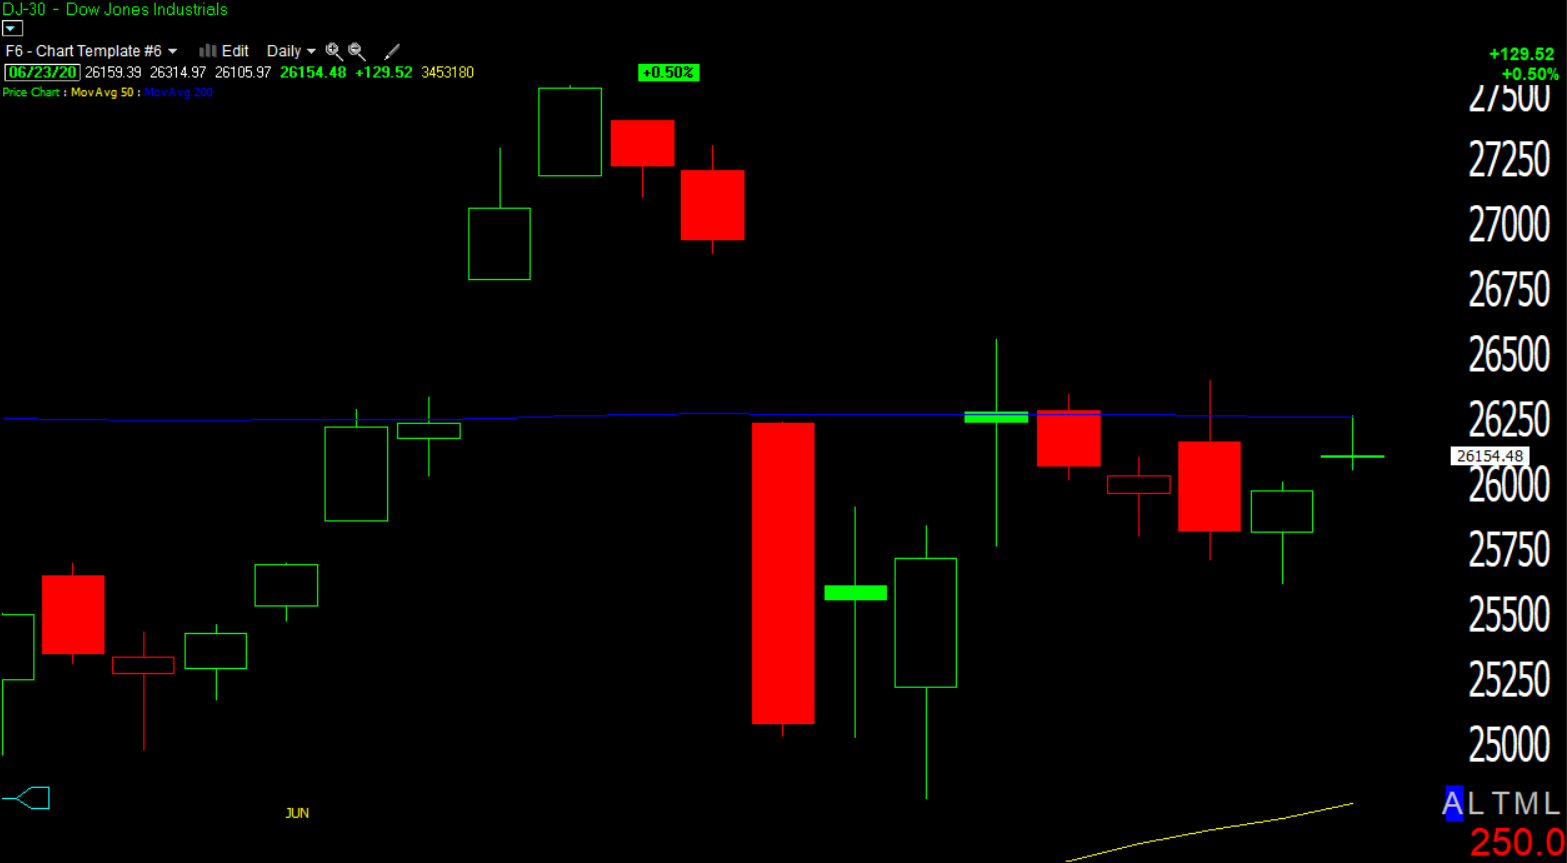 Dow (daily) met resistance at the 200-day moving average and closed with a small Doji Star (loss of upside momentum).
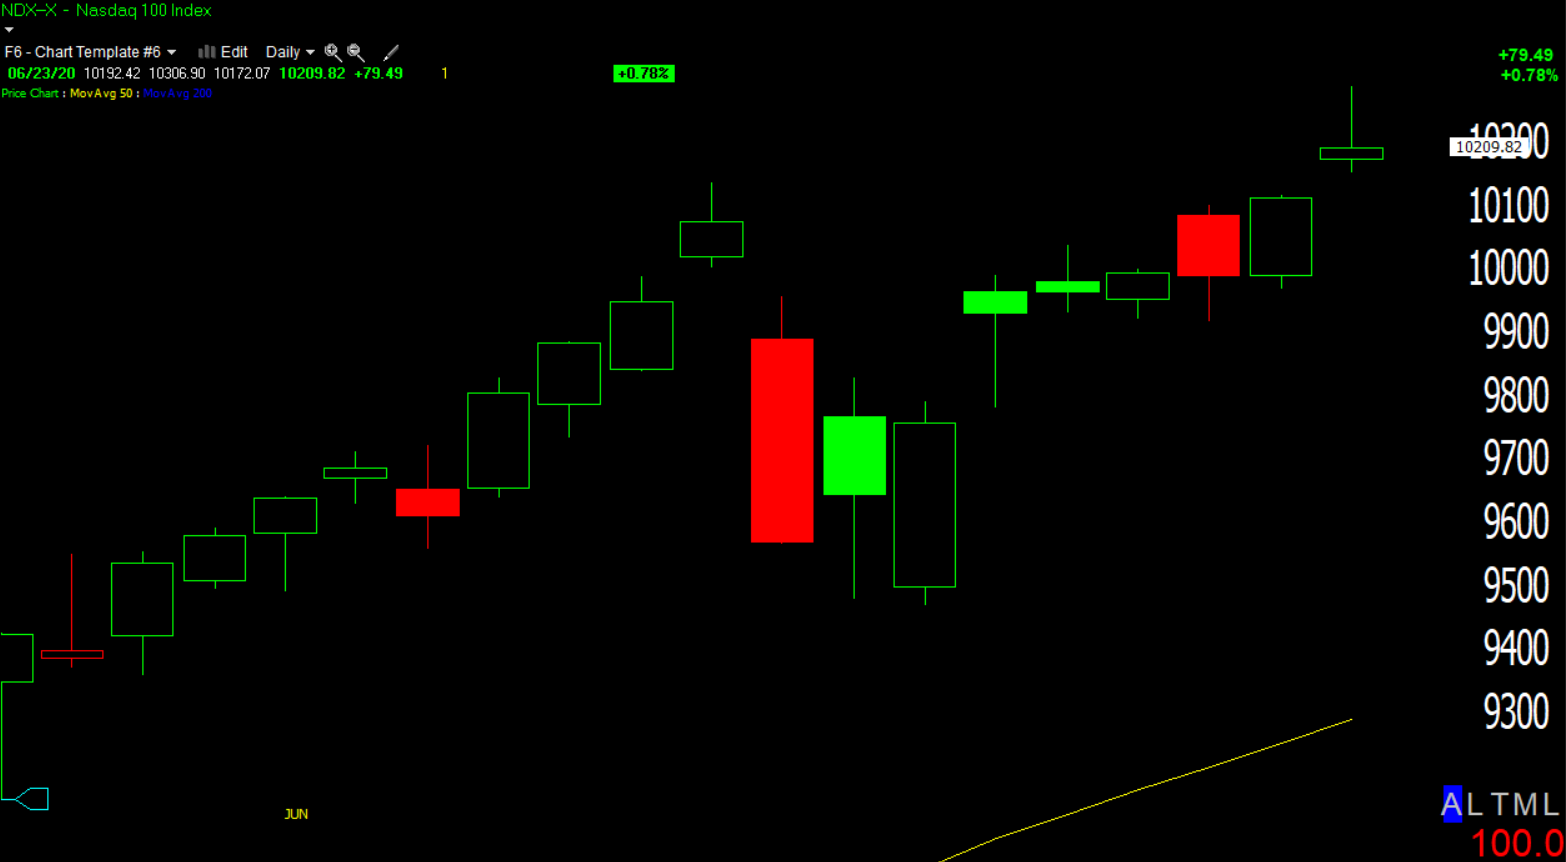 NASDAQ -100 (daily) made a new record closing high, but faded from session highs on the 3C divergence and ended with a doji/shooting star. In Japanese candlestick vernacular a shooting star is described as, “trouble overhead”.
Like the S&P, the NASDAQ 100’s equal weight index lags behind too when stripped the heavy weighting of stocks like Apple.
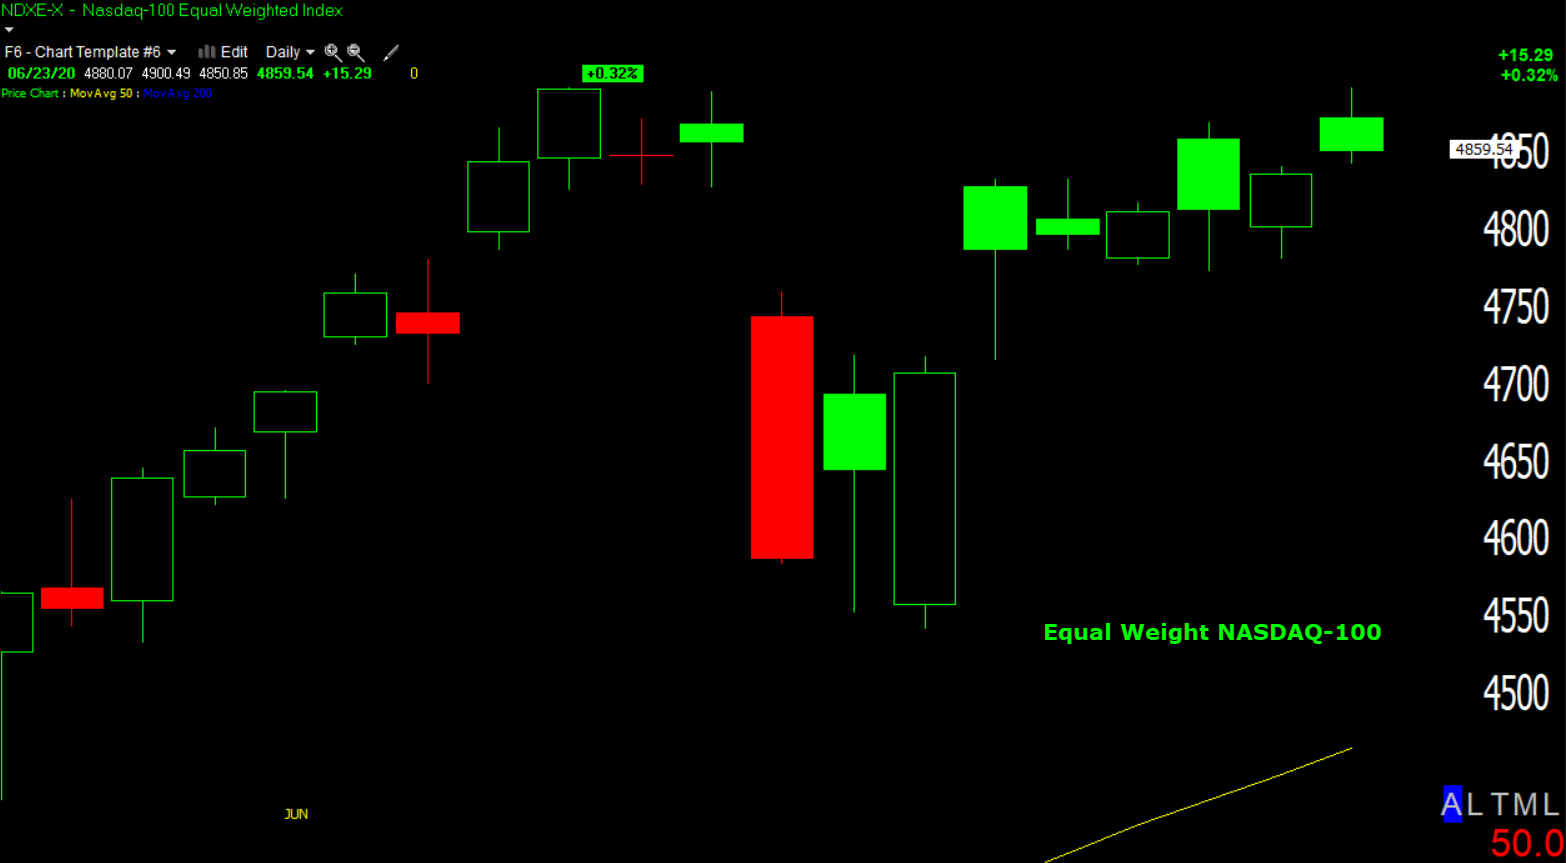
NASDAQ 100 Equal Weighted Index (daily) has not made a new high since June 8th.
I remember a long time ago when Apple had nearly a 20% weighting in the NASDAQ 100. Apple’s weight was more than the bottom 50 NASDAQ 100 stocks combined. If you created an index with those 50 stocks and Apple, all 50 of those stocks could be down 2% each, but if Apple was up 3%, the index would close higher despite 50 of 51 stocks closing lower.
The Value Line Geometric Index gives us a view of how the average stock is doing without the distortions of Cap-weighting.
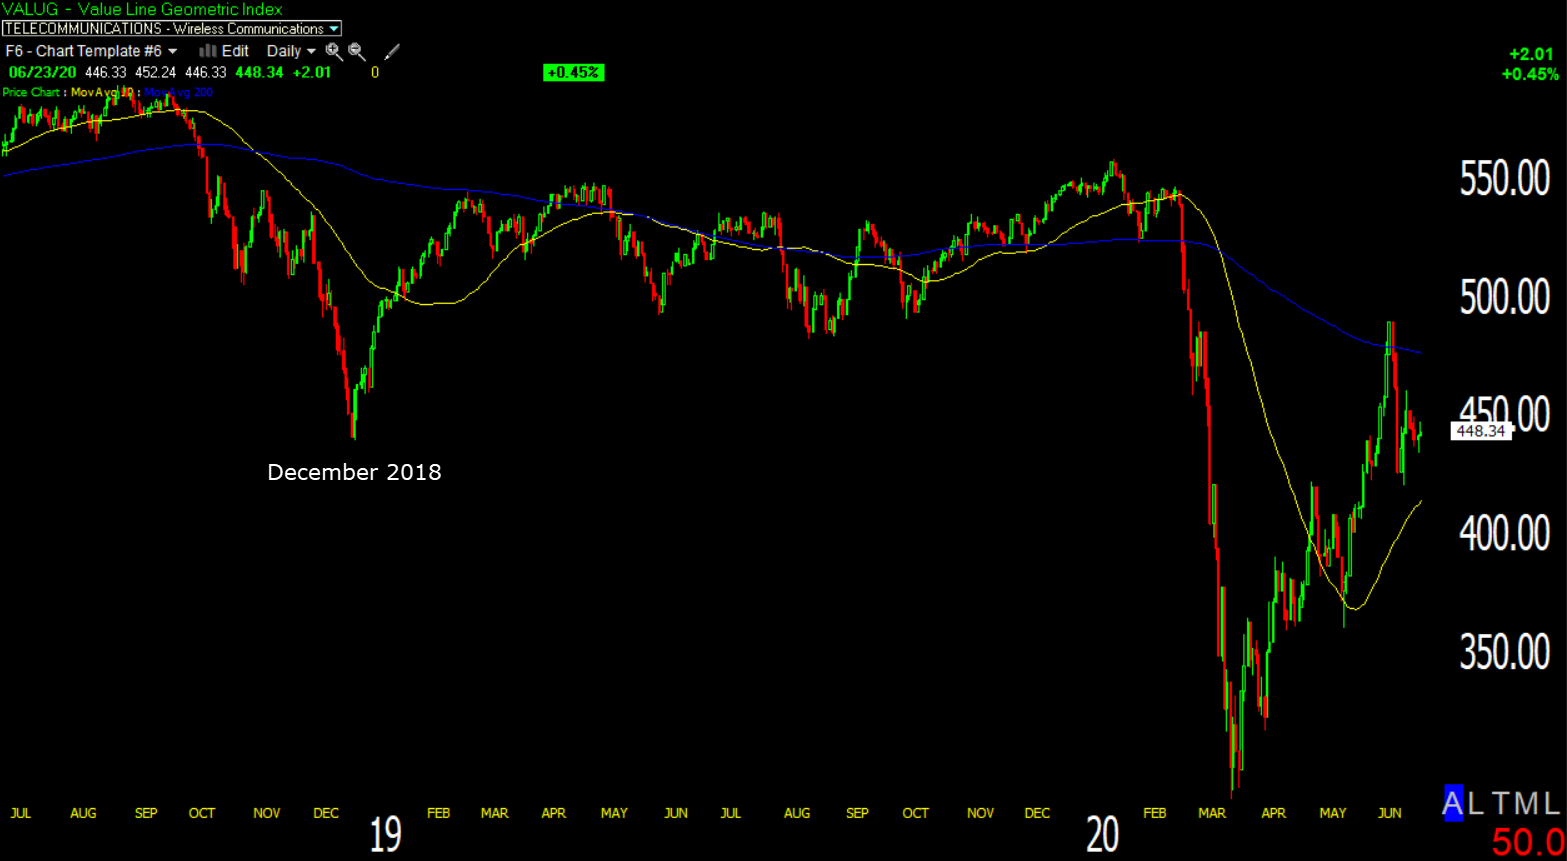 Value Line Geometric Index (daily) notice it’s not just below its 200-day, it’s below the December 2018 sell-off lows.
S&P sectors
All 11 S&P 500 sectors started the session sharply higher after President Trump clarified that the U.S.-China trade deal was still intact and June flash Manufacturing PMIs out of Europe improved more than expected. There was an early bias toward the cyclical sectors along with Small Caps, but that quickly faded. Regional Banks (-1.2%) lost early gains of +2.8% and dropped into the red in the first hour causing Small Caps to lose leadership and almost lose all gains. From that point the mega-cap FAANMG stocks were bid and the sectors they populate took over leadership (Technology, Communications and Consumer Discretionary).
By the close most cyclical sectors barely held their gains, and defensive sectors all closed lower. The only meaningful market support came from a handful of heavily weighted mega-cap stocks – Apple (AAPL +2.1%) and Amazon (AMZN +1.9%).
The Utilities sector traded and closed below its 50-day moving average. The defensive sectors’ weakness could be troublesome for the broader market as they usually outperform when the market pulls back or declines, mitigating deeper market losses.
Materials ⇧ 0.23 %
Energy ⇧ 0.10 %
Financials ⇧ 0.46 %
Industrial ⇧ 0.01 %
Technology ⇧ 0.72 %
Consumer Staples ⇩ -0.15 %
Utilities ⇩ -1.01 %
Health Care ⇧ 0.43 %
Consumer Discretionary ⇧ 0.79 %
Real Estate ⇩ -0.37 %
Communications ⇧ 0.65 %
Most sector trends are little changed. There are 3 or 4 unique trends among S&P sectors. The mega-cap heavy sectors have similar trends. The Defensive sectors have their own trend, as do the cyclical sectors, and Health Care has its own.
The cyclicals (Materials, Energy, Industrials, Financials) are consolidating most similarly to the S&P with support areas below.
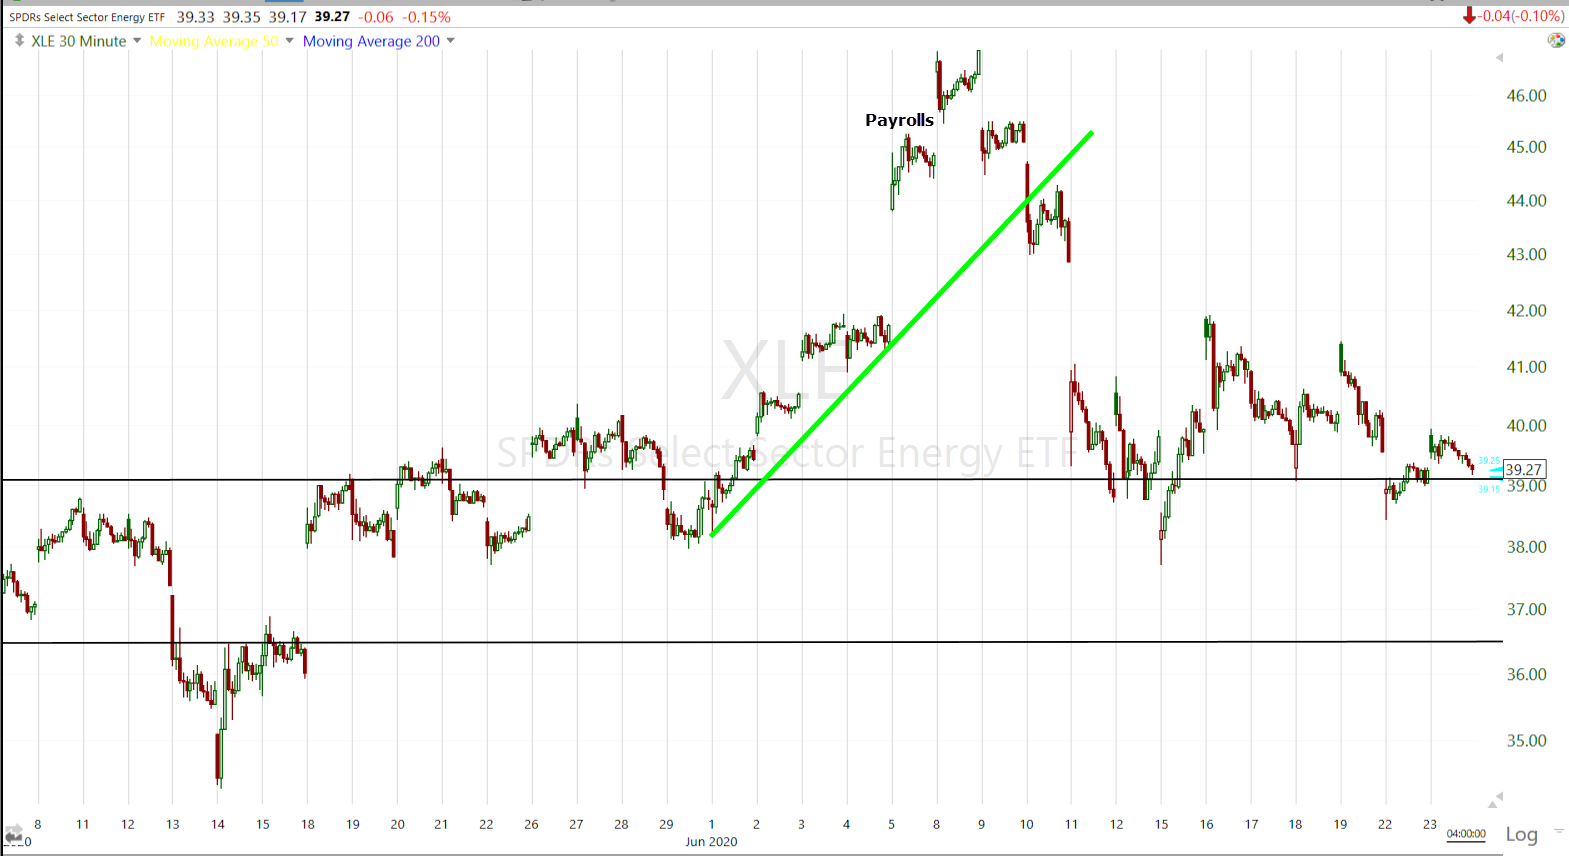 Energy sector (30m) broke out of a 5 week lateral range as part of the value rotation into the payrolls report, then reversed, breaking the up trend. Most of the cyclical sectors are similar in price trend to Energy. The nearby zone of support below is the former 5 week lateral range.
The top-weighted Technology sector has the strongest trend.
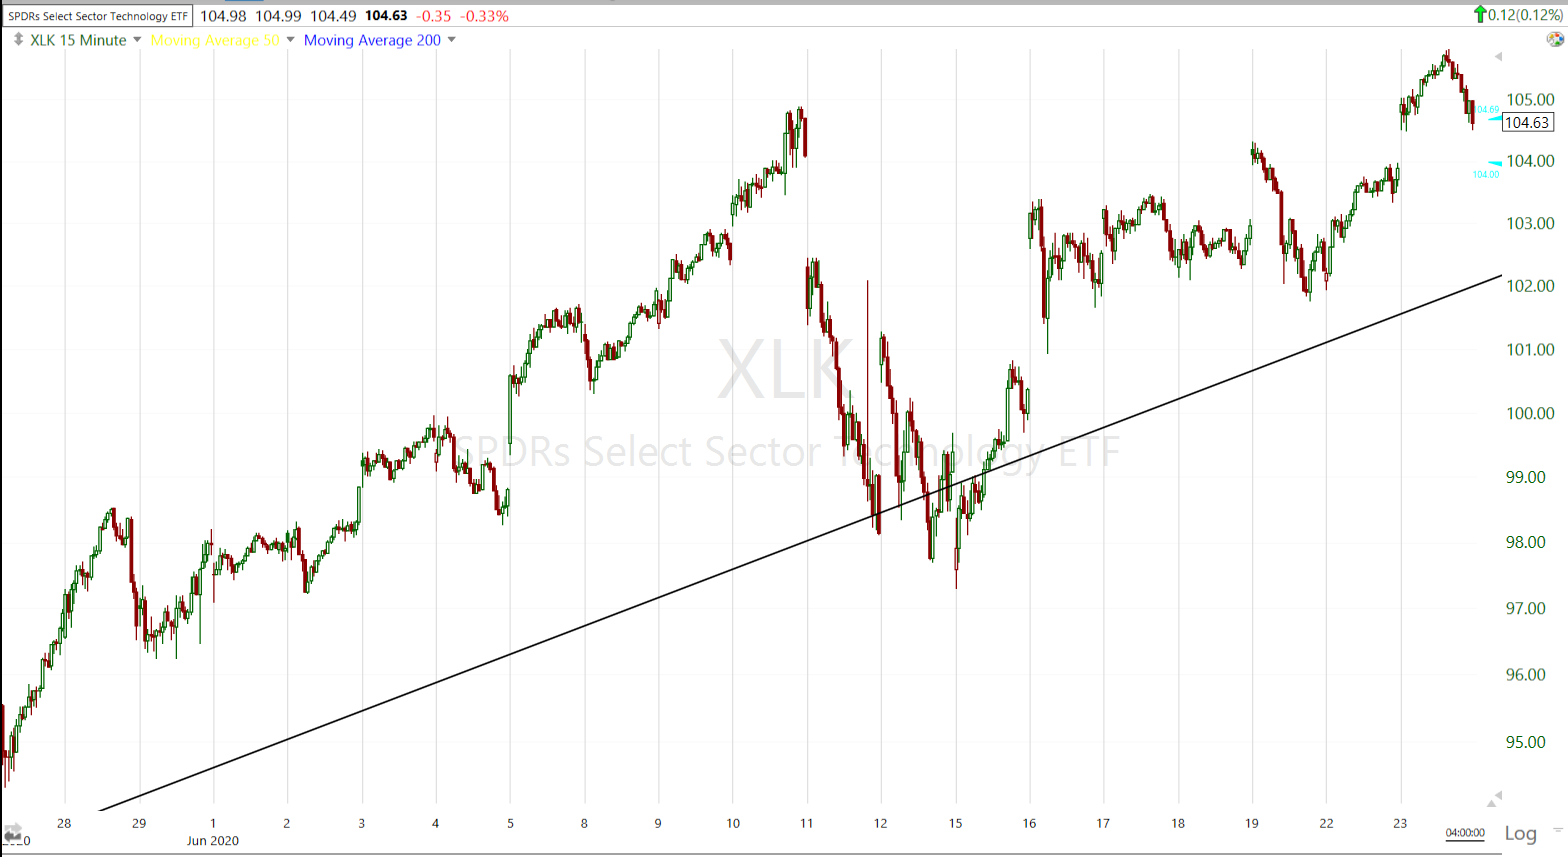 Technology (15m)-the sector barely traded below the up trend from March’s low and recaptured it as the mega-caps came back into favor following the failed rotation to cyclical/value/small caps.
Consumer Discretionary and Communications are similar in trend to Technology, but they trade below the same trend from March’s low. In the case of Communications, it trades below a large rising wedge.
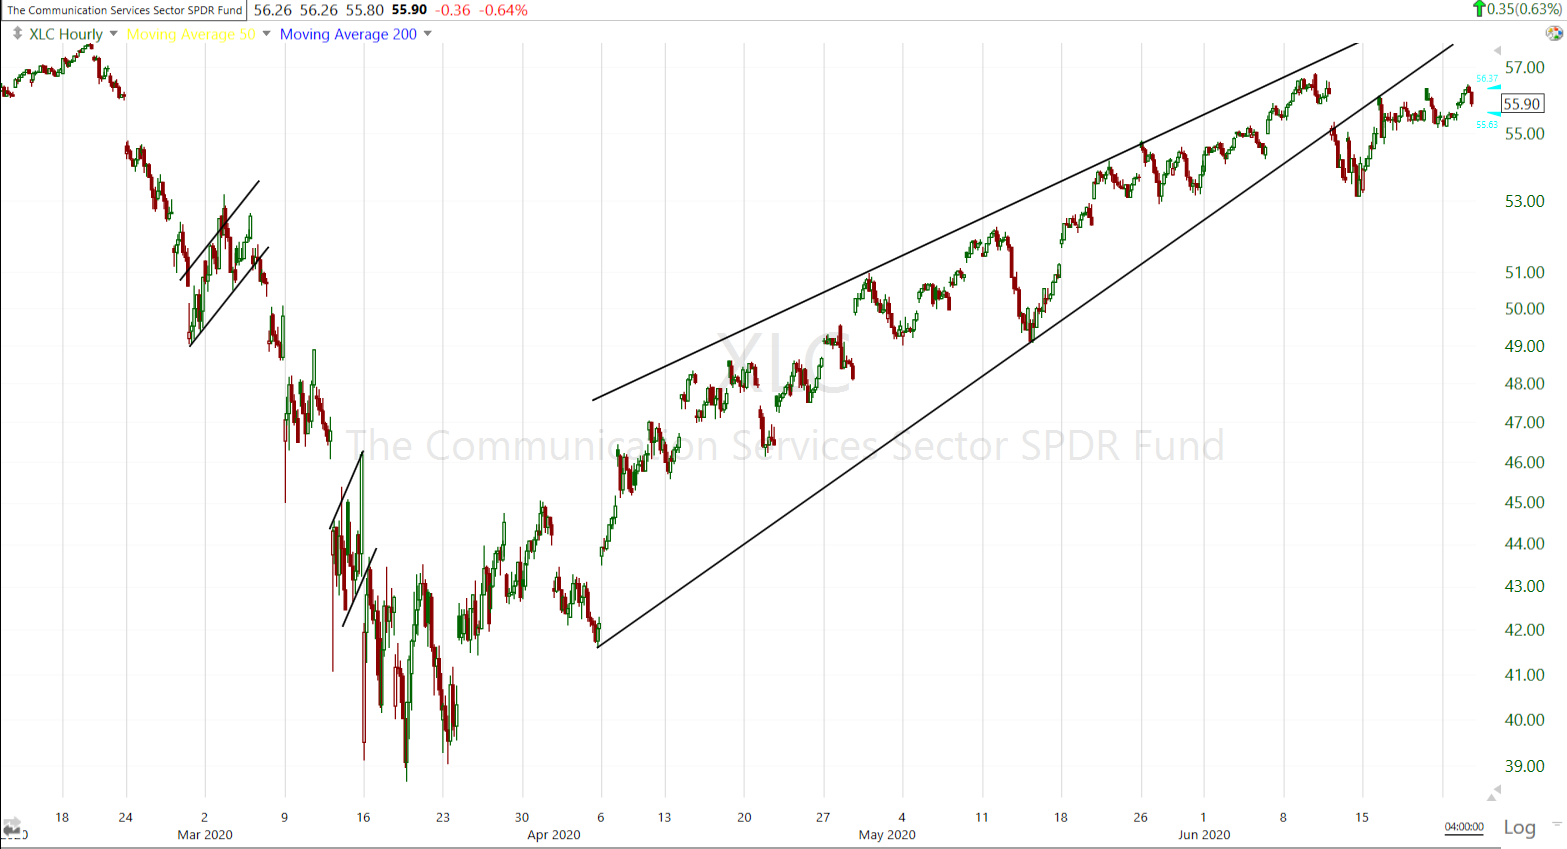 Communications (60m)
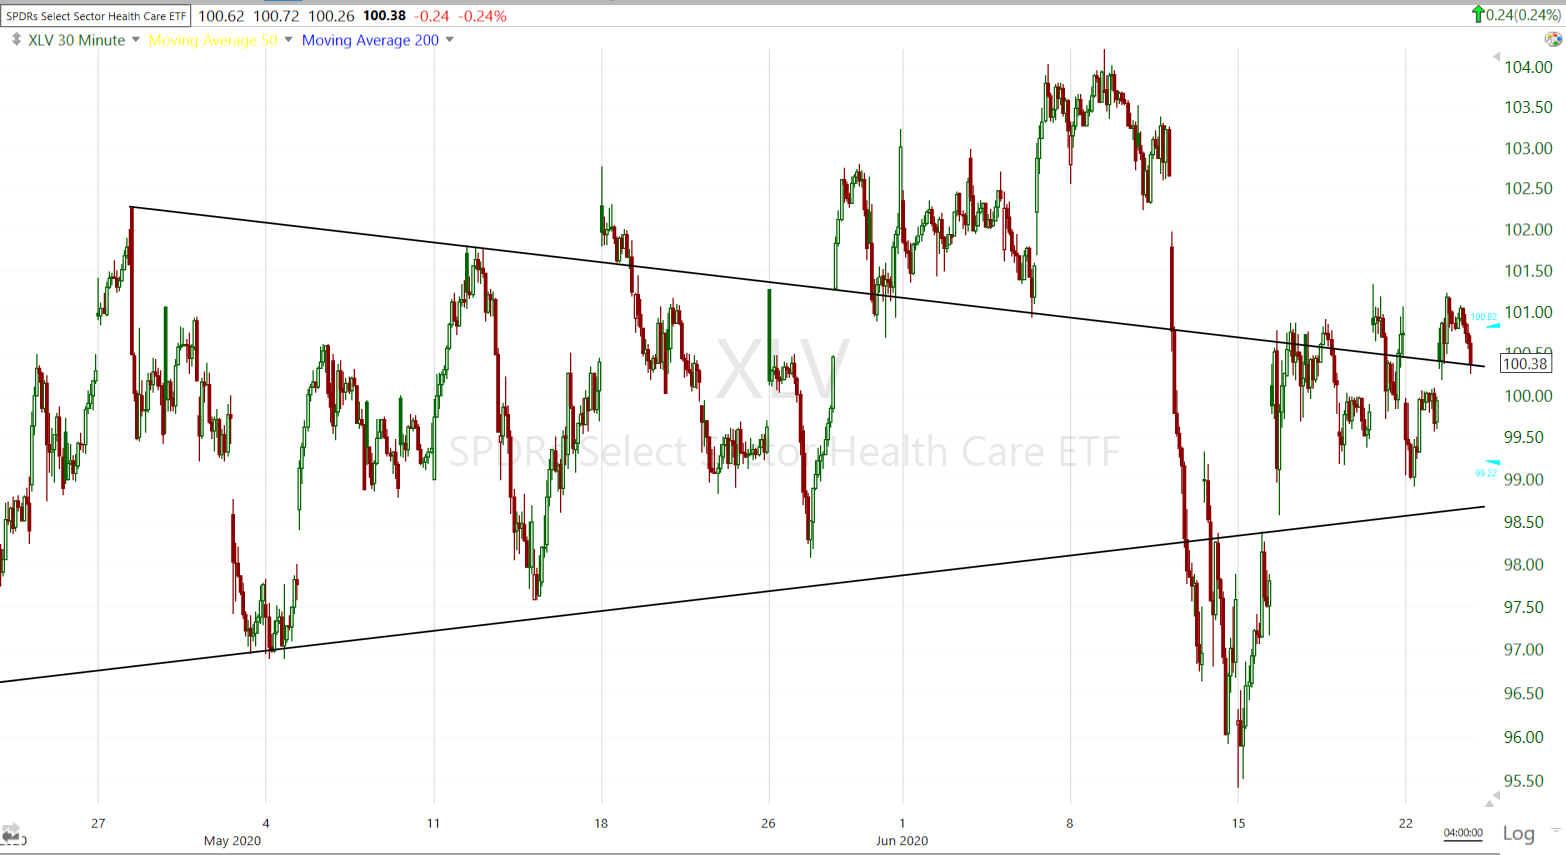
Health Care (30m) rally topped out in April and traded sideways in a large triangle for 5 weeks. It broke out above the triangle, but didn’t see much follow through. The breakout failed after the post-Payrolls market decline.
As for the defensive sectors…
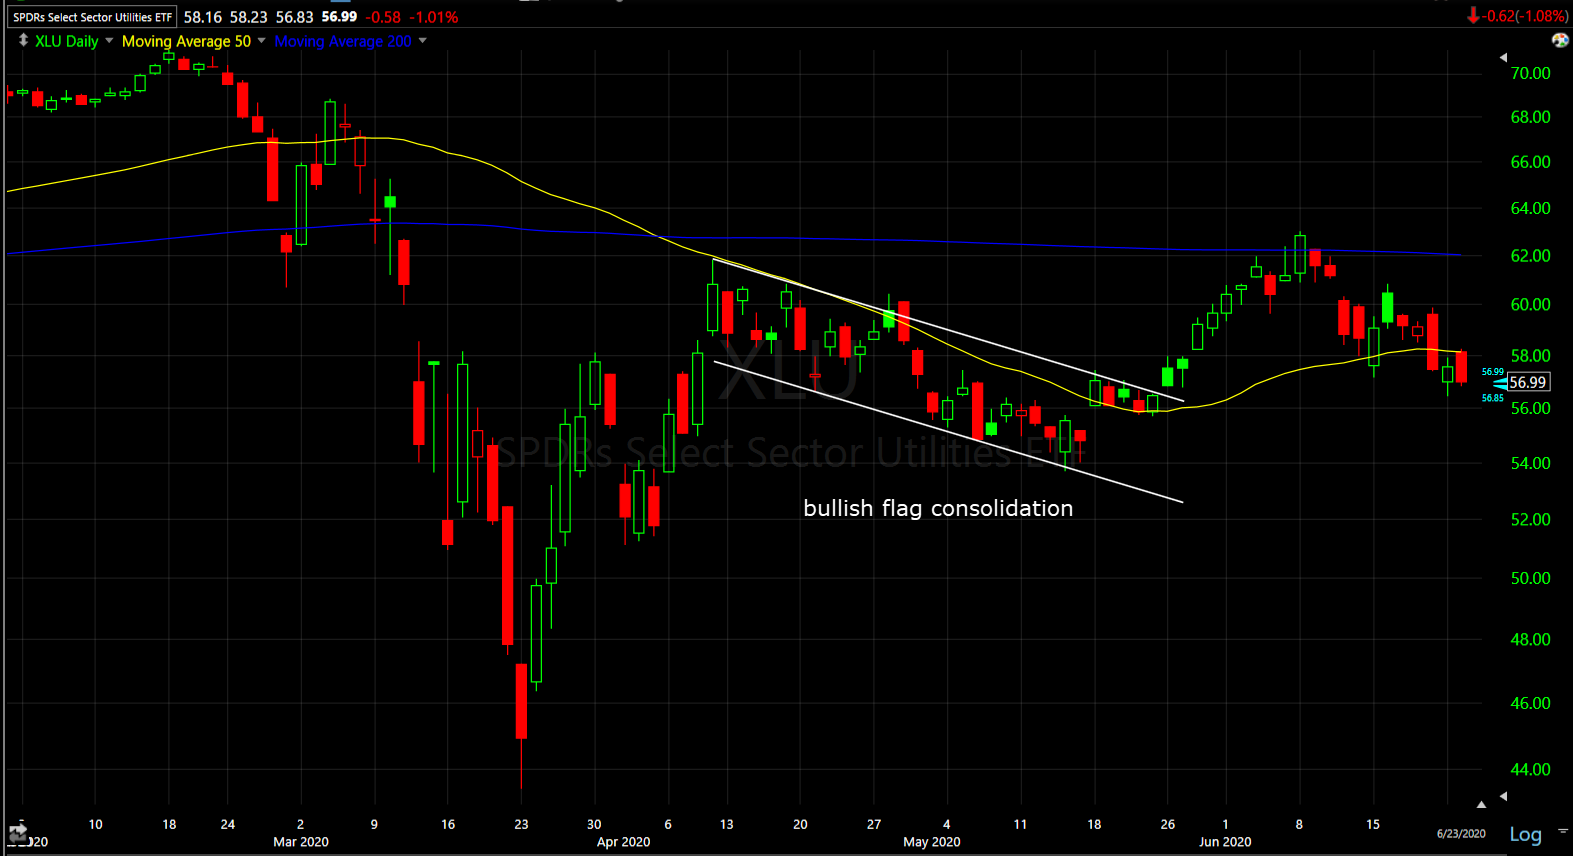
Utilities sector (daily) -all of the defensive sectors put in solid bullish flag consolidations and broke out. All 3 have since met resistance at their 200-day moving average (blue) and backed off more than I’d like to see for a constructive chart. Utilities fell and closed below the 50-day moving average (yellow).
Internals
Internals reflect a lack of conviction amid the narrow leadership – Advancers (1677) and Decliners (1232) on lighter volume of 1 bln. shares.
There is no dominant price/volume relationship.
NYSE 52 week lows aren’t jumping off the chart, but they are the highest in two weeks, or the highest since just before the post-Payrolls market decline. This makes sense considering the equal weight S&P index reflects more stocks trading lower than the cap-weighted index.
Treasuries
U.S. Treasuries finished near their flat lines in a lackluster session. The 2-year yield was unchanged at 0.19%, and the 10-year yield increased one basis point to 0.71%.
Given the safe-haven moves/signals in USD/JPY and gold, I’m watching treasuries closely.
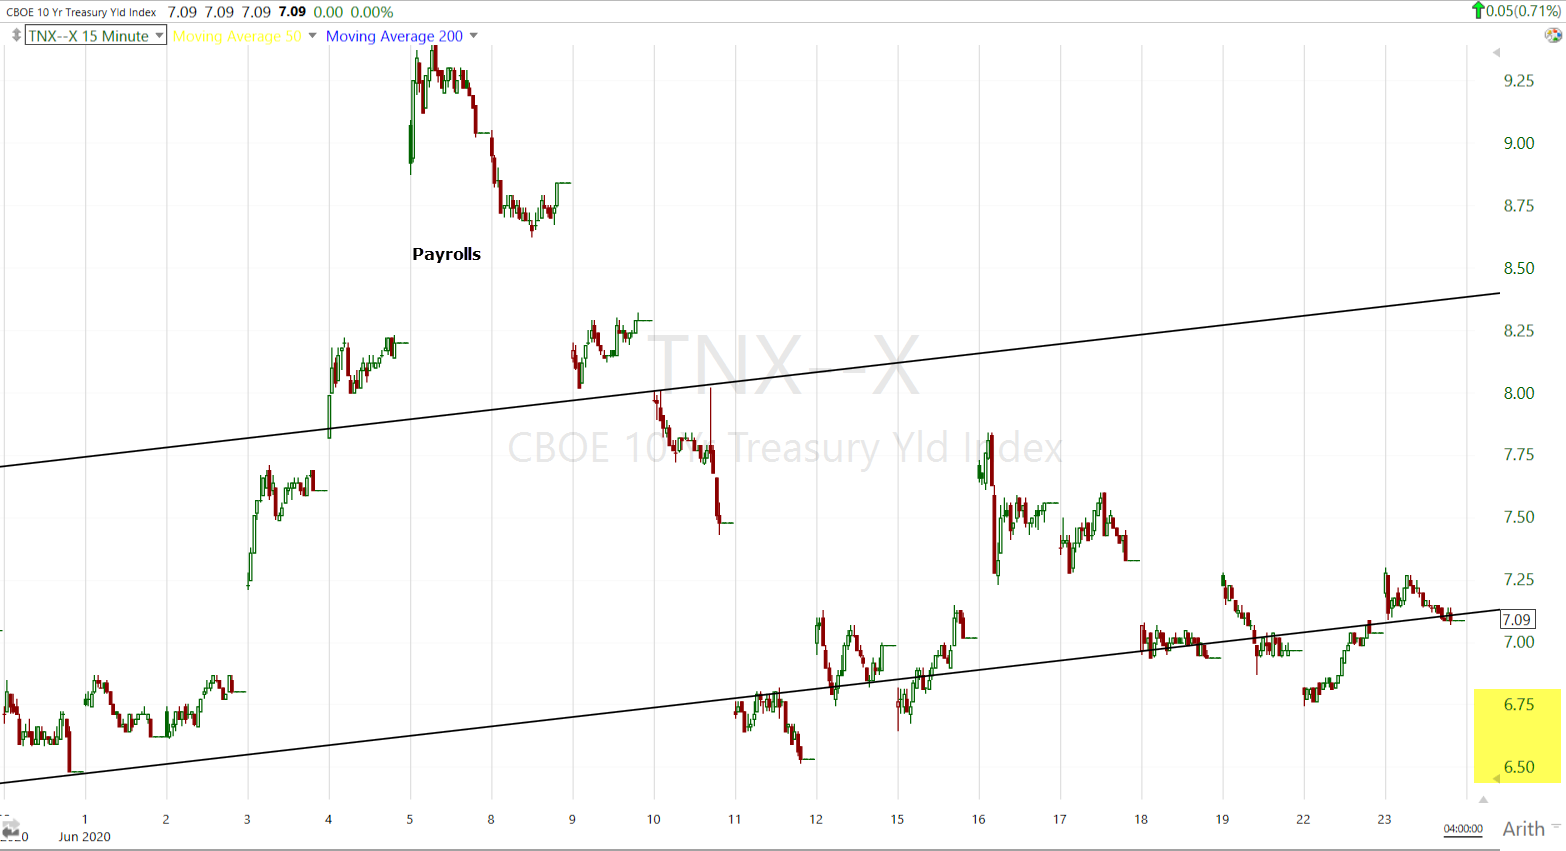
10-year yield (15m) trading below 0.70% would lean more risk-off, and below 0.65% I’ll be backing up the truck adding short exposure.
Currencies and Commodities
The U.S. Dollar Index -0.3% to 96.72.
WTI crude declined -0.5% to $40.38/bbl. While not a big deal in percent change terms or even trend, the market’s tone shifted (negative) this afternoon as WTI crude traded below an uptrend from last Monday.
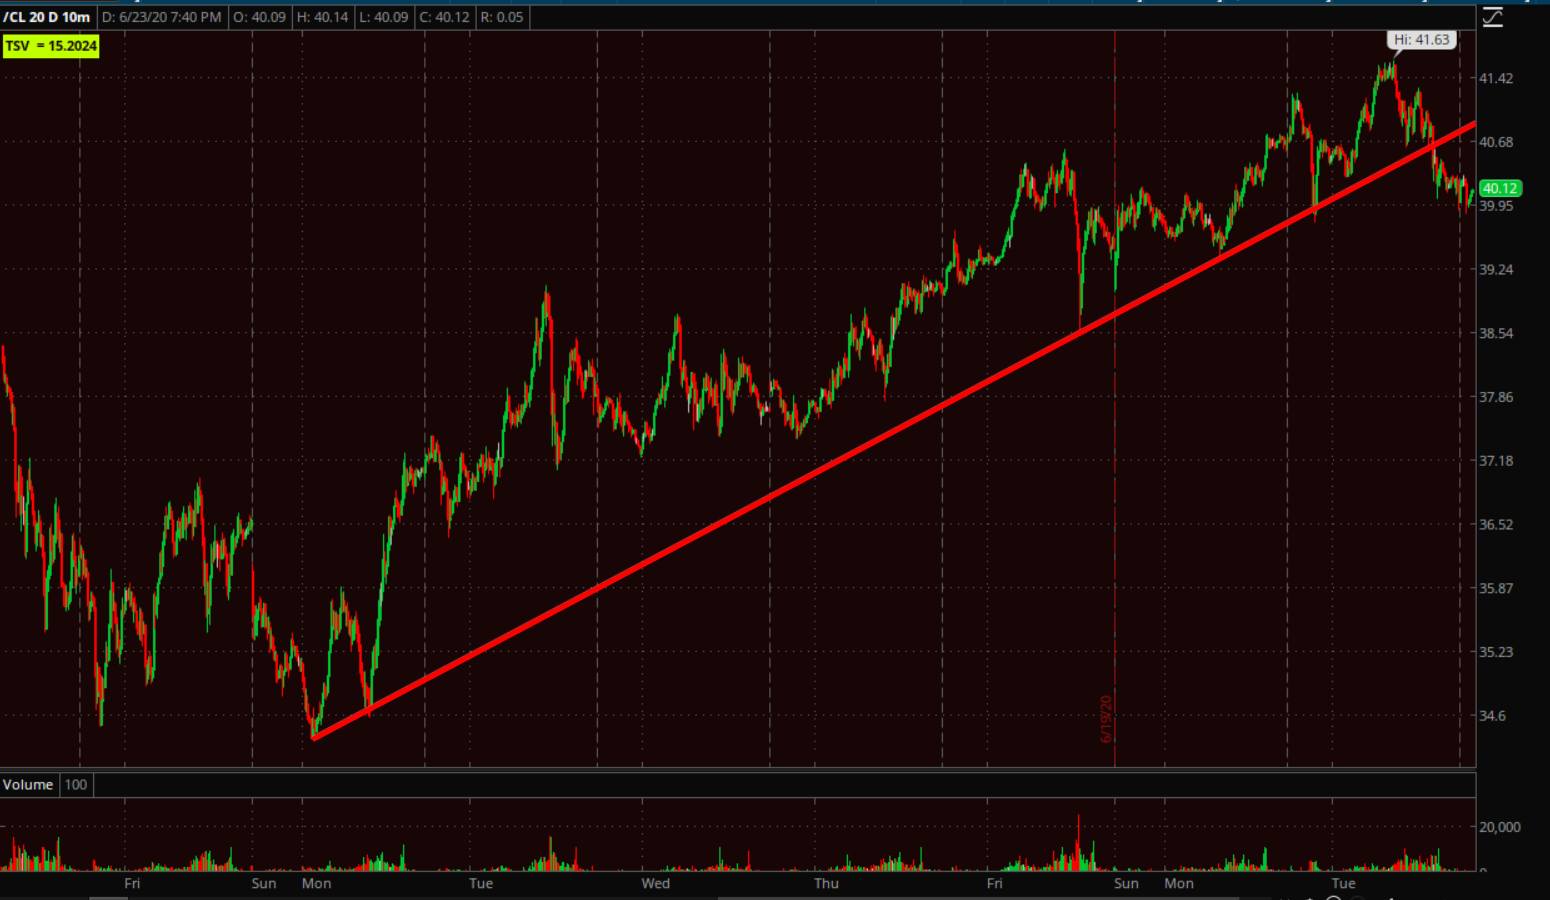 WTI Crude (10m)
Credit looked a little “iffy” this afternoon.
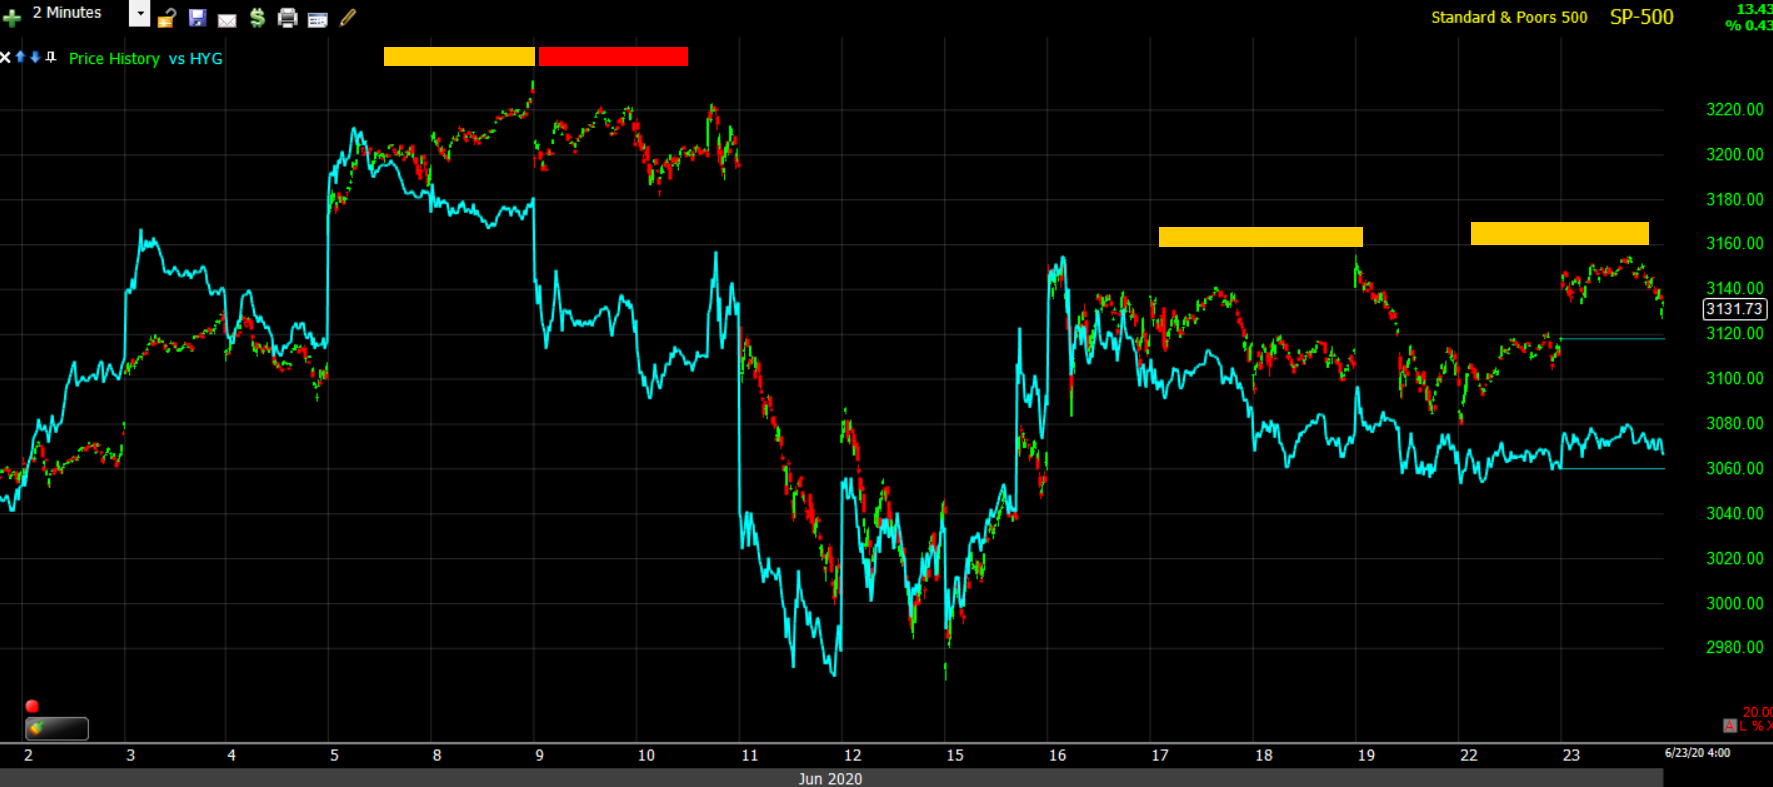
SP-500 (2m) and High yield credit.
Gold futures added another +0.9% to $1782.00/ozt. to trade to an 8-year high, even as the S&P traded up 1% earlier.
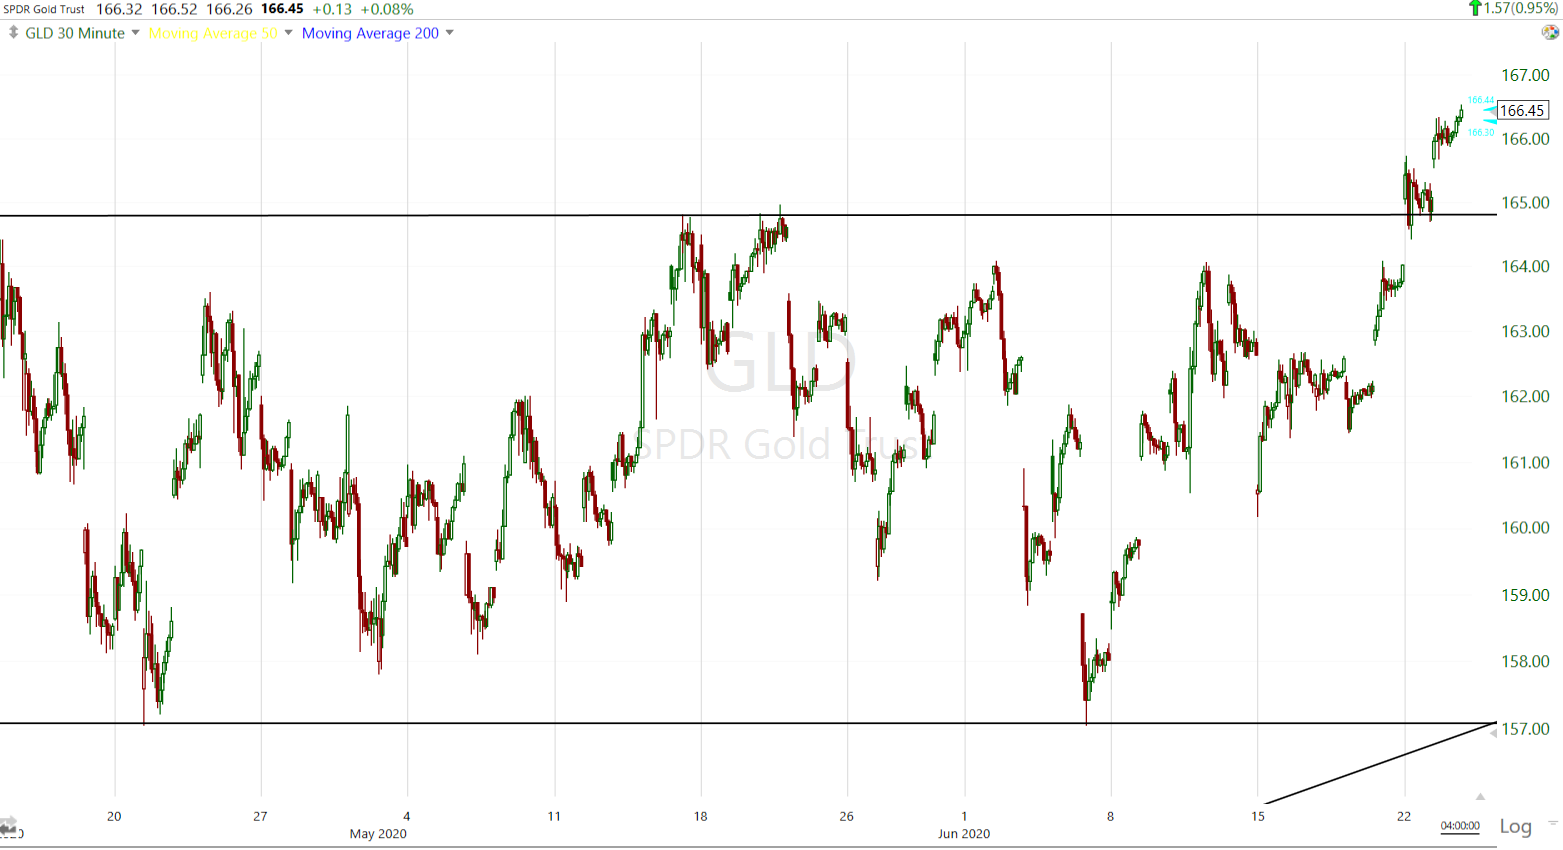 GLD (30m) price action still looks good.
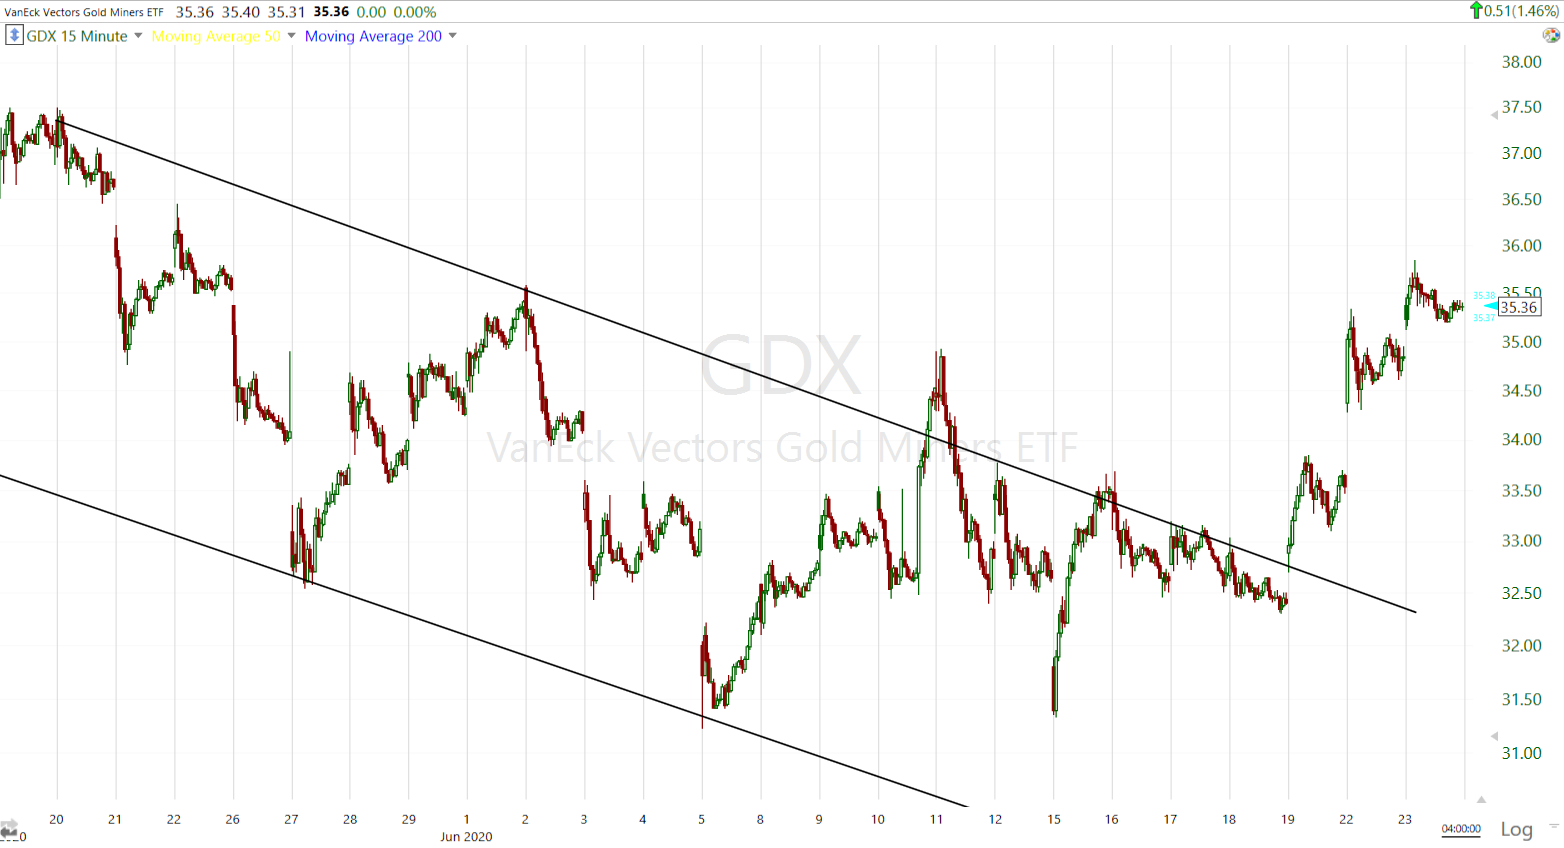
Gold Miners/GDX (15m) price action looks good too.
GBTC added +3.6% and ended with a bullish engulfing candle.
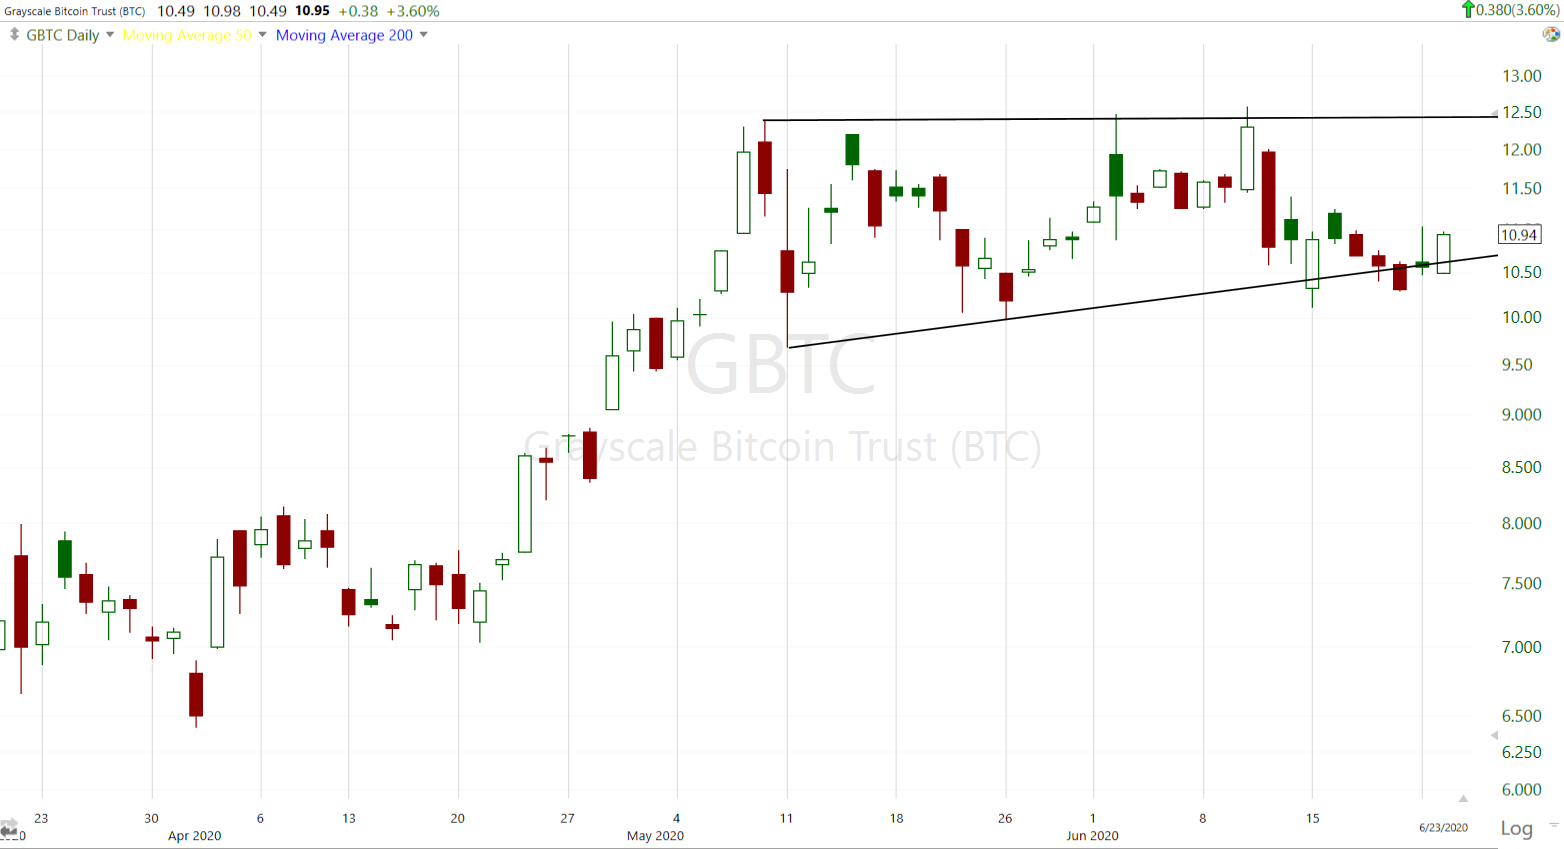 GBTC (daily)
Bigger picture…
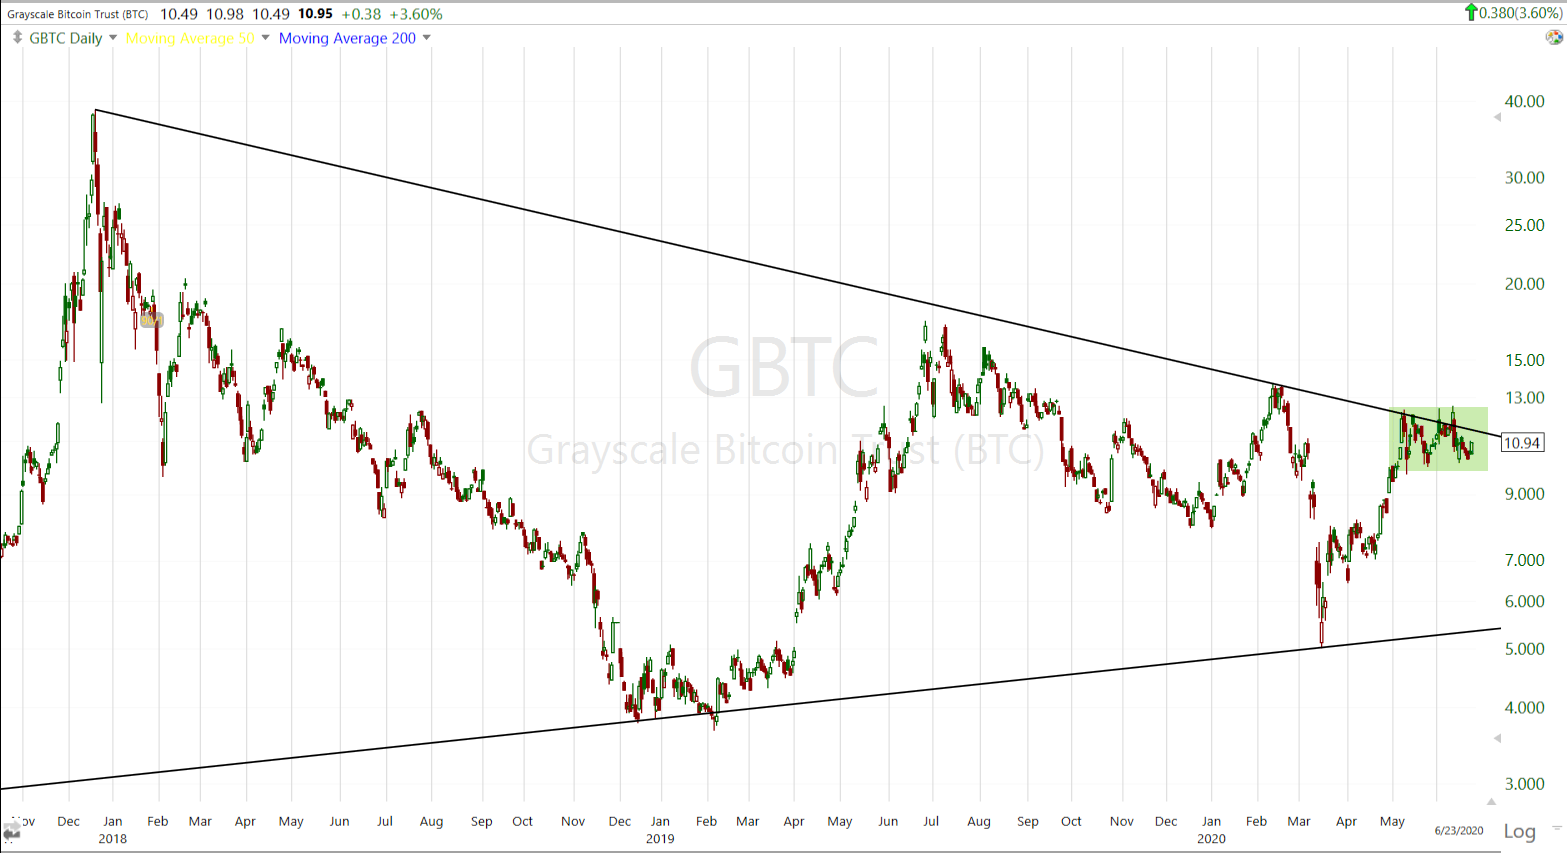
GBTC (daily) a breakout above $12.50 would be very significant and bullish.
Summary
The mega-caps are certainly the center of attention and have been since Payrolls. I think a second leg market decline is a probability and I have suspected the currency and/or bond markets would give a signal leading to that second leg decline. I’ve been sitting on my hands waiting for those signals. USD/JPY broke below its consolidation this morning, which is significant because it led stocks lower earlier this month when the S&P lost 7%, and it led stocks higher or into the last week’s correction.
The signal from USD/JPY started the next trading day after Payrolls (Monday). Yields confirmed and fell sharply the following day (Tuesday) and the S&P fell the next day. Credit markets were negatively divergent then too.
Gold gave another interesting signal this week with its breakout. I’d like to see the bond market confirm those signals.
I’d estimate a second leg decline for the S&P to be between 7% and 8% which would be the $2900 area. The S&P has a rising wedge as well and the rule of thumb target would be to retrace the base in the mid 2800’s. At that point the 200-day would be solidly broken and we may be in a very different environment, but one step at a time.
I have short exposure in small caps, GE, WFC and HTZ (covered in the Afternoon Update). I have not decided where I’ll focus my attention should we get a confirming signal from bonds, which I suspect we will. I had not thought about Technology/NASDAQ at all, but the fact of the matter is that if bonds confirm a risk-off signal and the market makes a second leg lower, Technology and NASDAQ will go along for the ride. The NASDAQ sure looks extended and overcrowded to me. To justify the valuations the market narrative was first to write off 2020 or give the market a mulligan, and use 2021 expected earnings. Assuming there’s no surprises with the virus or elections, the S&P 500 trades at 22x next 12m consensus EPS and Tech at 25x. Now investors are writing off 2021 as well and using 2022 to justify CURRENT valuations! It may not be my first choice, but I’ll be looking at Tech and/or NASDAQ/QQQ.
Overnight
S&P futures are flat, but look to have found some support after the close.
NASDAQ 100 futures (2m) – look to have found some support after the close.
VIX futures firmed up a little, especially compared to yesterday, but still feel heavy. There may be some influence from TVIX.
Crude is near flat (-0.1%)
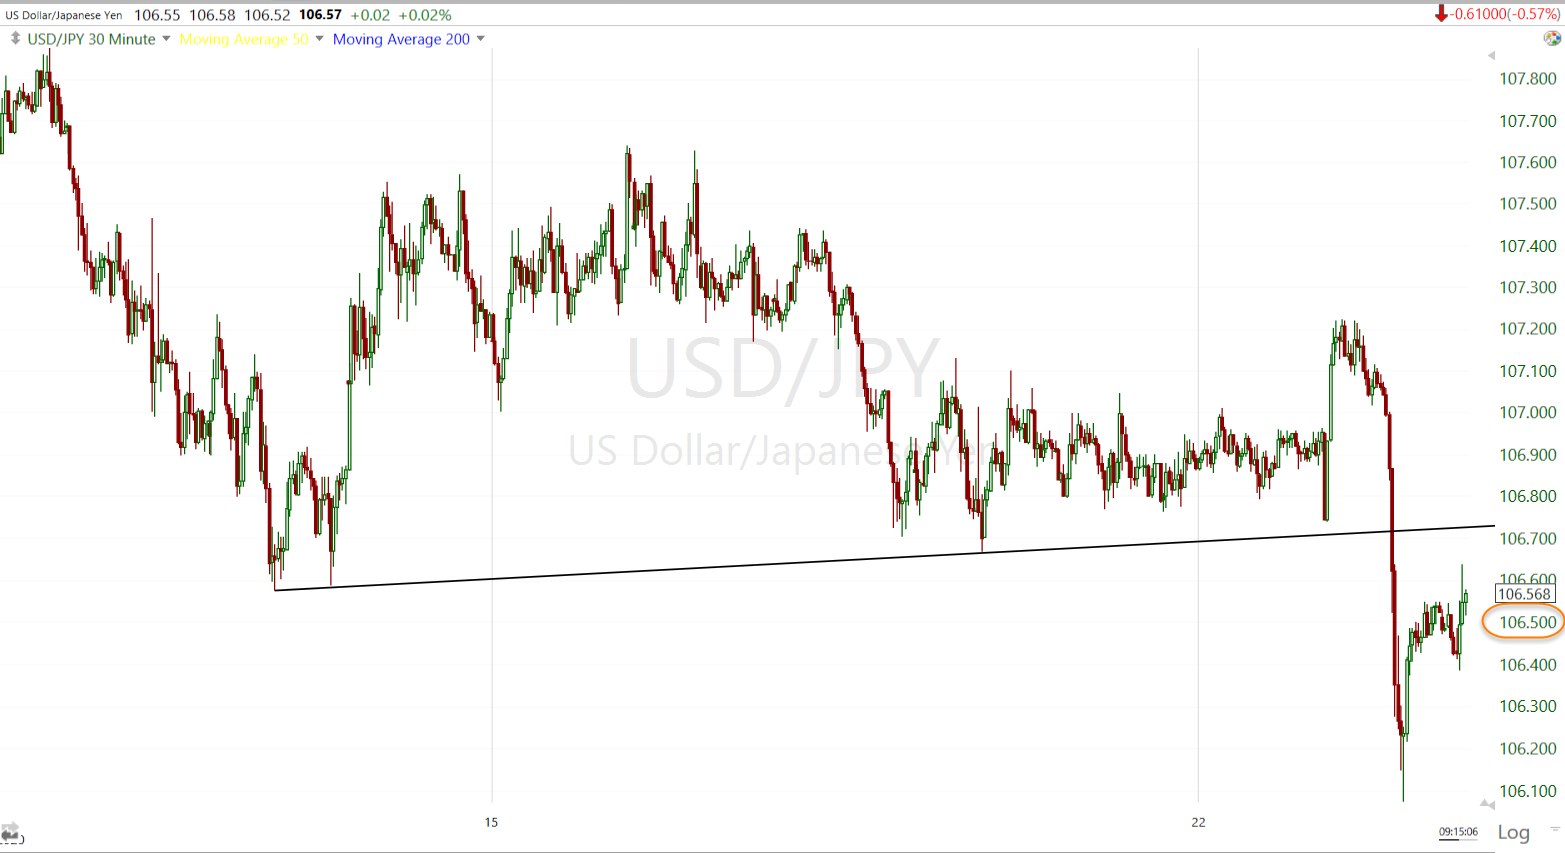
USD/JPY (30m) has been consolidating since breaking the trend this morning.
Treasuries have not firmed up yet, keep an eye on them.
Tomorrow we get the FHFA Housing Price Index for June and the weekly MBA Mortgage Applications Index. The IMF will release new 2020 growth projections on Wednesday. U.S. jobless claims, durable goods and GDP data are due Thursday. Also the Fed’s enhanced stress test- results from both of its annual stress tests as well as supplemental analyses to assess bank capital under different coronavirus-related scenarios are out Thursday. A rebalance of Russell indexes is due on Friday.