Daily Market Wrap
Today was yet another volatile day that started with a choppy overnight session. NASDAQ futures were down 1% before the open, up +1.5% early in the cash session and ended lowe by -2.1%. It wasn’t just NASDAQ, the price volatility was market wide in what ended up being broad-based decline with a de-leveraging feel. Nothing was spared – mega-caps, cyclicals, defensive, growth and value all down.
Take a look at the heat map for the major averages…
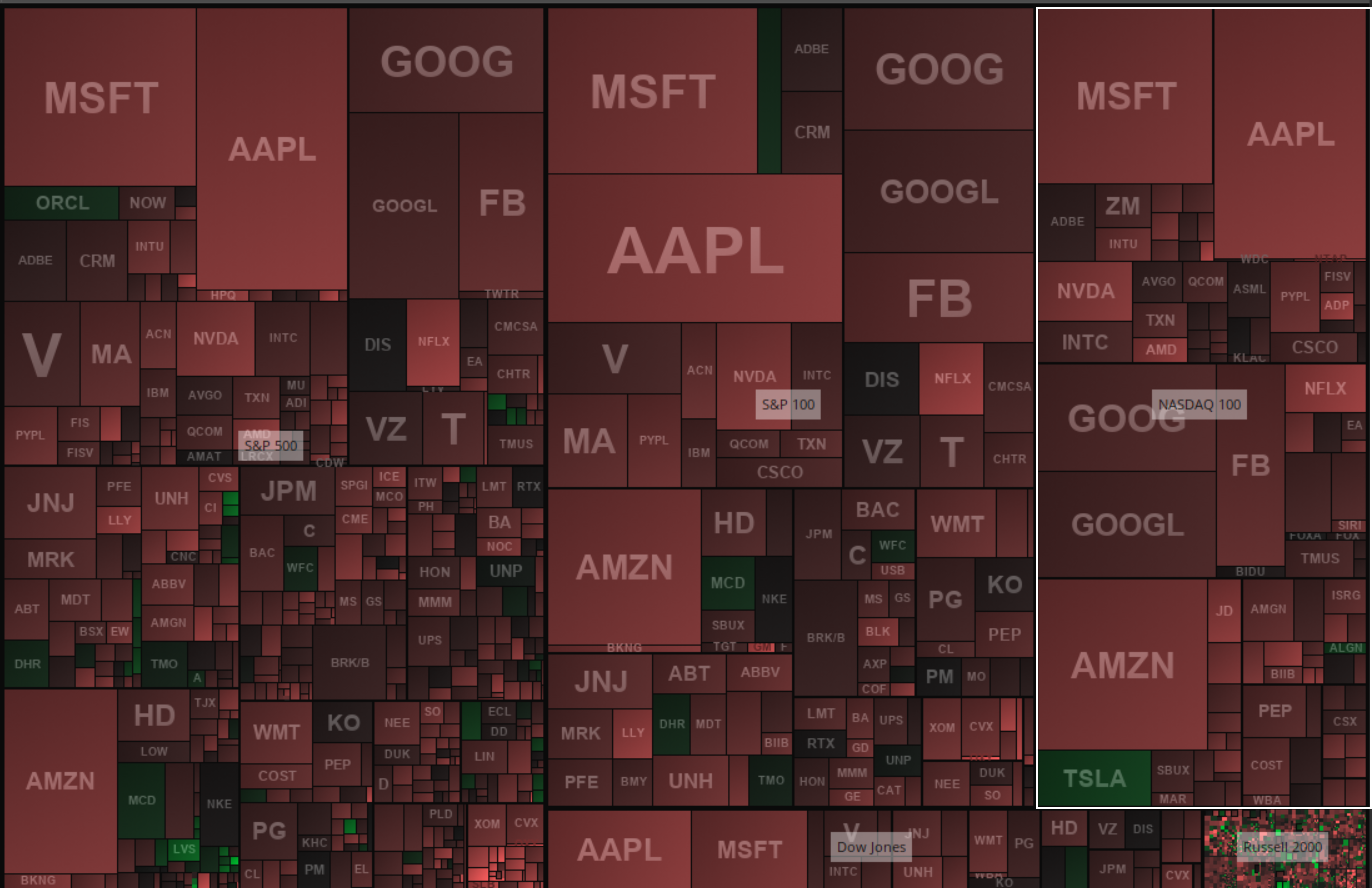
NASDAQ 100 highlighted in white
Initial Claims were disappointing and the Senate failed to pass its $300 billion coronavirus relief bill. Granted, no one was expecting that bill to get very far, but it reflected the burgeoning pessimism surrounding another relief bill before the presidential election.
Mega-cap growth stocks led the market higher early on, but the S&P struggled at yesterday’s highs. Something then changed and the market started trading lower. Technology went from the best early performer to the second worst only behind the Energy sector. The Initial Claims report probably had something to do with the turn in sentiment, but Brexit was clearly a major factor apparent with the sharp drop in Cable (British Pound).
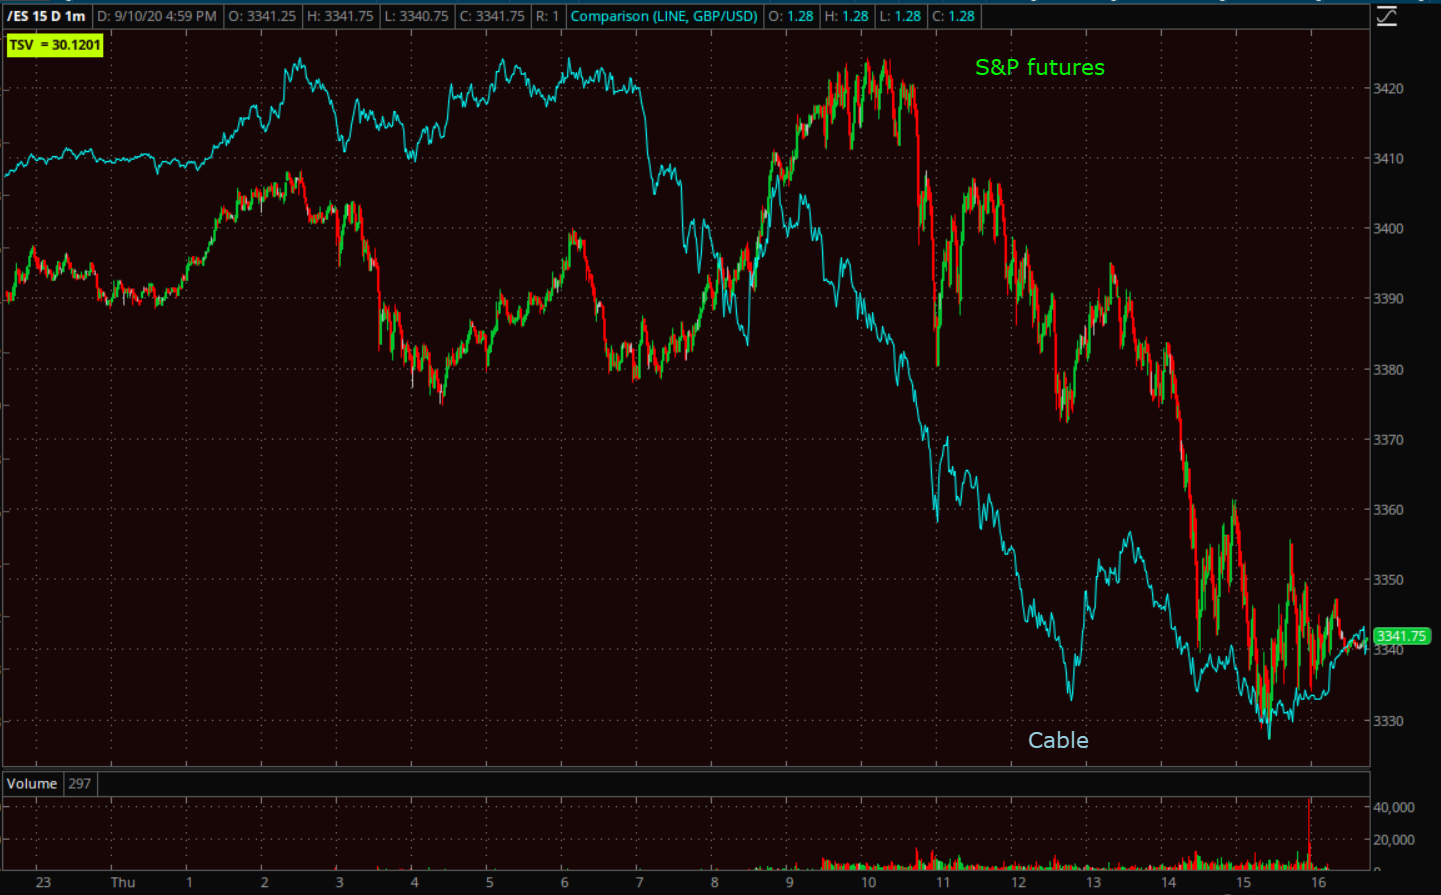
S&P futures (1m today) and GBP/USD plunging.
I can’t recall the last time the stock market gave two-ducks about Brexit, it’s probably been years, which means there’s an entire generation of Robinhood traders looking at today’s market action wondering what happened and Googling, “Brexit”. Today was GBP/USD’s biggest drop in 6 months, down 6 of the last 7 days
It also appears that margin calls played a role again with multiple asset classes including commodities, precious metals and stocks coming down around 2:30 p.m. ET as the U.S. Dollar gained. That would be the second time this week margin calls appear to have been an issue. Here’s Dave Portnoy’s livestream as he gets and deals with margin calls (around 13:25 min). I imagine he’s not the only one of the new generation of traders that were chasing the market higher all of August getting margin calls. I can’t recall the last time I had a margin call, I try not to be in that situation. My rule of thumb is never meet a margin call with cash.
Averages
This is the 4th loss in 5 days. 28 of 30 Dow components ended lower, all but 7 of NASDAQ 100 components ended lower. There was a $1.05bln MOC (market on close) imbalance on the sell-side and the averages ended near session lows, which is never a good look.
S&P 500 ⇩ -1.77 %
NASDAQ ⇩ -2.12 %
DOW JONES ⇩ -1.45 %
RUSSELL 2000 ⇩ -1.23 %
The S&P and Dow ended just above their 50-day moving averages. Like Tuesday, NASDAQ and Small Caps traded down to their 50-day.
 NASDAQ 100 (daily) the red average is a short term 8-day ema (short-term or minor trend) acting as resistance, and the 50-day (yellow) intermediate trend acting as support.
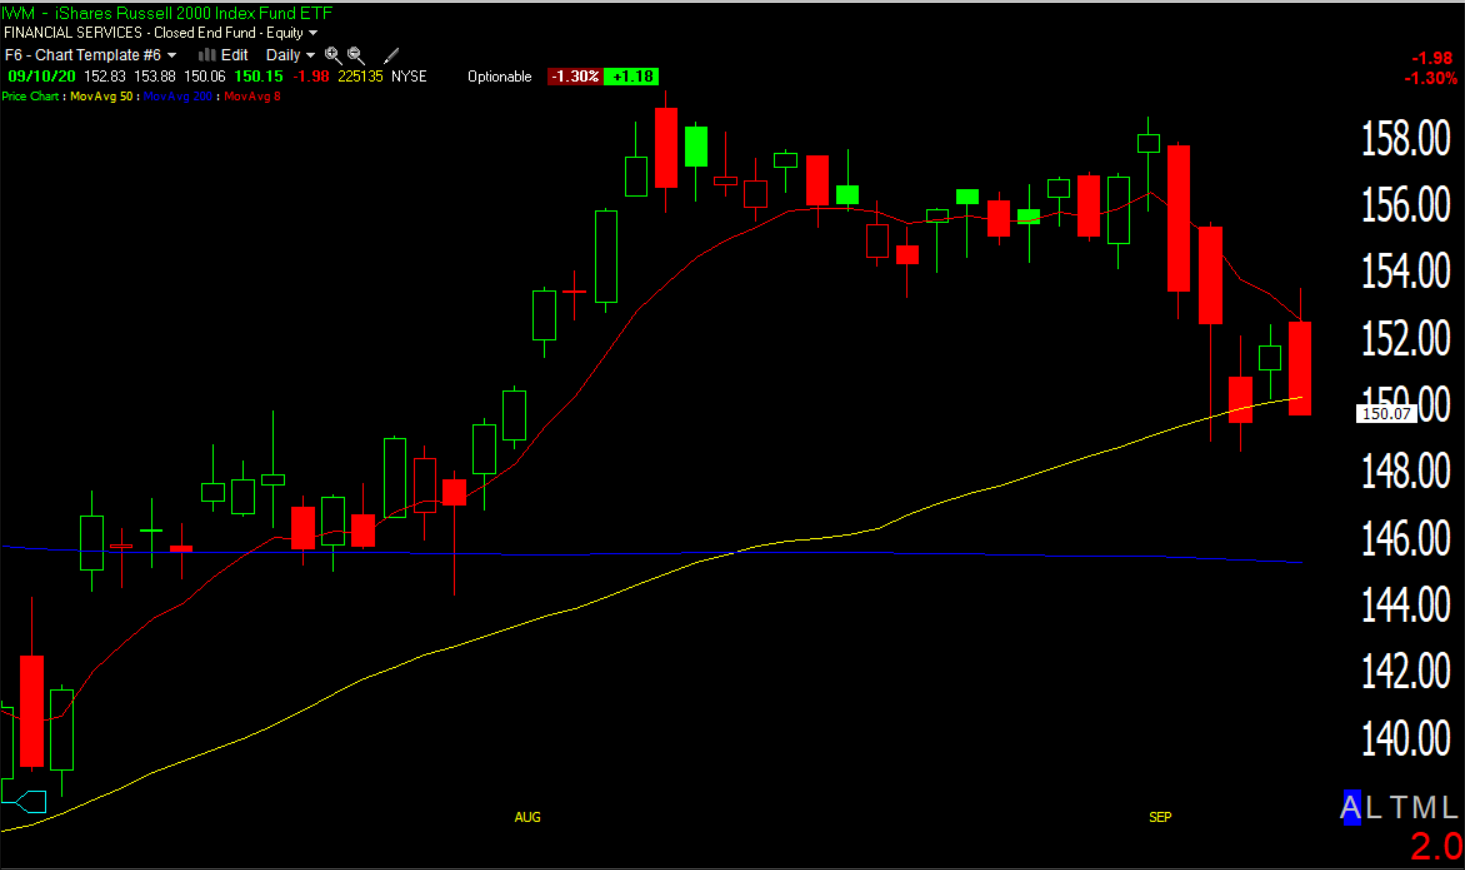 IWM/Small Caps (daily)
Price’s today look a bit more like the consolidation (correction through time) that I thought was likely. I’ll let my earlier post illustrating today’s developments toward that end speak for itself.
Generally speaking 3C charts are depicting something similar. Remember that last week it was QQQ/NASDAQ that showed trouble by putting in a clear negative divergence, which is why I added to my QQQ short last week.
 QQQ (1m) negative divergence at (A) and added to my short September 2nd. There’s a modest positive divergence at (B) depicting technical support at the 50-day which is where I covered my short. It doesn’t suggest much more than that pit-stop at a key technical support level after a sharp decline and deep oversold condition. At (C) there’s a modest negative divergence, which we saw starting to take shape yesterday afternoon.
SPY’s 3C chart was in line with price last week…
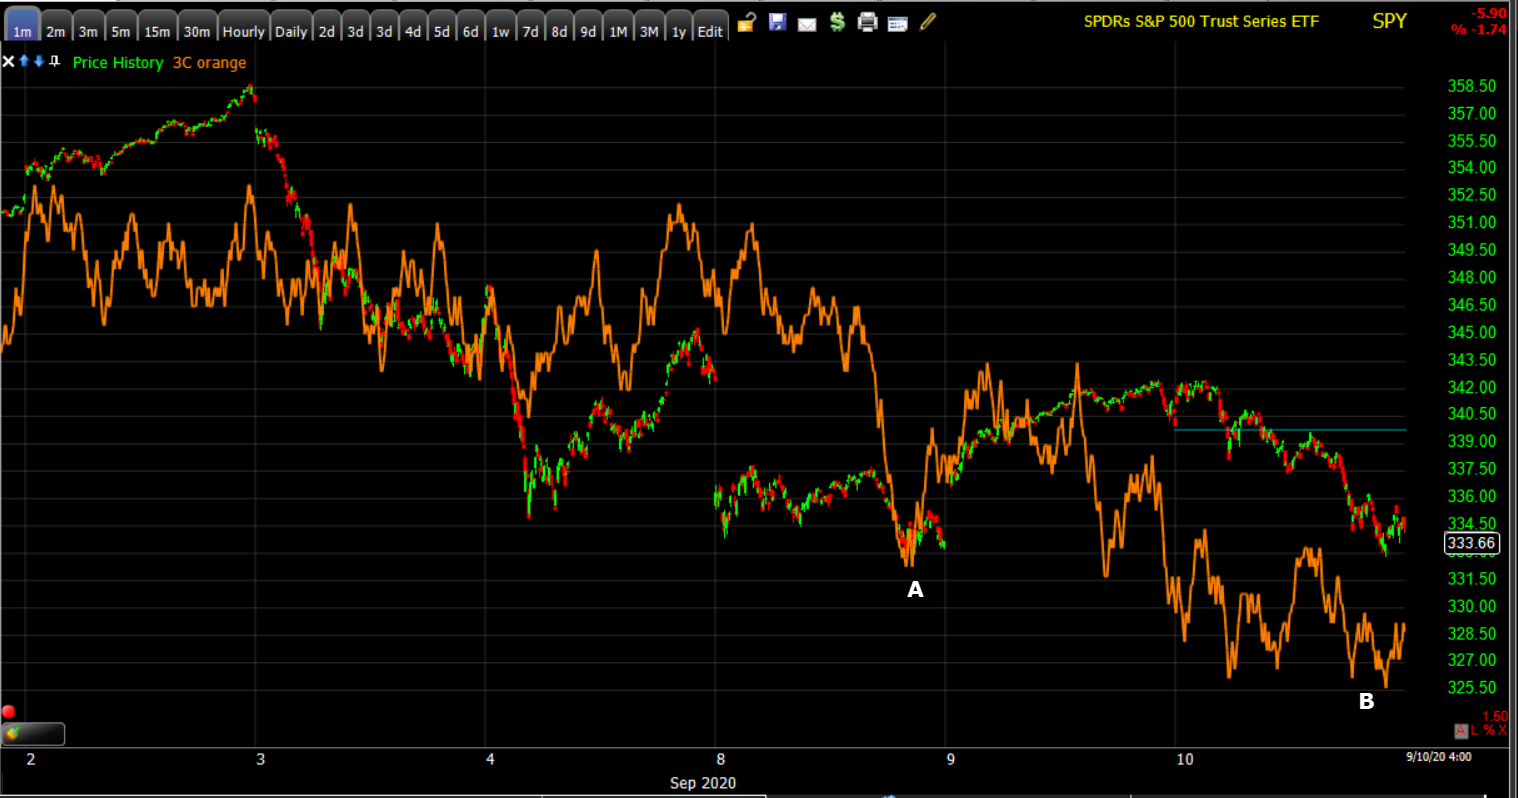 SPY (1m) however this week, it’s less supportive than QQQ as 3C makes a lower low at (B) after negatively diverging yesterday afternoon at sesion highs. Remember that the SPY hasn’t pulled all the way back to the 50-day where technical traders show up. This is yet another reason why I see a bearish bias.
S&P sectors
All 11 sectors ended lower. Energy was the worst, followed by Technology.
Materials ⇩ -0.94 %
Energy ⇩ -3.67 %
Financials ⇩ -1.41 %
Industrial ⇩ -1.28 %
Technology ⇩ -2.26 %
Consumer Staples ⇩ -1.23 %
Utilities ⇩ -1.72 %
Health Care ⇩ -1.53 %
Consumer Discretionary ⇩ -1.43 %
Real Estate ⇩ -1.41 %
Communications ⇩ -1.48 %
I think the bulls on CNBC have been hoping that the silver lining of the Technology led decline the last week would be that there would be rotation to the economically sensitive (and value factor) cyclical sectors/stocks. I think if they are honest, they’d much rather see the cyclical stocks rallying than the mega-caps. They are the stocks that should be leading the market out of a recession, not languishing. I have not seen that rotation at all this week.
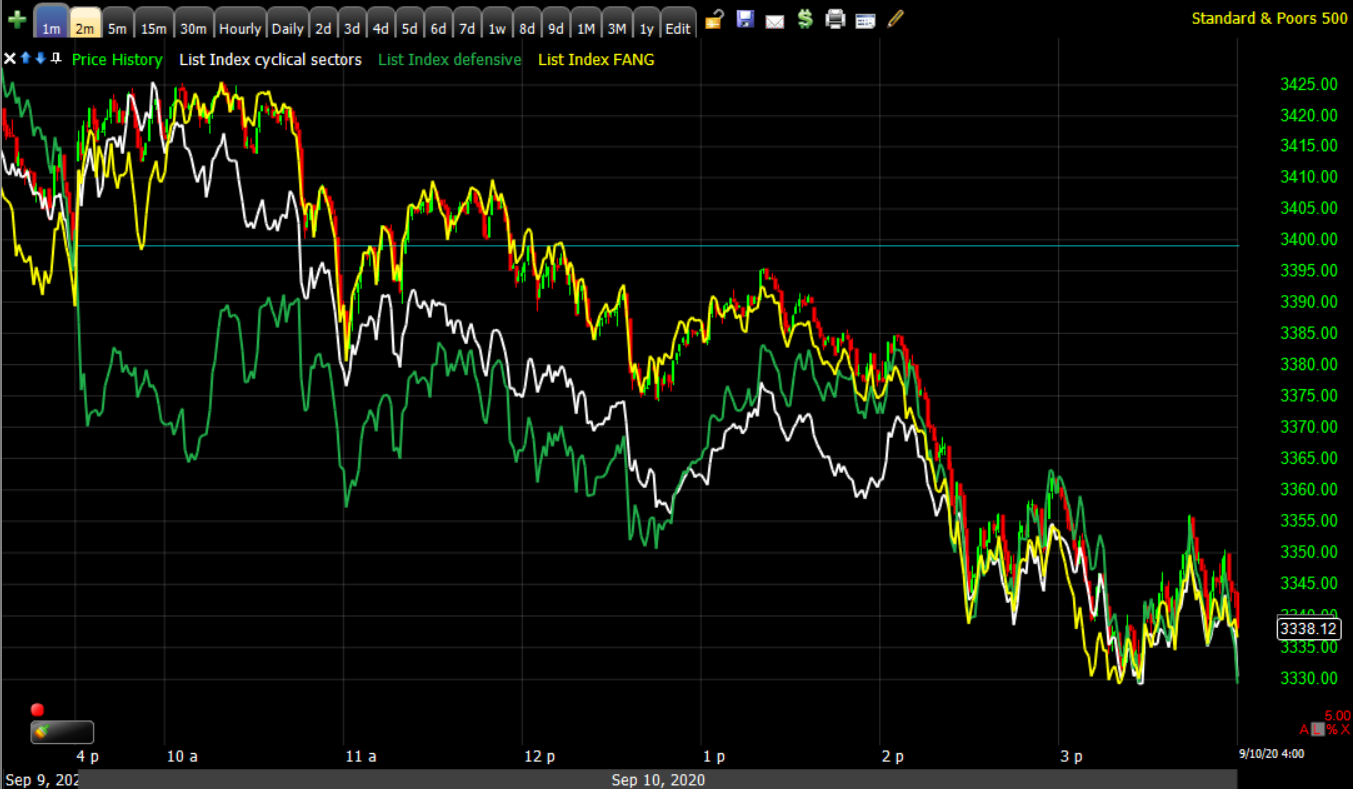
SP-500 (1m today) shows everything lower – the Mega-Cap FANGs (yellow), the cyclicals (white) and the defensive sectors (green).
Even style factors were down across the board – Growth -2% and Value -1.5% – which looks like de-leveraging, reducing exposure to stocks across the board rather than any type of rotation.
The Technology sector ended with a bearish engulfing candle, but held above its 50-day.
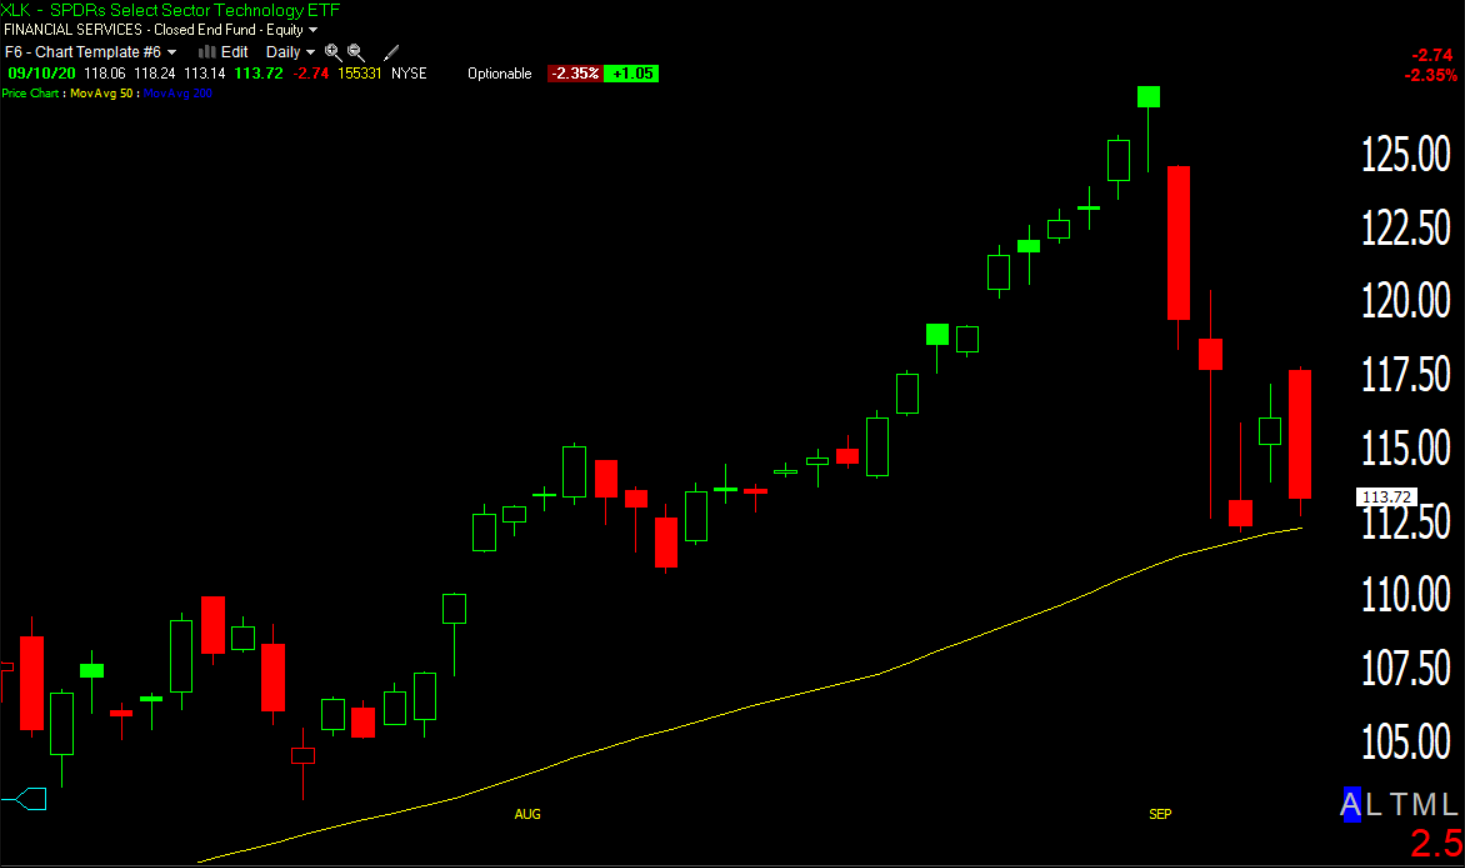 Technology sector (daily)
The majority of S&P sectors are near their 50-day, either at it like Tech, slightly above like Communications, or slightly below like Health Care.
Many of the mega-cap tech (FAANGM) stocks put in bearish engulfing candles too.
 AMZN (daily) bearish engulfing, ending at the 50-day.
Microsoft looks worse…
 MSFT (daily) with a bearish engulfing candle, but despite an impressive +4.25% bounce yesterday, it met resistance at the 50-day, gapped above this morning and fell back below again. Remember that these are the stocks that were virtually solely responsible for August’s hyper-euphoric blow off rally and they’re not looking very good. As pointed out earlier this week, the dealer short gamma/delta hedging that drove stocks higher cuts both ways when prices turn.
The cyclical Energy sector is the worst on the day and overall. Even yesterday it was a poor performer despite a strong oversold bounce in crude oil. This is one of the sectors that should be outperforming at the start of a new economic cycle. Investors keep talking about the rotation to cylicals/value, and there have been a couple of tries, but it’s not happening. These sectors are telling us something about the economic situation and the bond market has been much more closely aligned to the message from sectors like Energy than the new record highs of the S&P.
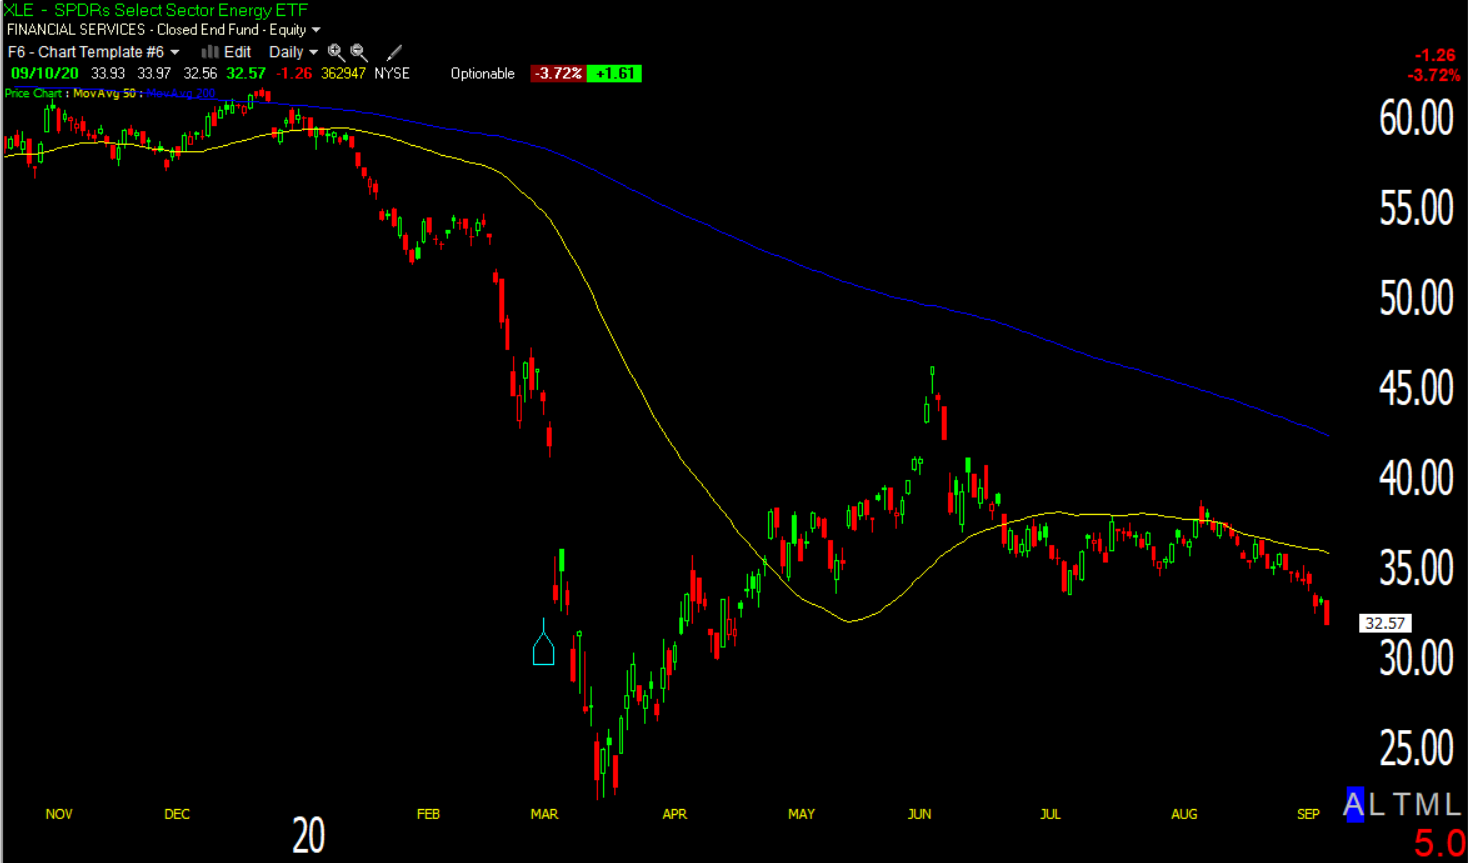 Energy sector (daily) below a declining 50-day and 200-day moving average (intermediate and primary trend) and near a 5 month low as the major averages were just at all-time highs.
Internals
Early when all 11 sectors were down I was surprised that internals really didn’t look bad, but they deteriorated as new session lows were made. NYSE Decliners (1949) were double Advancers (966) on heavier Volume of 911.2 mln shares.
Considering what the heat map of the averages looks like, internals are not as bad as I’d expect. The selling was clearly more focussed on the stocks that make up the major averages, the larger or more popular stocks. Advance decline lines today confirm this – NASDAQ 100’s A/D line was worse, leading the NASDAQ lower, while the broader NASDAQ Composite index A/D line looked much better.
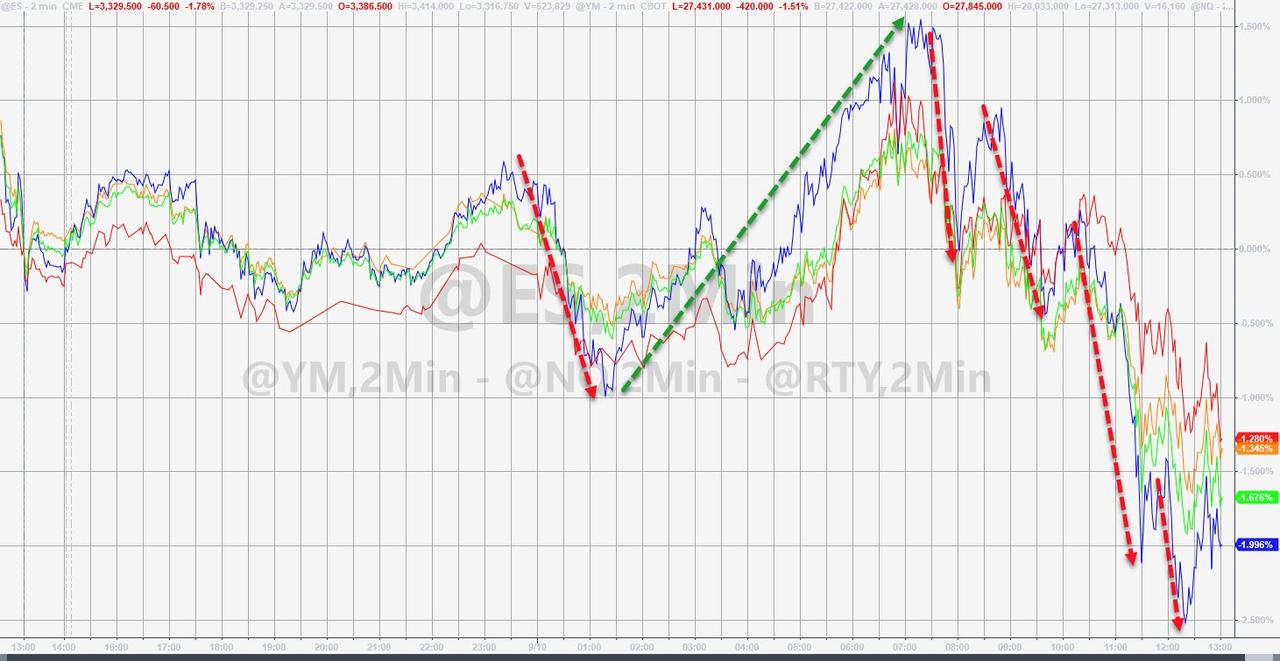
 NASDAQ-100 (2m)
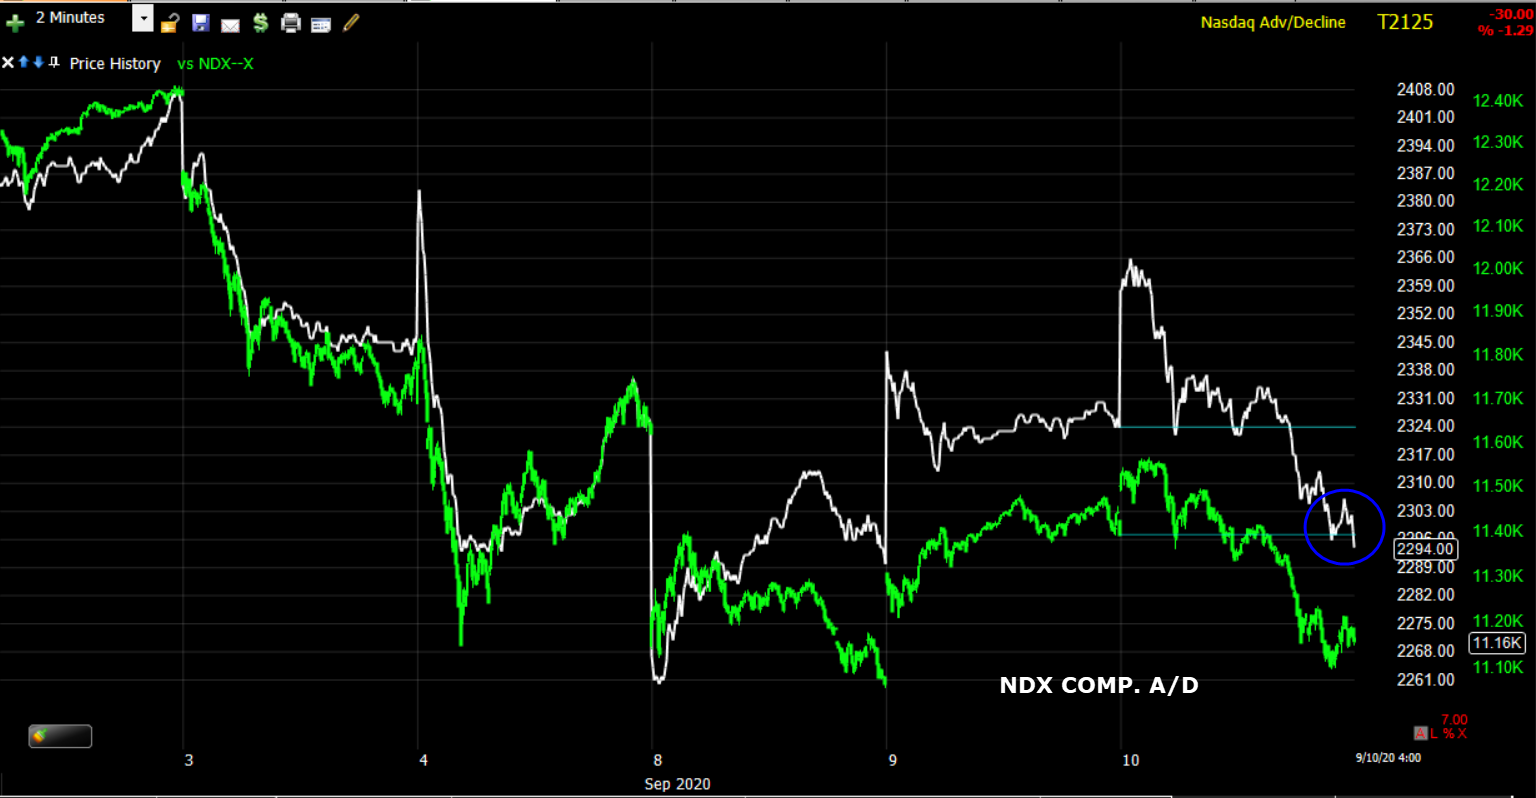
NASDAQ-100 (2m)
This is the exact opposite of the trend since June in which a handful of stocks led the market higher while the majority failed to participate. I’m not reading too much into a day, but it suggests that the popular recent winners that everyone was chasing are the ones seeing heavier selling pressure so it makes sense, especially in light of recent margin call activity.
The dominant price/volume relationship is Close Down/Volume Down, which is fairly benign and is typical of a consolidation day rather than a flush-out selling or capitulation event. The p/v relationship rules out a 1-day oversold condition.
NYSE 52 week lows increased again.
Volatility
VIX ended higher (+3.3%), but volatility has dipped in terms of relative strength this week, which I am not surprised by given the immense relative strength the last month and with the major averages and a majority of S&P sectors near their 50-day moving average after a sharp plunge. From a price perspective, VIX is simply consolidating recent gains and continues to hold its own technical level, its 200-day moving average.
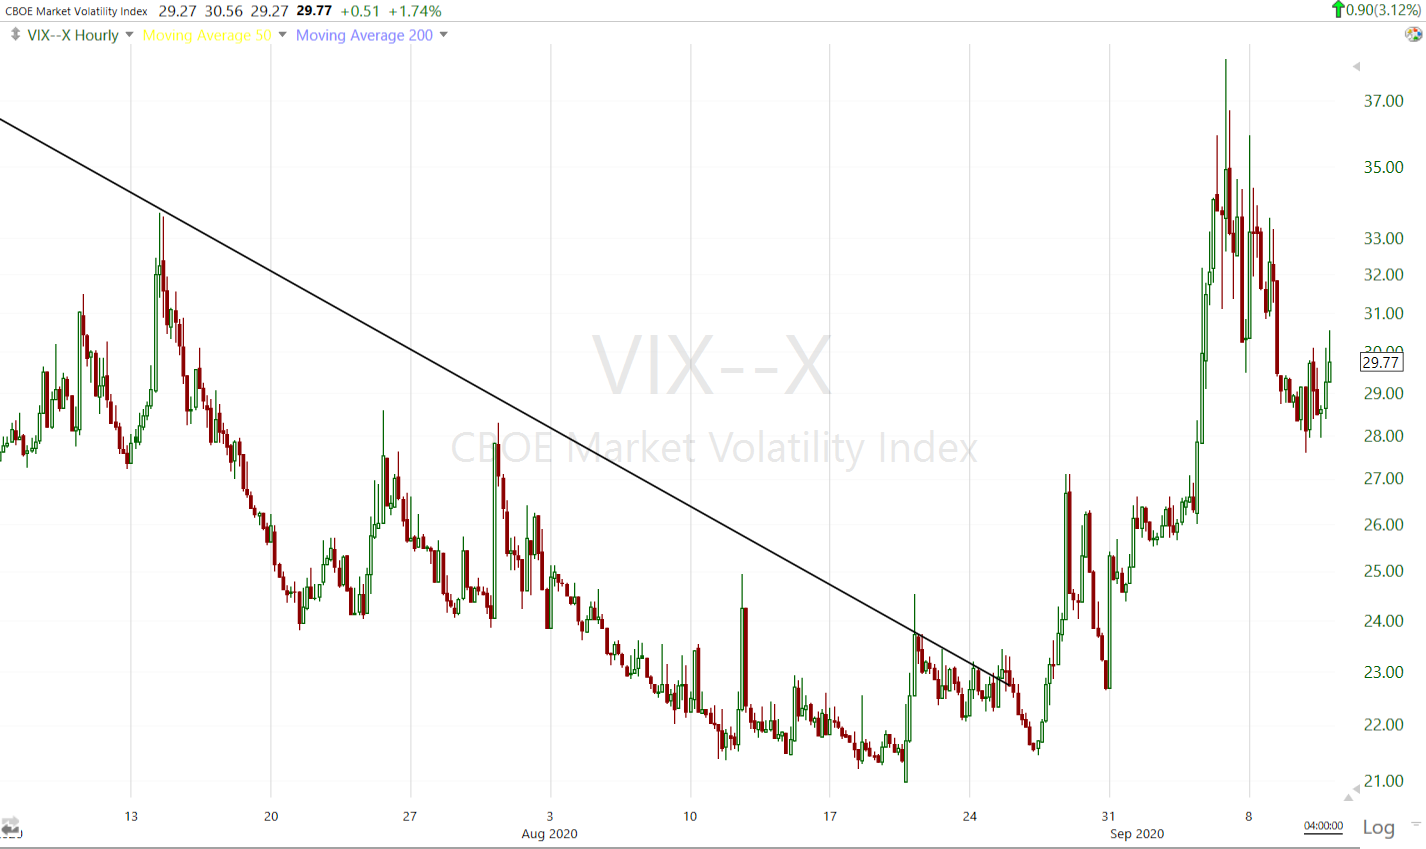 VIX (60m)
Intraday, even as the averages traded to new session lows, volatility was subdued, barely making higher highs. This is one of the reasons I decided to buy some QQQ calls (long ). Yet, at the same time VXX’s 3C chart has been positively diverging since yesterday, even before stocks started to come down later this morning.
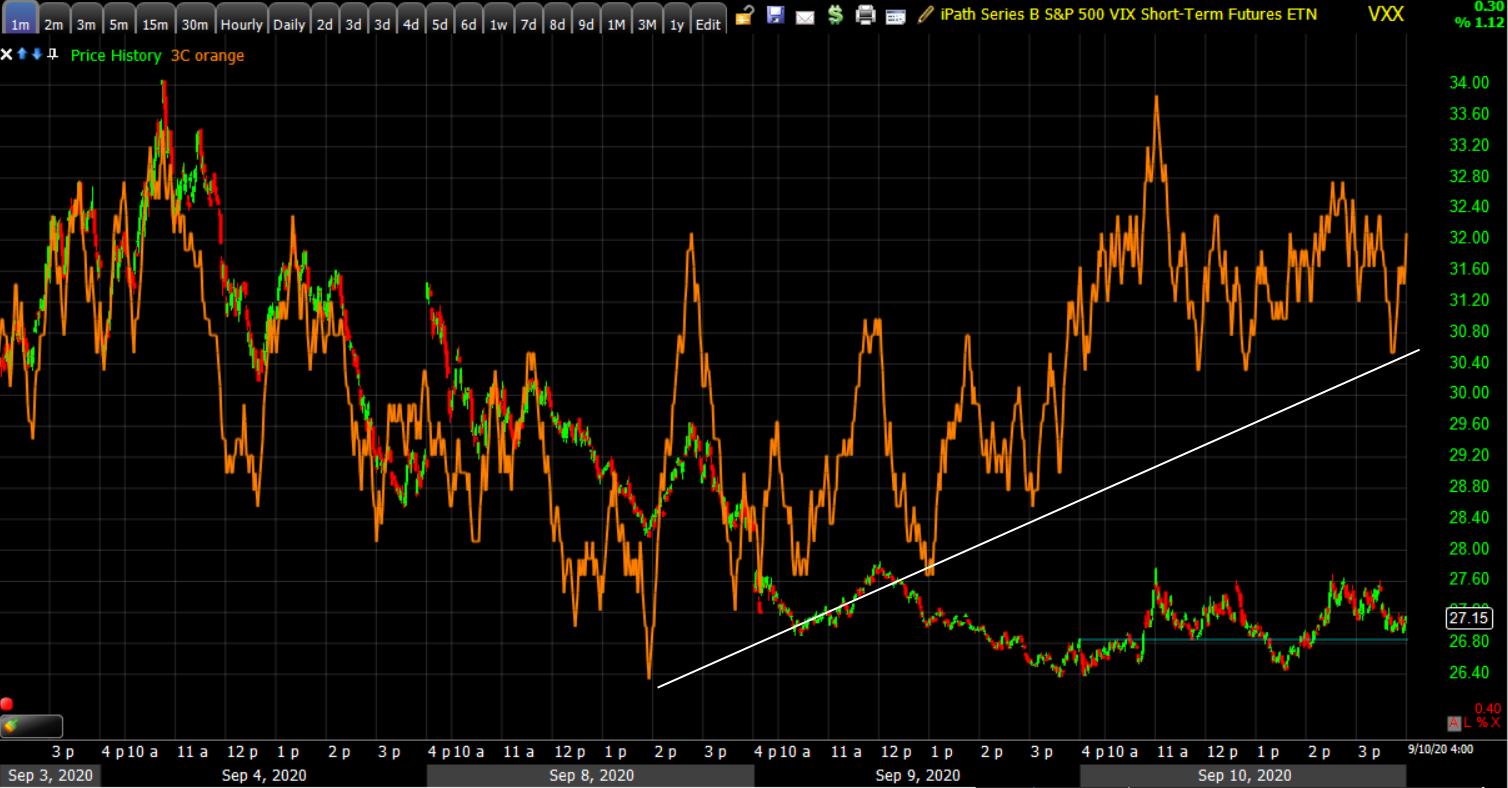
VXX (1m)
Volatility’s relative performance vs. the S&P led the market lower, and suggested the probability of stocks finding support this week at technical levels.
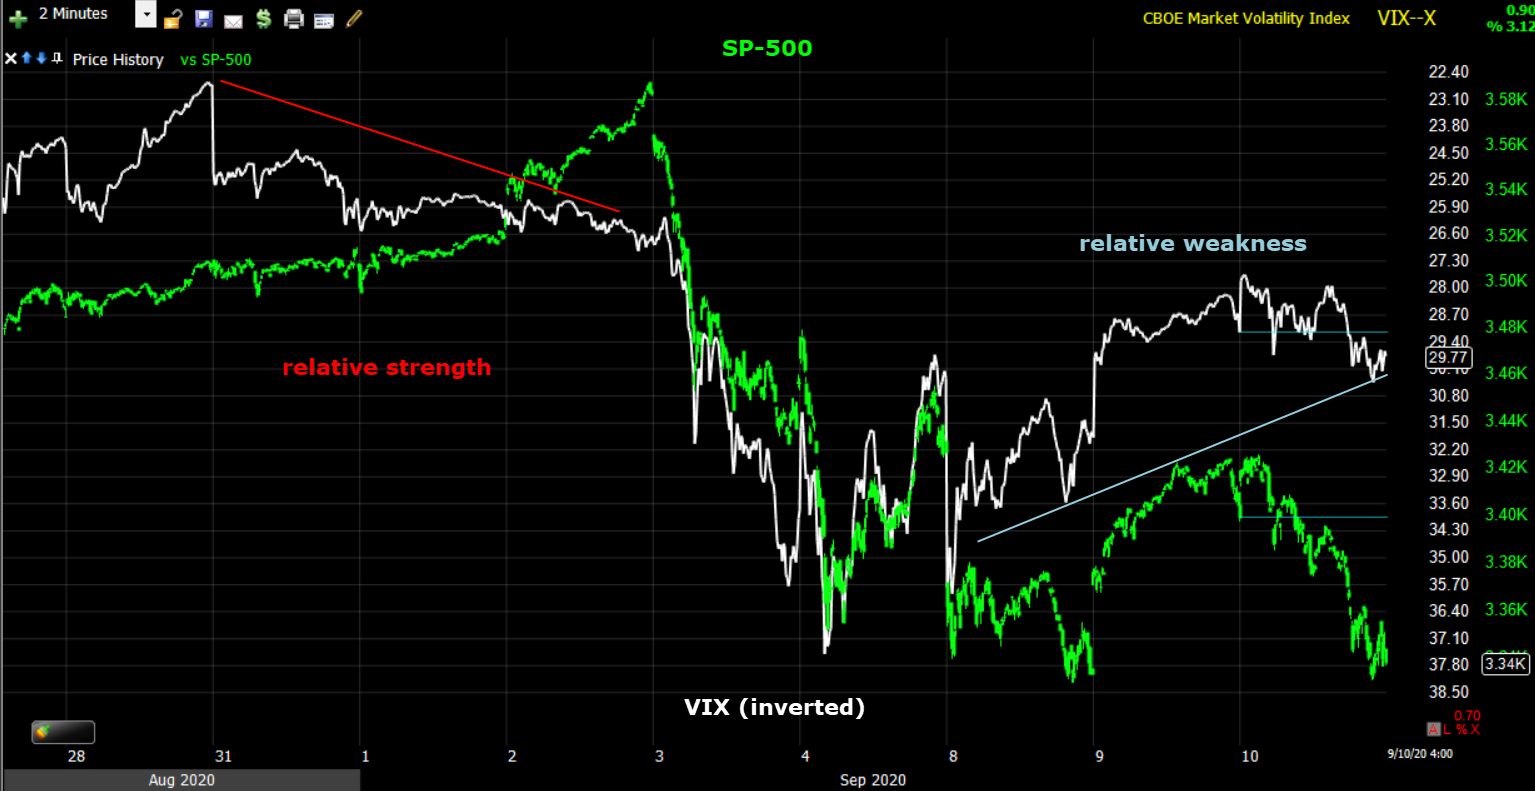
SP-500 (2m) and VIX inverted.
VIX and the S&P typically move opposite each other so when VIX’s price is inverted, it should move roughly the same as the S&P. Inverting the VIX makes it easier to see the relative strength/weakness of VIX. This is one of the signals I’m watching for as a trigger, but not the only one. In the meantime, it looks like someone is quietly grabbing long exposure in volatility on the recent relative weakness or price discount (relative to last week). That’s how I like to trade too, sell strength, buy weakness. That’s to say, anticipate prices rather than chase them. The chasers are getting margin calls.
Treasuries
As equities steepened losses throughout the afternoon, money flowed into longer-dated U.S. Treasuries in a flight to safety trade. The 2-year yield increased one basis point to 0.14%, while the 10-year yield decreased two basis points to 0.69%, the 10-year yield was up 2 basis points early on. Unlike yesterday, today’s 30-year Treasury auction today was solid.
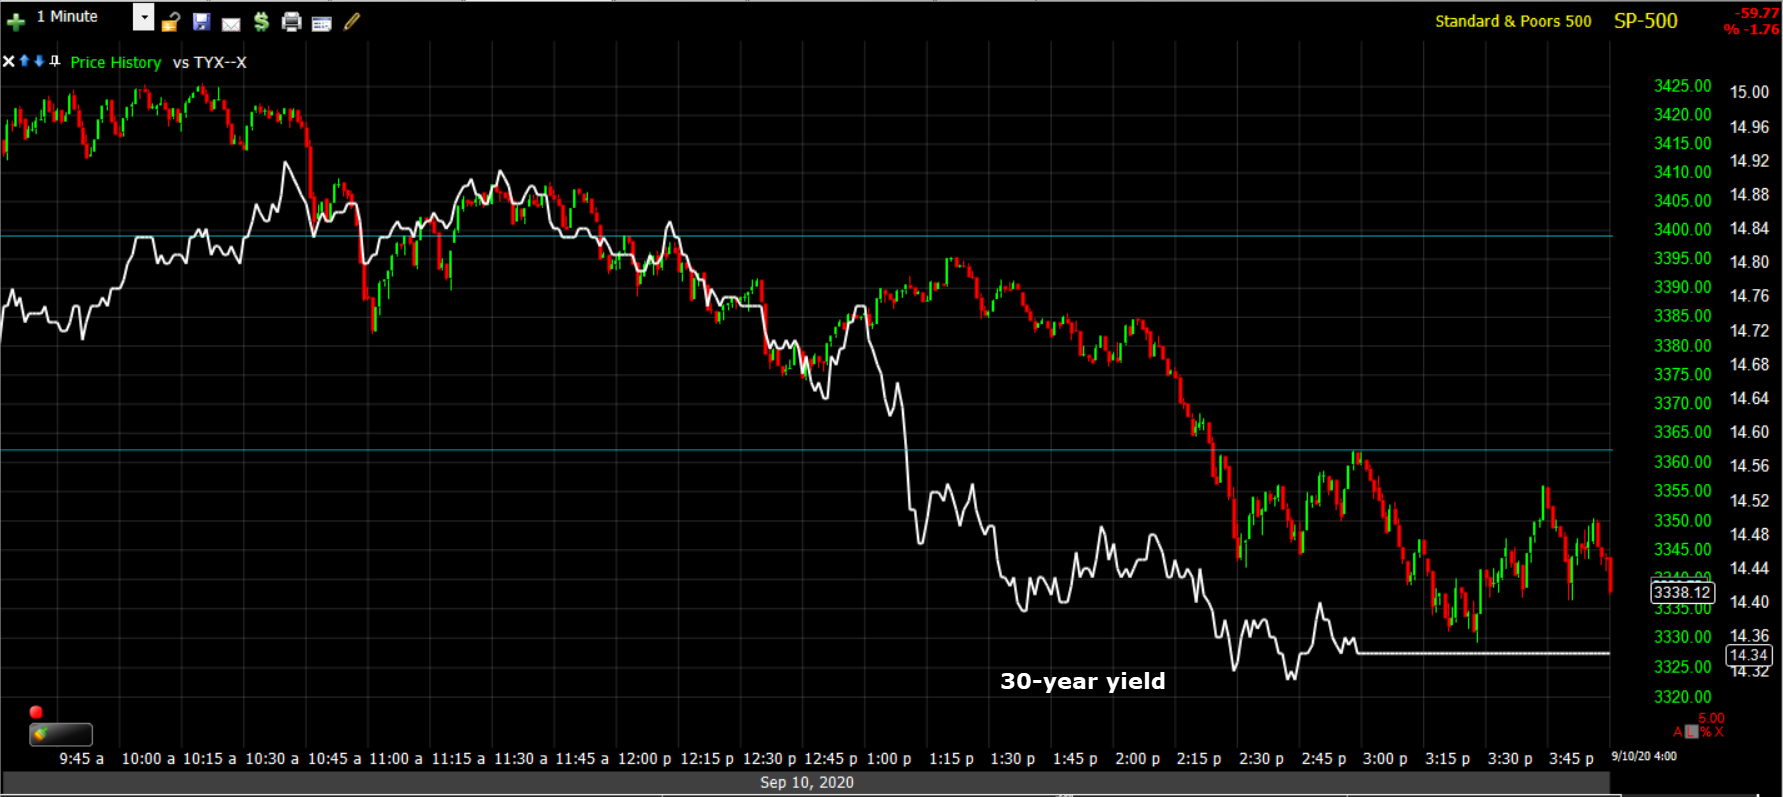 SP-500 (1m) and 30-year yield
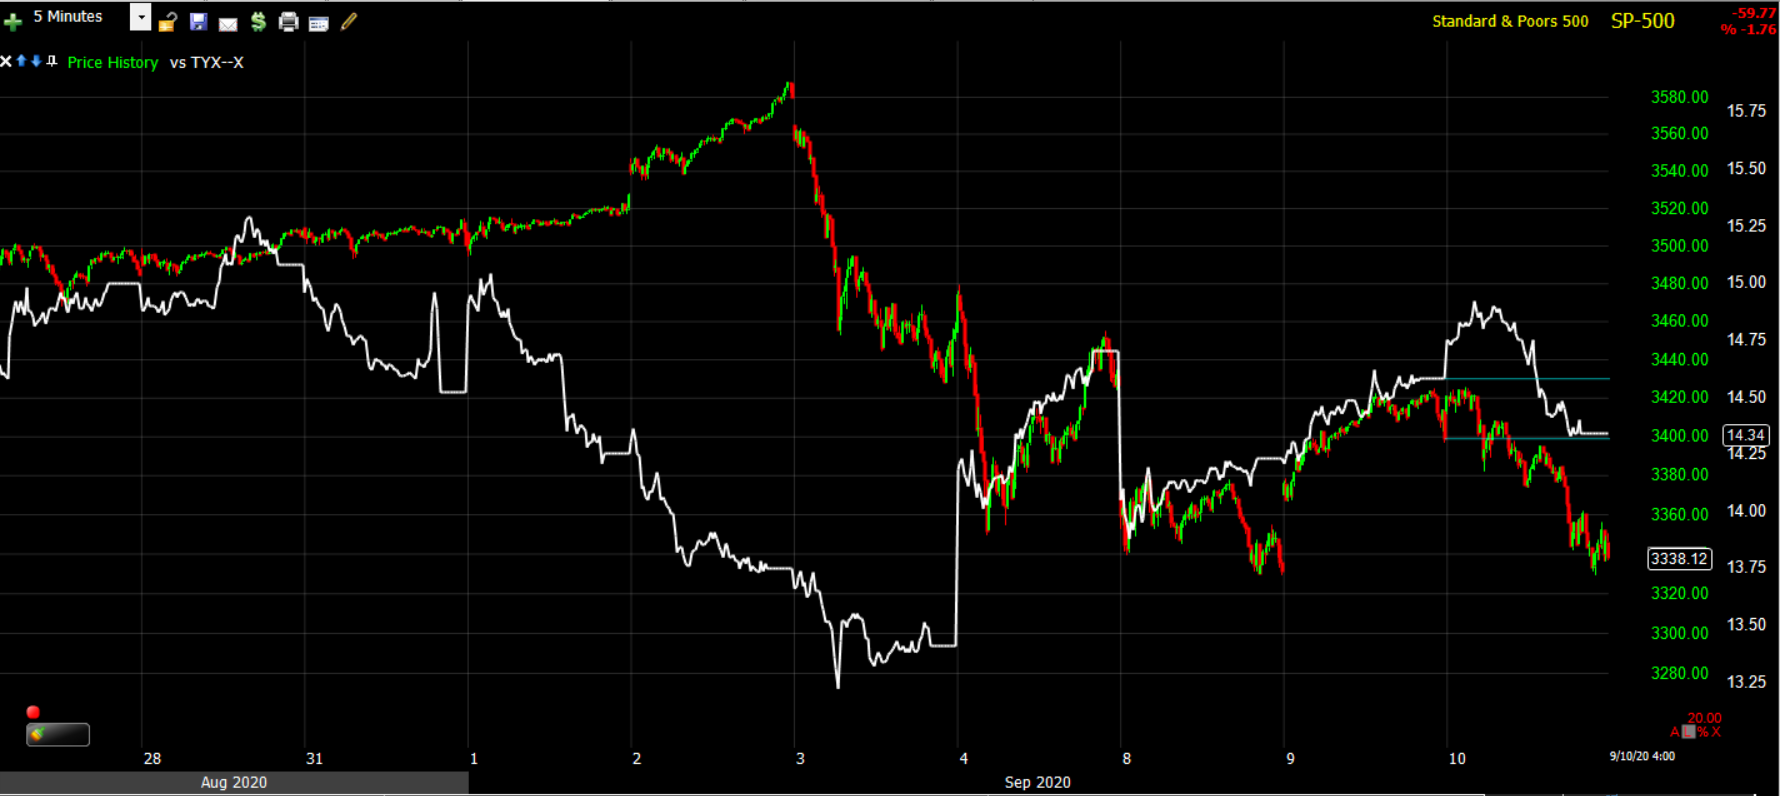 SP-500 (5m) and 30-year yield. Like volatility’s relative strength, yields led the market lower last week, and led in to the correction this week.
Credit
Quite a few times over the last month I’ve noted that edit wasn’t acting very well. Here’s one excerpt from the Daily Wrap – August 25, 2020
“About two weeks ago high yield credit was sharply negatively diverging with the S&P. It has rallied since then, but is still posting a relative negative divergence. More recently investment grade corporate credit has been displaying weakness. Remember these are assets backstopped by the Fed so notable weakness would seem very unusual.”
Tuesday the Fed updated its corporate bond and ETF holdings as of Aug 31. No purchases were made in August. That explains the relative weakness in credit as seen below.
 SP-500 (15m) and Investment Grade Credit
You’ll have to decide for yourself if the Fed is sending the market a message. Remember this was during the month of August as stocks melted up to record valuations in a euphoric blow-off rally. I do recall a recent Fed official saying words to the effect of, “We need to communicate to the market that it has to learn to stand on its own feet” and that credit buying by the Fed was set to sunset and the Fed’s focus of “stabilizing” the markets would taper off.
Currencies and Commodities
The U.S. Dollar Index advanced +0.2% to 93.41. The euro jumped after the European central bank was said to agree that there’s no reason to overreact to the currency’s strength, though that advance dissipated and weakness in the British pound took center stage amid renewed Brexit tensions.
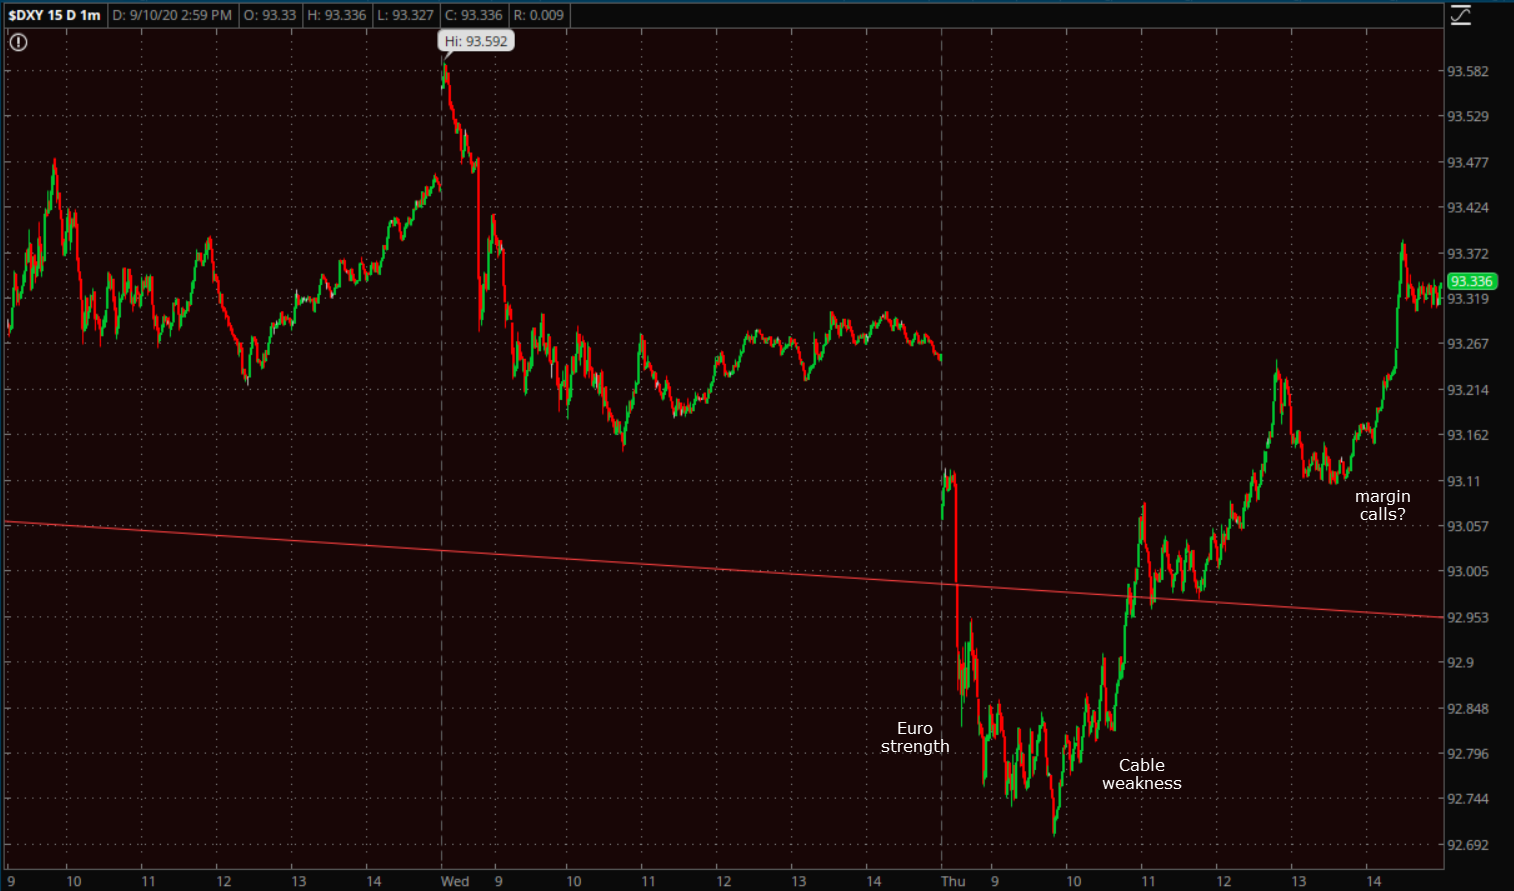
U.S. Dollar Index (1m) lower before the open (supportive of stocks) and higher from the cash open.
WTI crude futures fell -2.1%, or $0.78, to $37.27/bbl.
Copper tumbled hard today too, and Lumber has shown notable recent weakness.
Gold futures gained +0.5% to $1,964.30/oz as modest early losses in the dollar provided for modest gains for gold, but as you can see below, after the COMEX close gold retreated more as the Dollar advanced.
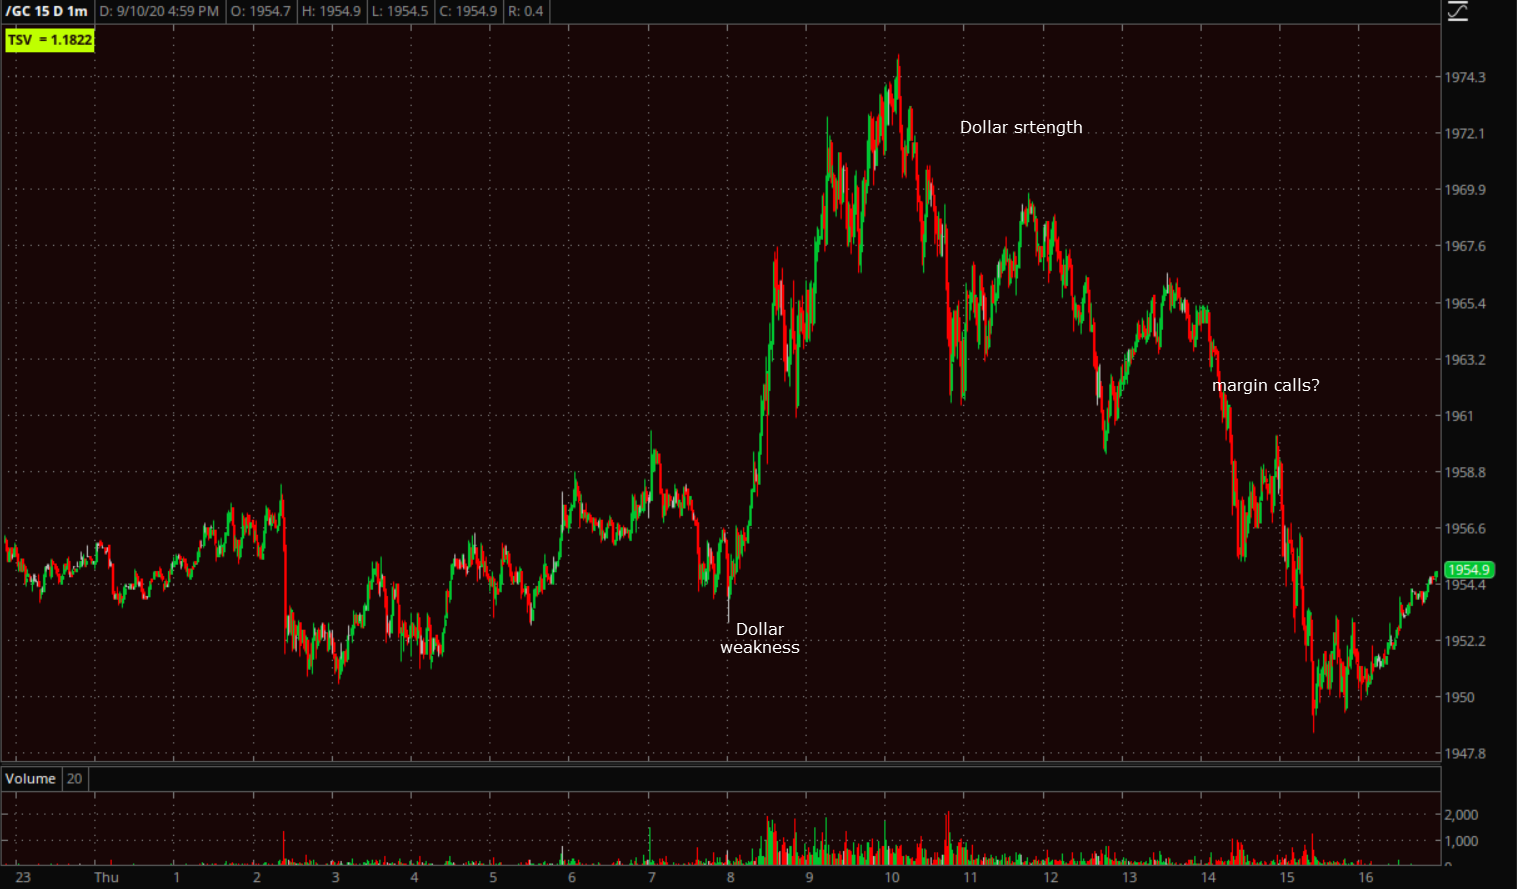
Gold futures (1m)
Summary
I’ve been leaning toward the averages correcting more through time (price consolidation) than through price (strong oversold bounce or rally) with a bearish bias. I think today backed up that view, but the presence of the 50-day moving averages are very influential.
I bought some QQQ calls this afternoon as prices came down toward the 50-day. It’s a very short term, speculative long trade as the options expire tomorrow. All things being equal, I’d expect an effort to put the best face on the market ahead of the weekend, just as we saw last week. Volatility’s relative performance and yields also suggest that this correction/consolidation around the 50-day moving averages is not done so it made sense to me to take the trade with limited risk I’m willing to accept. I was not so confident and willing to pay up to extend the long position beyond tomorrow.
Otherwise my view has not changed since the weekend update. I’m still leaning toward and anticipating re-upping my short exposure. I’m just looking for the right place, opportunity and timing to do so.
In yet another change in character, the major averages are headed for the first back-to-back weekly decline since March.
Overnight
Futures look pretty much like they did near the close. S&P futures are +0.35%. There hasn’t been any significant change since the close. NASDAQ futures (+0.55%) look slightly better.
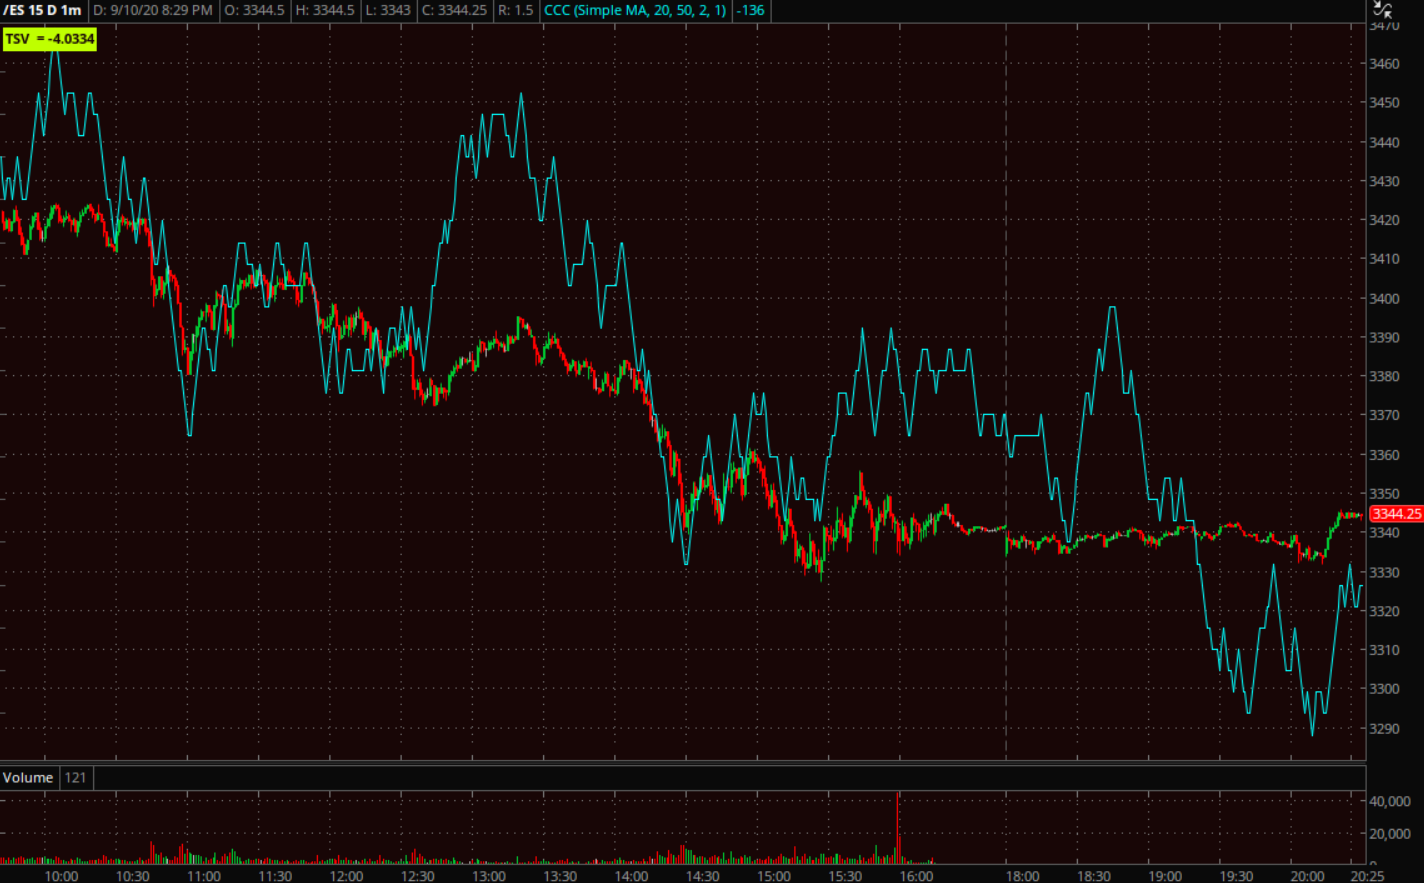 S&P futures (1m)
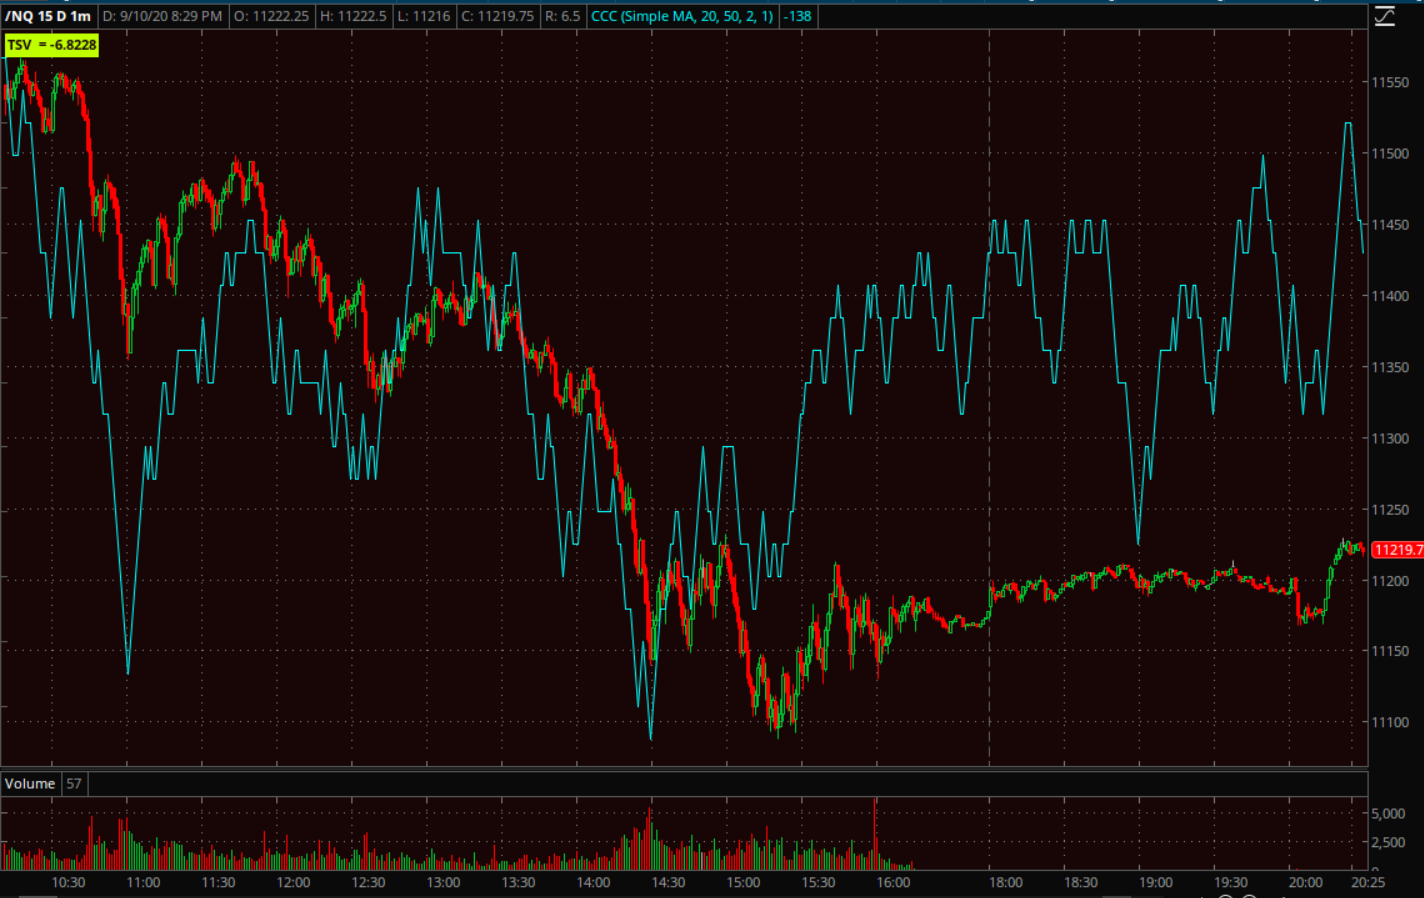 NASDAQ futures (1m)
VIX futures’ look choppy, 3C is choppy with price -not so much selling pressure as disinterest. VXX in the cash session looks far better.
Treasuries are consolidating near their session highs after a safe-haven bid this afternoon as stocks fell. They are pretty much the same as this afternoon ahead of U.S. CPI data due Friday, with consumer prices expected to have risen in August.