Daily Market Wrap
After a bounce trying to back-test the broken April trend line that resulted in a 1-day overbought condition yesterday, the averages made an effort to finish what they started and tag the trend line in a more lackluster early session that lost momentum after yesterdays 1-day overbought condition (depicted by internals), but the S&P came within 0.15% of tagging the trend line, while NASDAQ-100 fell half a percent short. As of the Early Update this morning, it seemed likely the averages were going to make a slow steady march to the trend line, but in my view,
“SP-500 is still just a little short from back-testing the trend, but I’m inclined to say close enough.”
This afternoon stocks were sold as news that President Biden will propose increasing the capital gains tax rate for wealthy Americans.
- BIDEN TO PROPOSE CAPITAL GAINS TAX AS HIGH AS 43.4% FOR WEALTHY
- PROPOSAL WOULD MEAN 52.22% TOTAL CAPITAL GAIN LEVY IN NY STATE
- TOP RATE WOULD BE PAID BY THOSE MAKING MORE THAN $1 MILLION
Expectations of a higher cap gains rate would incentivize investors to sell to lock in their gains before the higher rate takes effect. High valuation stocks and Technology stocks are seen as at risk from the Biden tax plan.
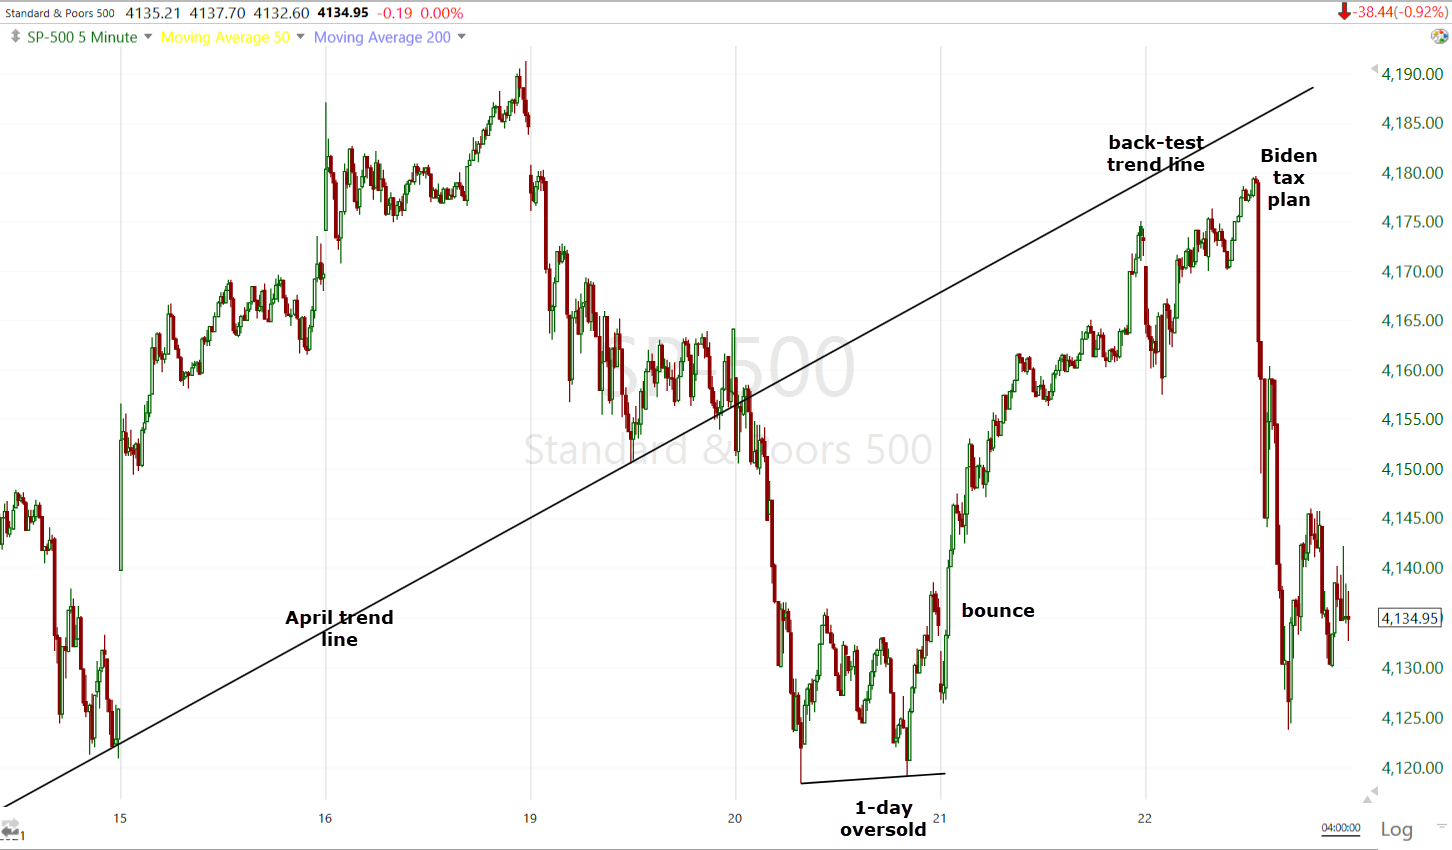
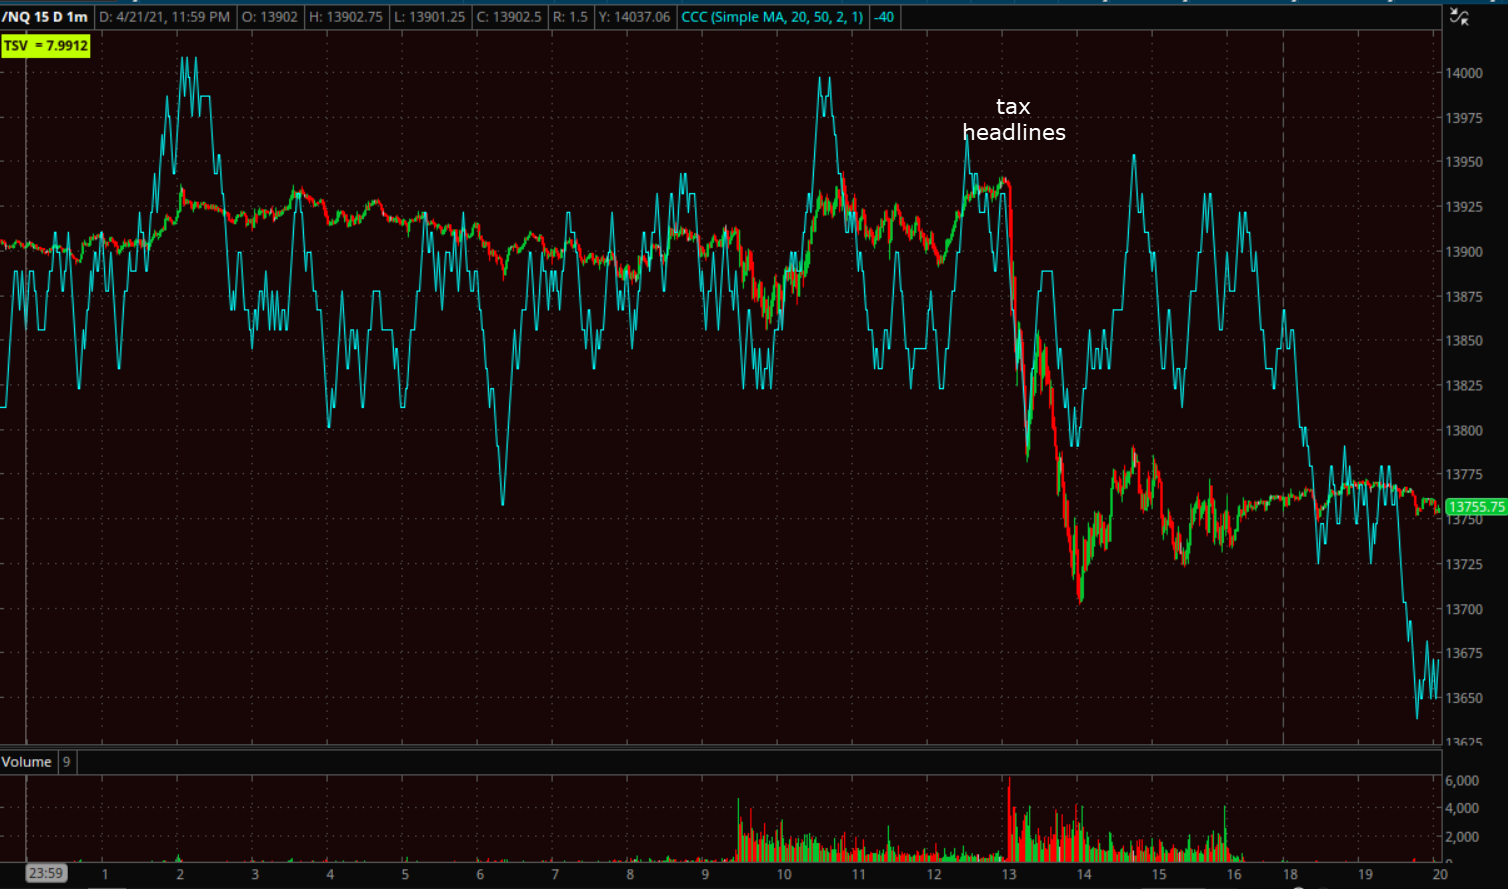
SP-500 (5m) – today was the steepest decline in 5 weeks for the S&P-500.
The S&P 500 went from a 0.2% gain to a 1.2% decline in about an hour after Bloomberg reported that the tax plan would boost the capital gains rate to 39.6% from 20.0% for those earning $1 million or more. The rate would be bumped to 43.4% when including the 3.8% tax on investment income that funds the Affordable Care Act. It would be even higher when including state taxes. The New York Times published a similar report earlier in the day and that the president campaigned on raising taxes on the wealthy.
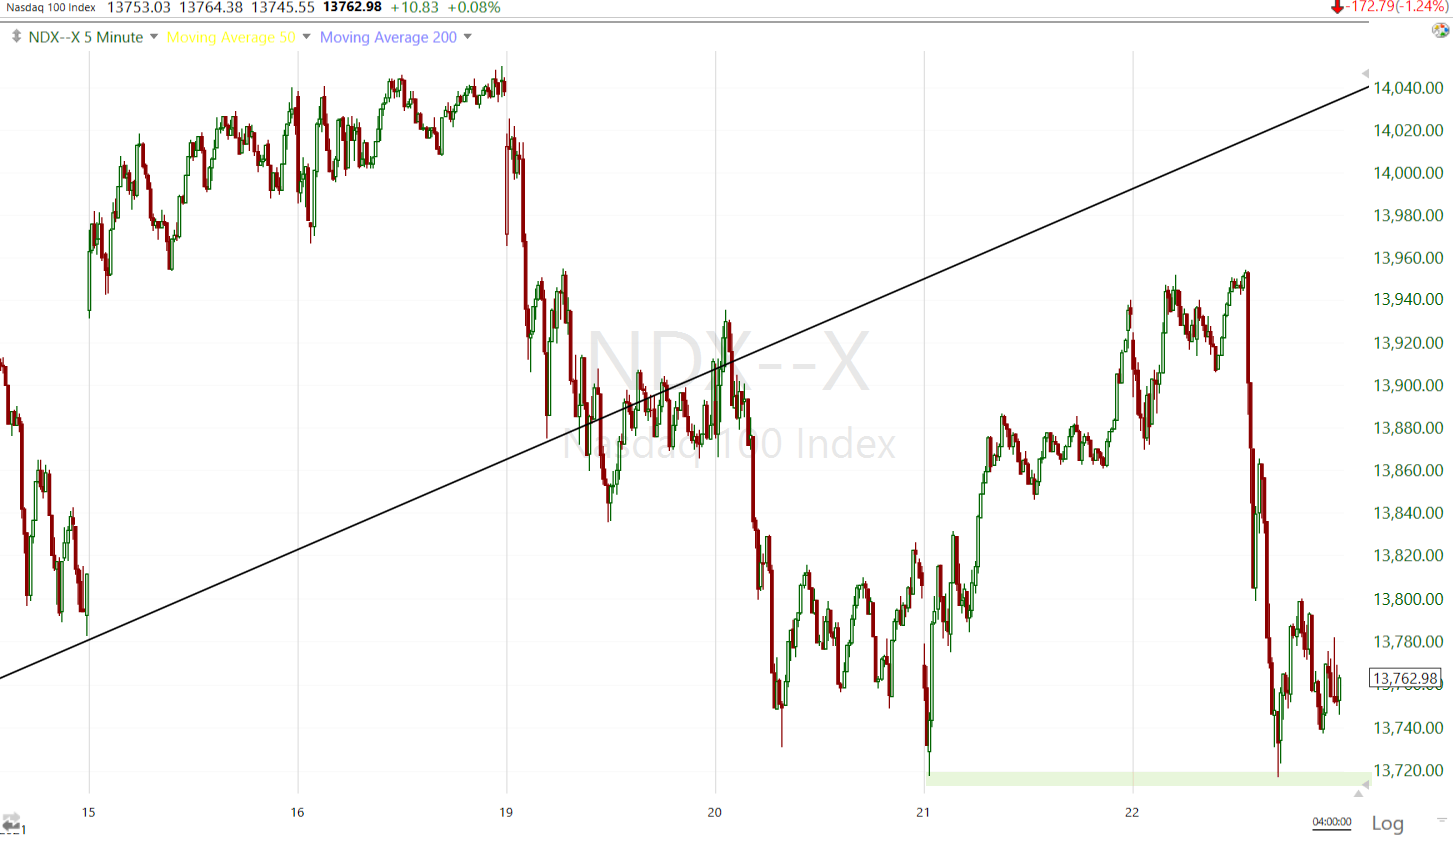 NASDAQ-100 (5m) is very similar with a break of the Aroil trend earlier this week, then a bonce to try o back-test the broken trend line from below, and prices dropping this afternoon on the Biden Tax plan. While the S&P, Dow and small Caps made a slightly higher low relative to the week’s low, NASDAQ-100 traded right back down to the week’s low.
It should be noted that well before the tax news hit the wires, credit assets were not looking great (examples posted in today’s Early Update), or Credit had a more risk-averse tone than exquities. Here are a few examples…
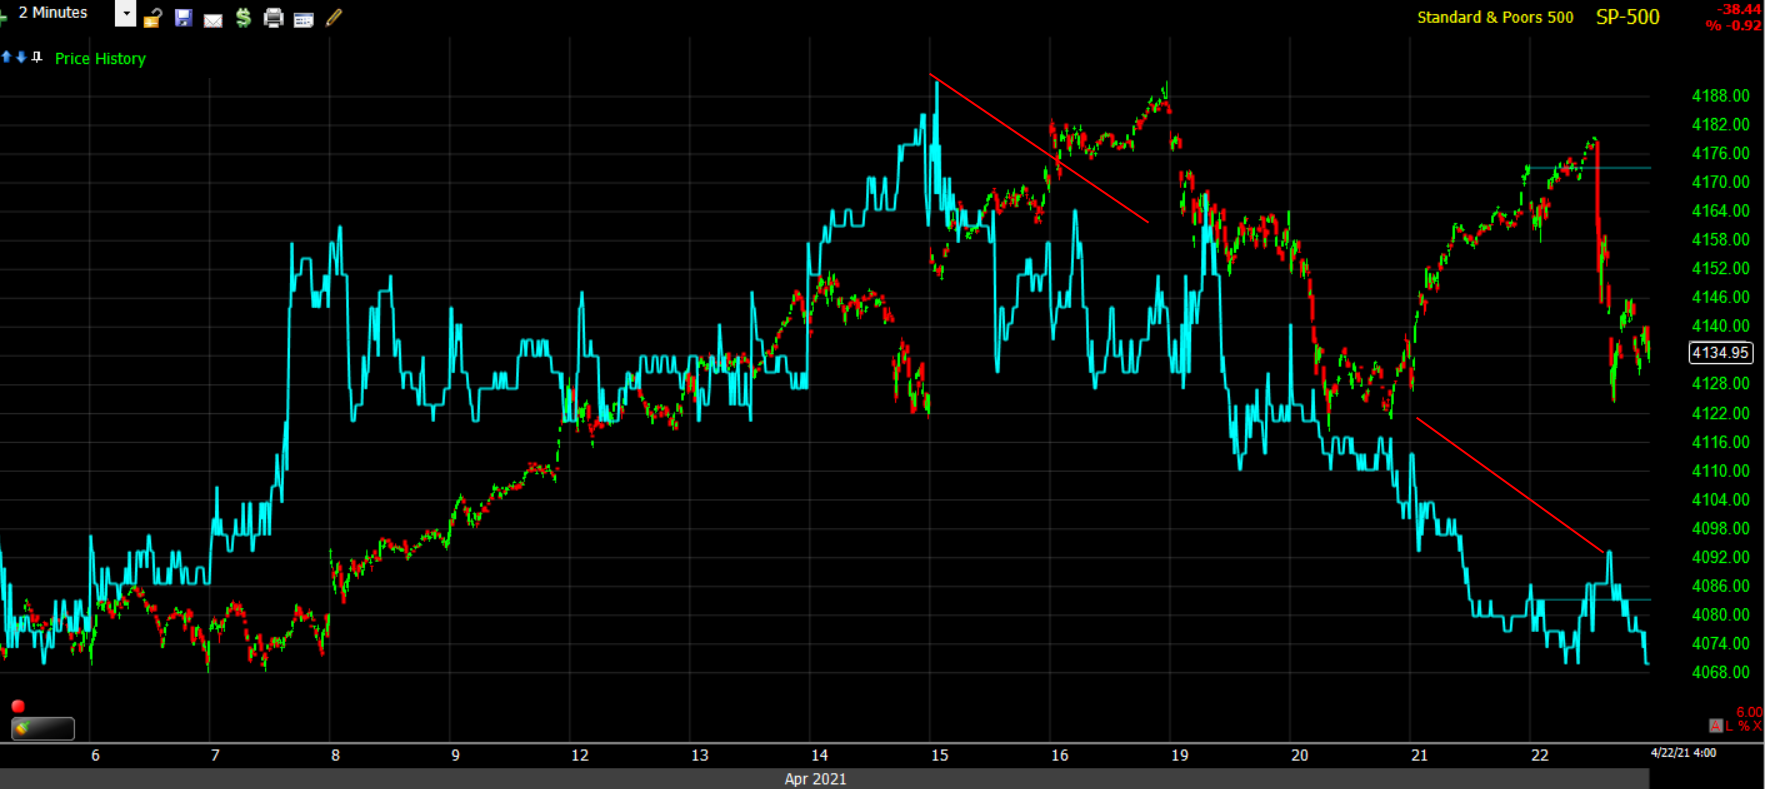 SP-500 (2m) and Credit (blue) leading lower
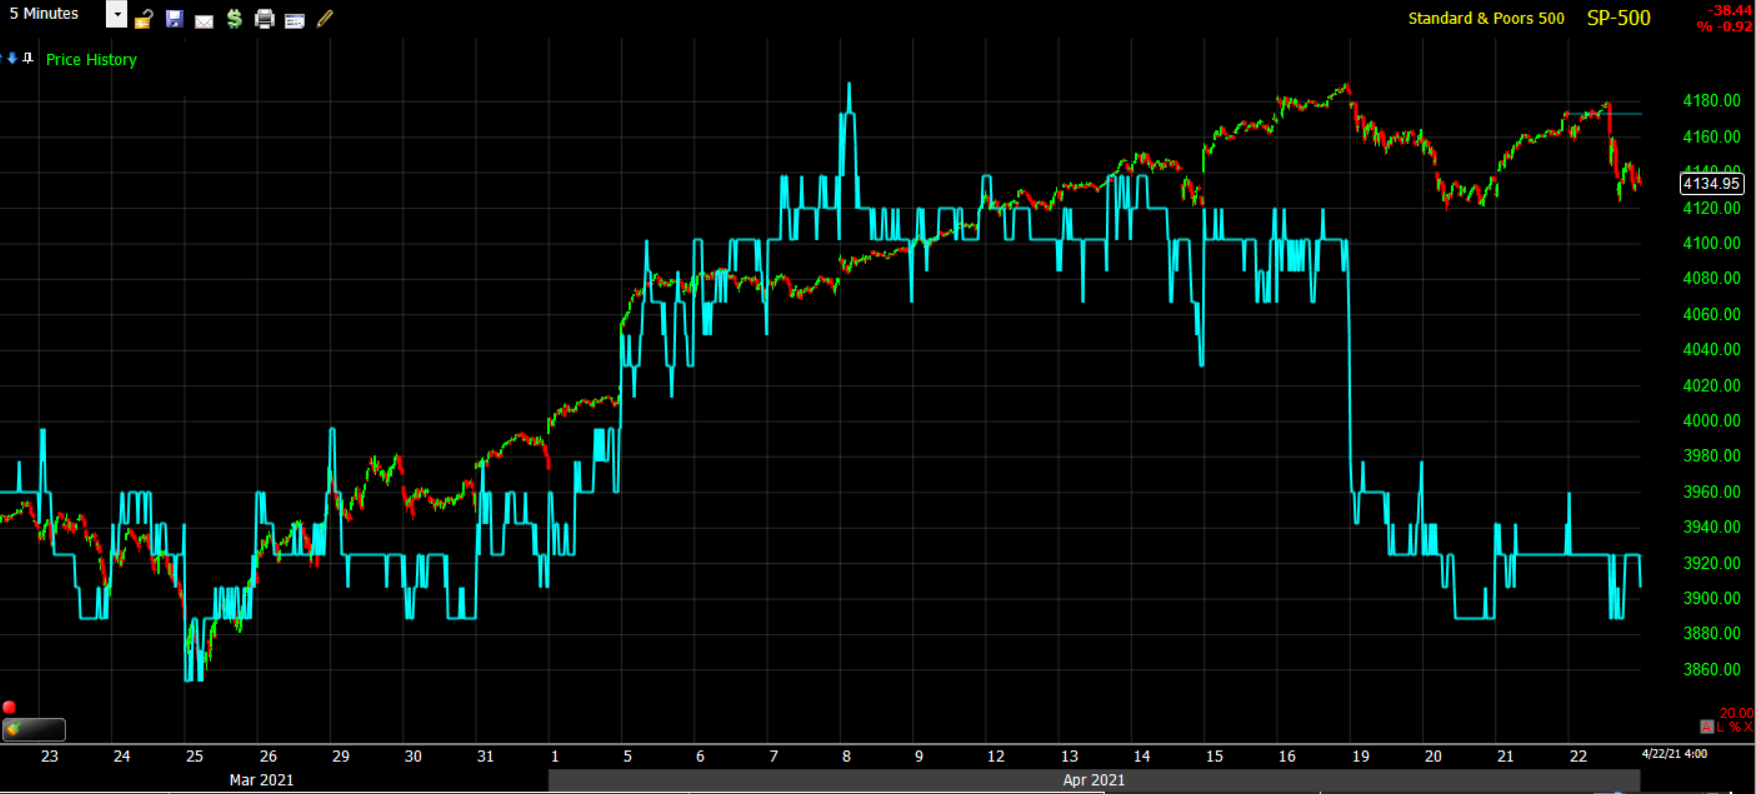 SP-500 (5m) and Leveraged Loans (blue) leading lower.
…And this on a day when credit was really under no pressure from higher bond yields.
Elsewhere, weekly initial claims fell to a new post-pandemic low at 547,000 (consensus 600,000), existing home sales decreased 3.7% m/m in March to a seasonally adjusted annual rate of 6.01 million (consensus 6.15 million) amid historically low supply, and the ECB kept interest rates/asset purchases unchanged. Markets were little moved overnight by assurances from European Central Bank President Christine Lagarde that the institution isn’t discussing any pullback in its emergency bond buying program even as economic data improve.
Averages
NASDAQ-100 was the worst performing average on the day, but Small Caps lost the most from the Biden tax headlines.
S&P 500 ⇩ -0.92 %
NASDAQ ⇩ -1.24 %
DOW JONES ⇩ -0.94 %
RUSSELL 2000 ⇩ -0.31 %
 SP-500 (5m) and Small Caps IWM (normalized) – Small Caps have 1) been more volatile up and down, and 2) have had a tendency to lead the broader market.
As mentioned in the Early Update, while Small Caps were leading early on, they…
“are in the area of notable technical resistance at the 50-day sma…”
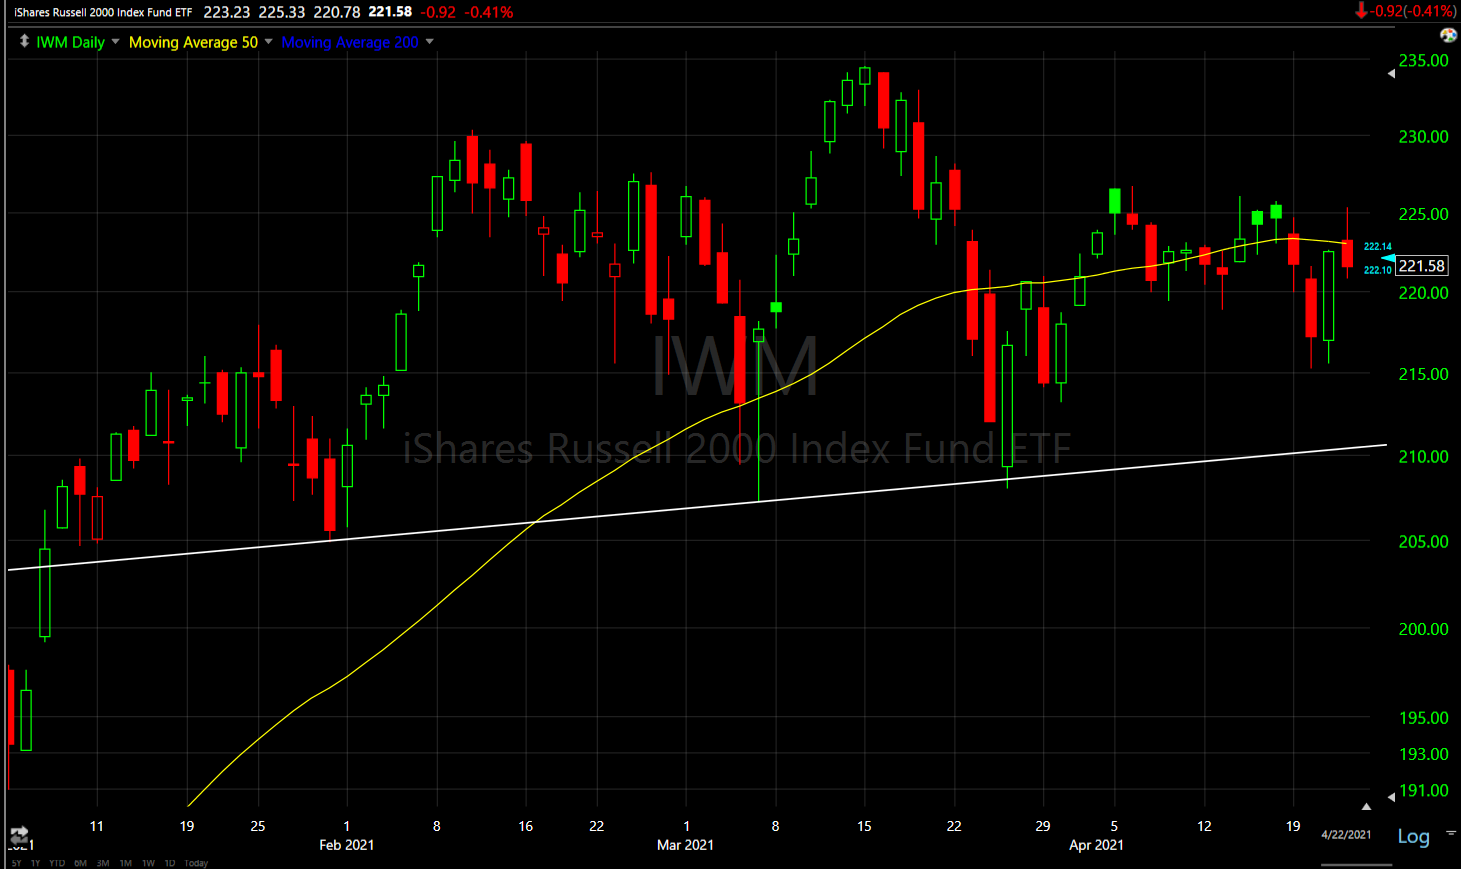 IWM (daily) resistance again at the 50-day sma (yellow) with price closing back below today.
Small Caps and QQQ have the most interesting 3C charts so far this week (weakest). They are also updated in the Early Update.
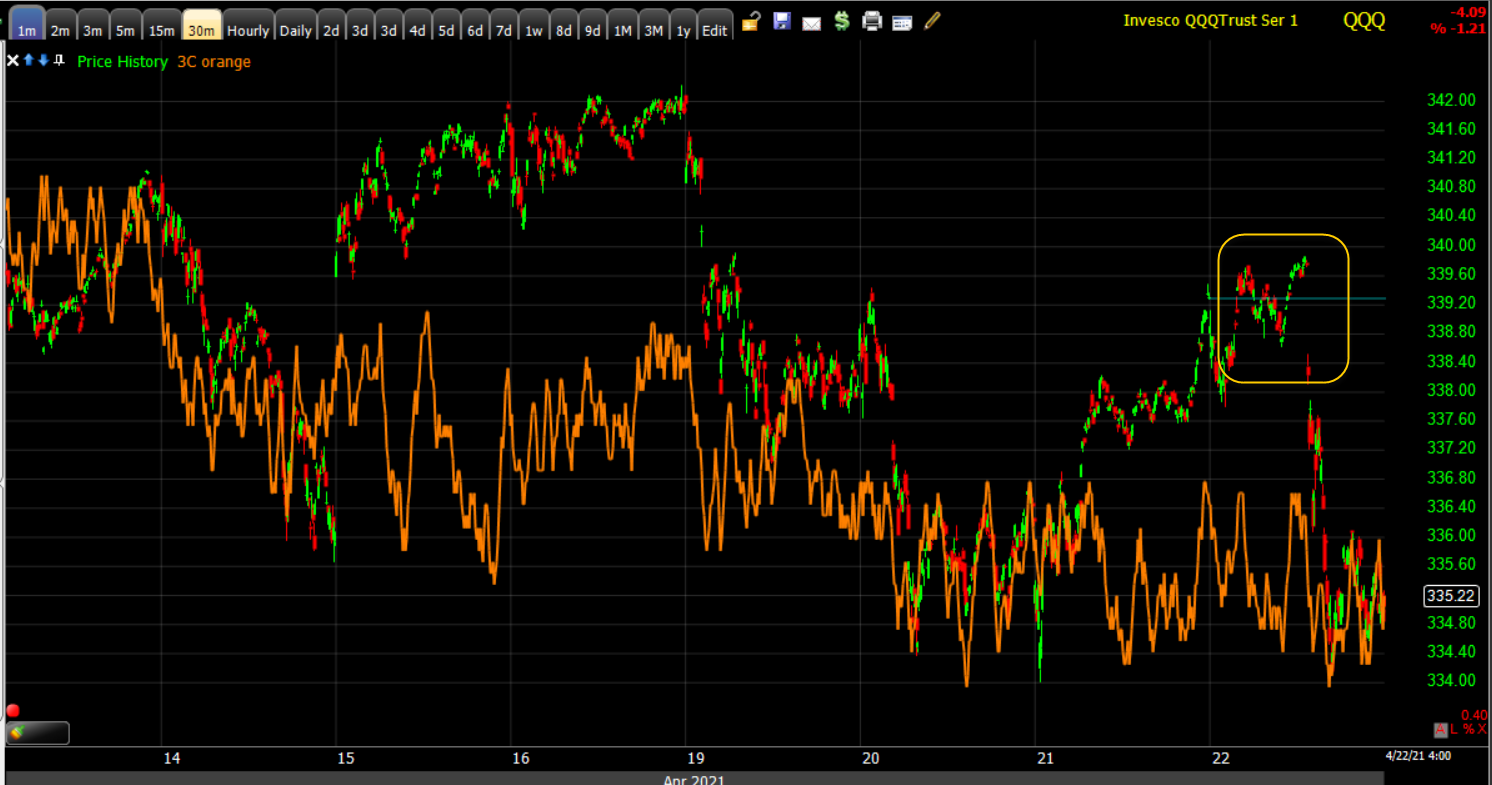 QQQ (1m) as of this morning 3C was not confirming the gains from yesterday, but it was not leading lower either. by the close QQQ’s price reverted right back down to where 3C was this morning.
There is one other chart of interest on a longer term trend basis…
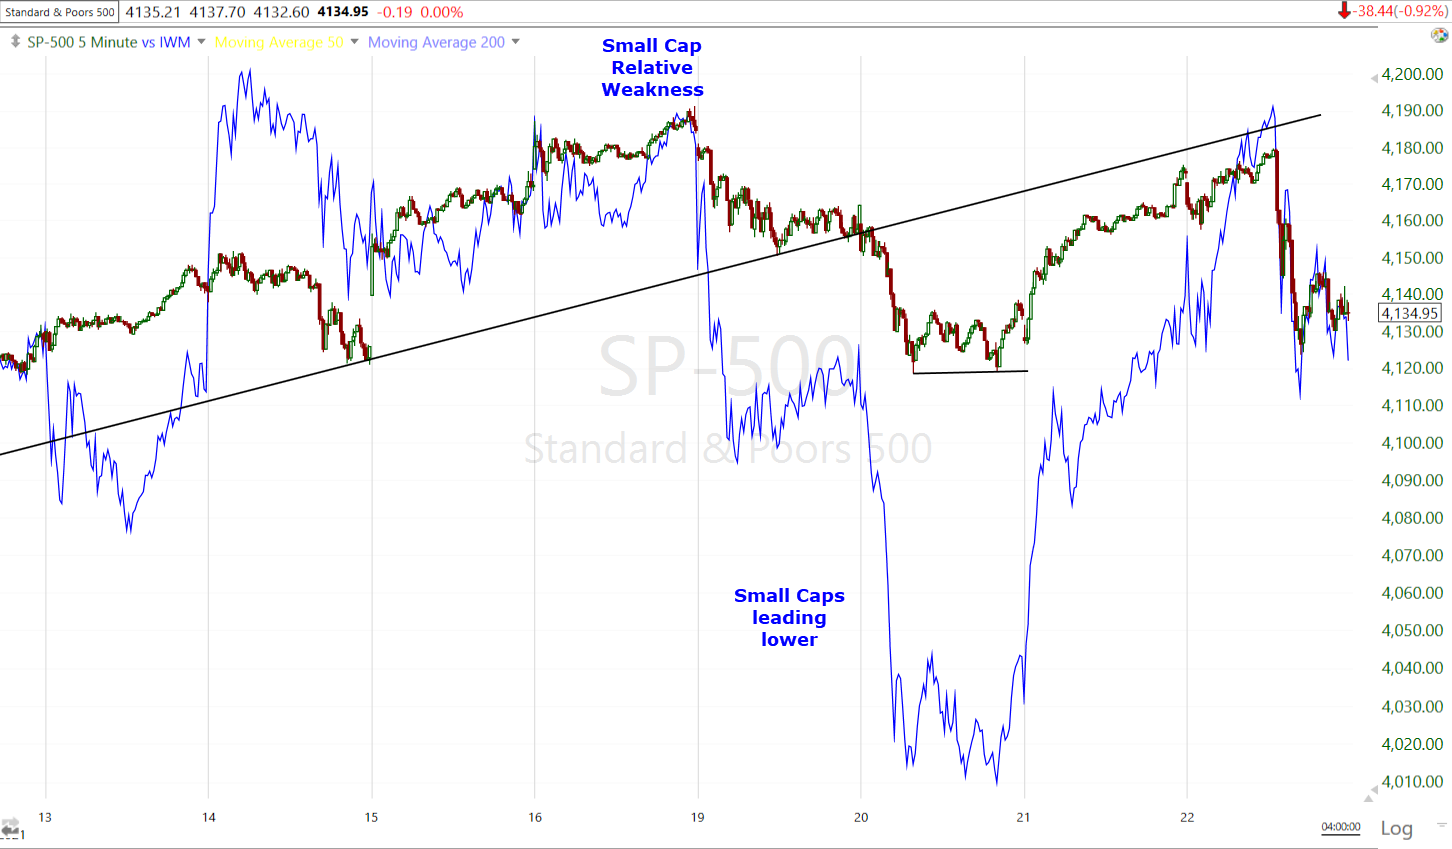
 SPy (5m) for my purposes and analysis I don’t usually have to go out to the 5 min charts, but this trend is interesting and is reminiscent of other leading indicators like credit’s and Small Caps’ relative weakness or market breadth.
Just a reminder to take a look at Emerging Markets (EEM -0.35%).
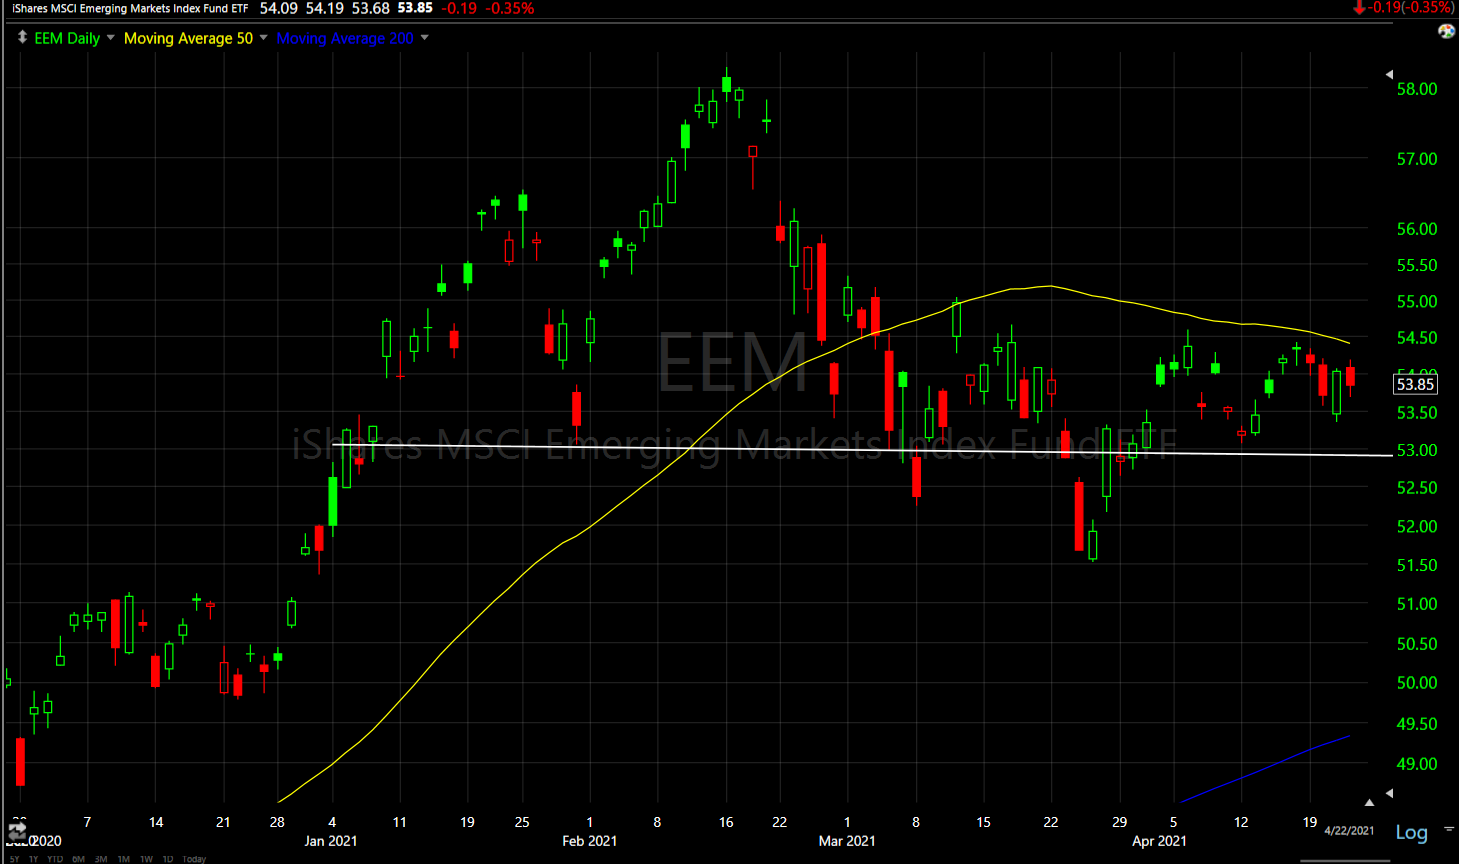 EEM (daily) w 50-day sma (resistance). This is looking toppy.
In addition, the Emerging market currencies tend to lead the equities both higher and lower.
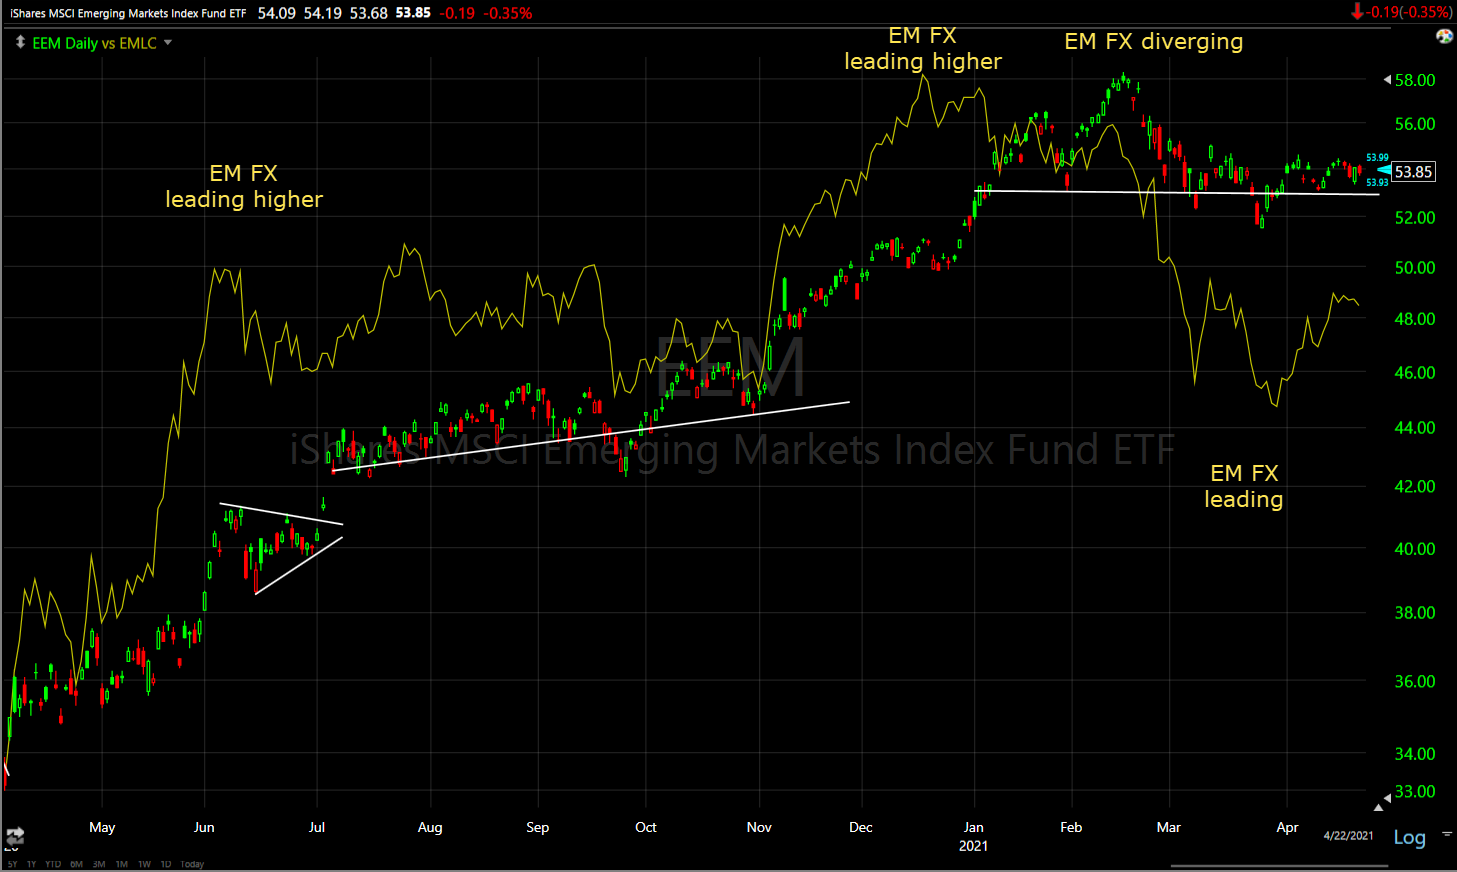 EEM (daily) and a proxy for a basket of emerging market currencies (yellow). any of the emerging market countries are seeing rapid and record rises in COVID cases. An additional headwind for EEM and EM currencies would be the U.S. Dollar strengthening.
In terms of relative price performance, VIX (+6.9%) acted normally today. The news and resulting selling caught the market by surprise. However, VVIX (+2.8%) has had a few weeks of a highly unusual relative strength trend vs. the S&P-500.
S&P sectors
Every sector in the S&P 500 closed in negative territory with cyclical Materials the worst. Other cyclicals like Energy and Financials underperformed, as did mega-cap heavy Technology and Consumer Discretionary. the defensively oriented Health Care and Real Estate sectors were the least bad. within the Technology sector Semiconductors (SOX -2.3%) were an area of relative weakness with the Philly SOX index nearly tagging its 50-day sma.
Materials ⇩ -1.69 %
Energy ⇩ -1.17 %
Financials ⇩ -1.11 %
Industrial ⇩ -0.51 %
Technology ⇩ -1.17 %
Consumer Staples ⇩ -0.74 %
Utilities ⇩ -0.71 %
Health Care ⇩ -0.45 %
Consumer Discretionary ⇩ -1.11 %
Real Estate ⇩ -0.43 %
Communications ⇩ -0.74 %
Earnings reports continued to come in mostly better than expected, but many stocks had disappointing reactions, including Lam Research (LRCX -4.2%) and Dow Inc. (DOW -6.0%). Union Pacific (UNP -2.4%) had an appropriate reaction after missing top and bottom-line estimates.
AT&T (T +4.2%) and Equifax (EFX +14.9%), on the other hand, were some of the more notable earnings winners, with EFX rising 15%.
Internals
Yesterday the market ended the day with a 1-day overbought condition and price action clearly ran out of momentum earlier today before the Biden tax plan news. Today NYSE Decliners (1971) edged out Advancers (1276), but not by a notable margin. Volume was heavier today at 866.1 mln. shares.
the Dominant price/volume relationship came in at Close Down/Volume Up, which is typical of a 1-day oversold condition, as is all 11 S&P sectors closing lower. However the third and final component to a 1-day oversold condition is decliners outpacing advancers by at least a 2-to-1 margin or more, and that didn’t happen today.
In the very short term breadth didn’t see much damage today after a very strong day yesterday…
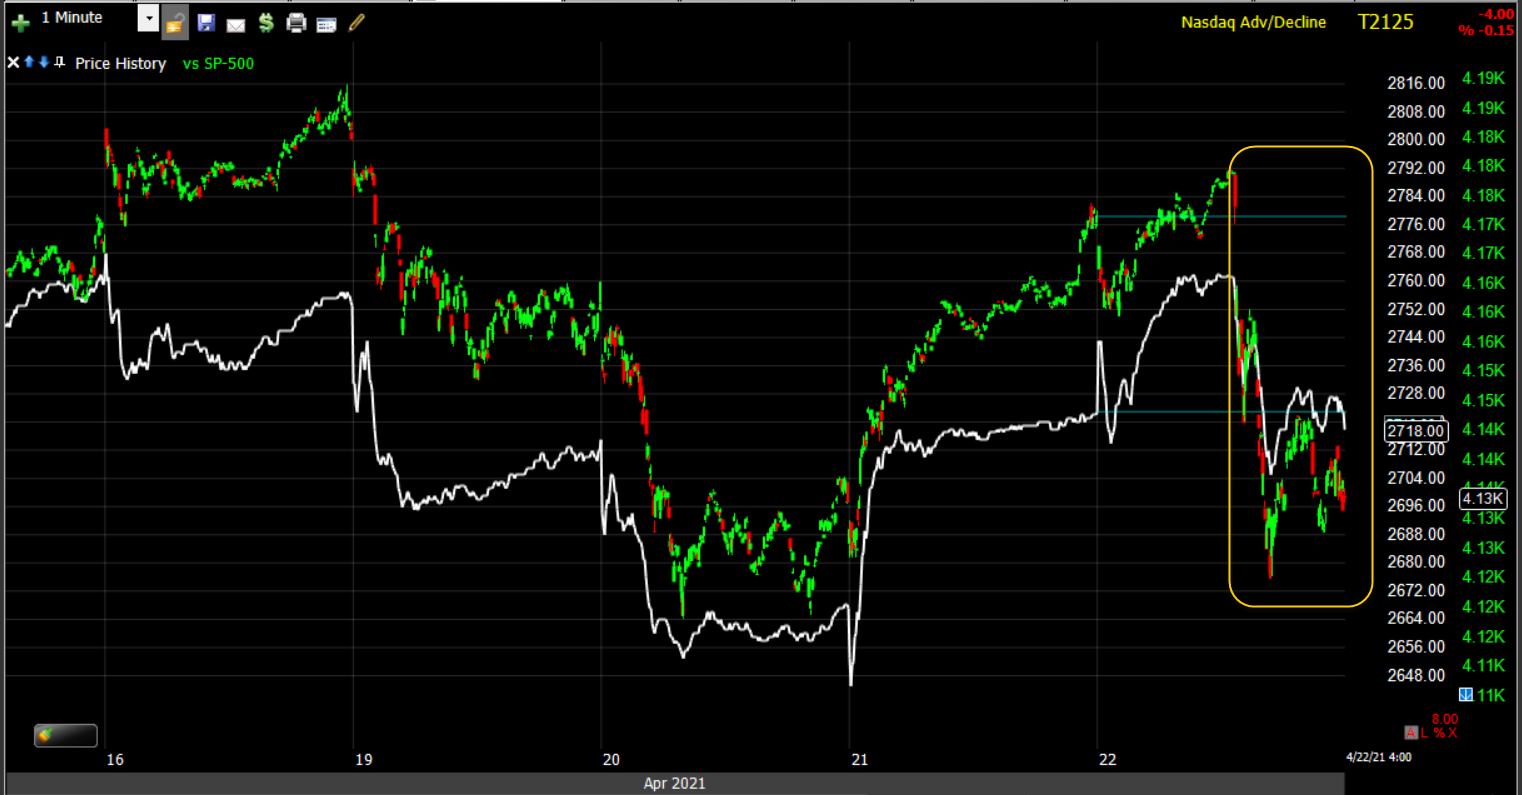 SP-500(1m) and NASDAQ Composite’s advance/decline line in the very near term…
…but also like yesterday, the overall trend of deterioration (lower highs and lower lows negatively diverging with the market averages from the March oversold low) is still well intact.
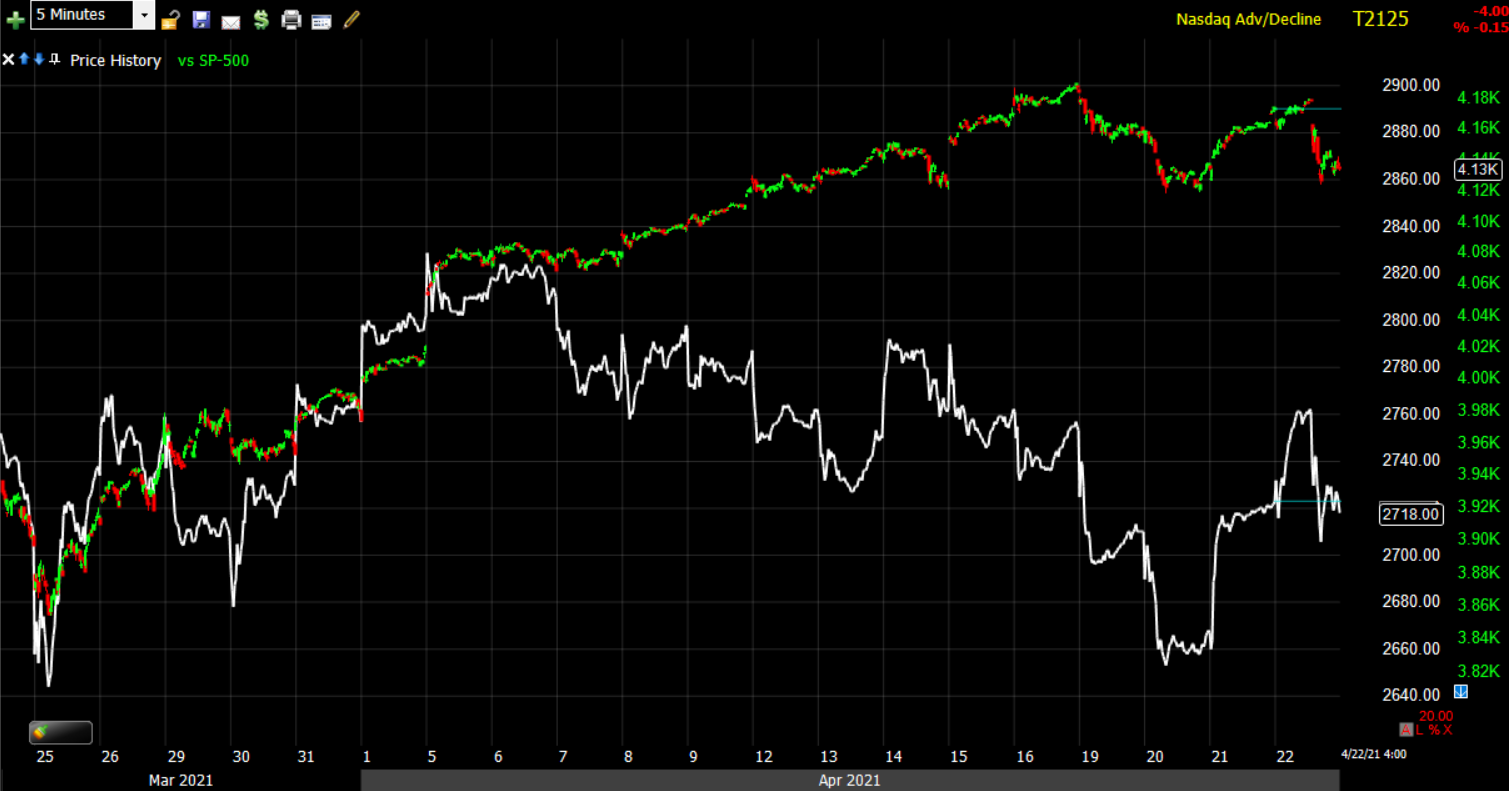
SP-500 (5m) and NASDAQ Composite’s advance/decline line trend from the market’s March deeep oversold low and subsequent rally.
Over the last 2 weeks I’ve mentioned numerous times that the Absolute Breadth Index is plunging rapidly and typically when it does that, it’s not uncommon fo it to post an extreme low. Today ABI hit 15.
 SP-500 (5m) and the Absolute Breadth Index (white)
Extreme lows in ABI (I consider to be under 15) more often than not lead to big moves up in VIX over the next month, sometimes the very next day. These extreme low long volatility signals from ABI are not very common… maybe once a year. I believe this will be the 4th such signal this year-to-date (2021). VIX jumped higher after each of the last 3.
Treasuries
U.S. Treasuries finished little changed in a relatively muted choppy session for the second day. The 2-year yield was unchanged at 0.14%, and the 10-year yield decreased one basis point to 1.55%. There’s no technical change on the charts after today’s modest moves.
Currencies and Commodities
The U.S. Dollar Index increased 0.1% to 91.26.
WTI Crude oil closed very modestly higher +0.2% to $61.45/bbl. I’ve been talking about WTI crude’s primary downtrend for almost 2 months, and the trouble price has been having with the area. Earlier this week I thought prices would trade right back down to the primary downtrend….
“WTI Crude futures (10m) – if crude continues to consolidate in a bearish flag I expect the primary downtrend from 2008 (red) will be a magnet for prices as WTI hasn’t been able to escape the primary trend’s gravitational pull.”
…and WTI did trade down to it in the overnight session and found some local support.
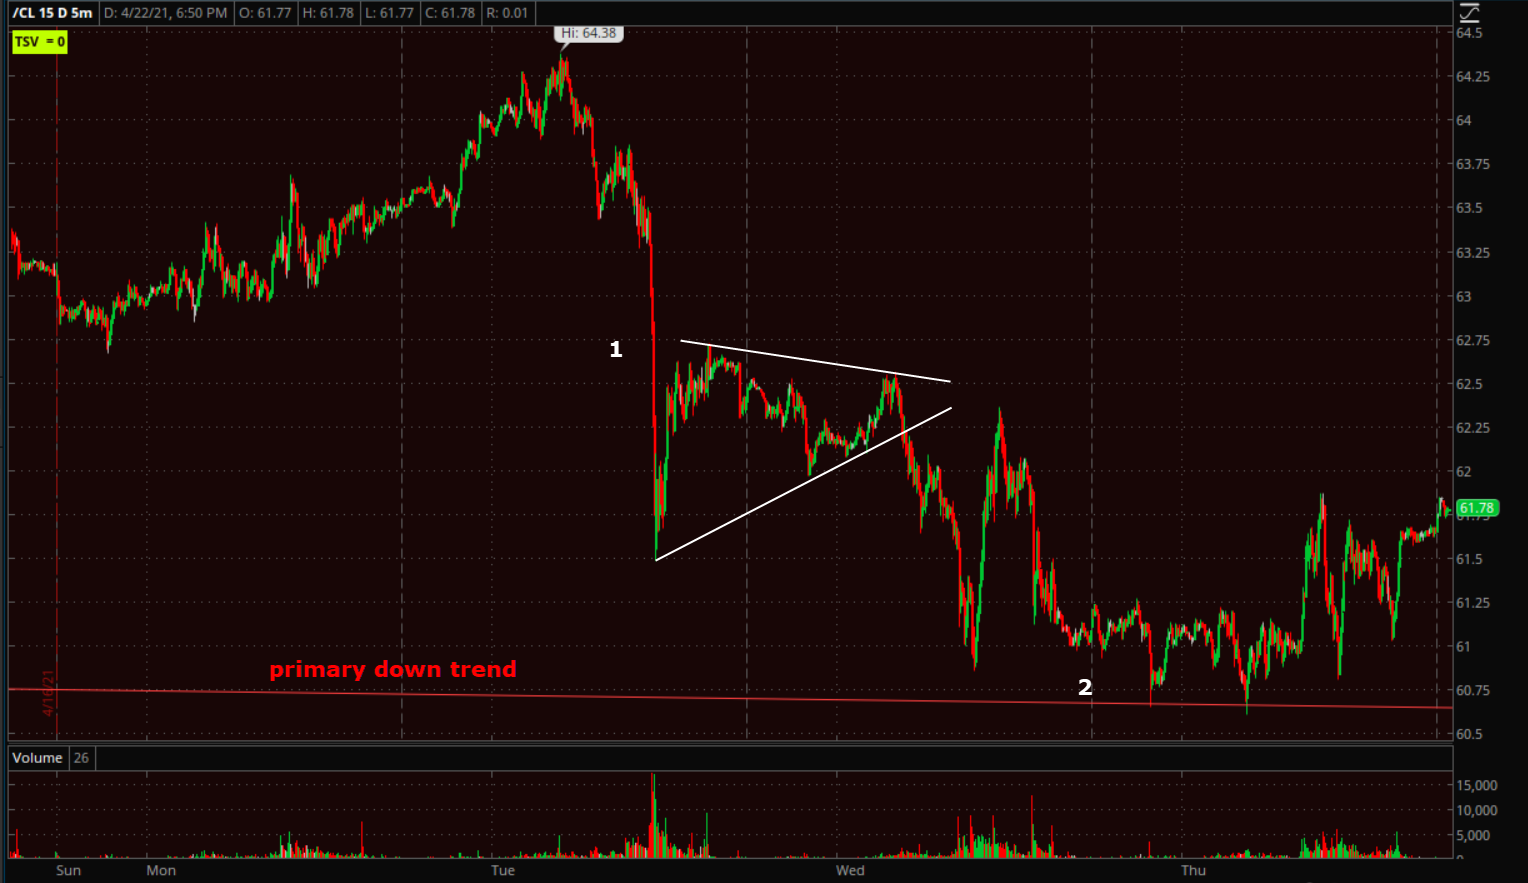 WTI Crude (5m) after the sharp drop and triangle consolidation earlier this week, a second leg down would test the primary downtrend from above, which price did overnight and got a very modest bounce from the measured move target and technical trend line.
Gold futures settled lower by -0.6% to 1,782.00/oz as the yellow metal snaps its recent two-session winning streak. I don’t see anything that’s trend changing in toya’s action so my base-line scenario is that gold meets its own 2nd leg upside measured move about 2% higher from this afternoon’s price.
Ethereum surged to another new record high, sending ETCG higher by +4.8% in what appears to be a breakout from the small bullish consolidation that formed after the 2-leg rally reached its target level on Friday.
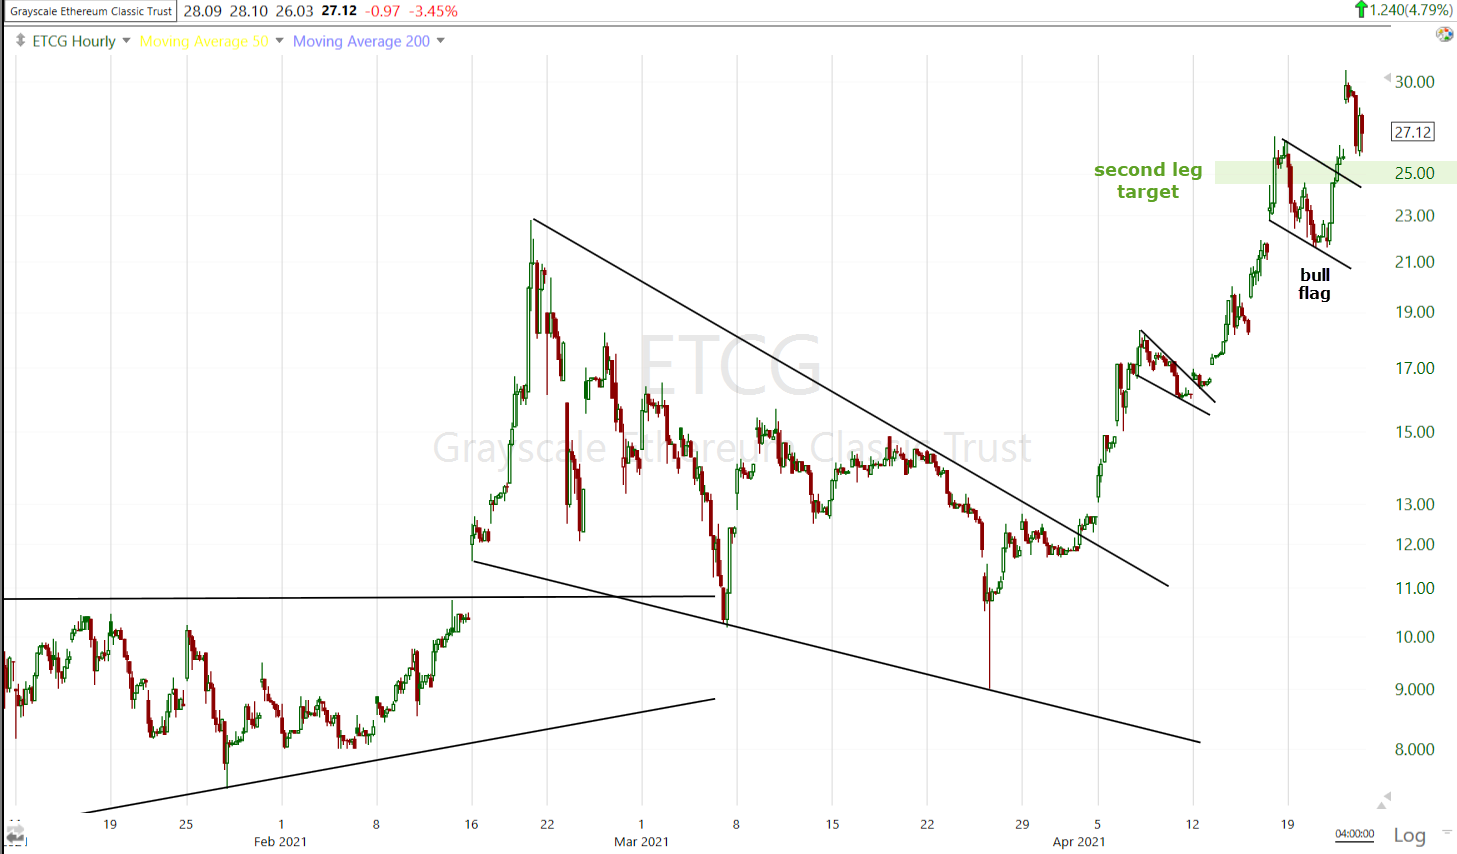 ETCG (60m)
In the Early Update I posted a chart of ETCG’s much better relative performance vs. GBTC (Bitcoin trust), and what looks like a failed breakout and fast reversal in GBTC, which lost -8.9% today.
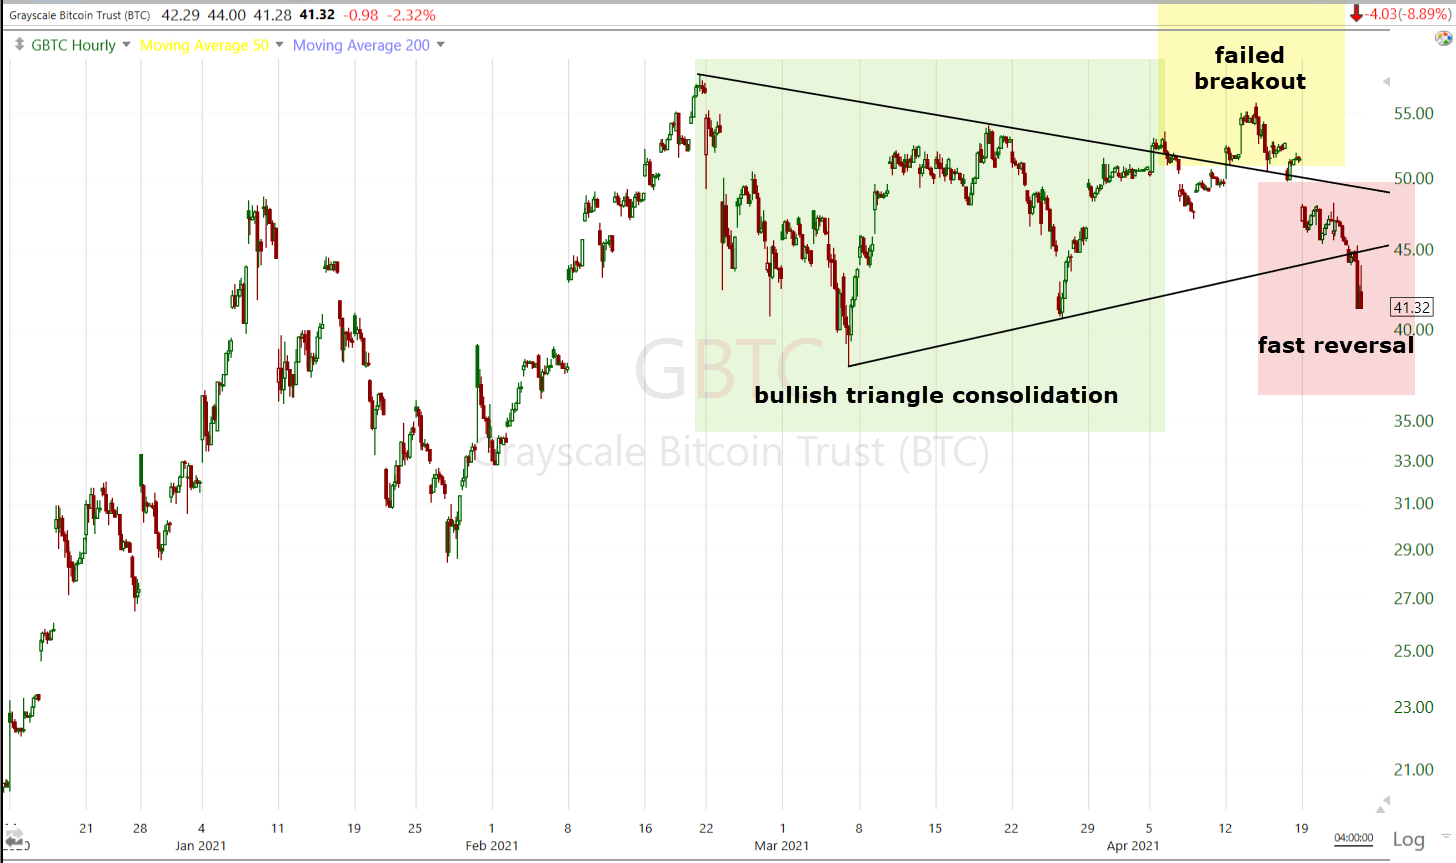 GBTC (60m) went from a large symmetrical triangle, which had a bullish bias due to the preceding up trend, but it’s not the most bullish of the bullish consolidations. Last week GBTC attempted to breakout from the triangle and that breakout failed. In my expiernece, when a breakout fails, it often leads to a fast reversal as new longs who chased the breakout sell at a loss once the breakout fails, and other technical traders see the breakout attempt fizzle out and pack it in too. There’s no measured move or way to estimate the potential downside, it’s just that failed breakouts (or breakdowns) often lead to fast price reversals.
Looking at Bitcoin vs. the USD (BTC/USD)…
 BTC/USD (daily) you can see the positive up trend of higher highs and higher lows (green circles) is intact although t clearly slowed, but volume on each successive higher high has been falling rather than rising (bullish). Todays price decline did not make a lower lw (yellow), but the first equal low rather than a higher low s this is a slightly more bearish development, although the primary, intermediate and sub-intermediate up trends are intact. The short term trend may be in some trouble with the equal low today.
With regard to taxes, investors already face a capital-gains tax if they hold cryptocurrency for more than a year.
Summary
Tuesday market internals were 1-day oversold as Small Caps perfectly met a downside measured move. The S&P and NASDAQ went on to bounce toward a back-tst of their broken Ail up trends. Yesterday internals were 1-day overbought and we could see the loss of momentum in stocks this morning even before the Biden tax plan news. Today leans toward 1-day oversold, but advancers/decliners rule it out. So far the week is on track to be the worst week for stocks since mid-February.
Most of the averages made a slightly higher low relative to Tuesday’s low. NASDAQ-100 is an exception having traded right back down to the level (presumed to be temporary local support). Prices did end with a slight bearish consolidation bias, but it’s probably too early to say that definitively.
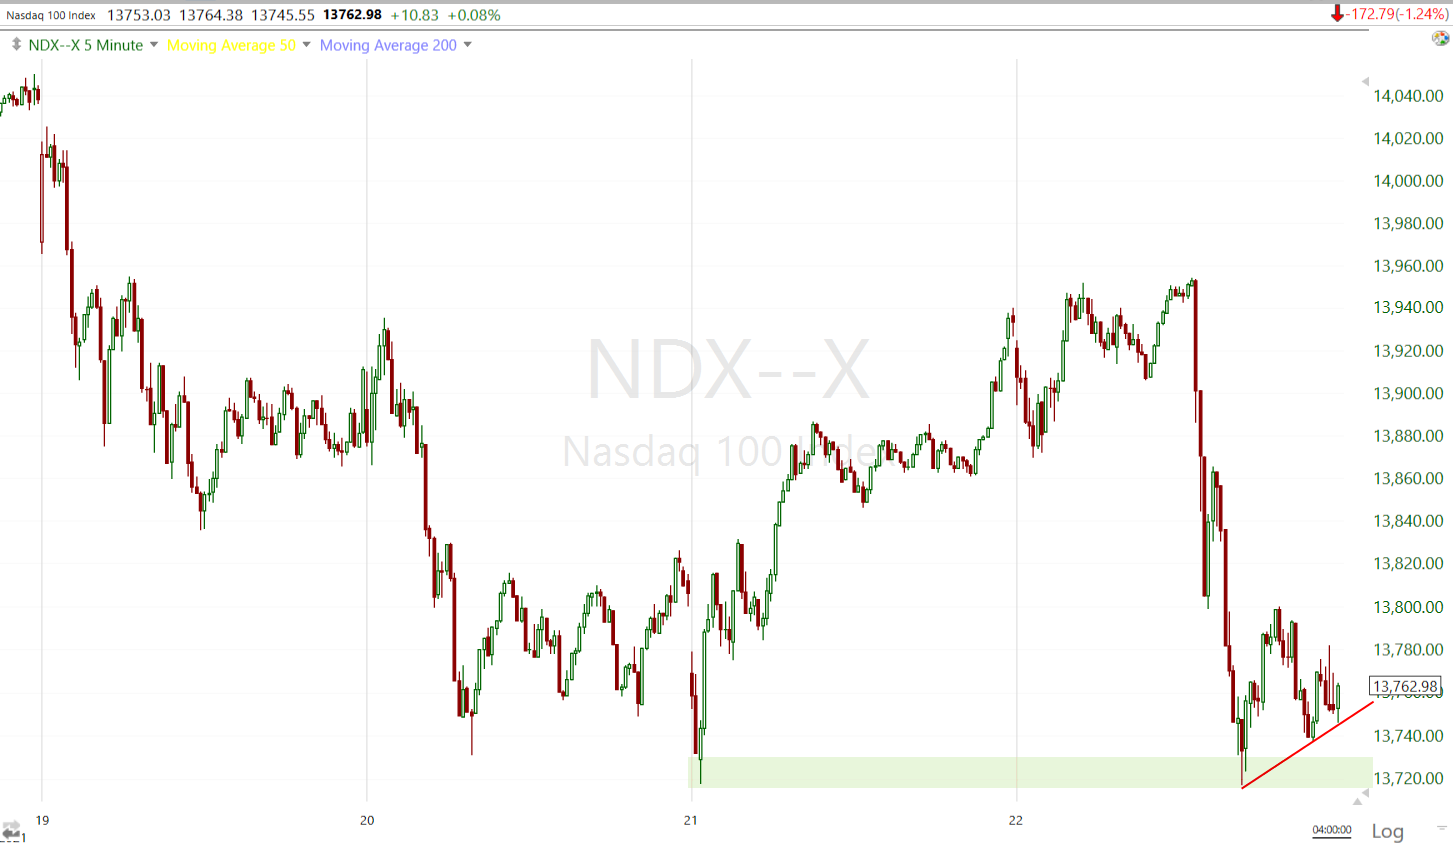 NASDAQ-100 (5m) ended with a bearish slanting consolidation (red), but found local support at Tuesday’s low (green). The price action in the overnight session may add some color by the morning.
Otherwise credit is one of the sketchy leading signals for risk sentiment. I showed a few different individual issues above, here’s my broader custom credit index and it is leading the S&P lower…
 SP-500 (1m) and my custom credit index (white).
In Tuesday’s Afternoon Update I posted,
“If you are considering a short sale due to the broken trend, the risk/reward is much more favorable on a bounce up to the trend line where a short position can be started and a stop can be placed a bit above the trend line. There’s the additional edge of being able to see what other indicator or assets are doing during such a bounce. For example… Does 3C confirm to with the bounce or does it negatively diverge? Does credit confirm the bounce or even lead i, or does it negatively diverge? While the bounce or back-test of the trend line can give you a better risk/reward profile, the answers to these questions can give you much better insight into the probabilities of a successful trade. “
Although prices backed down from the trend line today on the Biden tax news, I feel the same today as I did when I wrote that tuesday afternoon. If the opportunity presents (and for some of you it did with the S&P ‘close enough’), I still think that’s a favorable potential trade idea, especially if there’s another bounce attempt in the averages while credit, breadth, 3C (etc) still don’t confirm, or get worse in leading to the downside. I’m not partial to trades during earnings season because of many unpredictable factors and a general choppy sideways trend, but if the probabilities are stacked up on your side -and the more indicators that say the same thing, the better the probabilities, -well then it makes some sense to take a look at that trade.
I think it’s also interesting that just as the market is starting to get a bit hairy (maybe the worst week since February) the Absolute Breadth Index is plunging toward an extreme low, which is more often than not followed by a large percentage spike up in VIX.
I’m very happy with ETCG and its price action. It’s up +76% since buying in mid-March. I’m a little more concerned with GBTC, although BTC/USD’s price trend is still up, it’s just running out of steam. I suspected Ethereum would start to outperform and that’s why I added ETCG to my crypto (long) position. I’ll be watching GBTC carefully, but it’s still up over 280% since buying in mid-June 2020 and I’m not too concerned yet, especially with Ethereum performing well.
Overnight
S&P futures are unchanged with 3C in line. Dow is similar. NASDAQ-100 futures are also unchanged, but 3C is leading lower tonight.
S&P futures (1m) – notice there was no negative divergence in 3C before prices plunged, that’s because prices plunging were an immediate knee jerk reaction to surprise tax news. However, 3C is leading lower tonight as the NASDAQ went into a weak bearishly biased consolidation following the tex-selling plunge.
WTI crude is up +0.5% and Gold futures are flat.
Looking ahead, investors will receive New Home Sales for March and the preliminary IHS Markit Manufacturing and Services PMIs for April on Friday.