Daily Market Wrap
Index futures started the new month with decent gains in pre-market. The strong start was likely fueled by first-of-the-month inflows (evidenced by heavier volume) and a news cycle that fed into the reopening optimism including: better-than-expected manufacturing PMIs for May out of the U.S. and Europe, the OECD boosting its global growth forecasts for 2021 and 2022, OPEC+ commenting on strong oil demand, and reports highlighting solid activity in airports and movie theaters over the weekend. However, after a promising early start with the S&P-500 up as much as +0.7%, those gains faded fast at the cash open.
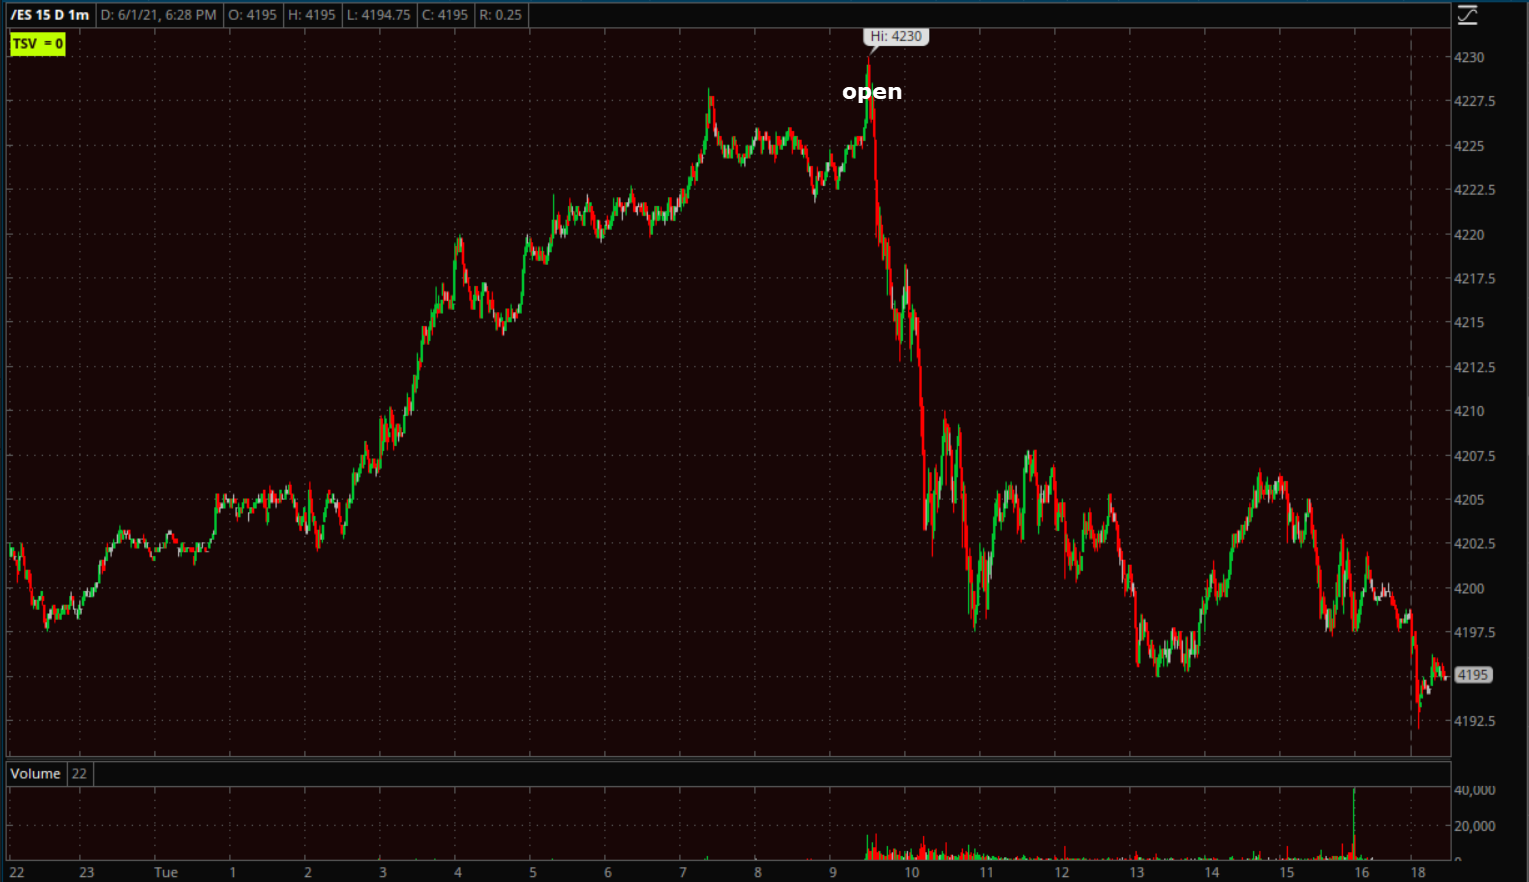 S&P-500 futures (1m)
I’ve been expecting the Dow to fill the May 11th gap, it did so at the open and the S&P traded up to the May highs before finding resistance and turning back down.

Dow (30m)
Small Caps outperformed once again for the same reason as most of last week, the most shorted stocks were squeezed. Cyclical sector outperformance also aided small caps, while large-cap tech/secular growth faded under the weight of higher long-term bond yields.
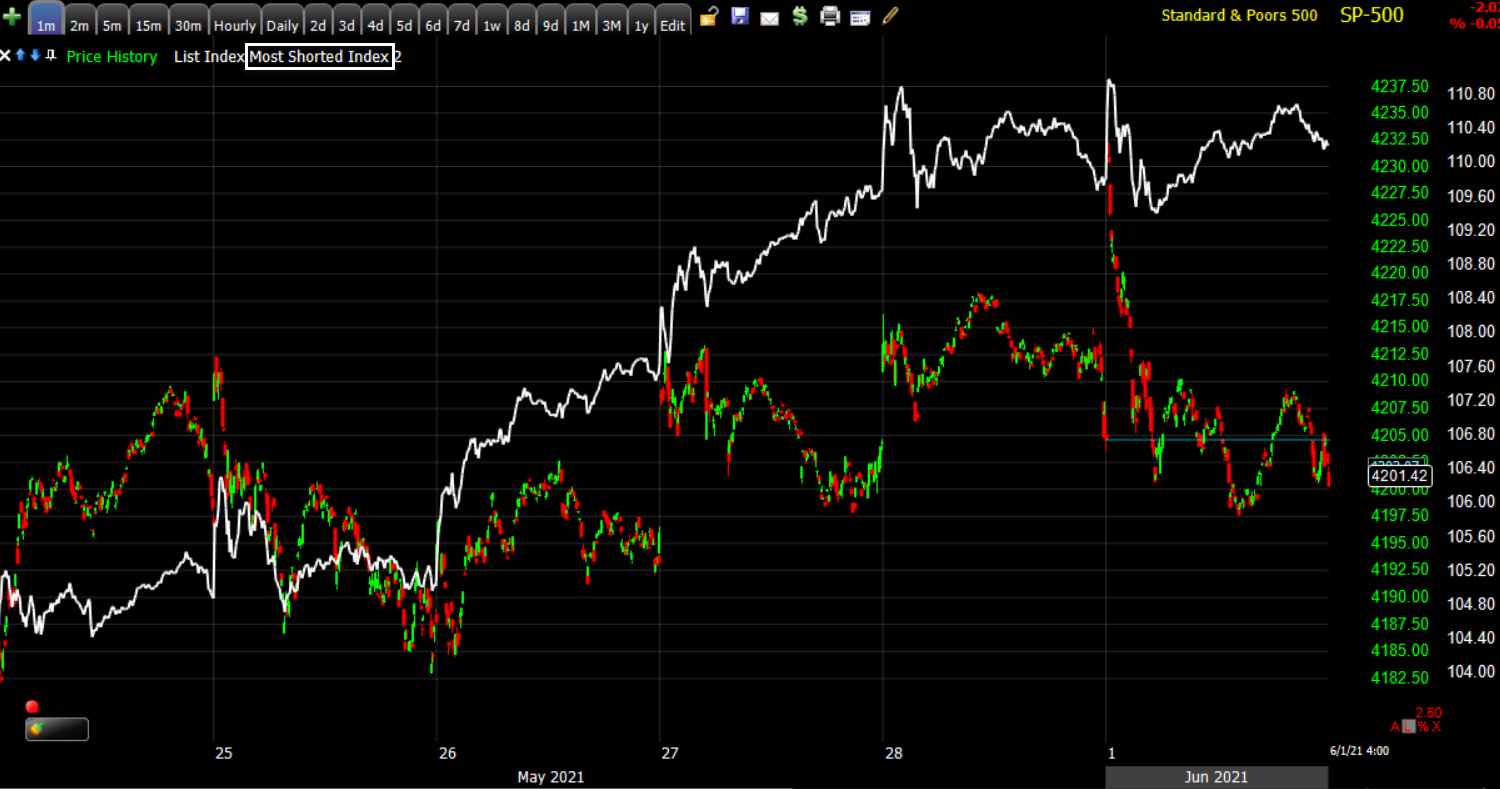 SP-500 (1m from last week) and the Most Shorted Index of stocks (white) squeezing higher. The short squeezes have disproportionately aided small caps as apparent on the chart below…
 Small Cap IWM (1m from last week) and Most Shorted Index of stocks (white).
As an example, AMC Entertainment Holdings (AMC) gained +22.66% today after double digit percentage gains every day last week except Friday, gaining more than 116% last week alone.
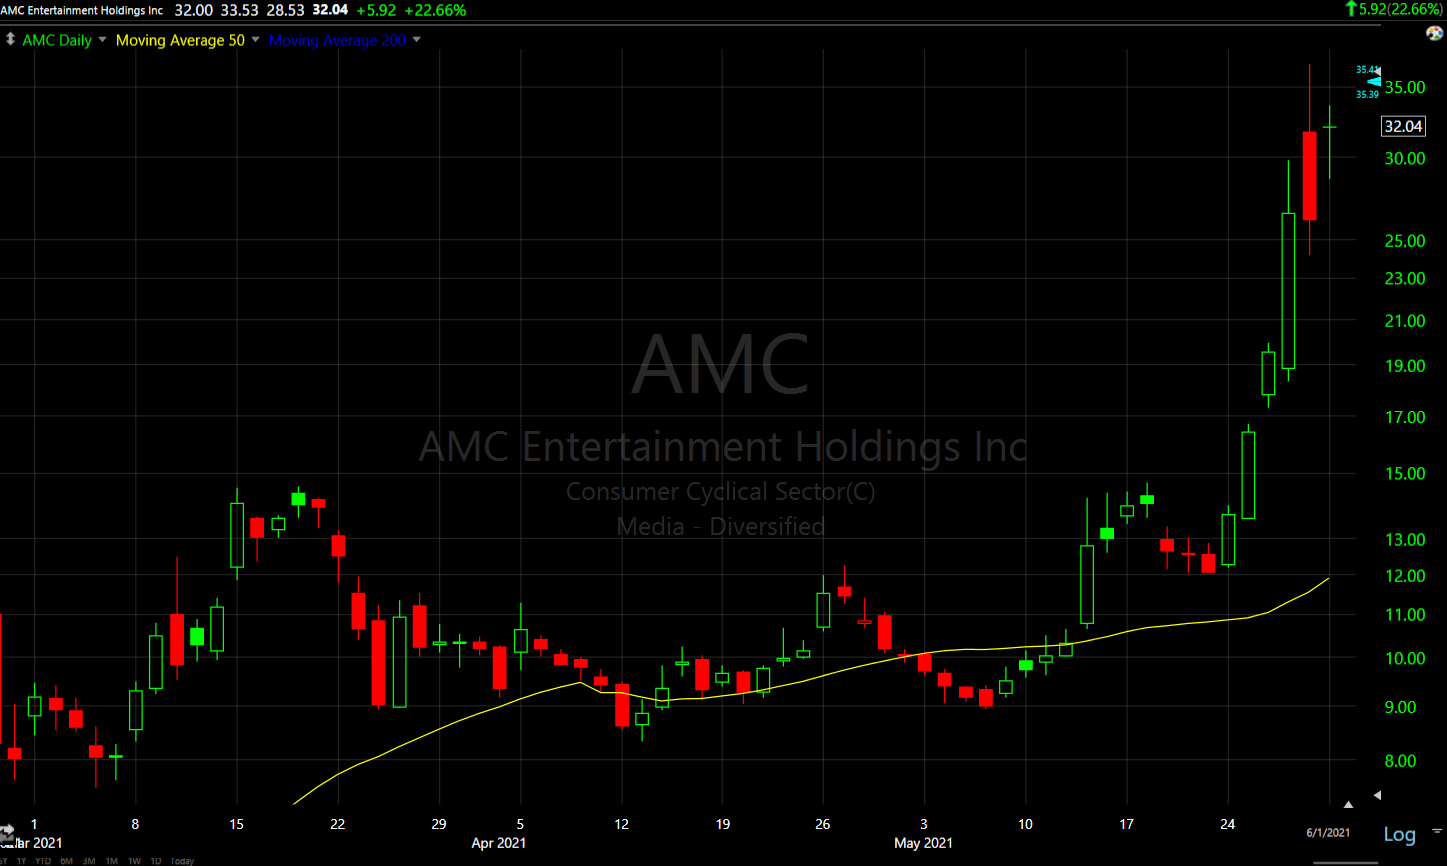 AMC (daily) despite today’s gains, the last 2 days’ candlesticks appear as if the squeeze may be running out of momentum.
There was some more unusual activity amid the strong start in equities, which included unusual relative strength in VIX (+6.8%), following last week’s unusual relative weakness (20% decline on the week). VIX had a min-flash rash before the cash open before surging higher at the open despite stocks opening higher.
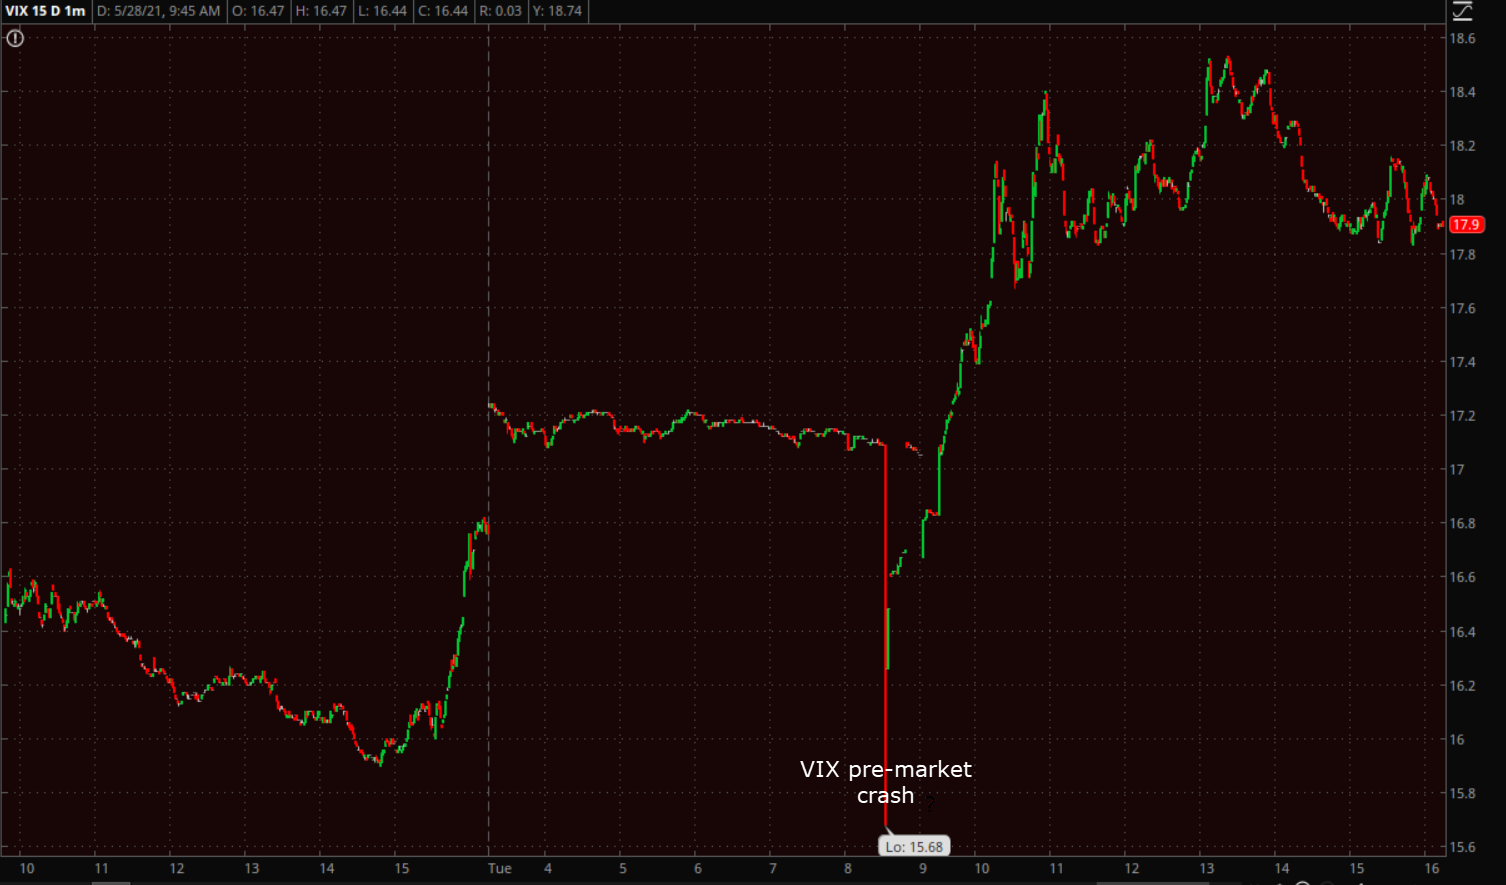 VIX (1m including pre-market). Recall that the Absolute Breadth Index hit an extreme low (13) on May 25th, suggesting a very high probability that VIX surges over the next month.
The unusual hedging activity in volatility was not isolated to VIX. Volatility’s term structure indicated an uptick in hedging activity.
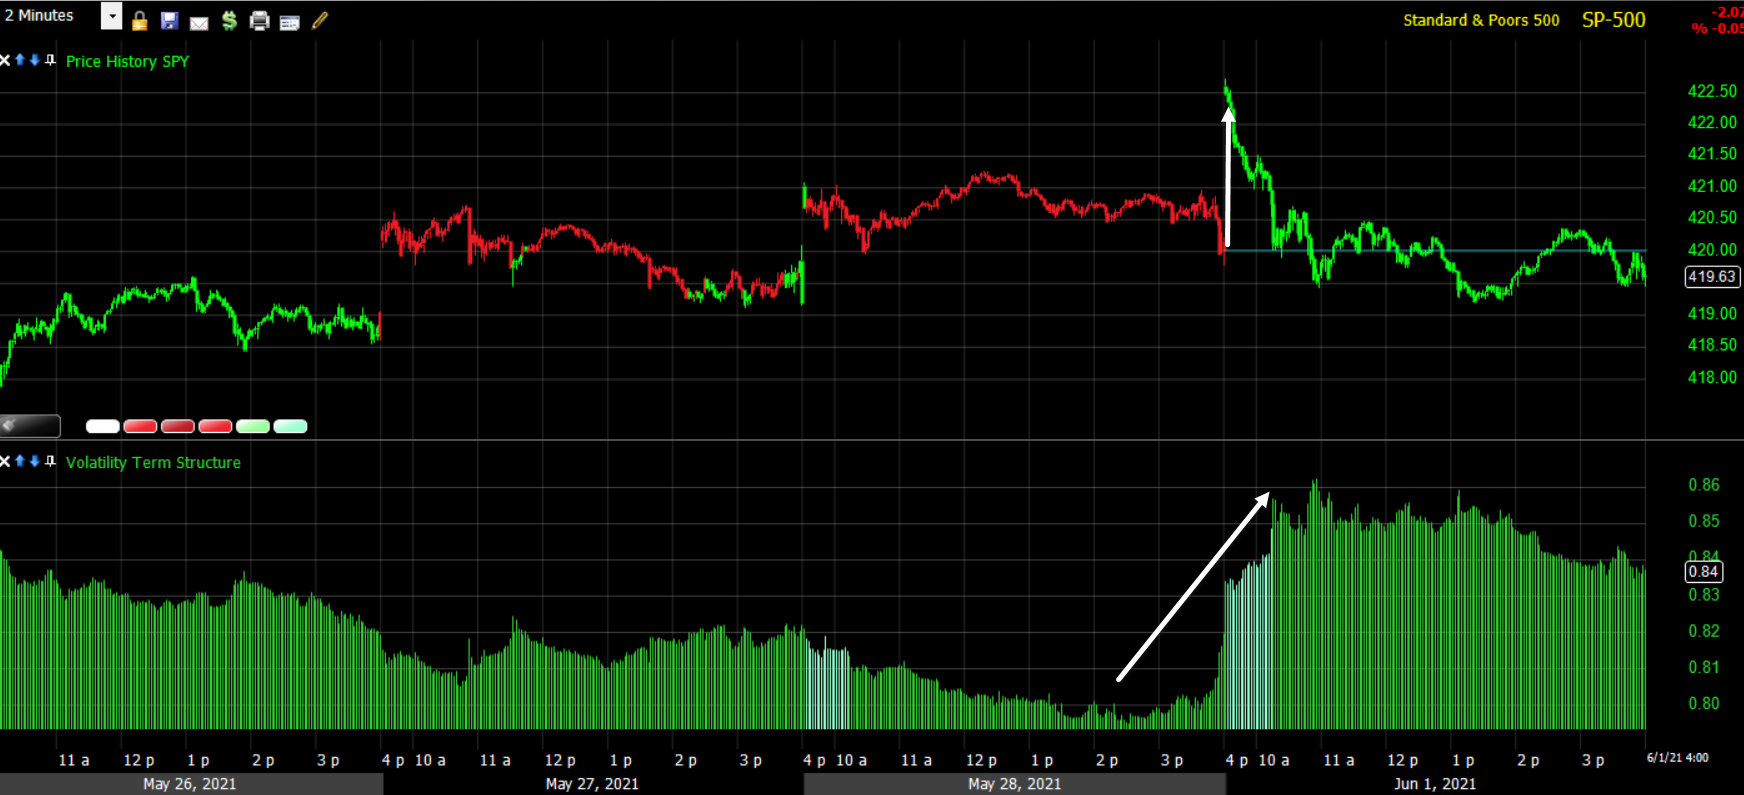
SP-500 (2m) and Volatility’s term structure flattening at the open despite the S&P gapping higher. And the unusual hedging activity didn’t end there.
Averages
Small Caps outperformed, while Tech’s influence (and weakness) weighed on the NASDAQ-100 and S&P.
S&P 500 ⇩ -0.05 %
NASDAQ ⇩ -0.23 %
DOW JONES ⇧ 0.13 %
RUSSELL 2000 ⇧ 1.14 %
A couple of the major averages appear to have posted a head fakes or failed breakouts from last week’s narrow consolidation ranges (triangles with short term bullish bias) as covered Friday. Most of the averages ended the day with bearish leaning daily candlesticks as well.
 SP-500 (daily) with a bearish candle engulfing Friday’s.
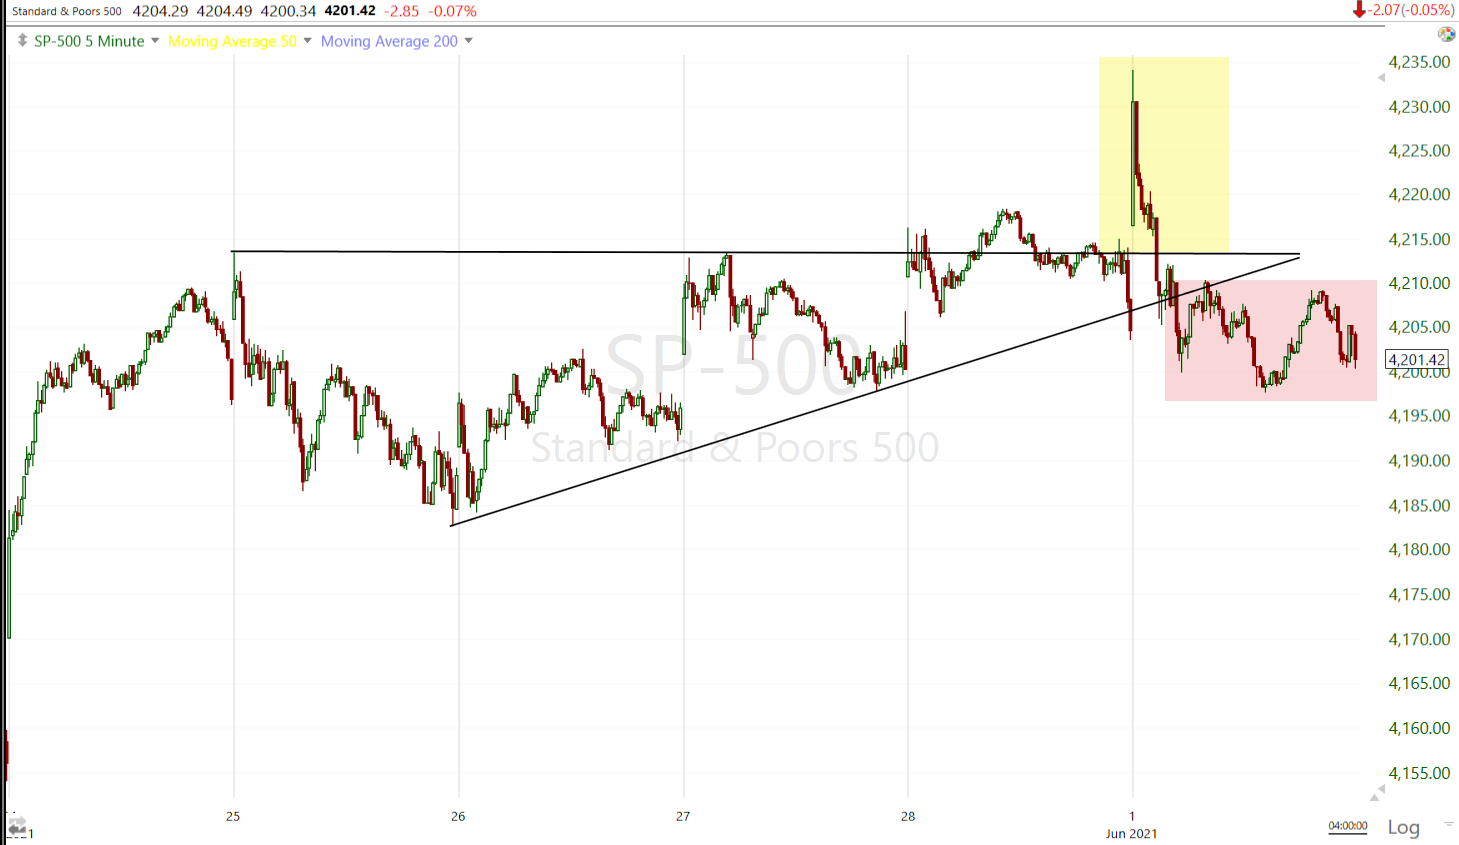
SP-500 (5m) may be a failed breakout (yellow) and starting the often-seen fast reversal (red).
The S&P did manage to hold above the $4200 level on the close, which has been a key technical area the last week.
 SP-500 (30m)
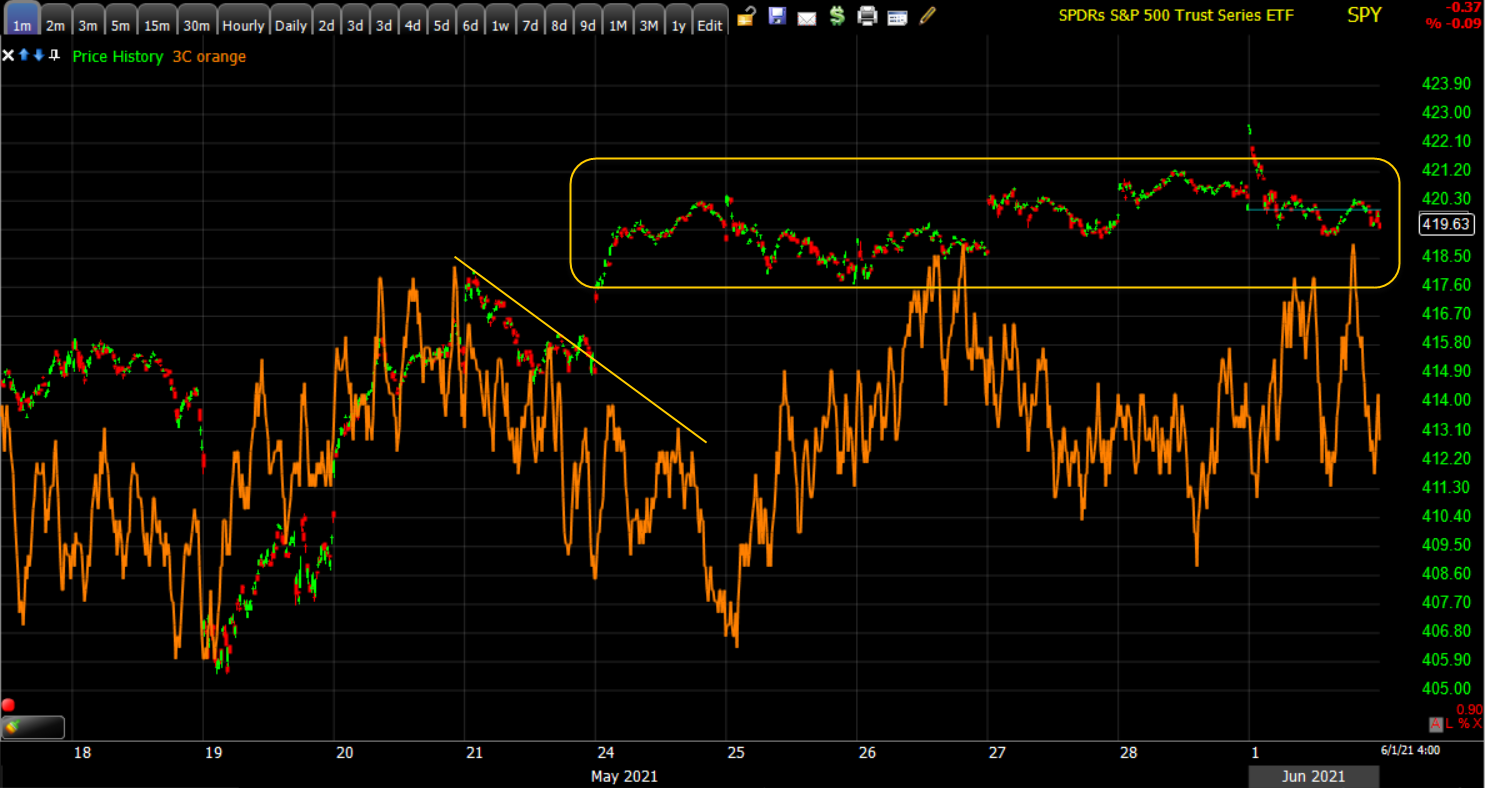 SPY’s (1m) 3C chart first negatively diverged early last week (yellow) leading to a lateral price trend (from up). 3C has been fairly messy since then, pretty much as I’d expect given the narrow choppy price range.
From Friday’s Afternoon Update…
“The Dow has about a half percent on the upside to go to fill the May 11th gap. Considering the week’s consolidations and the ascending triangles in the averages posted in the last update, I still think the Dow filling that gap is a probability.”
The Dow filled the gap today. However, once the gap was filled I didn’t expect much more upside. From last Thursday’s Daily Wrap…
“There’s still not a lot of movement on 3C charts. Dow’s looked a little better again today so I think there’s a good probability it fills the gap from May 11th, but I’m not sure I’d expect much beyond that. “
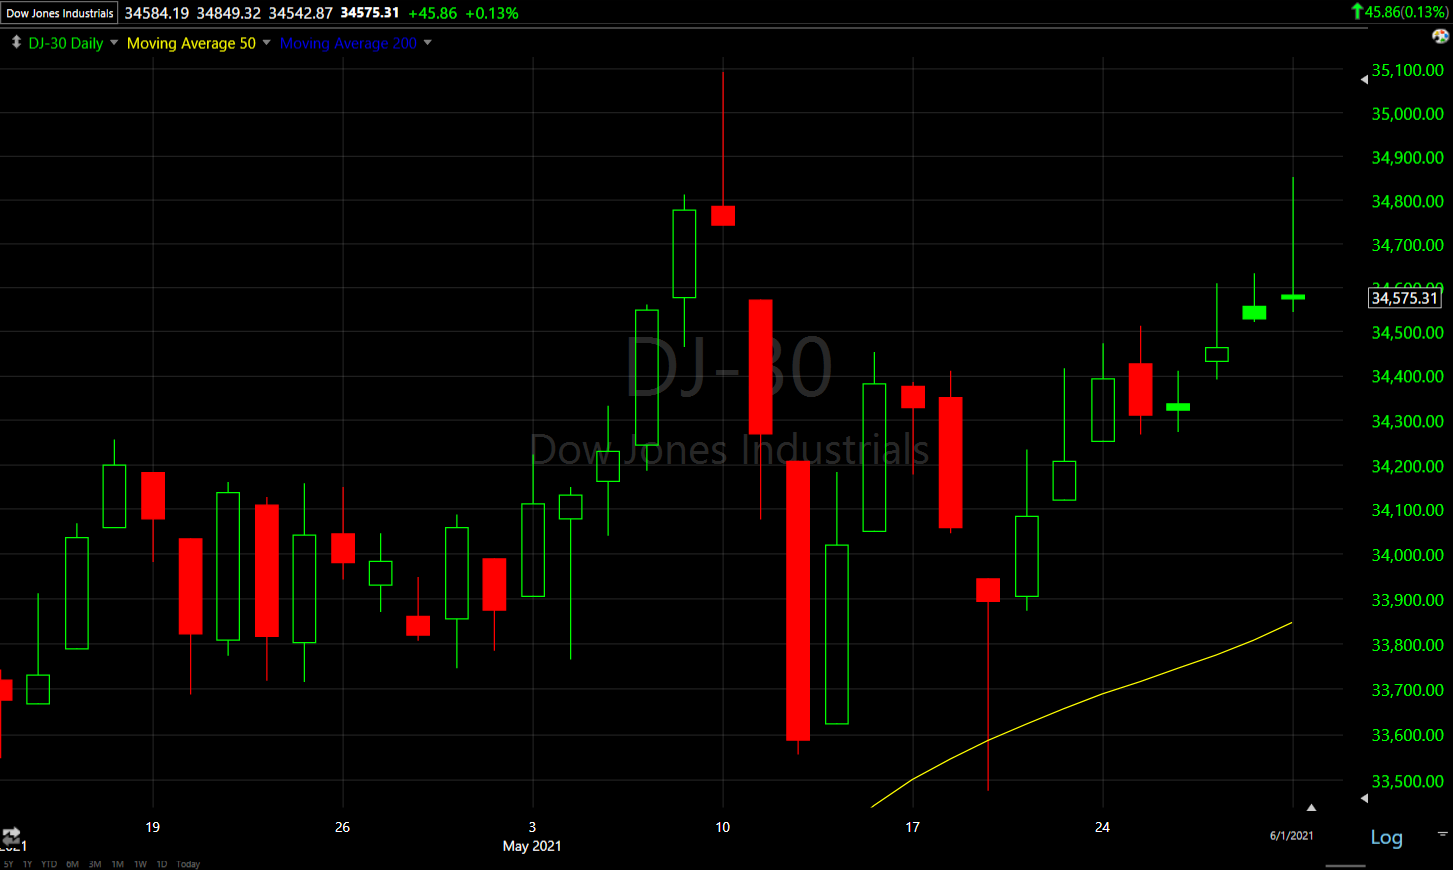 The Dow (daily) filled the May 11th gap, but left a long upper wick on today’s candle indicating an inability to hold early gains once the gap was filled.
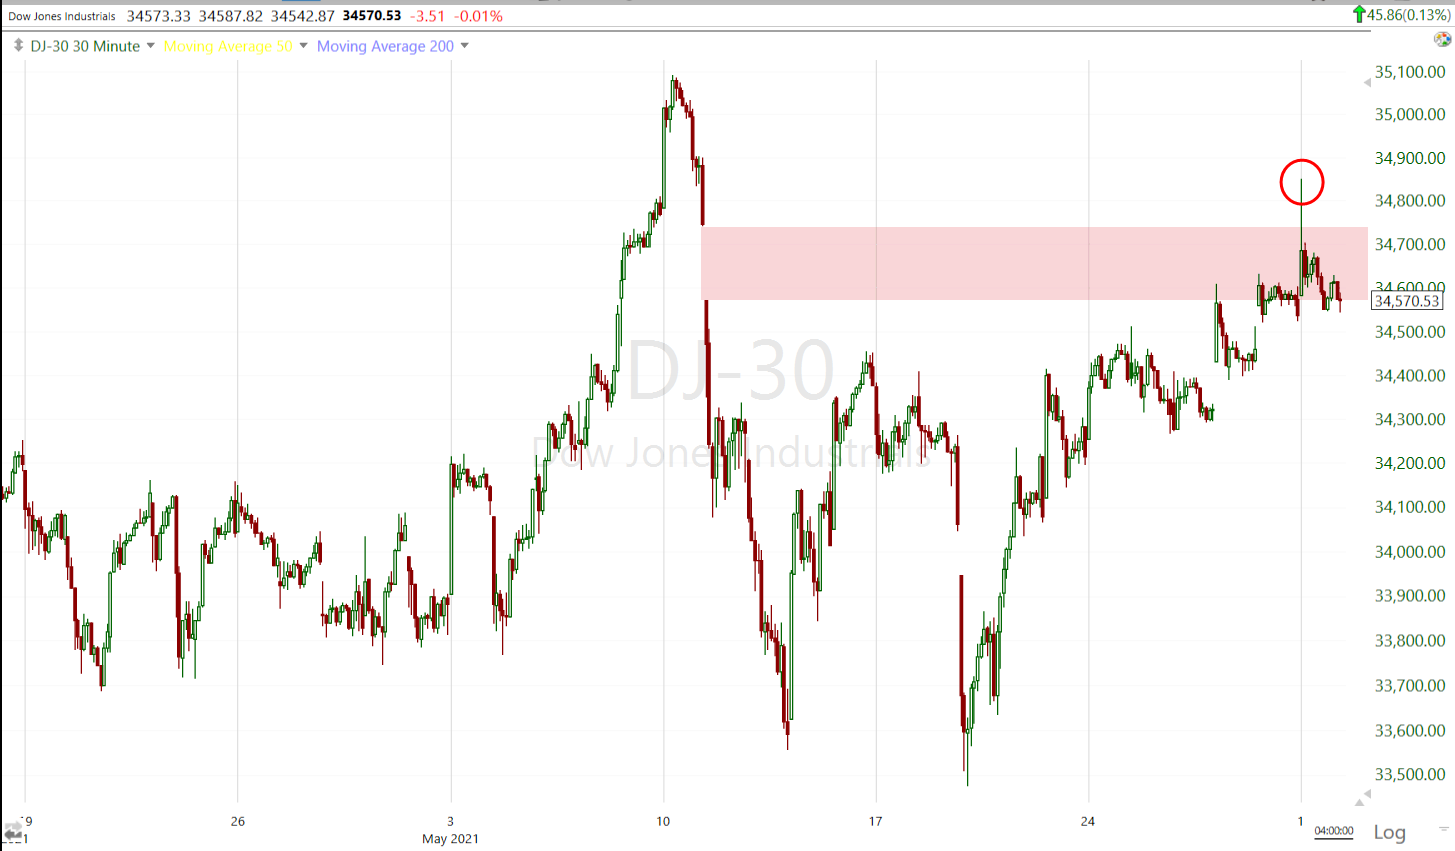 Dow (30m) filling the gap
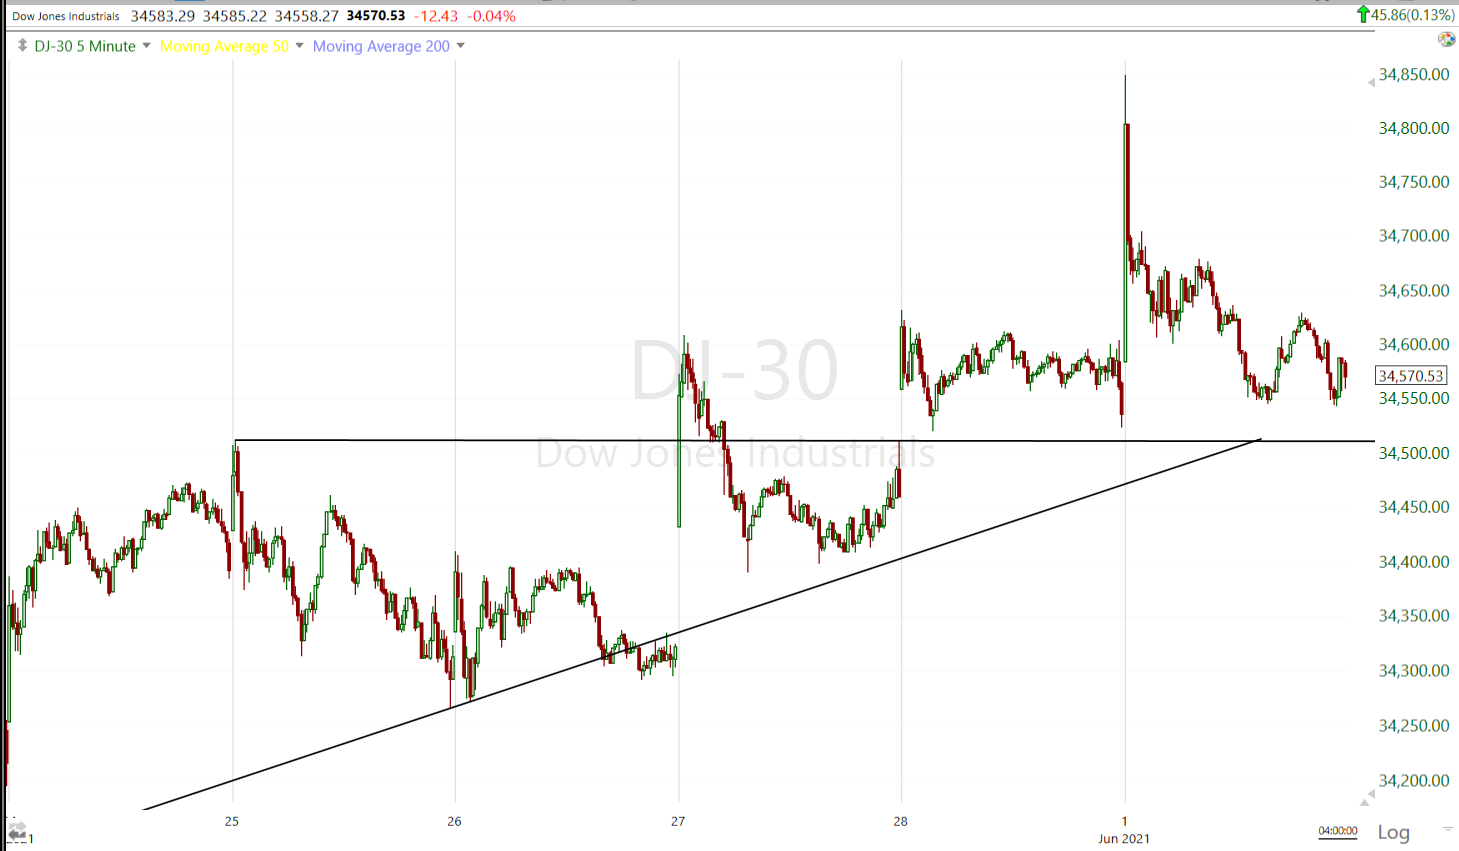 Dow (5m)
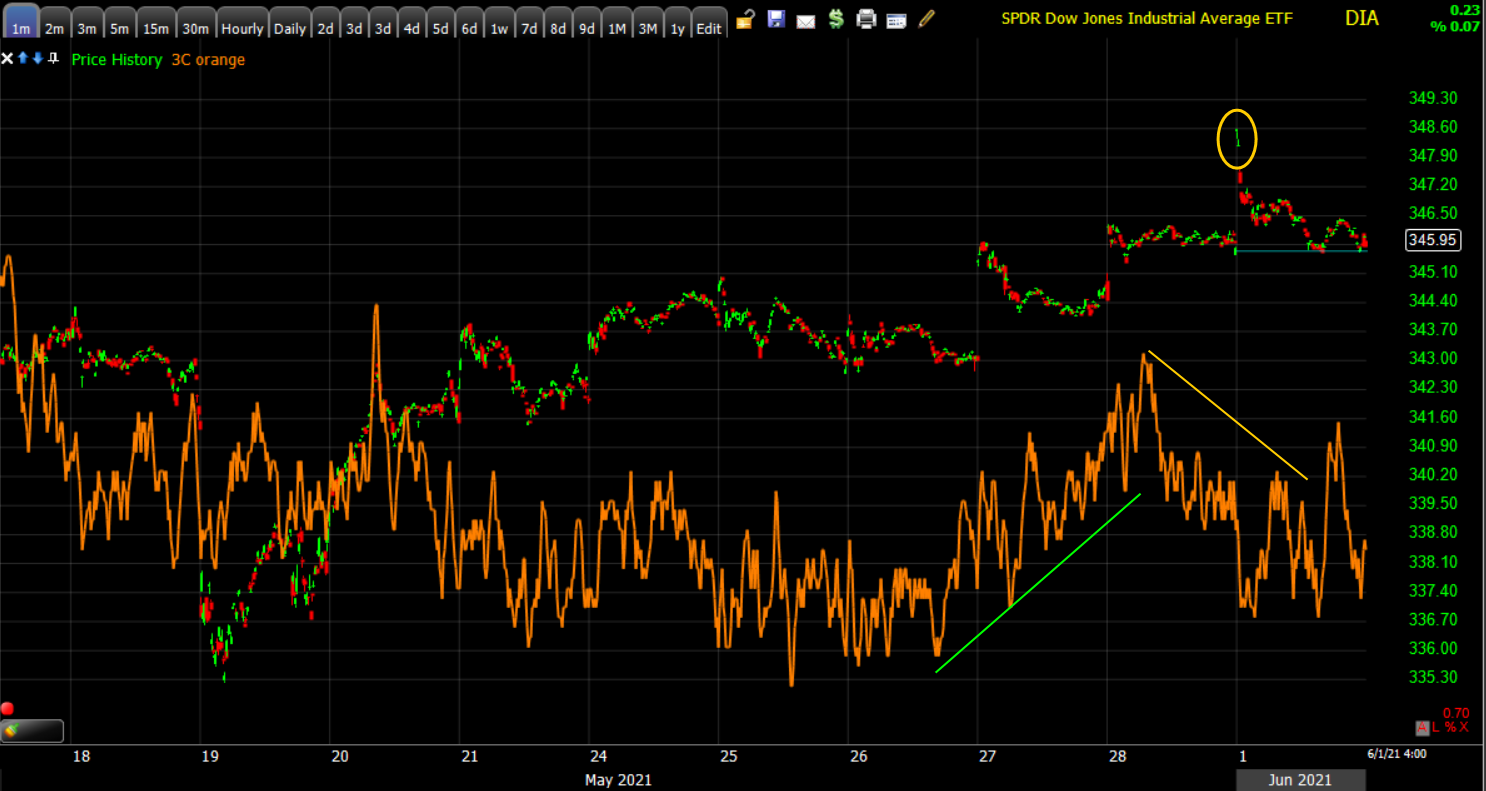 DIA’s (1m) 3C chart showed some improvement around mid-week (green) which fit with expectations of filling the May 11th gap, but 3C did not confirm the early opening gains (yellow), which fit with the expectation that there wasn’t much more upside after the gap was filled. Overall DIA’s 3C chart isn’t too different than SPY’s.
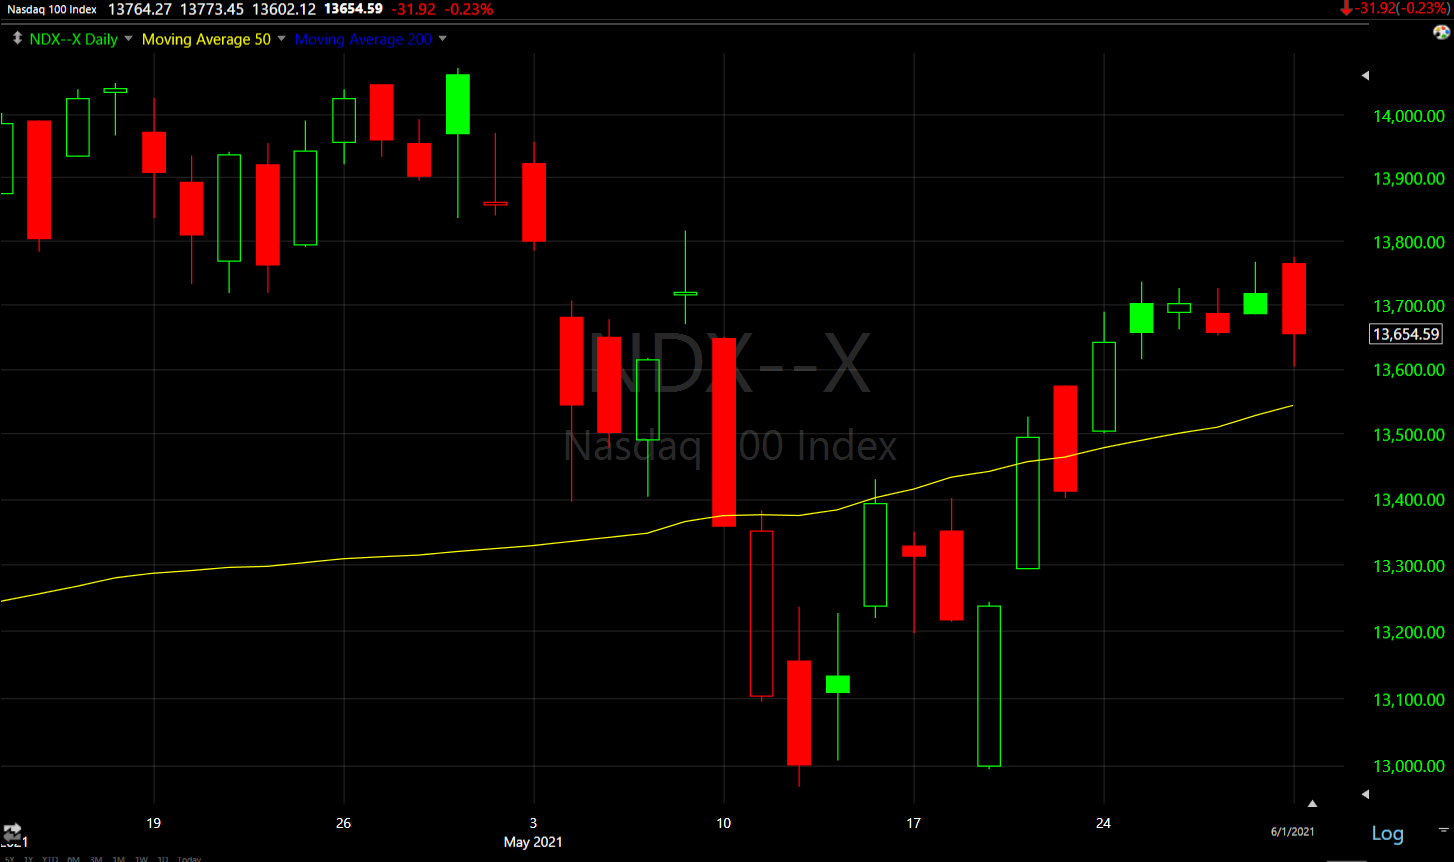 NASDAQ-100 (daily) bearishly engulfed Friday’s candle.
NASDAQ-100 was caught once again at the same area of resistance as last week.
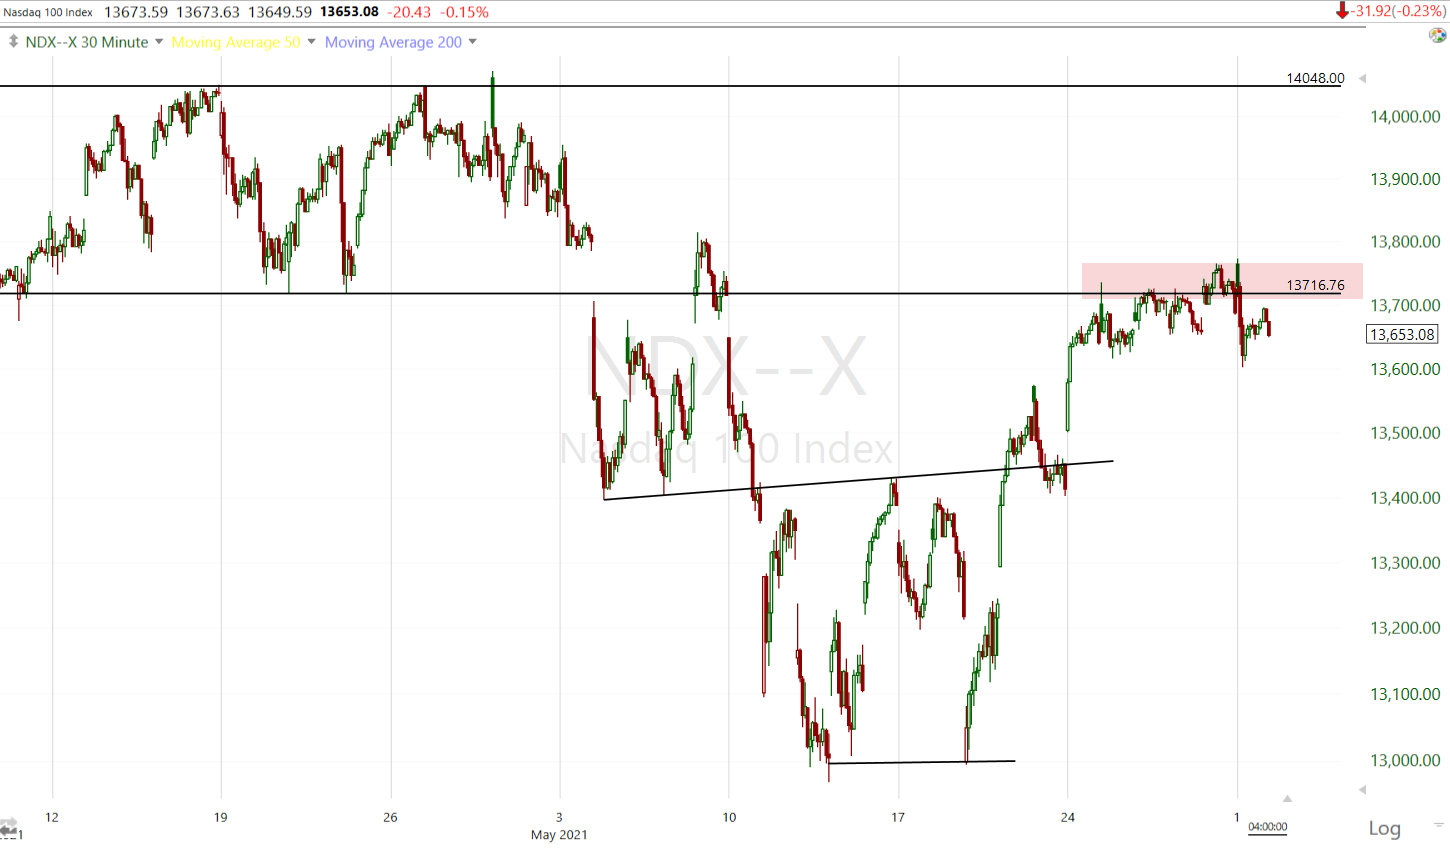 NASDAQ-100 (30m)
And is similar to the S&P in that it too posted a small head fake or failed breakout above last week’s narrowing triangle consolidation.
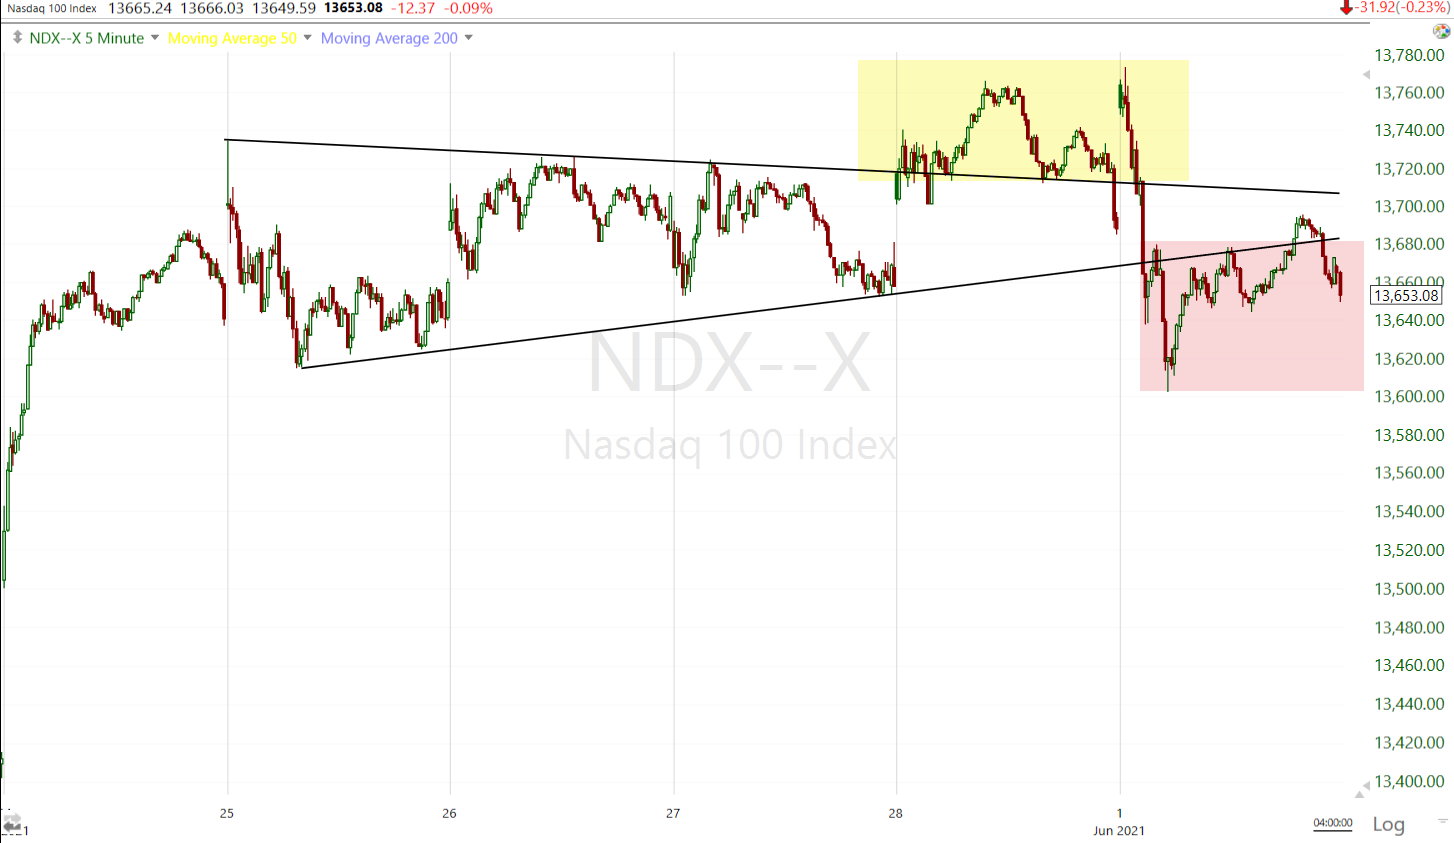 NASDAQ-100 (5m)
NASDAQ’s/QQQ’s 3C chart saw the most obvious 3C deterioration at the end of last week…
 QQQ (1m) with 3C breaking below its own consolidation range and leading lower.
Small Caps’ recent price action is among the best, largely due to the short covering among the most shorted stocks from last week.
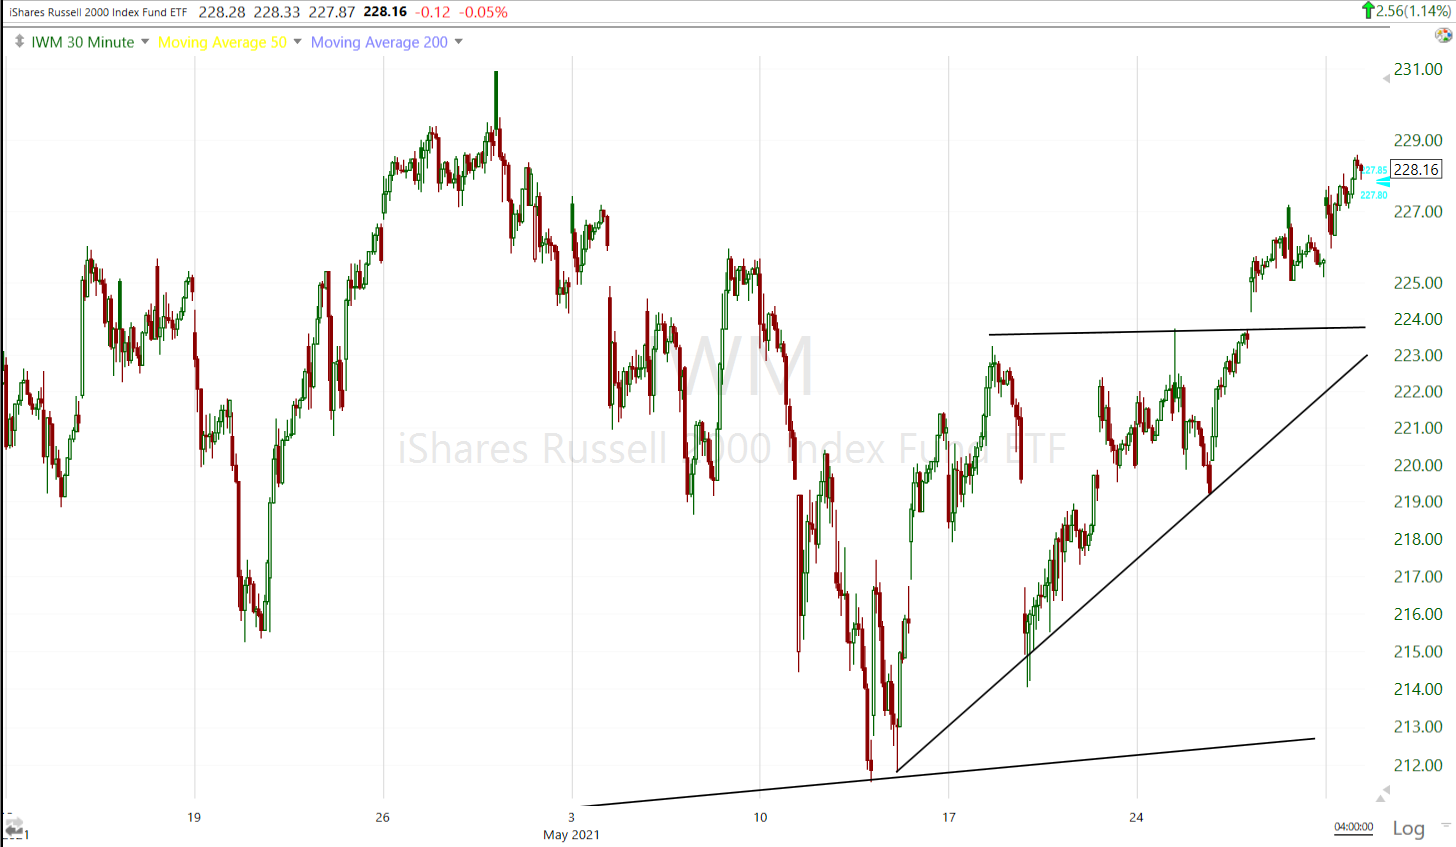 IWM (30m)
However, from a wider perspective, Small Caps are caught in a wide range (potentially H&S topping pattern) that has endured most of the year.
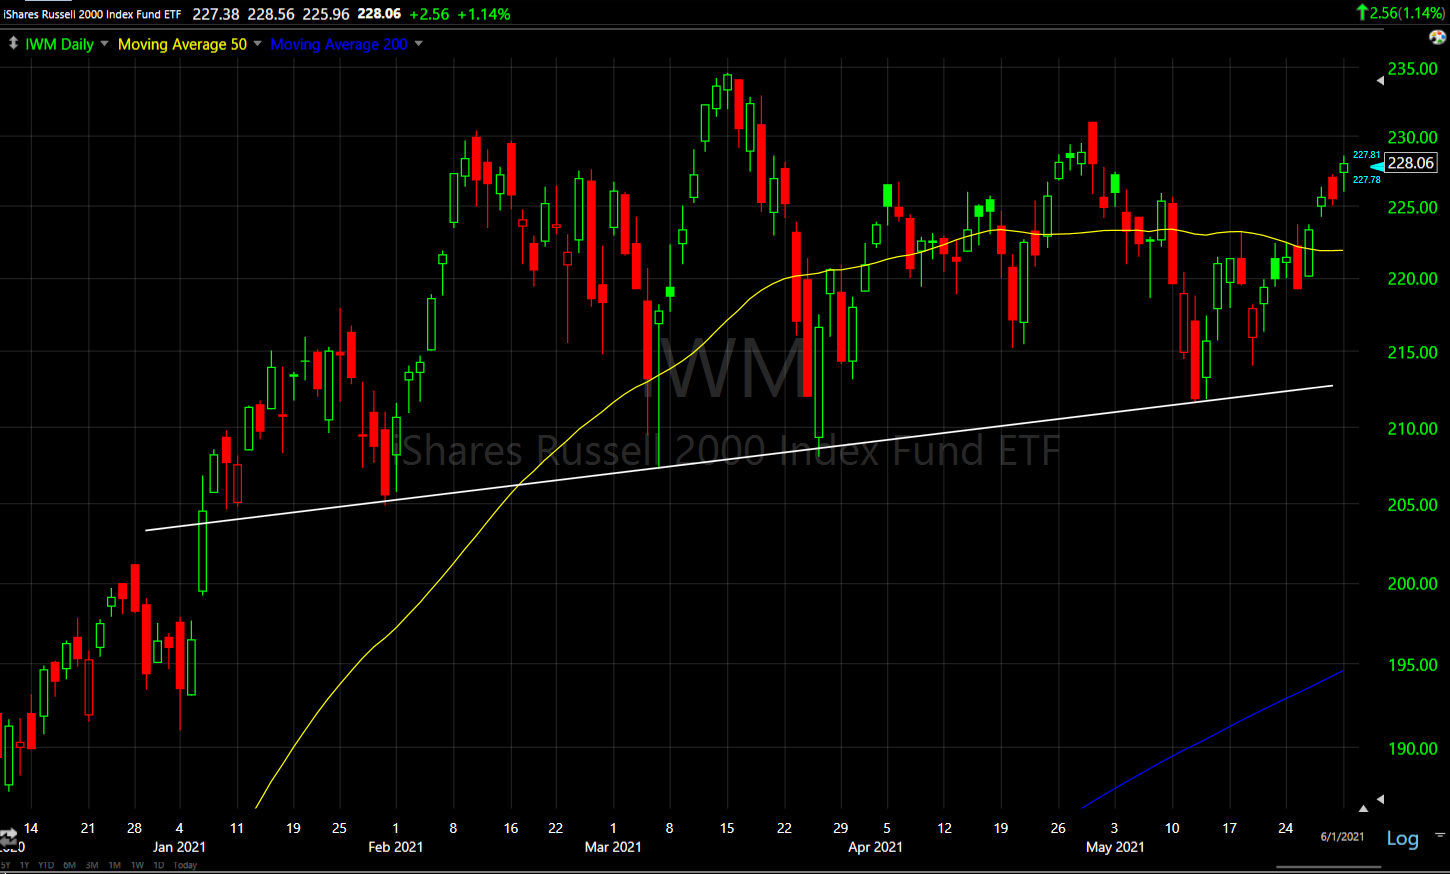 IWM (daily)
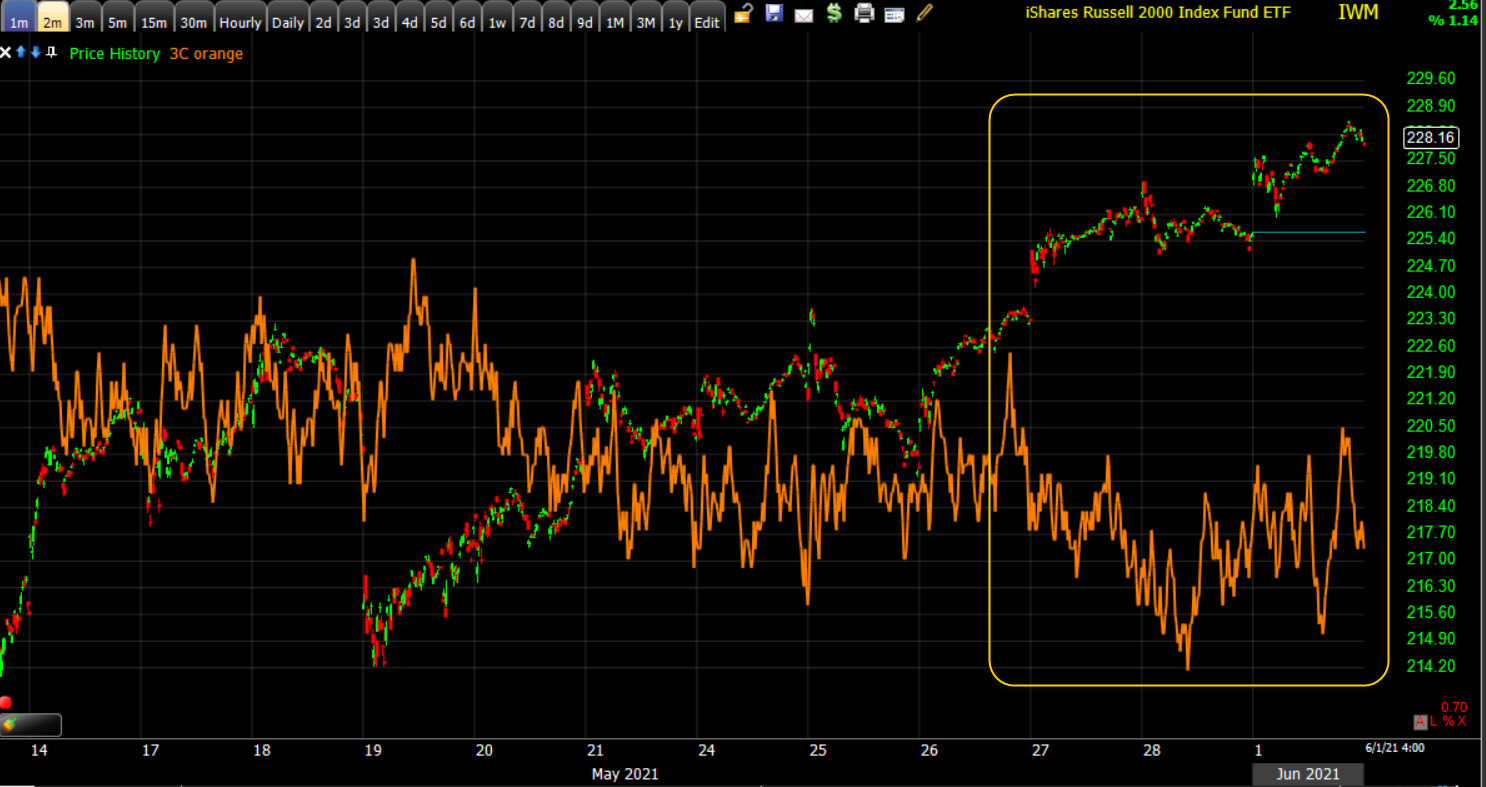 IWM’s (1m) 3C chart has not shown great confirmation above its 50-day as short covering activity drives price gains.
3C’s intermediate term charts have been deteriorating fairly steadily since at least April…
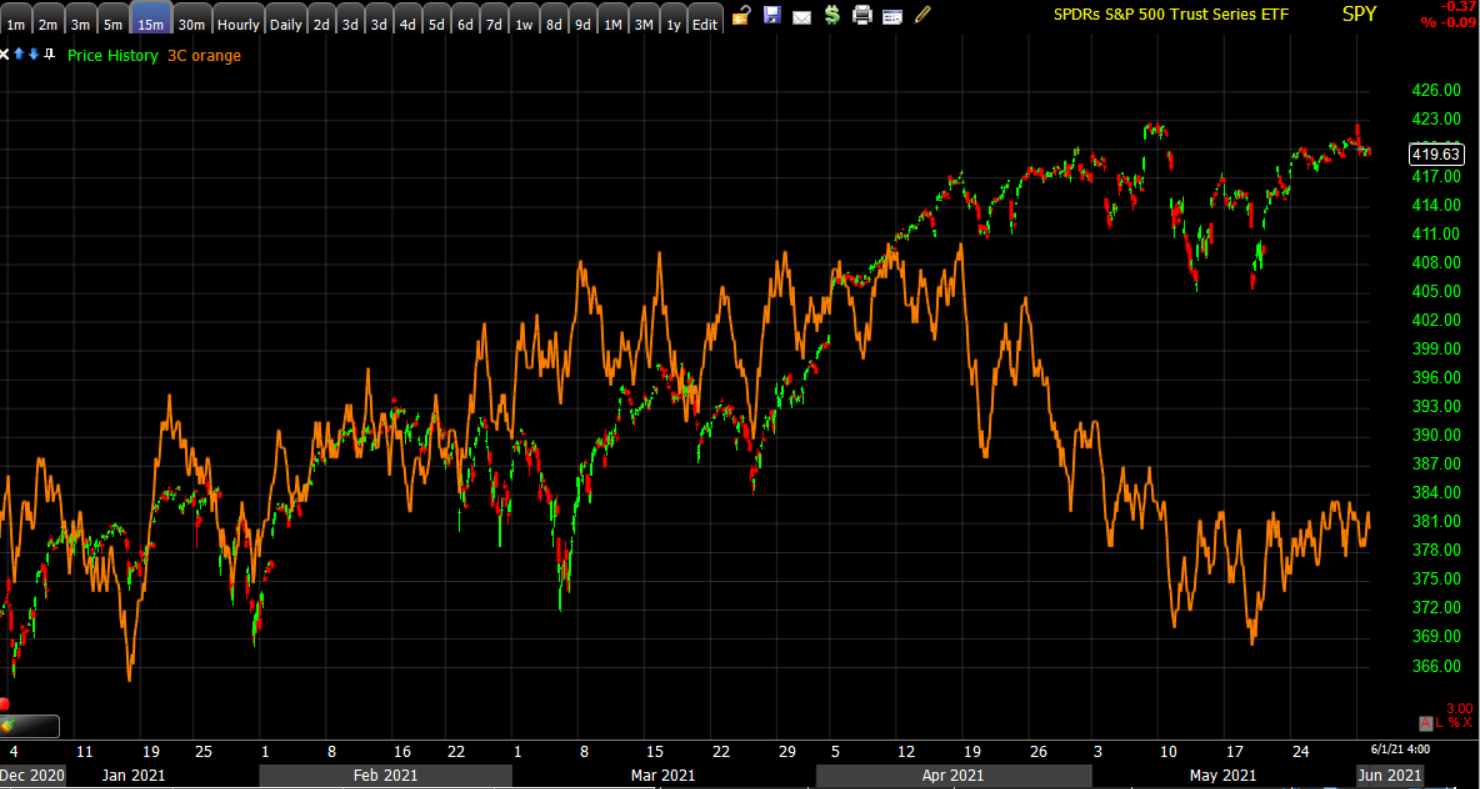 SPY (15m)
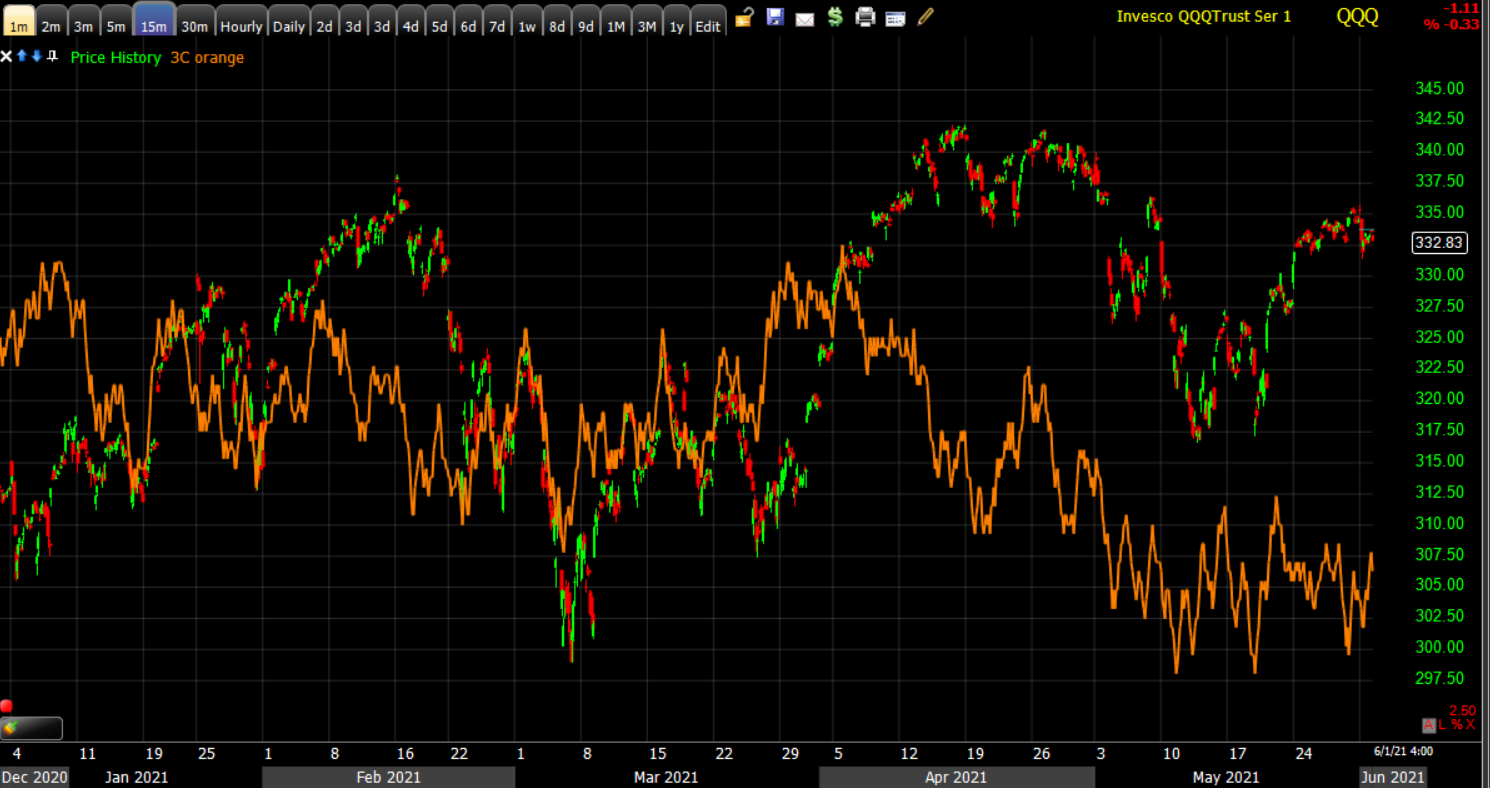 QQQ (15m)
S&P sectors
S&P sectors were mixed with 6 of 11 higher with a clear cyclical bias. The Energy sector stood atop the sector leaderboard with a near 4% gain supported by higher oil prices (+2.2%) and a decision from OPEC+ to gradually ease current supply cuts.
The defensively oriented Health Care sector underperformed with a 1.6% decline, pressured by weakness in Abbott Labs (ABT -9.3%), which dropped 9% after lowering its FY21 guidance due to a rapid decline in COVID-19 testing demand. The Technology sector exerted influential weakness as long term bond yields rose.
Materials ⇧ 1.40 %
Energy ⇧ 3.85 %
Financials ⇧ 0.61 %
Industrial ⇧ 0.39 %
Technology ⇩ -0.49 %
Consumer Staples ⇩ -0.34 %
Utilities ⇩ -0.61 %
Health Care ⇩ -1.64 %
Consumer Discretionary ⇩ -0.19 %
Real Estate ⇧ 1.71 %
Communications ⇧ 0.06 %
Earlier I mentioned that key influential sectors like Technology and Consumer Discretionary are struggling with overhead supply/resistance.
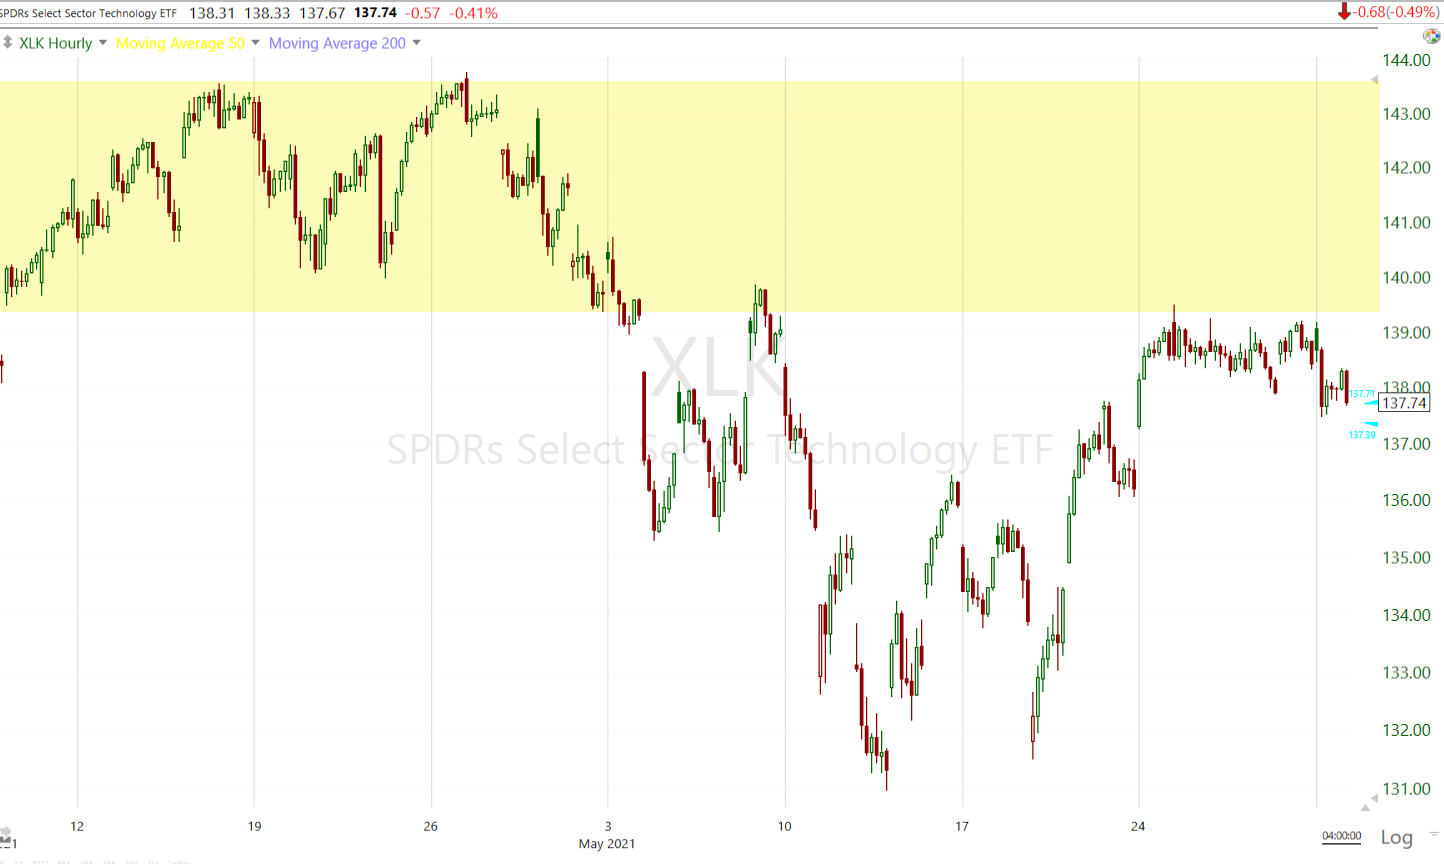 Technology sector (60m)
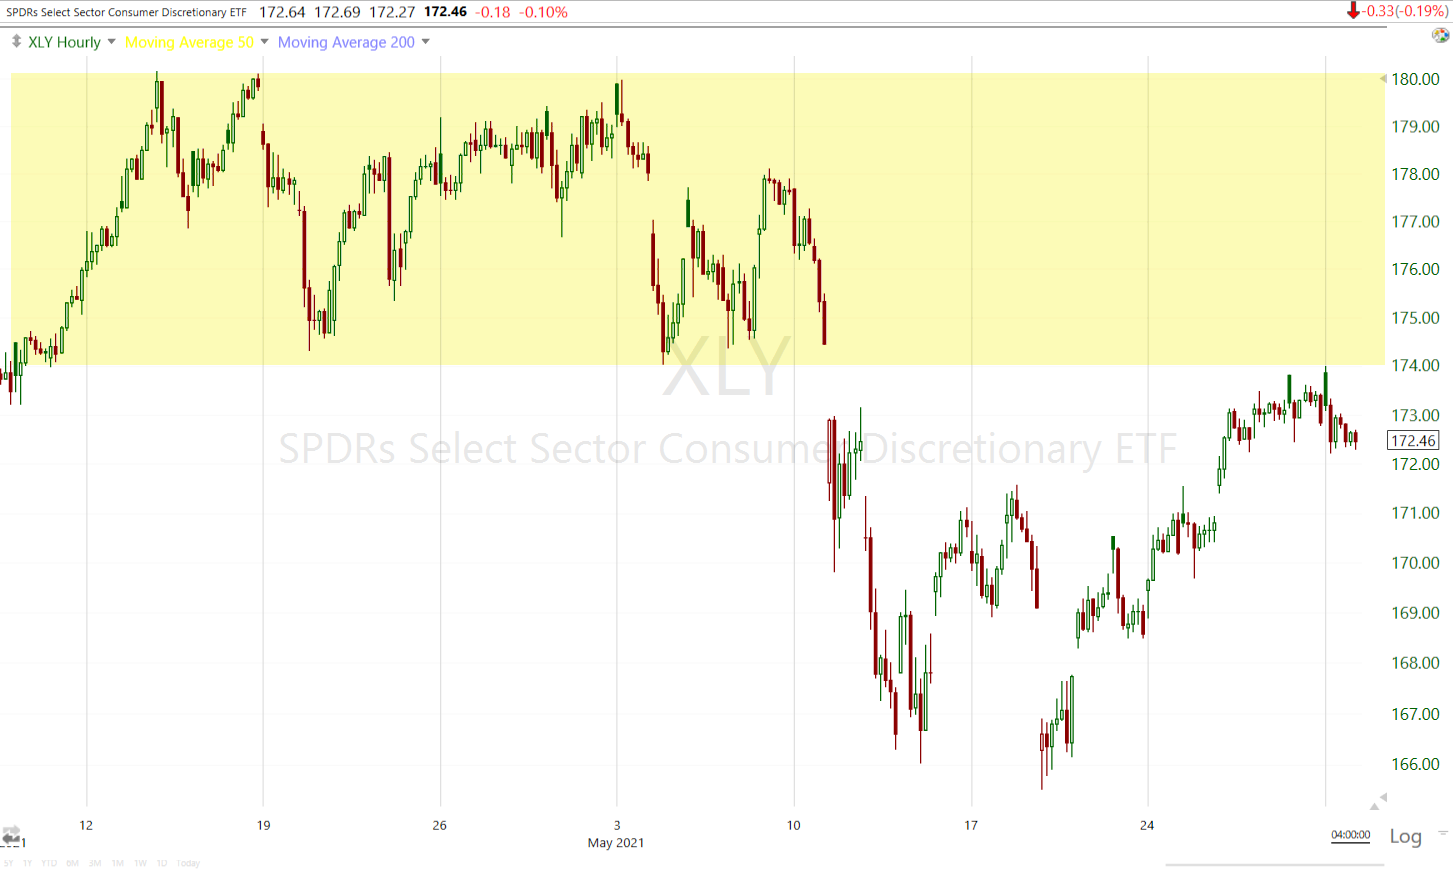 Consumer Discretionary sector (60m)
That leaves the less influentially weighted cyclical sectors to take up the slack as investors start to consider the prospects that economic growth – that drove gains in cyclical stocks – has peaked.
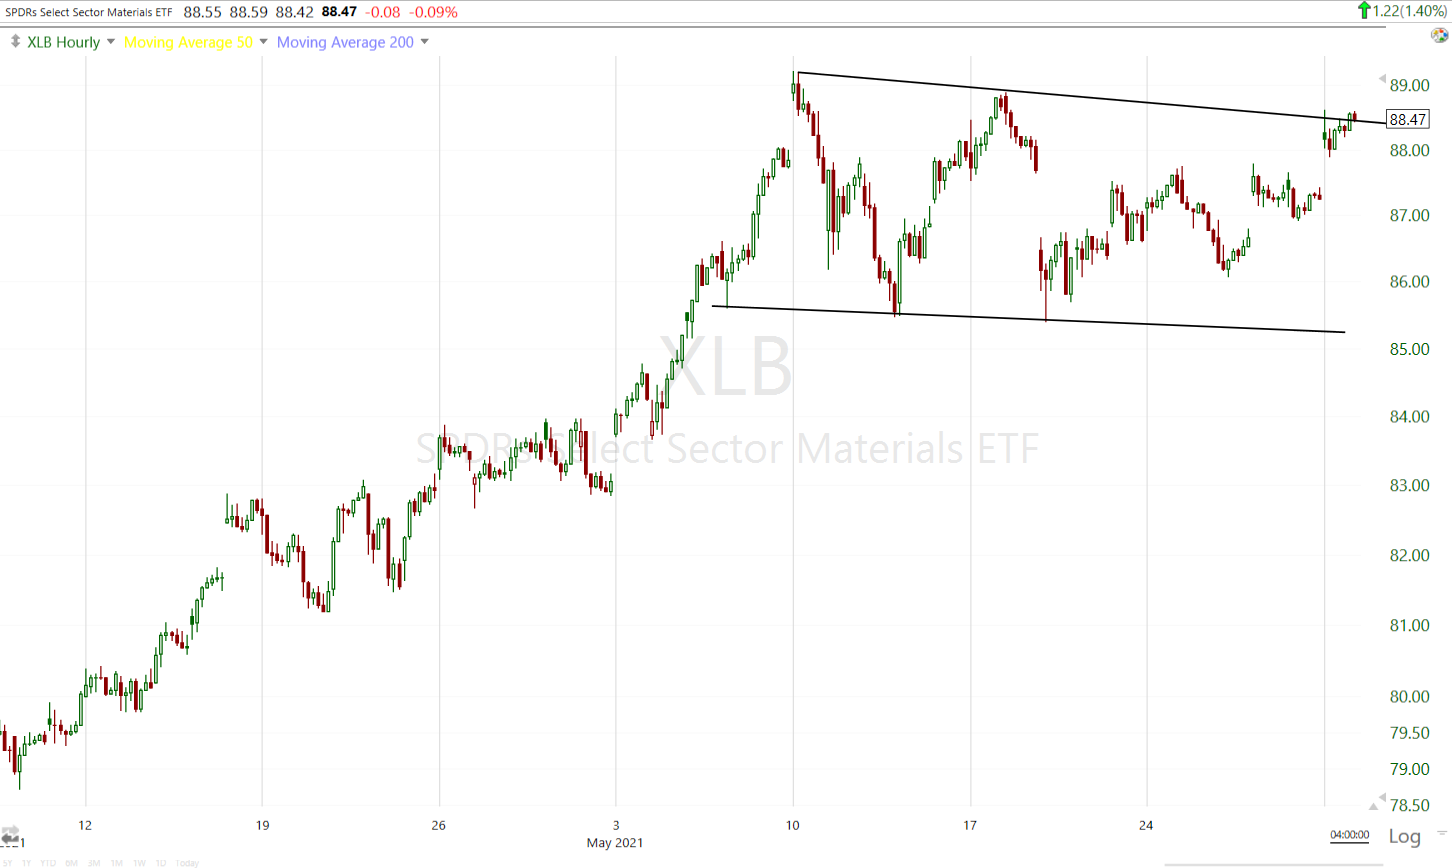 The lightly weighted Materials sector (60m)
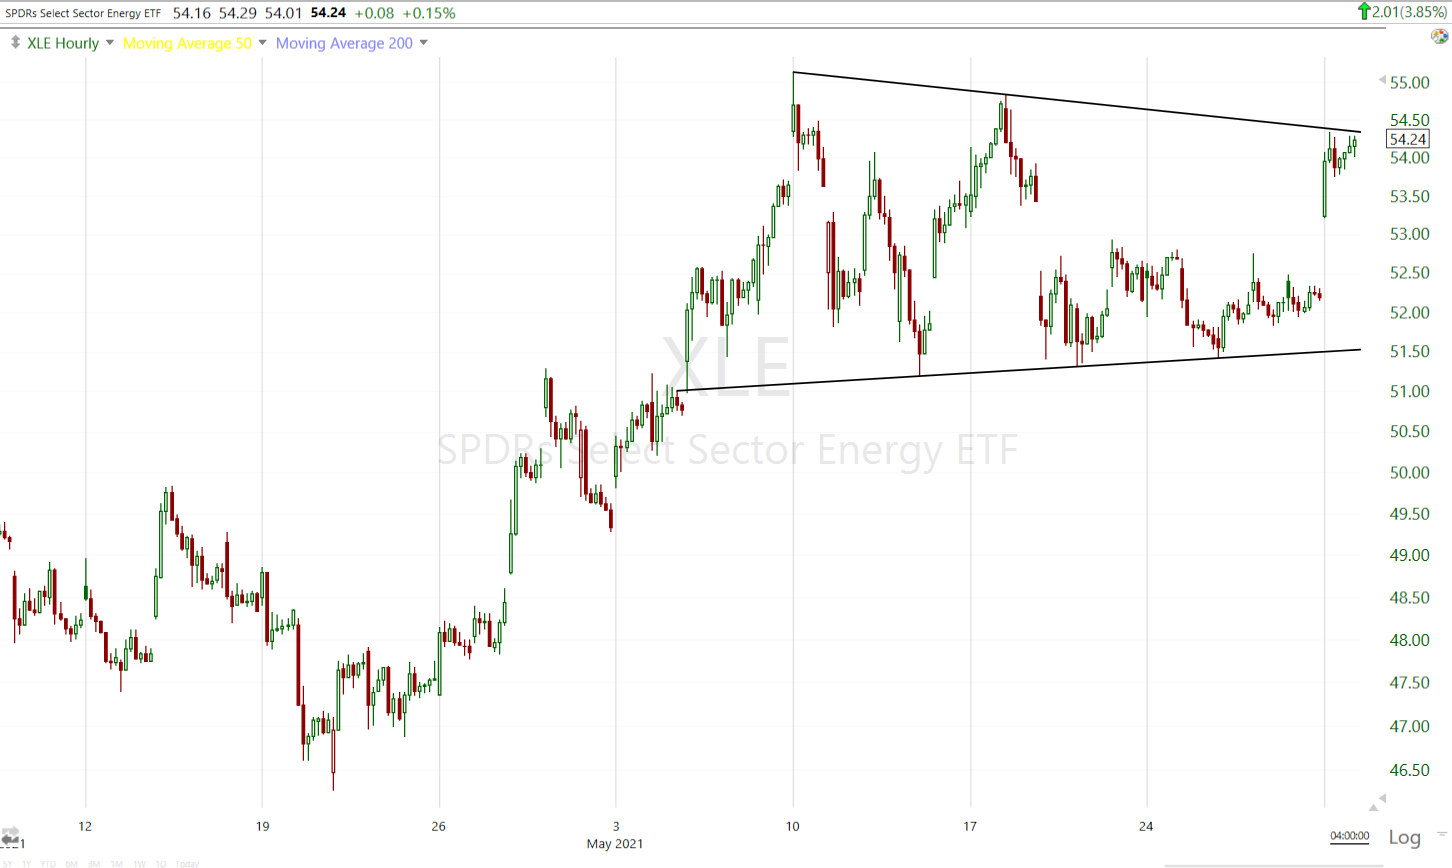 Energy sector (60m)
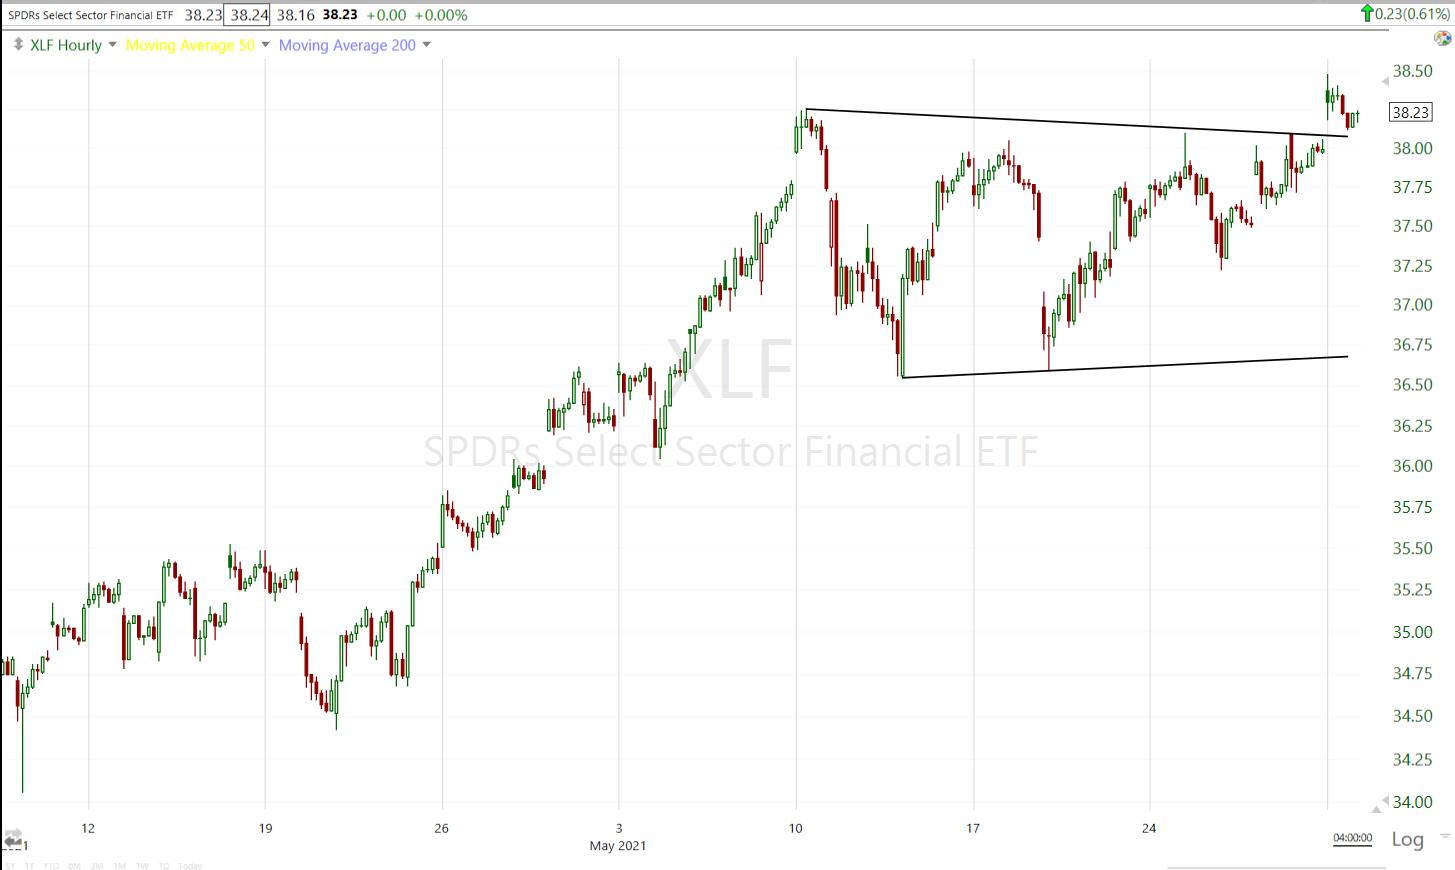 Financial sector (60m)
These cyclical sectors are on my radar as they are near the top of large consolidation ranges. The Financial sector is just above a large range and should be watched closely. If they aren’t able to really pull ahead and take up the slack for the more influential sectors like Technology, the market is going to have trouble ahead.
Internals
NYSE Advancers (2422) outpaced Decliners (924) by a 2-to-1 margin, reflecting small caps’ relative strength. Volume was on the heavy side at 1 bln shares likely owing to first of the month inflows.
Despite the heavier volume, there was no Dominant price/volume relationship and no 1-day overbought/oversold conditions.
 SP-500 (daily) and NYSE new 52 week lows. Two things stand out on this chart. The first is that new 52 week lows have risen during rallies (yellow arrows) over the last several months, that should never happen and it certainly shouldn’t be a trend. Second, new 52 week lows hit the highest today since the May 10th (orange) false breakout or S&P head fake that led to a modest, but fast downside reversal.
Treasuries
The 10-year yield increased three basis points to 1.62% and was as high as 1.64%, while the 2-year yield increased one basis point to 0.15%. The rise in long-term bond yields weighed on large-cap Tech and some defensive sectors.
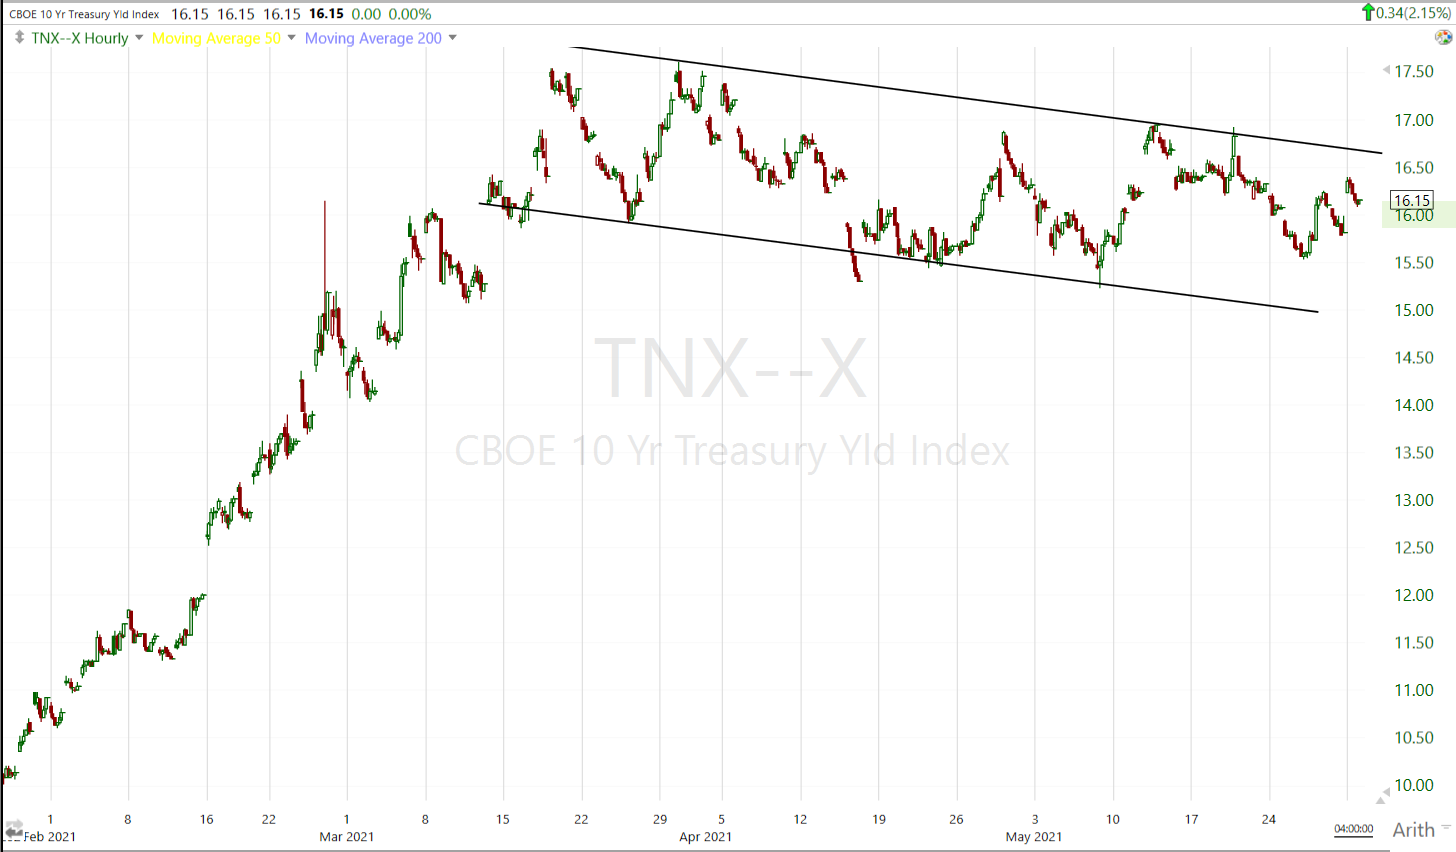
10-year yield (60m) back above 1.60%
Currencies and Commodities
The U.S. Dollar Index decreased -0.2% to 89.89.
The Turkish lira fell to another record low against the greenback after Turkey’s President Recep Tayyip Erdogan renewed calls for lower interest rates. The offshore yuan was little changed amid a push by the People’s Bank of China to temper its appreciation.
WTI Crude oil closed at its highest since October 2018, up +2.2% to $67.79/bbl. with the OPEC+ alliance forecasting a tightening global crude market and a nuclear deal with Iran still up in the air.
Gold futures settled less than a dollar lower or -0.02% to $1,905.00/oz, holding above the key $1900 psychological level.
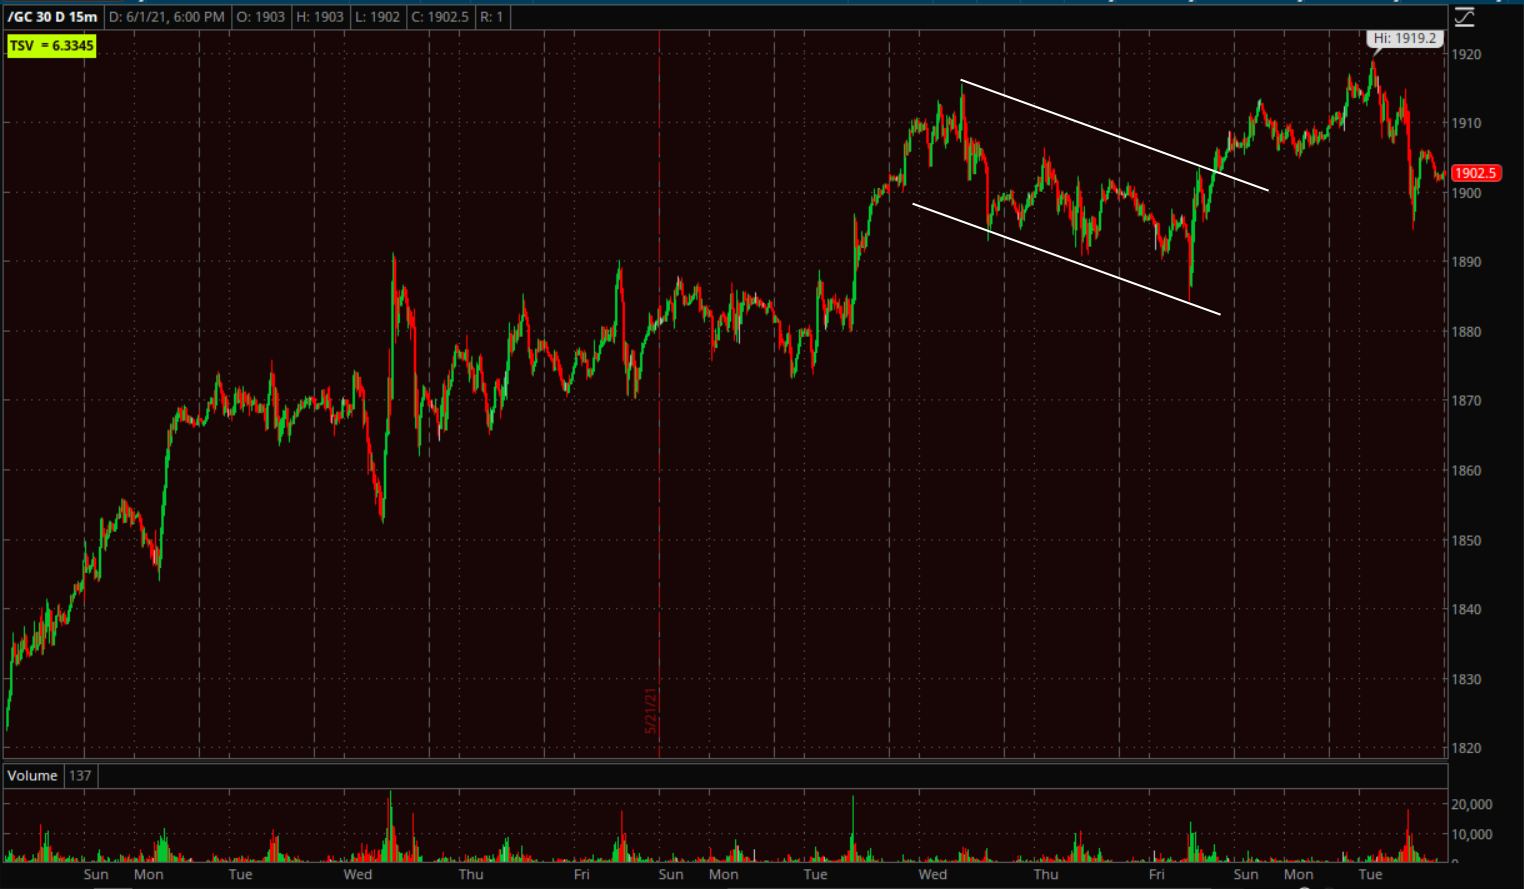 Gold futures (15m) ended last week with a bullish flag, but haven’t been able to follow through very impressively to the upside. This is not entirely surprising even as Gold’s price trend has been very constructive since the March low…
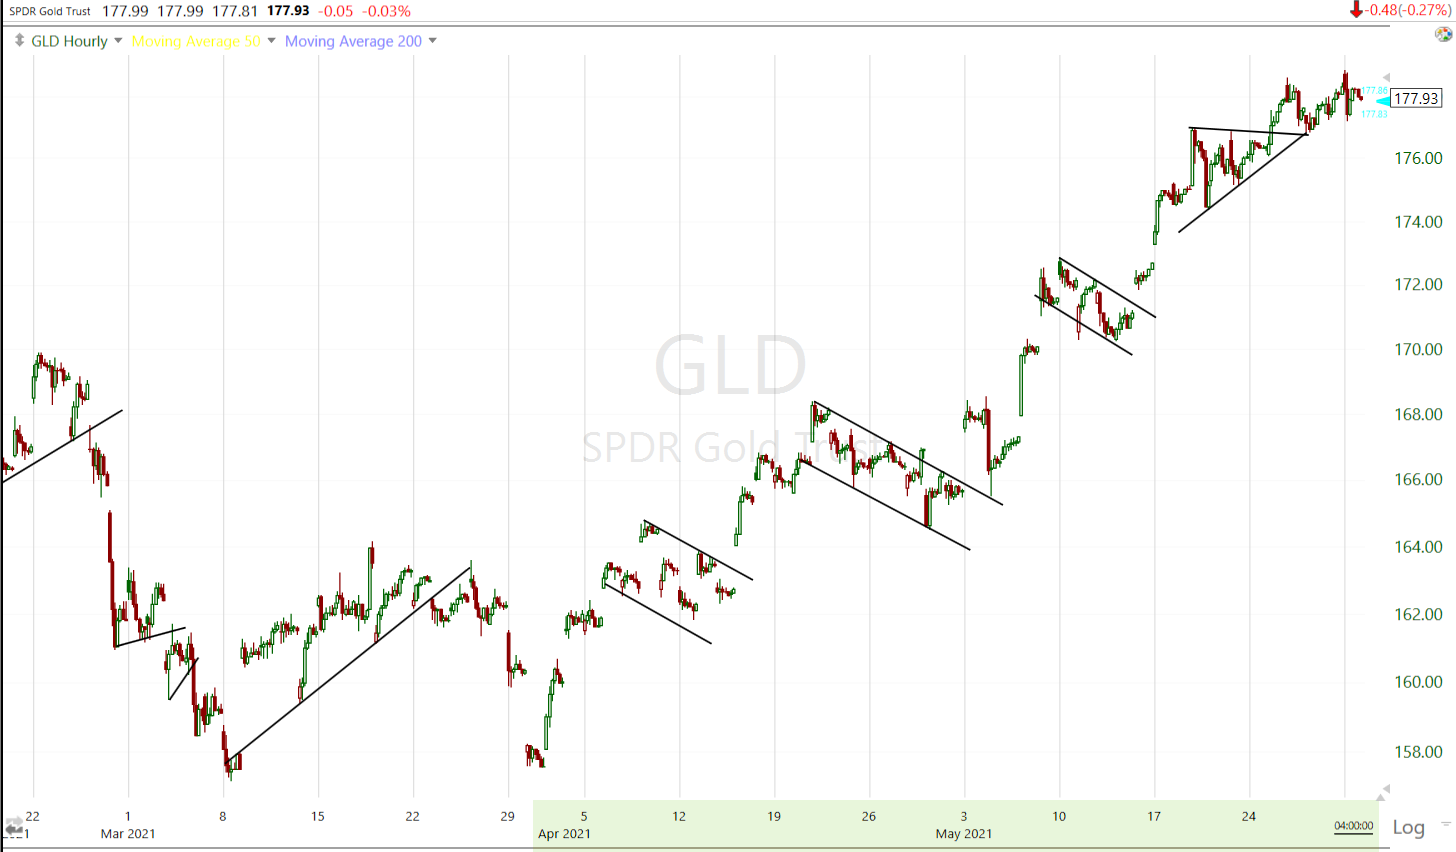 GLD (60m) with very constructive/bullish price action, however, price is near the area where I’ve expected price to encounter overhead supply/resistance.
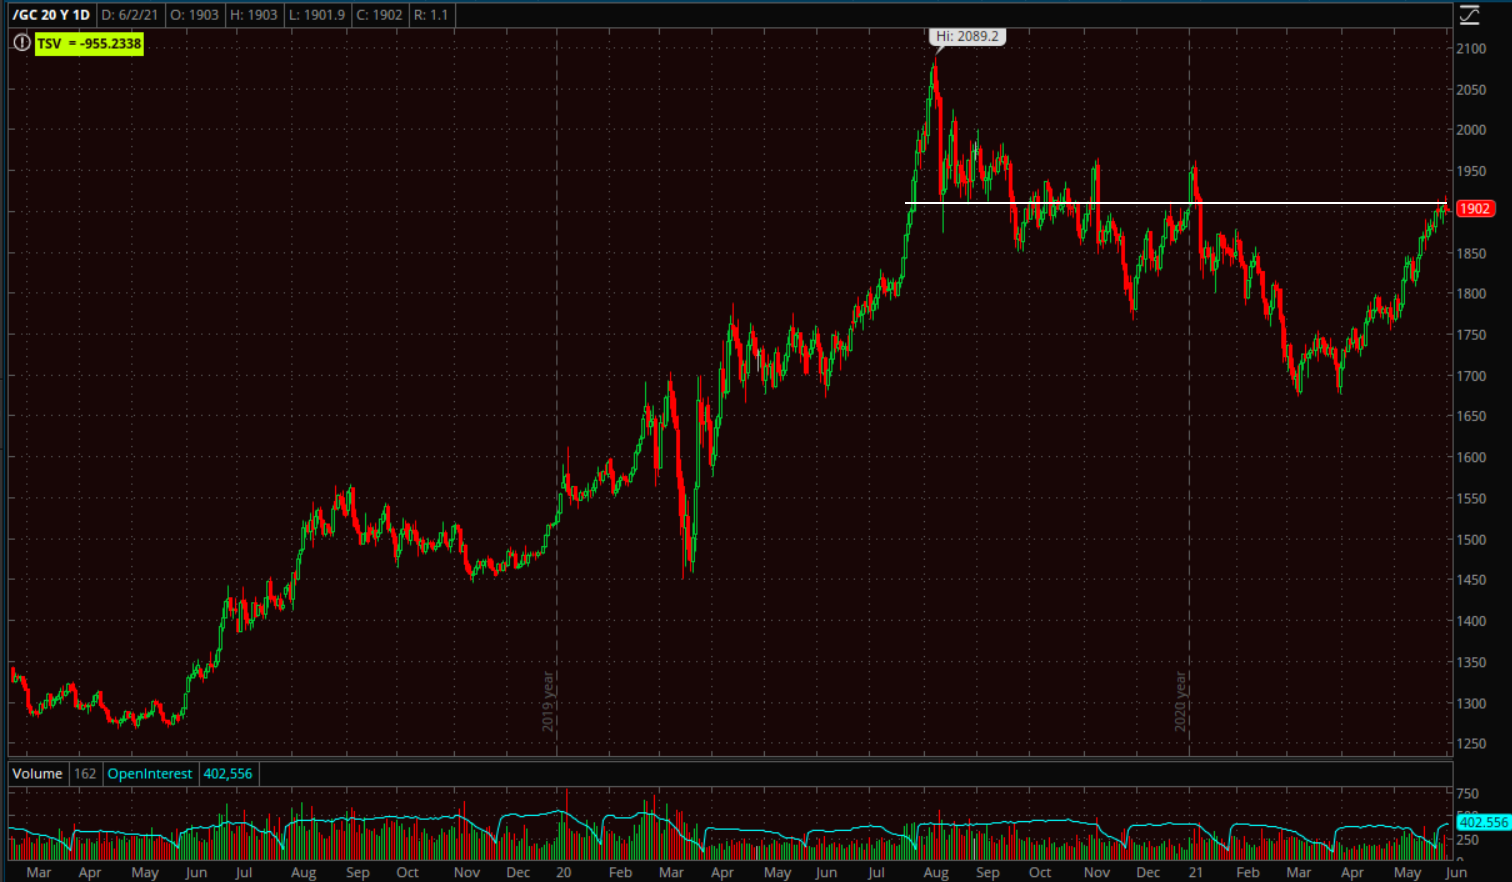 Gold futures (daily)
Cryptos gave back some of the extended holiday weekend gains, but managed a green close.
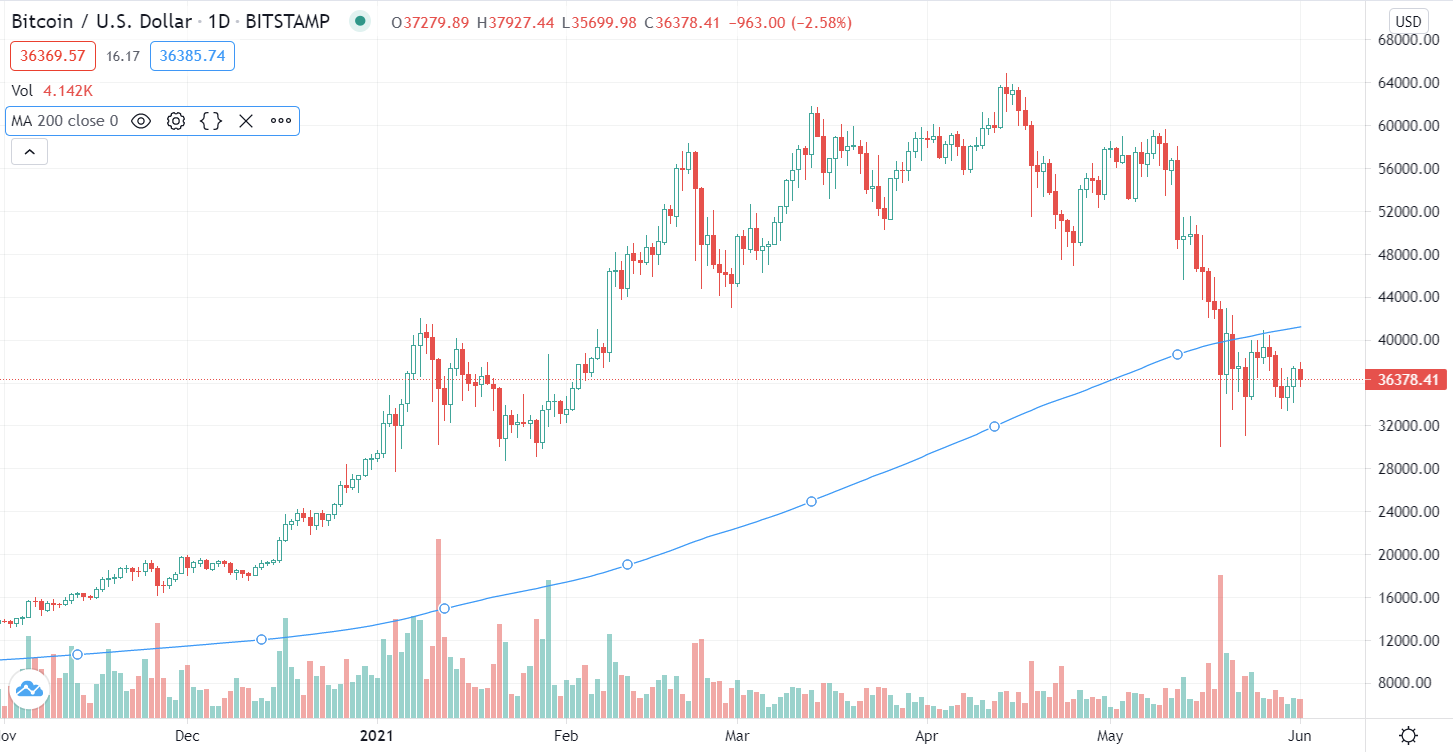 BTC/USD (daily) the price action remains off May’s lows, but consolidating below the 200-day sma.
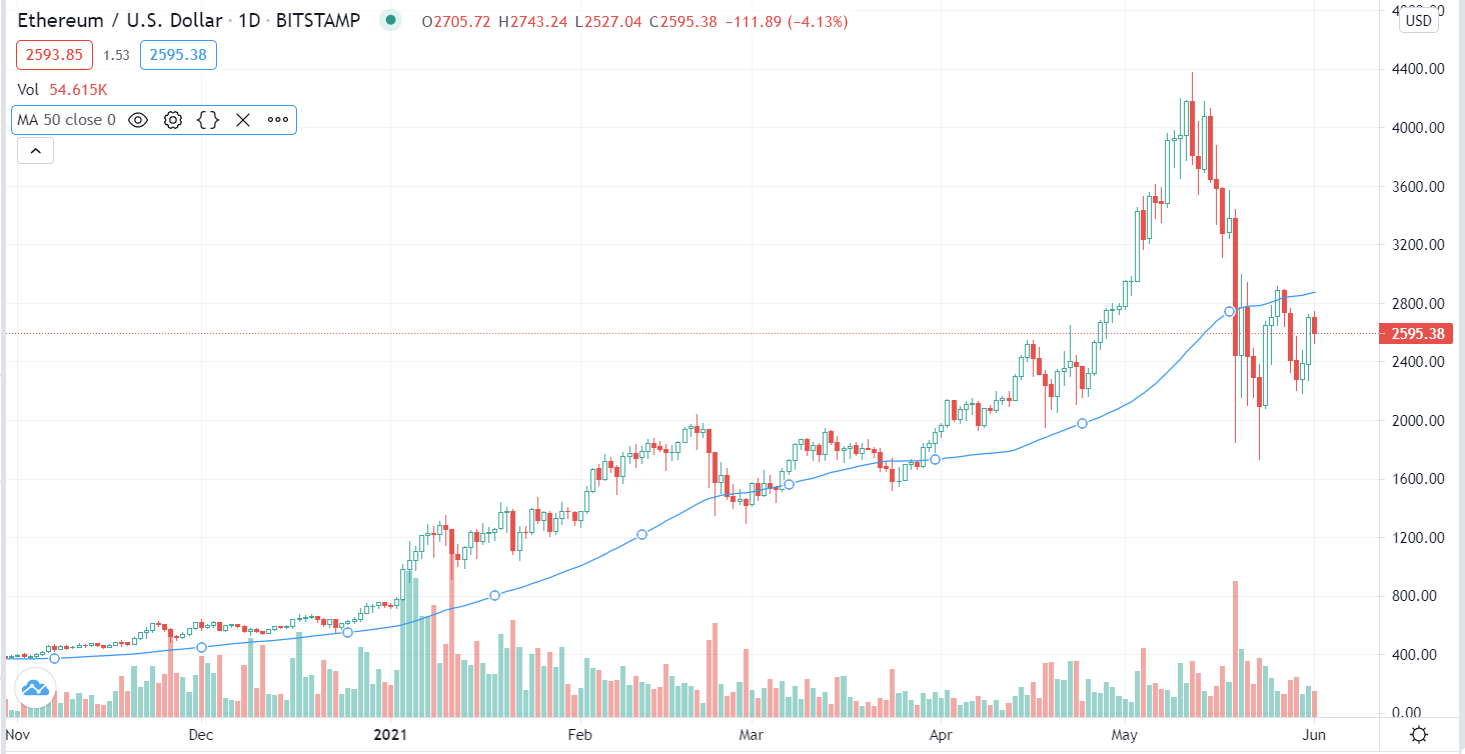 ETH/USD (daily) still looks better to me than Bitcoin, but is similarly consolidating below its 50-day sma.
Summary
Recent economic data has reflected two themes. One has been the reopening economic growth that has sparked concerns over inflation and Fed tapering of bond purchases. A more recent theme has been that of peak-economic growth. Investors seem to be torn between what they see as two competing narratives and I suspect that has been behind the market’s range-bound price action. The market seems to see these two themes as mutually exclusive, but there’s another, perhaps more ominous take-away and that is stagflation (stagnating economic growth amid inflationary conditions).
For instance, today’s U.S. manufacturing data topped estimates, but also signaled supply shortages and labor constraints, which fits well into a recent trend of economic data.
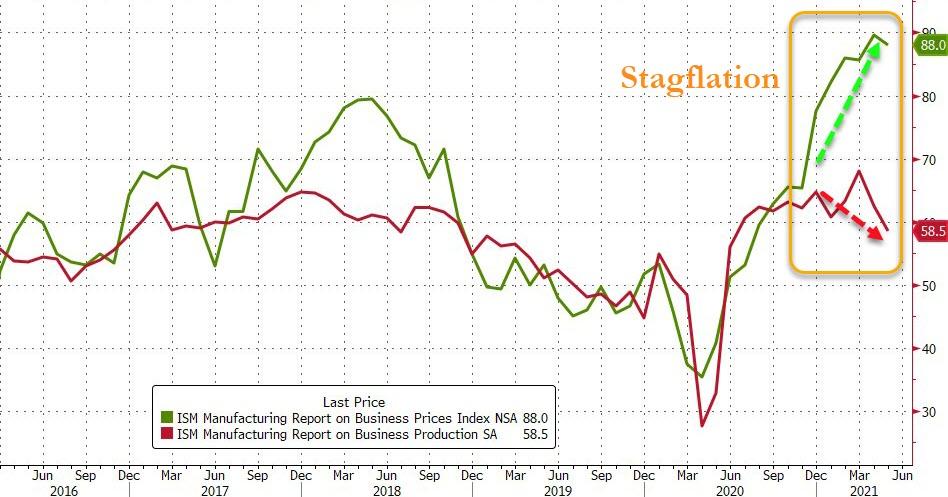
Source: Bloomberg
The inflation concerns are reflected in overhead supply/resistance in sectors like Technology. I believe the large consolidation ranges in the cyclical sectors are reflecting the uncertainty surrounding the peak-growth narrative. I’d expect stagflation to result in weakness in both the influential secular growth names in Tech, and the cyclical sectors so their charts bear watching.
Finally there’s one other development along the same lines as VIX’s unusual early relative strength and volatility’s flattening term structure. On Friday, hedging tail risk hit the highest level since just before the 2018 market crash.
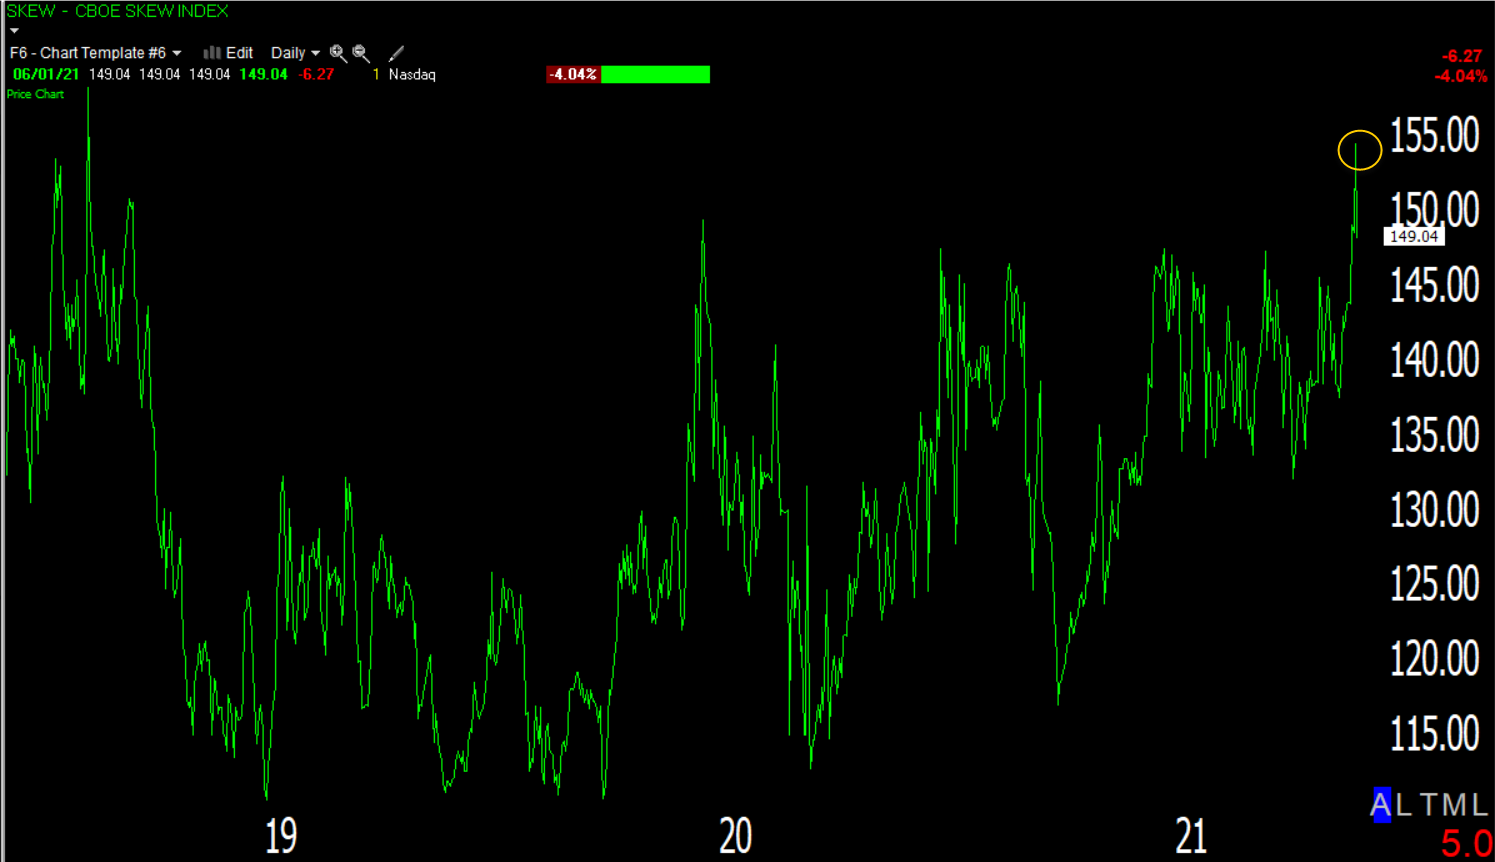 CBOE SKEW Index (daily), sometimes referred to as, “The Black Swan Index” surging above 150 on Friday. SKEW surged above 150 (an extremely high level historically indicating increased hedging of tail risk) in December ahead of the 2020 COVID crash as well. Perhaps smart money is recognizing the risk of stagflation.
Overnight
S&P futures are down -0.1% just under $4200 ($4195). Not surprisingly with $4200 in the area, 3C is pretty close to in-line with prices heading into the overnight session.
Gold futures are down -0.2% holding at $1900.
Looking ahead, investors will receive the weekly MBA Mortgage Applications Index and the Fed’s Beige Book for June on Wednesday. Philadelphia Fed President Patrick Harker, Chicago Fed President Charles Evans, Atlanta Fed President Raphael Bostic and Dallas Fed President Robert Kaplan speak Wednesday.
The key data point this week is the U.S. payrolls data for May on Friday.