Daily Market Wrap- February 18, 2020
Apple (AAPL -1.8%) made good use of the U.S. holiday to declare a revenue warning due to the coronavirus, after blowing off risks in its earnings outlook just 3 weeks ago. Apple specifically said it doesn’t expect to meet its revenue guidance for the March quarter due to the coronavirus restraining its supply chain and impacting consumer demand in China.
The S&P fell as much as -0.7% today before bouncing after the Technology sector tested down and found support at its up trend.
Monday was Apple’s second cut to their outlook in just over a year. However, the stock held up fairly well considering and the NASDAQ 100 closed up on the day setting a new record high, albeit by a marginal 5 basis points. Equity bulls think that stocks, back-stopped by the Fed, are immune to risk. Lets take a look at what happened the last time Apple cut guidance…
 AAPL (daily) – The stock dropped almost -10% in early January after downgrading the outlook, then it more than doubled over the next year.
There are a few key differences between now and then…
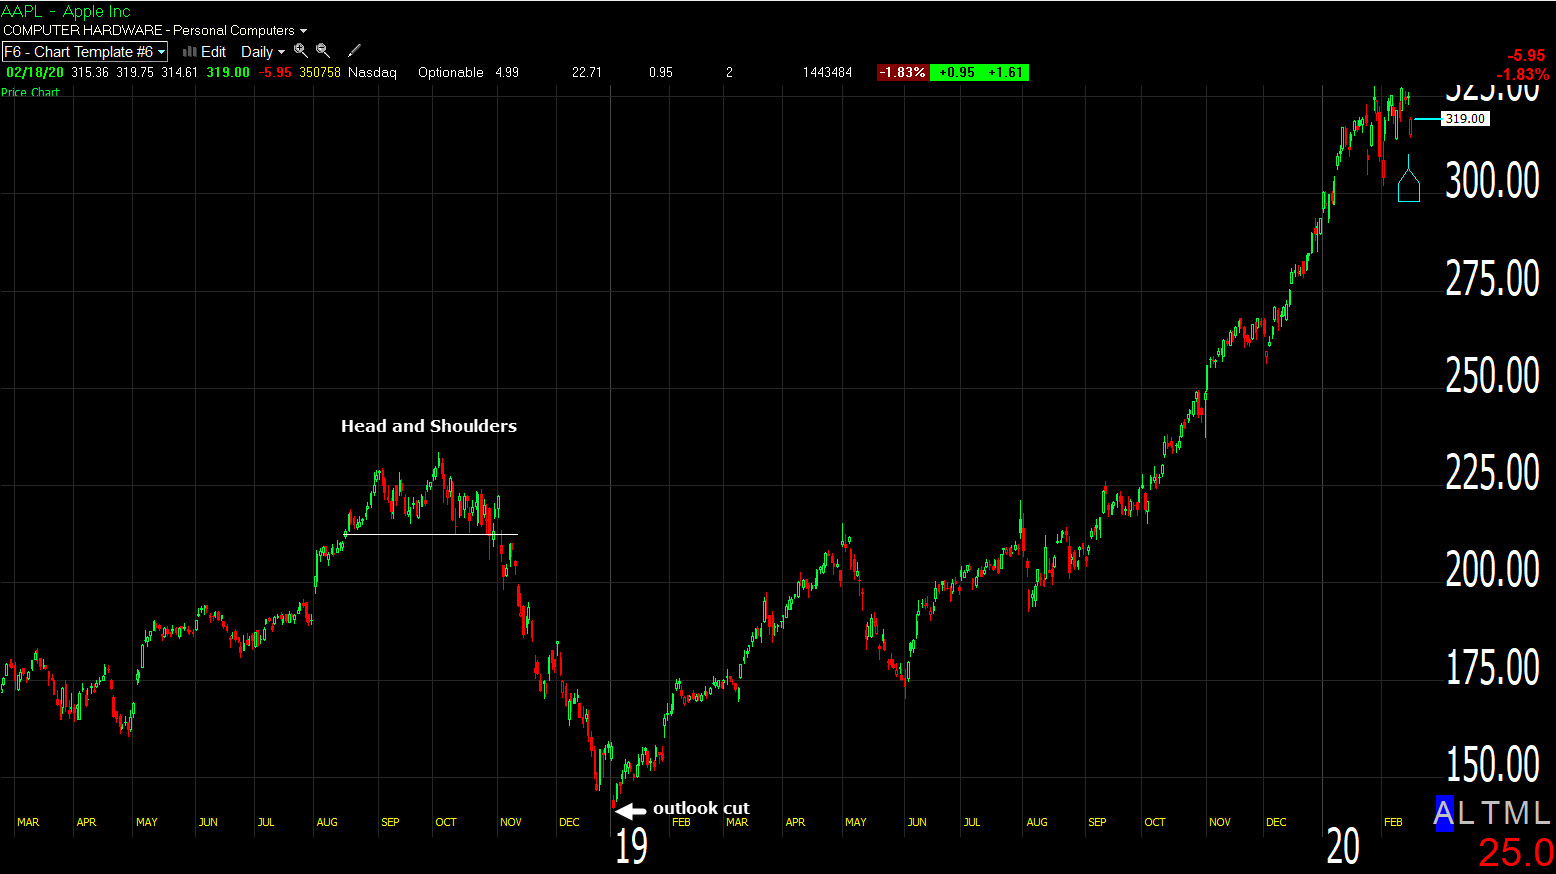
- Apple was one of the last stocks to drop in the October-December 2018 market decline in which the S&P lost -20%. Apple seemed immune to the market sell-off in October of 2018, but you may recall it was trading in a Head and Shoulders top. Apple’s decline didn’t start until a month later in November, then it really sold off, blowing through the H&S top’s downside target by an additional -30%.
- When Apple cut their outlook on January 3rd 2019, the stock had already fallen more than 37%.
- The Federal Reserve, or at least Jay Powell, did a 180 degree policy u-turn the very next day on January 4th and went from a tightening/rate hiking cycle with the last rate hike just to weeks earlier, to pause or on hold, and subsequently cut rates 3 times, tapered their balance sheet roll-off, then stopped it completely, then started “Not QE 4” and expanded the balance sheet by more than $400 bn dollars.
In essence, Apple is in the exact opposite situation it was in early January 2019. Instead of being at the end of a decline of more than 35% in a bear market environment in which investors couldn’t imagine the end of the sell-off, Apple has more than doubled in an ecstatic bull market in which investor’s can’t imagine a decline or any market risk.
Instead of the Fed going from very restrictive to easy policy, the Fed is as easy as it has been in a decade and is starting to tighten up, at least in terms of tapering repo operations. This week is the second taper of $5 bn.
I’ve posted Apple’s chart about a half dozen times the last month or so noting the clear change in character.
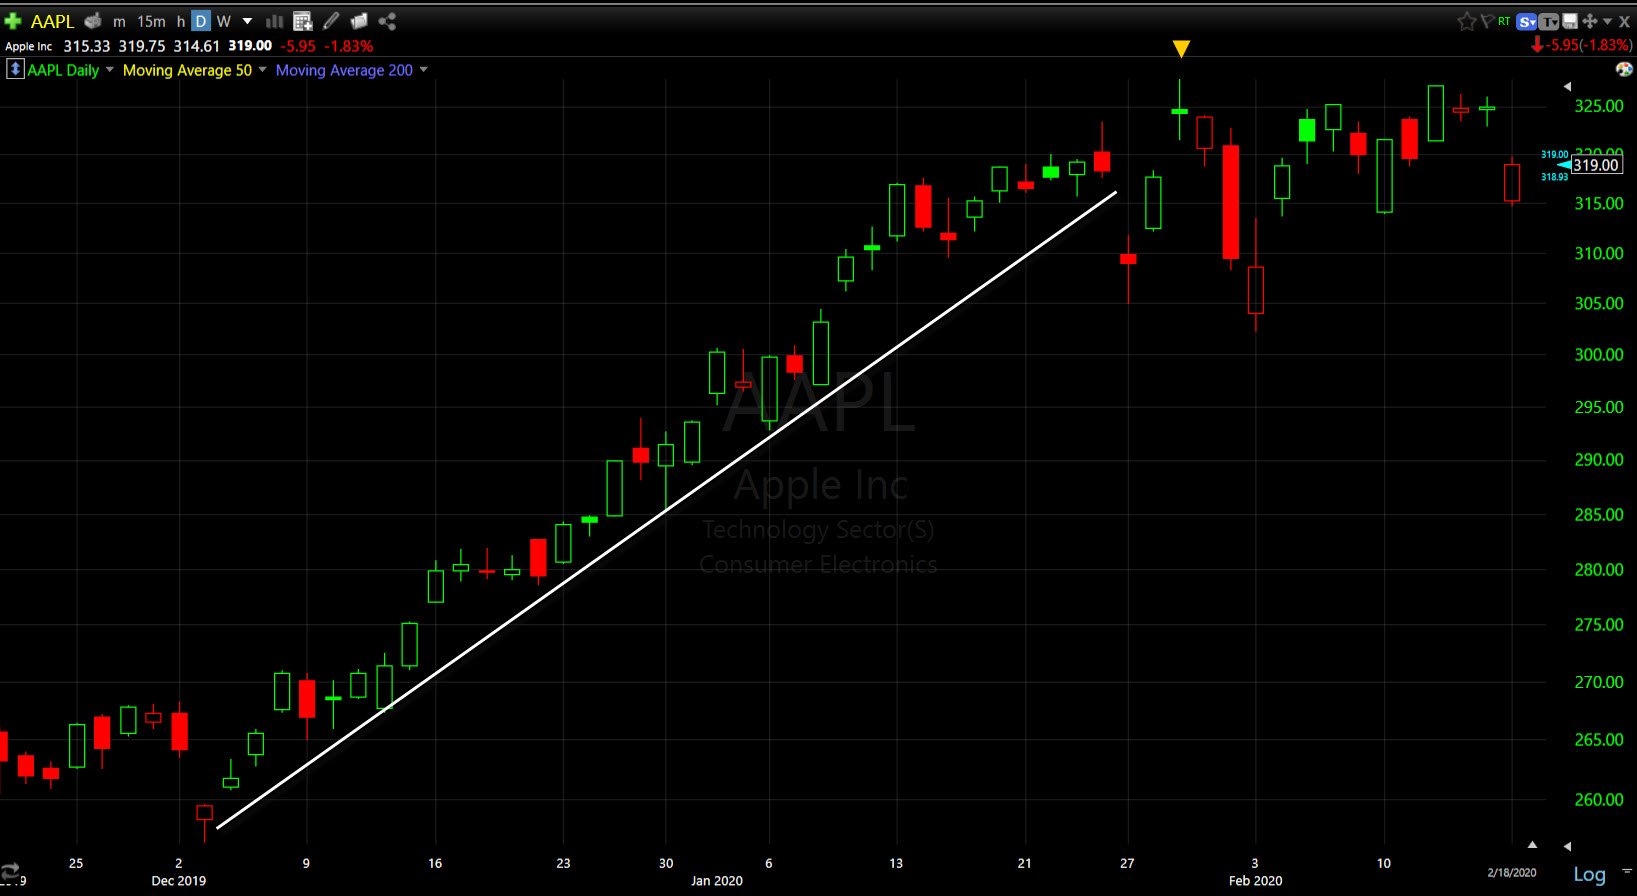
AAPL (daily) has gone from a strong, clean up trend, to a choppy, volatile range ever since January 29th.
Apple’s advance mirrors that of the Fed’s balance sheet expansion…
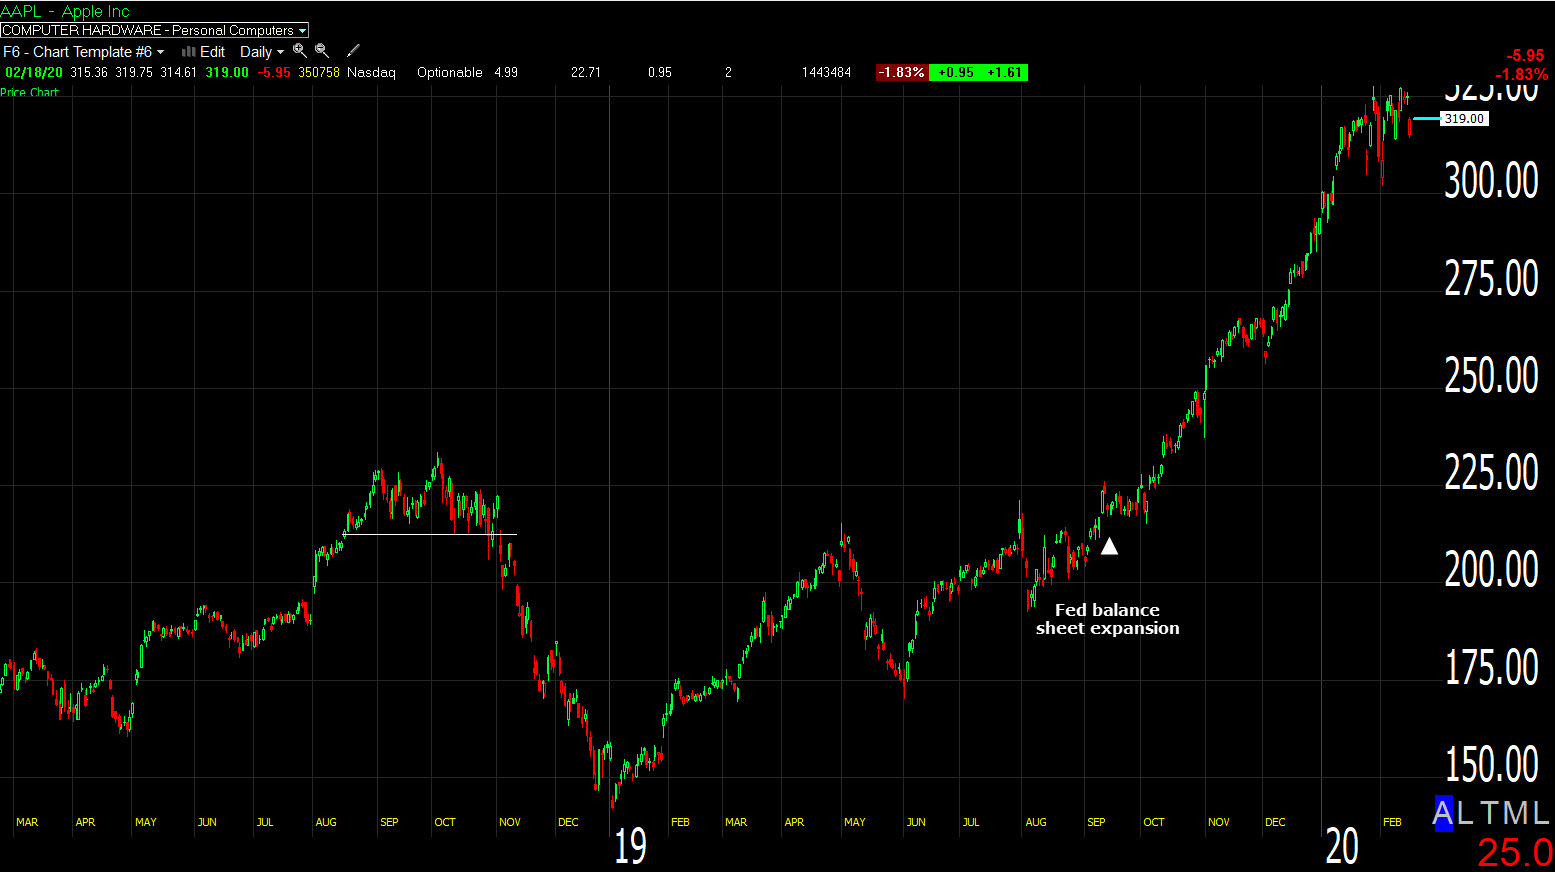 AAPL (daily) Fed starts expanding balance sheet in mid-September due to the Repo crisis…Apple soars to new highs. However, recently the advance has hit a wall.
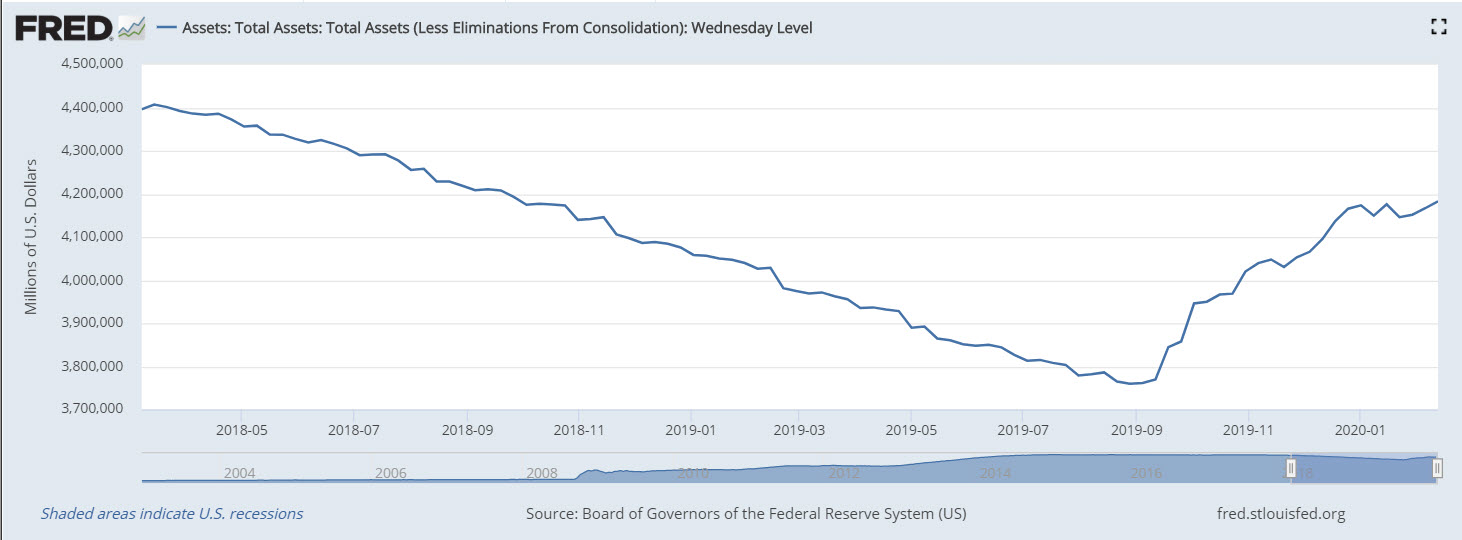 Fed balance sheet expanding by $421 billion since September. Just eyeballing it, I can see the rate of change slowing, just about the same time Apple’s price started getting choppy and volatile at the end of January.
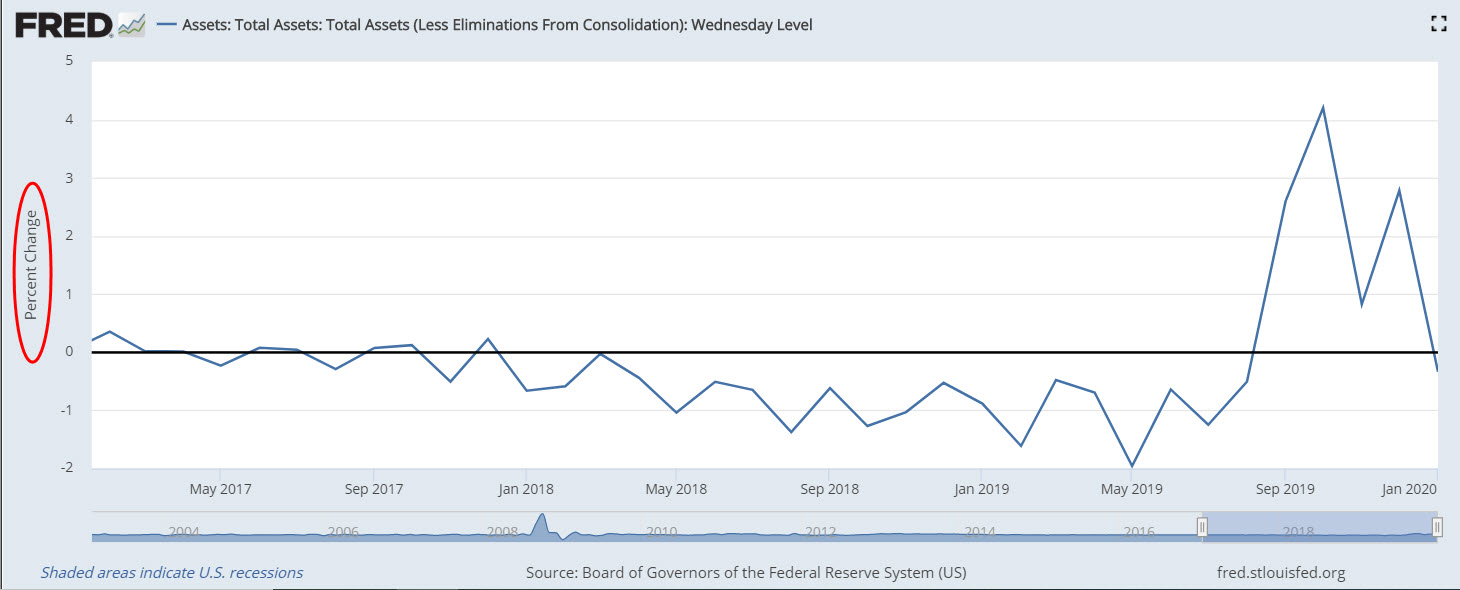
Here’s the Fed’s balance sheet in percent change terms…
Averages
On the day, the Dow, of which Apple is a component, was the worst performing. NASDAQ 100 the best while S&P and Small Caps were about the same.
S&P 500 ⇩ -0.29 %
NASDAQ ⇧ 0.05 %
DOW JONES ⇩ -0.56 %
RUSSELL 2000 ⇩ -0.24 %
S&P sectors
The day’s defensive tone was evident in a lot of places (like gold) as well as S&P sectors with Utilities the best performing. However, the FANG/MAGA heavy Communications and Consumer Discretionary sectors were top performers taking up some of the slack for Apple. Microsoft (MSFT +1.0%) and Amazon (AMZN +1.0%), which have a combined market cap of nearly $2.5 trillion, gained 1% each and Amazon was a big part of the market’s afternoon rebound off session lows.
The drop in yields and a flattening yield curve weighed on Banks and Financials, and boosted the rate sensitive bond proxy Utility sector.
Materials ⇩ -0.25 %
Energy ⇩ -0.82 %
Financials ⇩ -0.87 %
Industrial ⇩ -0.57 %
Technology ⇩ -0.37 %
Consumer Staples ⇩ -0.35 %
Utilities ⇧ 0.84 %
Health Care ⇩ -0.36 %
Consumer Discretionary ⇩ -0.01 %
Real Estate ⇩ -0.10 %
Communications ⇧ 0.67 %
Walmart (WMT +1.5%) outperformed despite missing profit estimates.
A few cyclical/growth sectors dipped below February rebound trends…
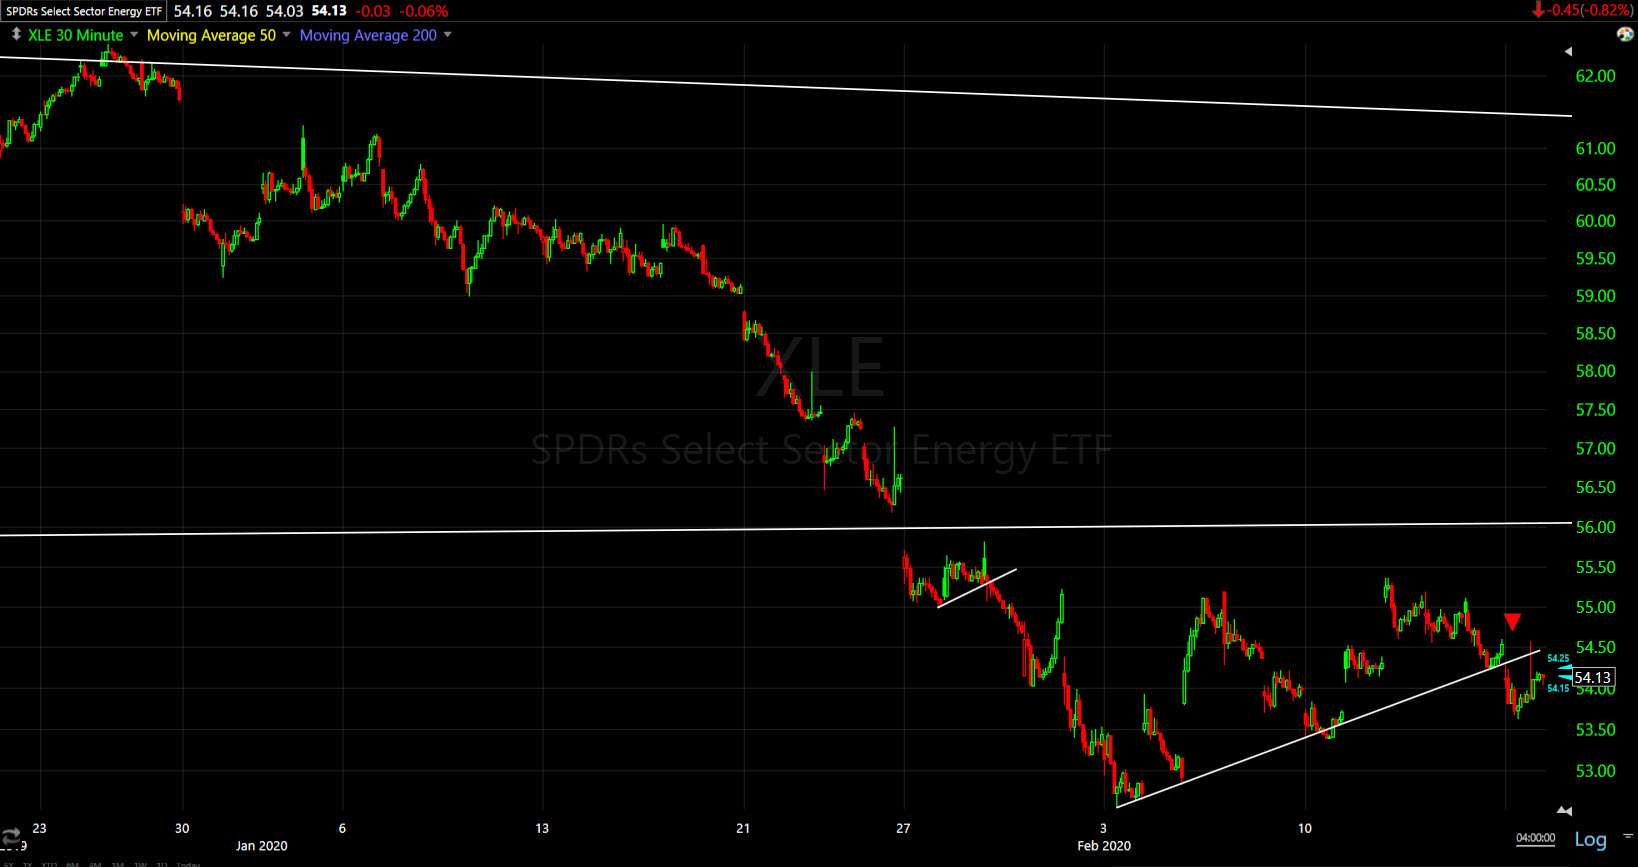 Energy sector (30m)- the bounce here off January lows hasn’t been anything more than a bearish consolidation. The sector dipped below the consolidation/correction’s trend today.
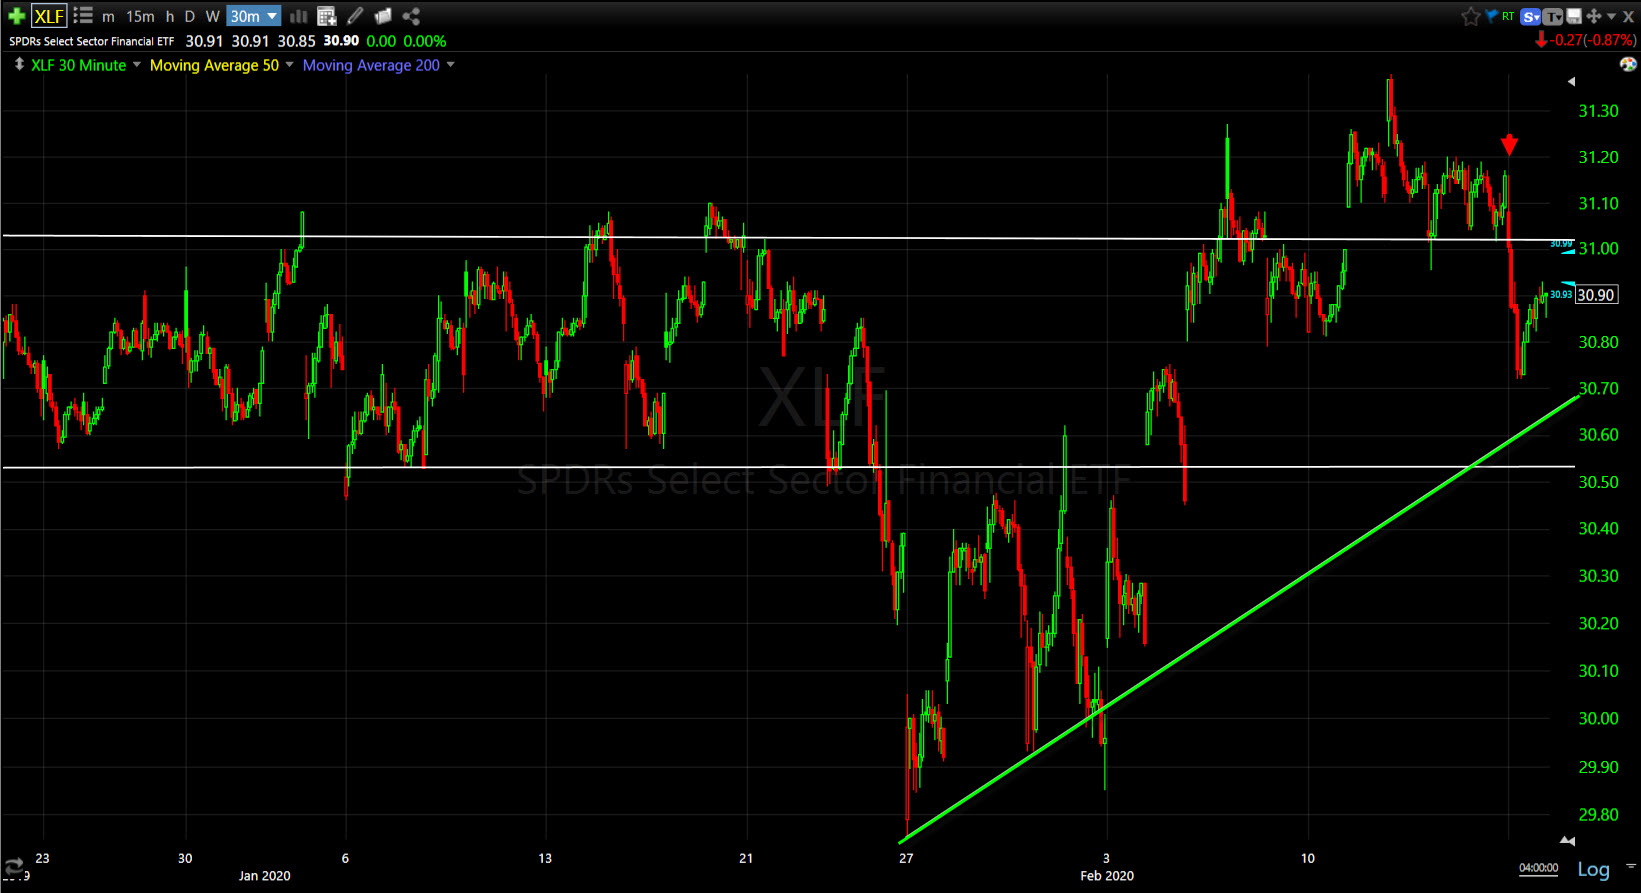 Financial sector (30m) did not break the rebound trend, but did lose a key support level. What was more telling was the banks/regional banks below…
As the bond market prices in the economic impact of corona virus, yield curves have been flattening and re-inverting, which weighs on the banks (net margin interest).
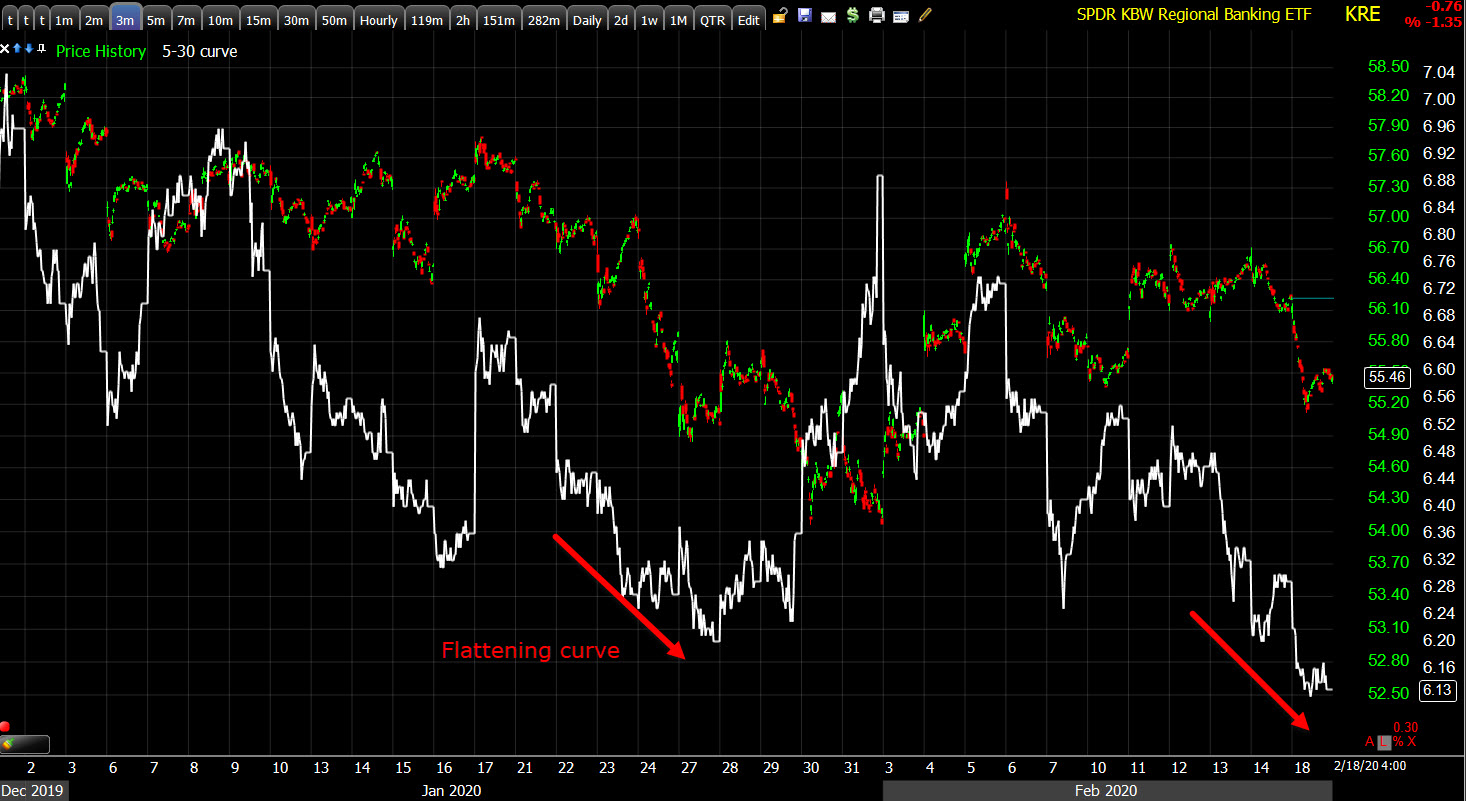
Regional Banks and 5y-30y yield spread (white) flattening and pressuring the banks (as well as lower yields), which in turn pressures the Financial sector.
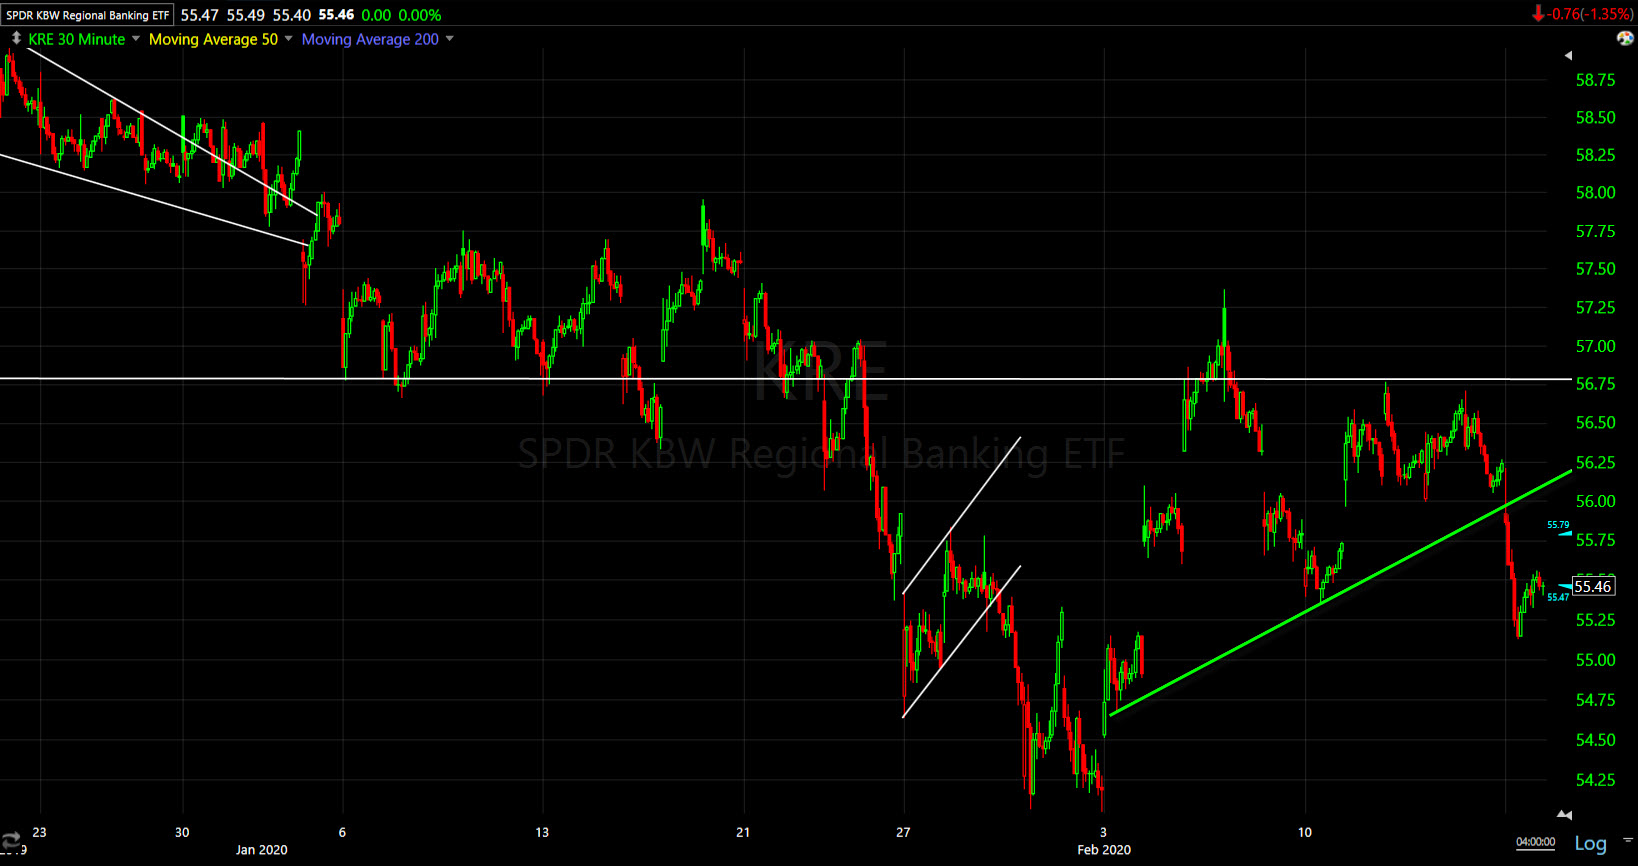 Regional Banks (30m) – The financial sector’s rebound in February was impressive and technically significant, but the regional banks didn’t confirm the higher high and ran into resistance. The trend break here today was one of the more definitive trend breaks. The group may back-test the trend line.
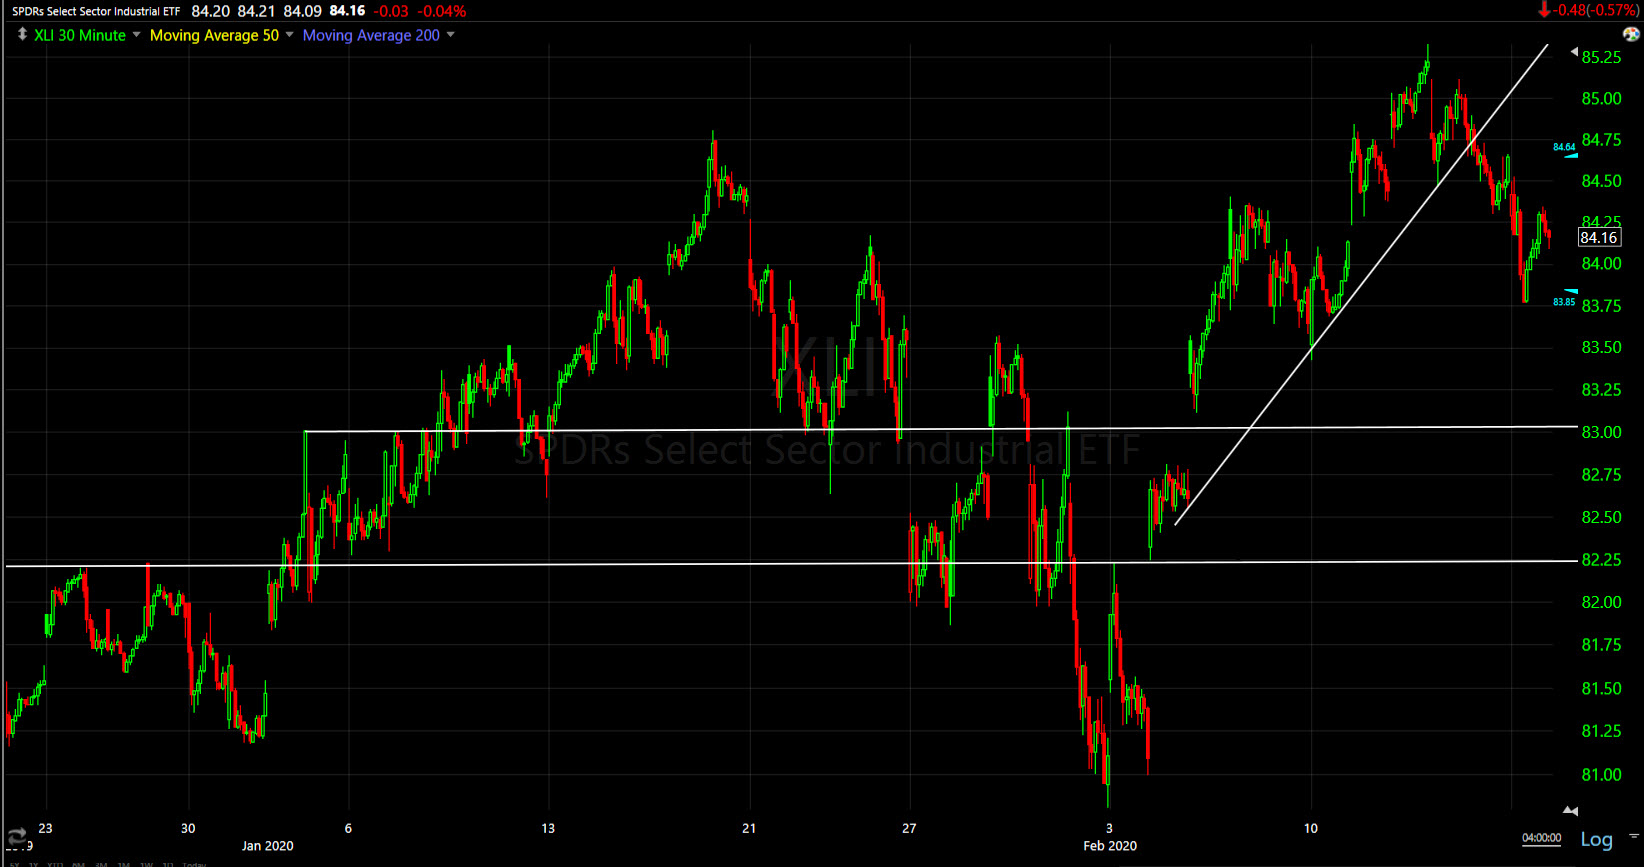 Industrial sector (30m) – from a technical viewpoint, the sector performed well and was one of the few cyclical sectors to make a technically significant higher high the last 2 weeks. They broke the rebound trend, but haven’t done any serious technical damage until a break under $83. Transports (0%) acted better today, but like regional banks, transports hit resistance (Dow Transports $10,950-$11k) and did not confirm Industrials’ higher high recently. Transports tend to lead the industrial sector, so we’ll keep a close eye on them.
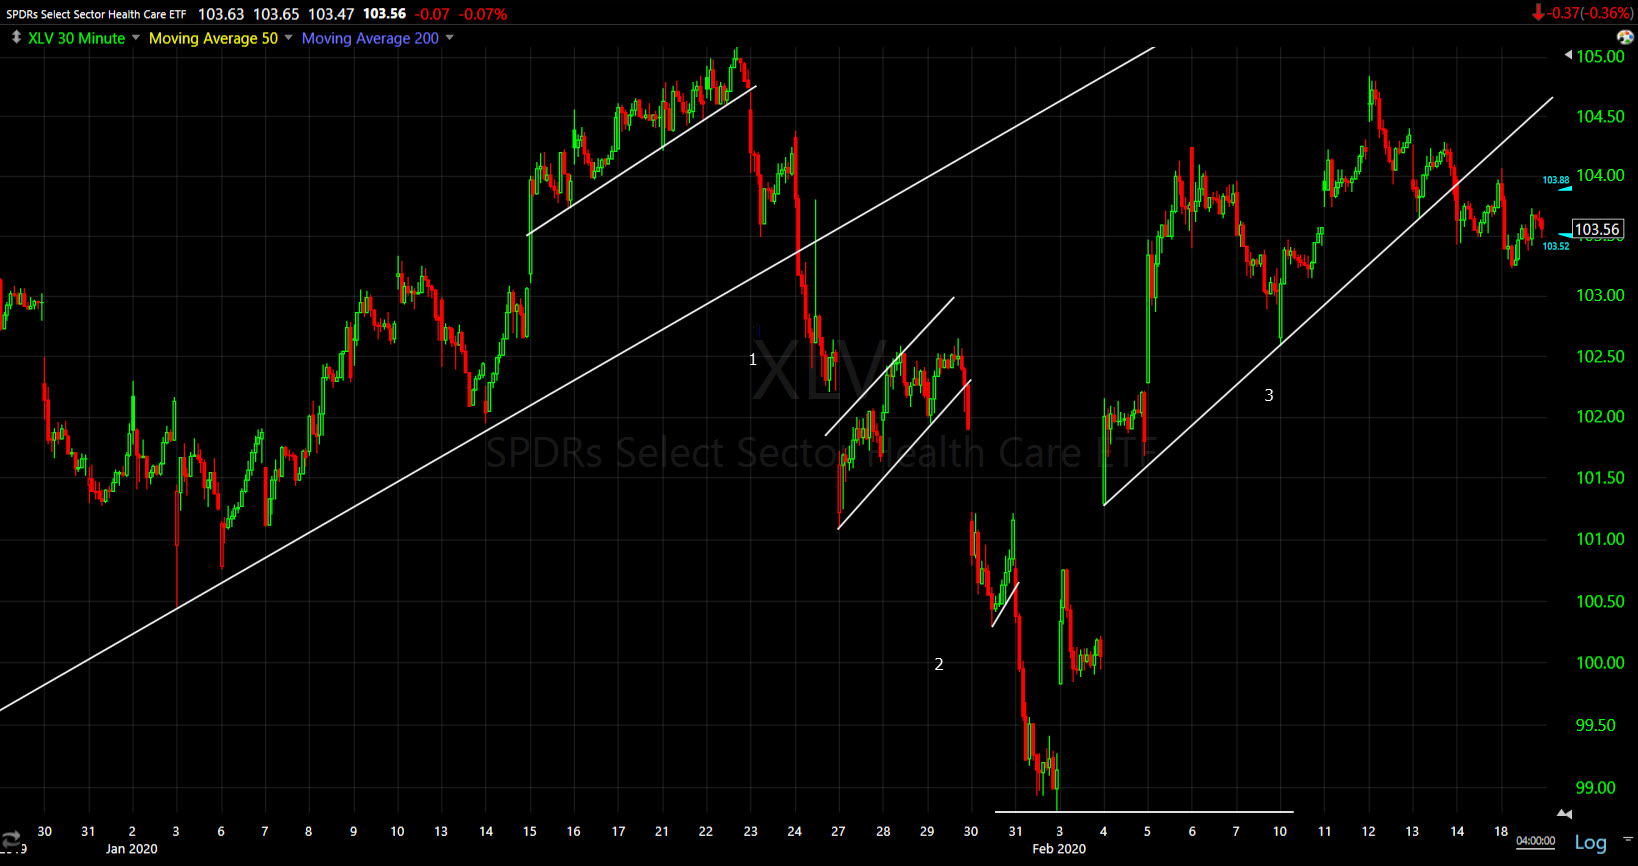
Health Care sector (30m) while not a cyclical, it is the second most heavily weighted S&P sector. This is one of the few sectors that did meet the 1st/2nd leg decline target on the money before bouncing. The rally has not made a higher high like the market averages.
Investors seem to be putting two and two together and figuring out that if Apple’s supply chain is fractured and demand is taking a hit, then the downgrades of guidance from the semis can’t be far behind. Semiconductors -1.4% showed relative weakness, and unlike the Technology sector, broke their February rebound trend today.
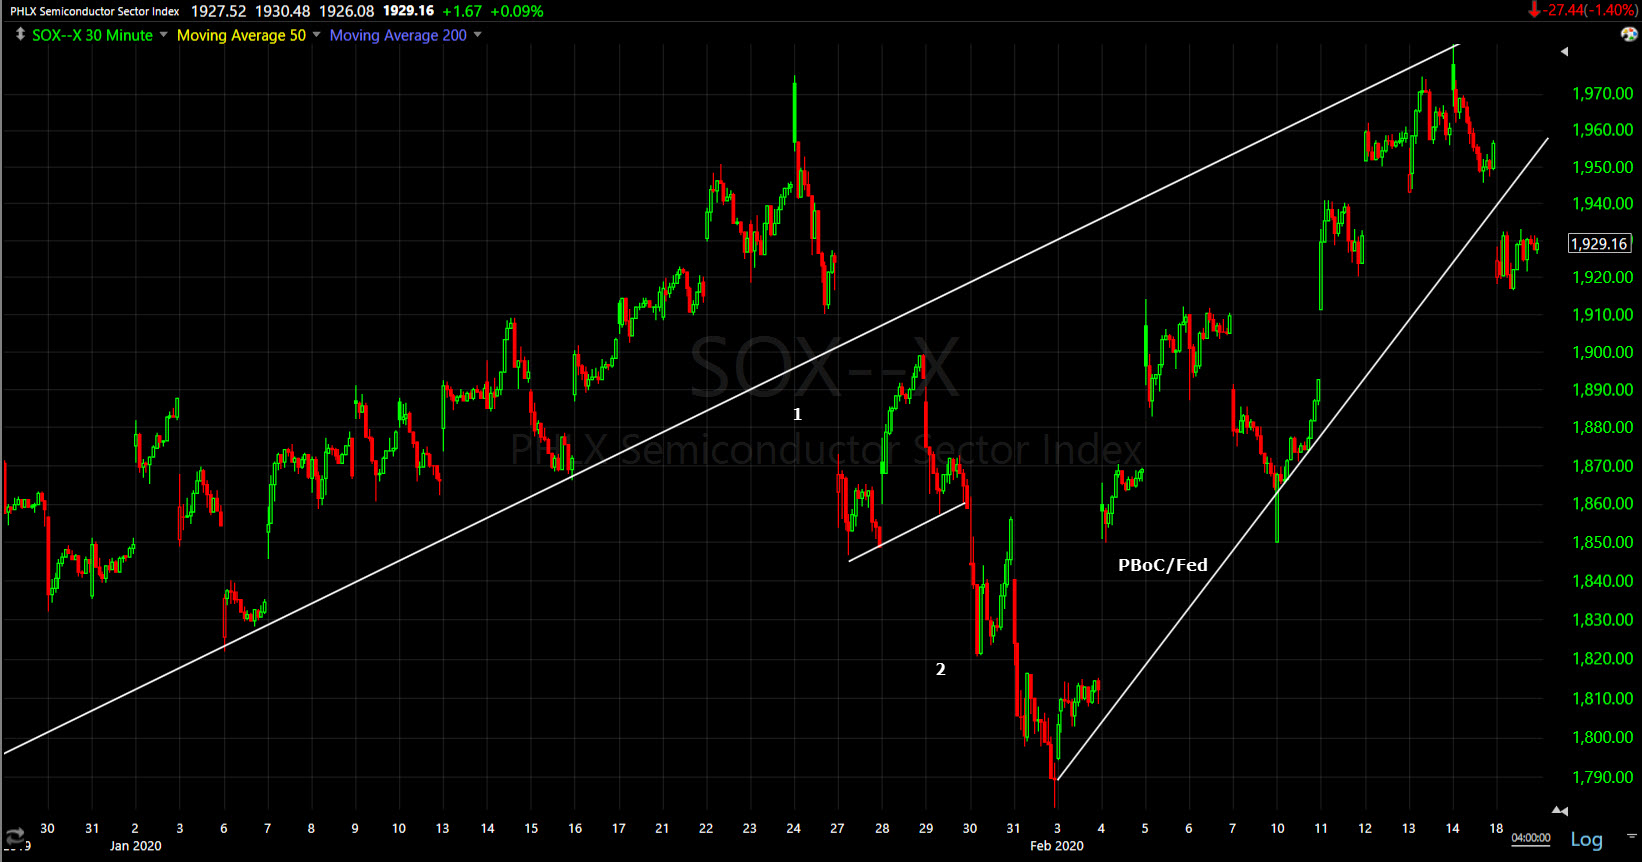
Philly Semiconductor Index (30m) breaking a primary up trend with a first leg down, but falling just short of the second leg downside target as the People’s Bank of China and Fed flooded the financial system with hundreds of billions of dollars.
Internals
Decliners were 2:1 over advancers earlier, but moderated after the noon-time bounce. NYSE Advancers (1190) and Decliners (1685) on 916.4 mln. shares.
There was no Dominant price/volume relationship, but Dow-30 and S&P-500 components leaned toward Close Down/Volume Up. Internals do not depict a 1-day oversold condition.
Volatility
VIX gained +8.4%, but VIX futures were somewhat negatively divergent this morning before the open. I wouldn’t call it heavy selling pressure, but volatility was subdued. In the cash market VXX maintained the positive divergence that started early last week, which was followed by negative divergences in the averages toward the end of the week.
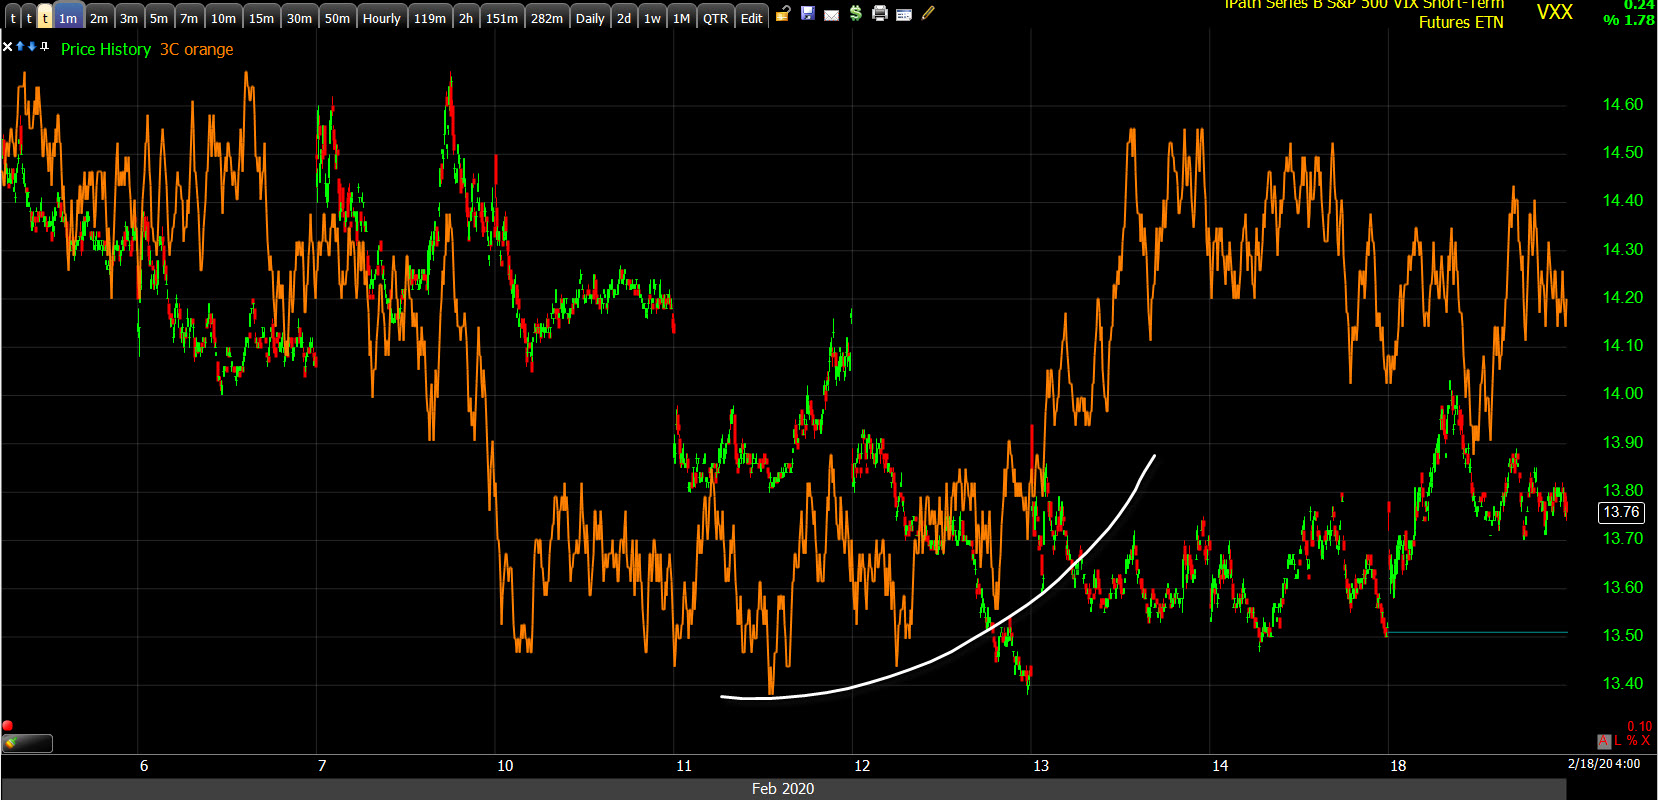
VXX (1m) 3C leading price
VVIX ($101) crossed above the first warning level at 100 to its highest since the end of January S&P decline (3%).
Treasuries
The 2-year yield declined two basis points to 1.40%, the 10-year yield declined three basis points to 1.56%, and the 30-year yield fell 4 basis points closing at the psychological and technical 2% level in curve flattening trade. The 3m-10y yield curve dropped back into inversion.
Friday I put up several charts of levels to be aware of (both bullish and bearish) for currencies and yields. Most of the bearish levels were violated today, including yields.
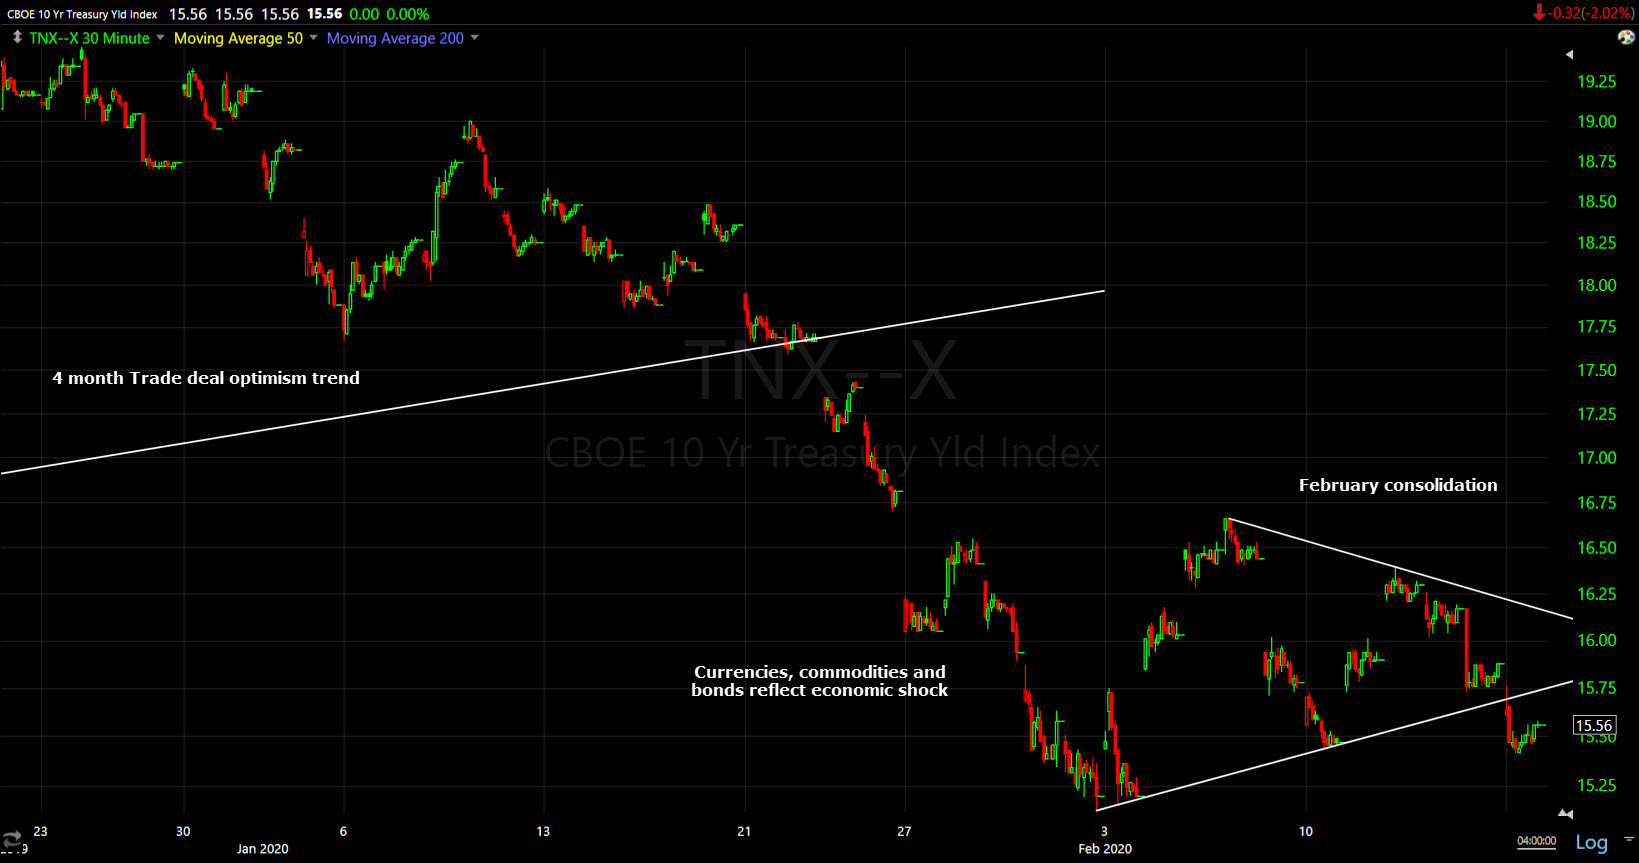
30-year yield (30m) – as stocks bounced back to new highs after the end of January decline, yields simply consolidated in a triangle which has bearish implications due to the preceding decline. Crude and Copper both plunged more than 10% with yields reflecting something more akin to an economic shock. Yields dipped below the triangle consolidation today. The 30-year’s 2% level is technically and psychologically significant.
For perspective…
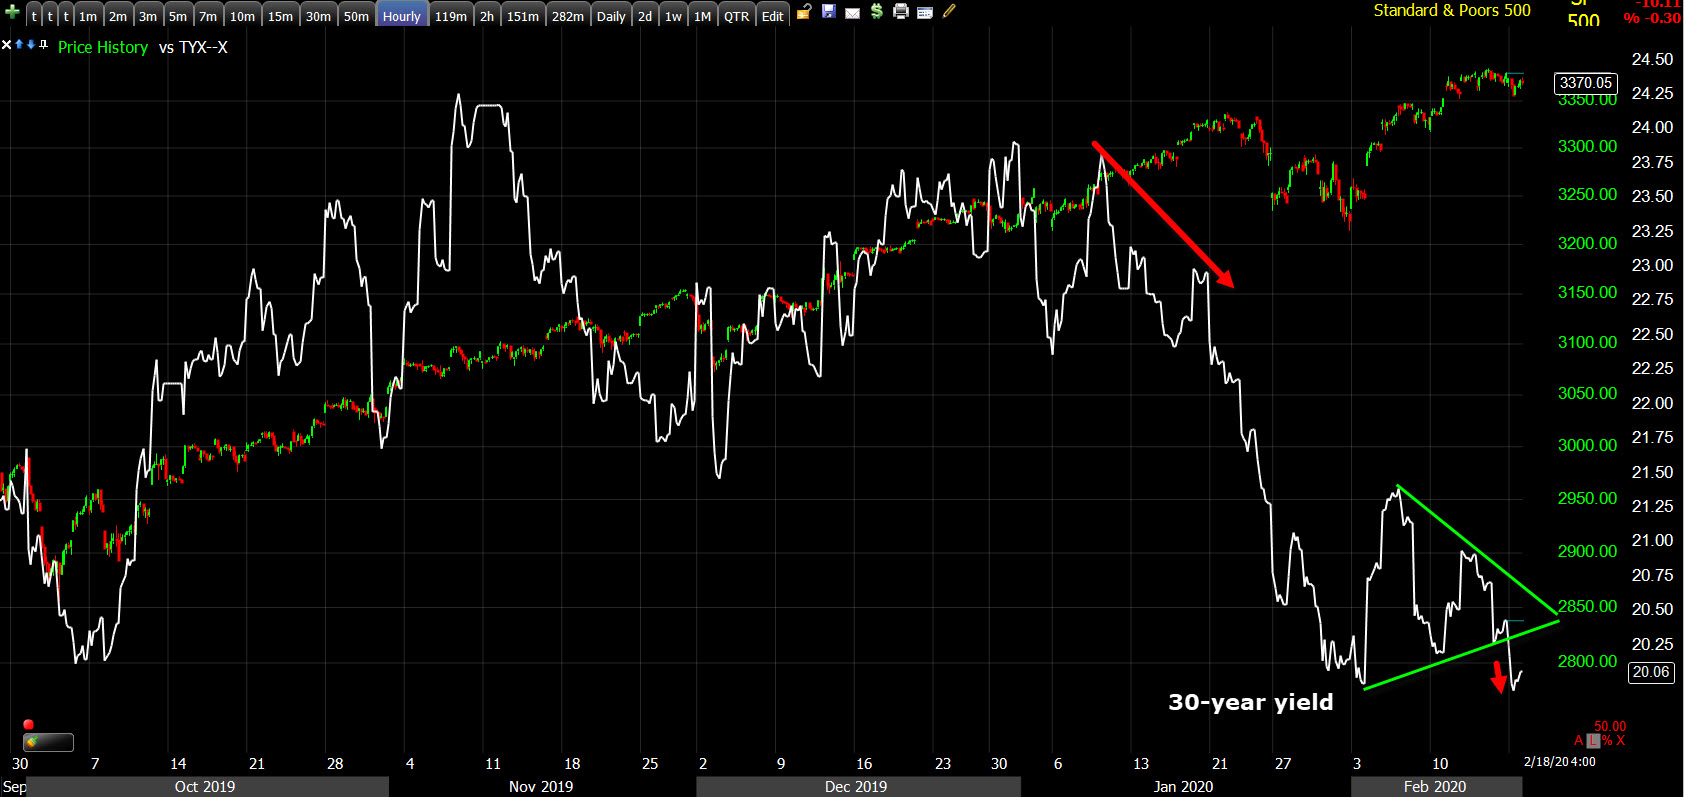
SP-500 and 30-year yield (60m) – yields did not bounce to a higher high to confirm with stocks. In fact, they’ve already retraced the phase I trade deal optimism from October. As we have seen with increasing frequency lately, economic data is rolling over with yields after a similar bounce in some data.
Currencies and Commodities
The U.S. Dollar Index gained +0.4% to 99.43, its highest since October 2019 in what has been an impressive rebound, part flight to safety (going to cash) and part “U.S. is the least dirty shirt”.
The Chinese Yuan declined to start the week with USD/CNH moving back to (just above) the key technical and psychological $7 line in the sand, further diverging with the equity market for the February rebound.
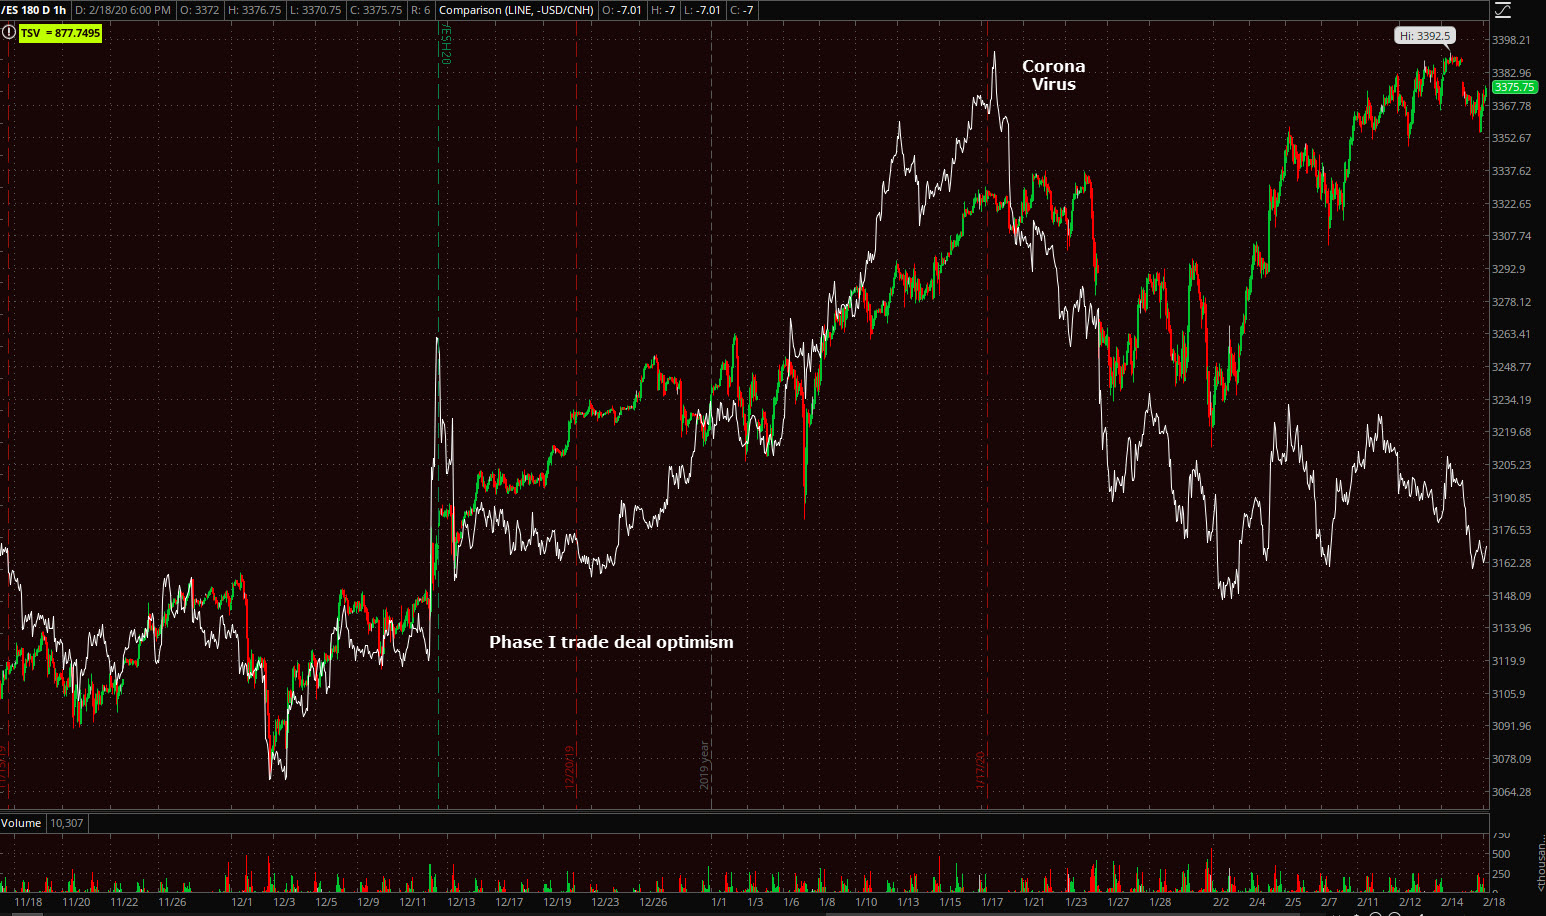
S&P futures (60m) and USD/CNH (inverted)… you might notice that U.S Treasury yields and the Yuan have very similar trends, neither confirming the S&P’s rally to new highs following the late January market decline.
The decline in the yuan is not as sharp as the decline in yields, crude, copper or the Aussie (AUD/USD). We have seen the PBoCdefend the $7 level at least once in recent weeks. Remember that the yuan trading below $7 is viewed by the U.S. Treasury as competitive devaluation of the yuan and starts causing tensions between the two countries.
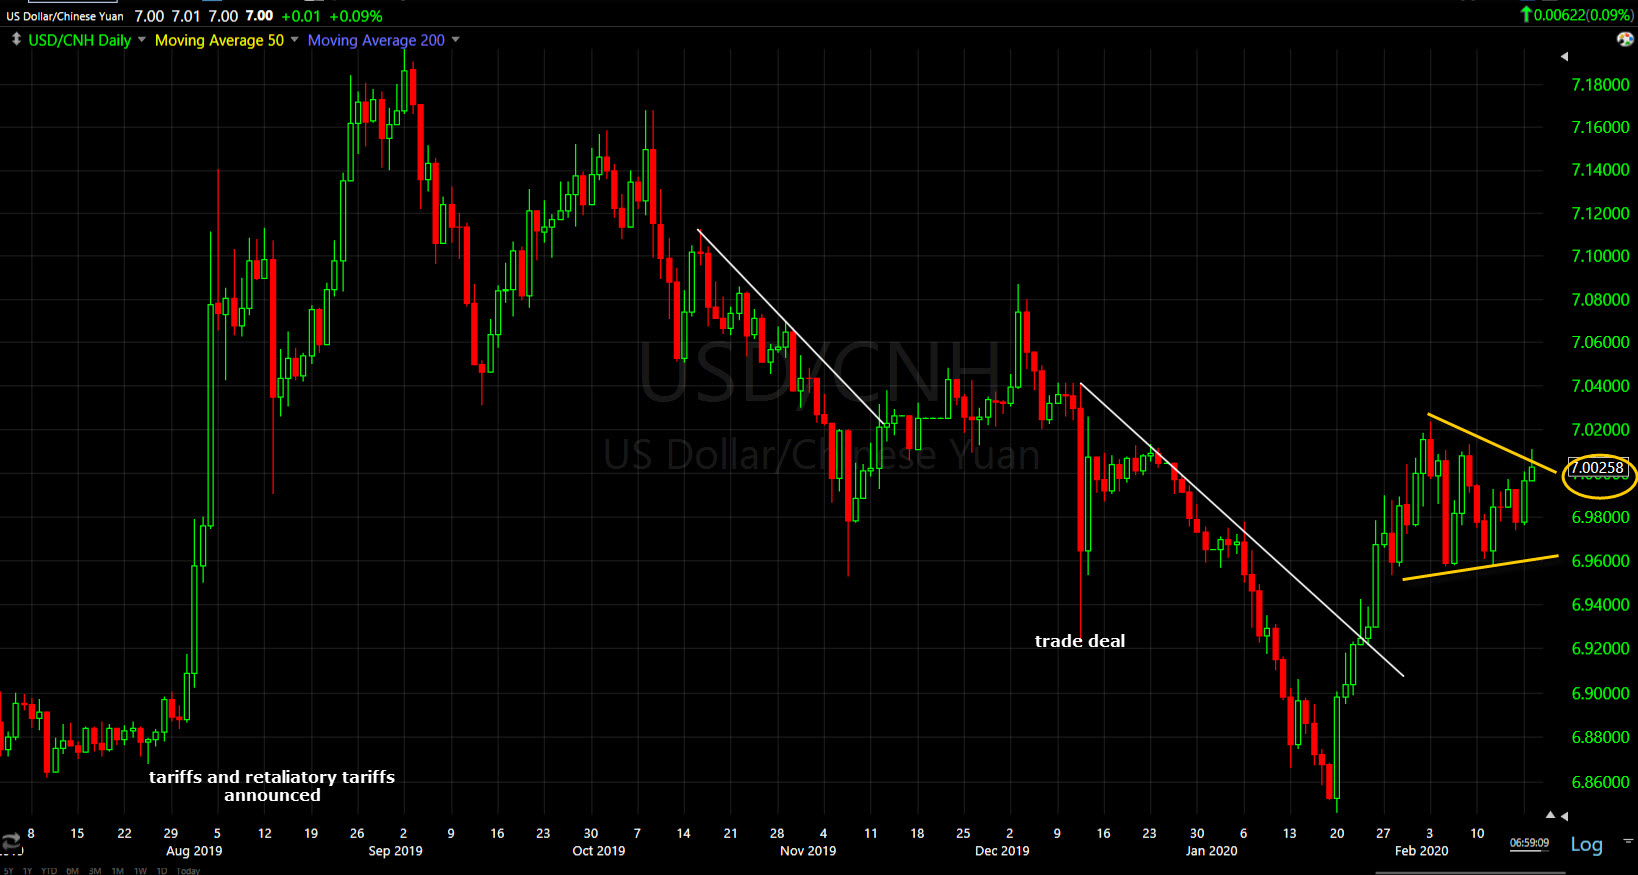
USD/CNH (daily) consolidating around the key $7.
AUD/USD also started the week lower, breaking below last week’s bounce and approaching decade-plus lows that were put in with commodities like Crude and copper.
USD/JPY sold off Monday night on the Apple news, but has thus far held above the February bounce (market supportive) trend.
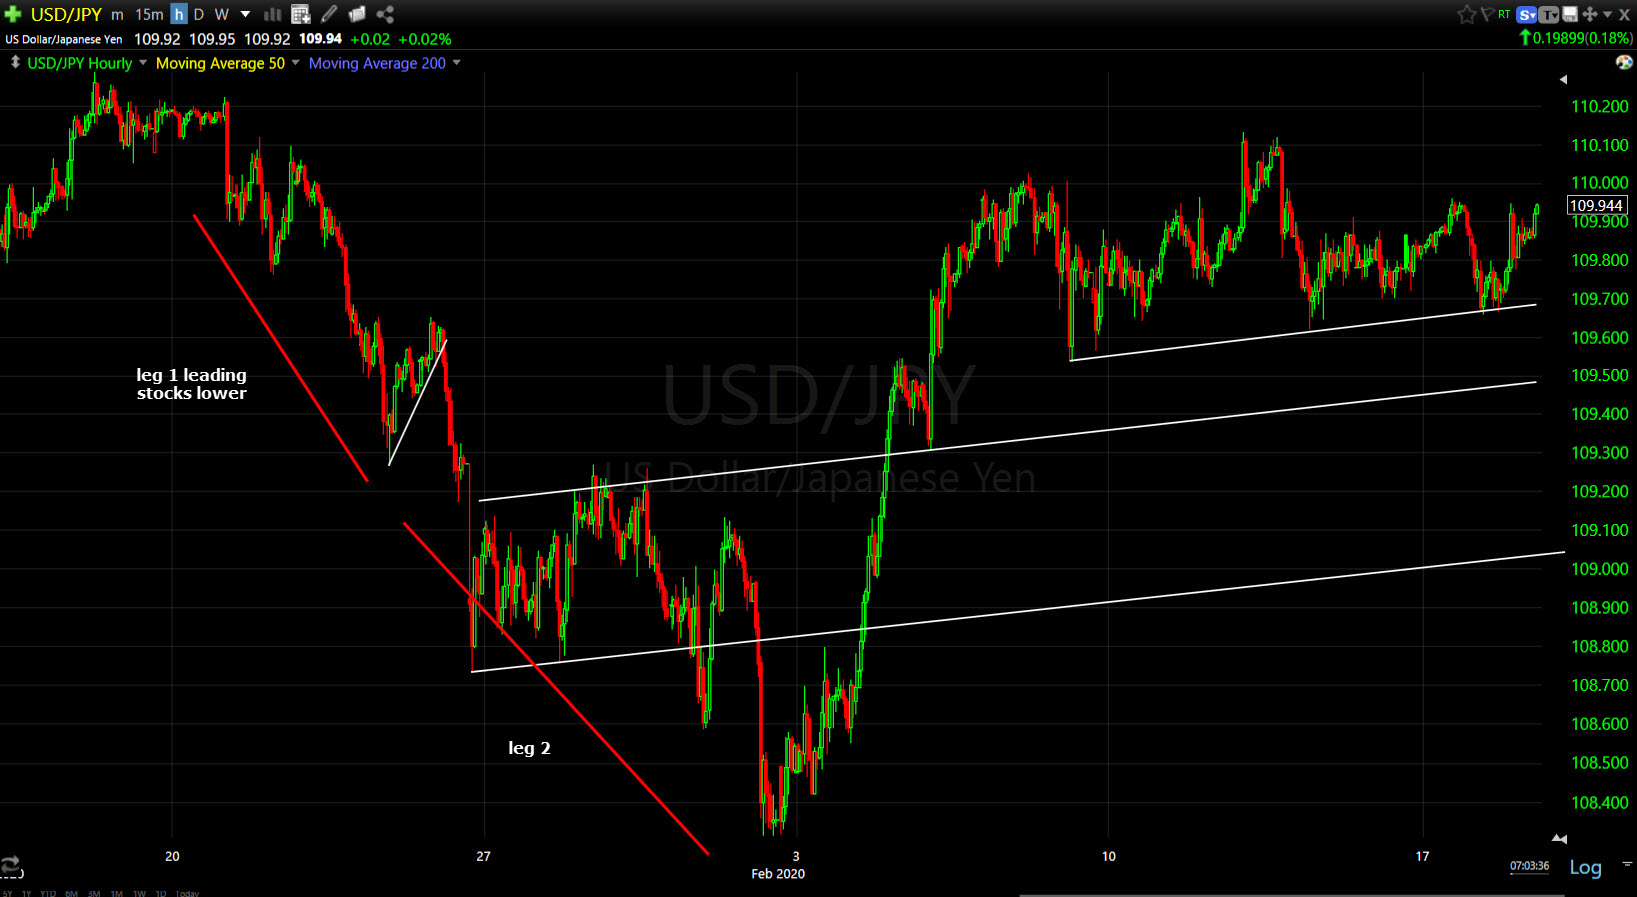
USD/JPY (60m) – the pair looks supportive still for stocks, however the yen reflects more than just risk sentiment and I imagine Japan’s horrendous GDP print on Monday is having some downward influence on the yen. On Monday Japan’s GDP shrank dramatically by 6.3%, putting the country on track for a technical recession. The Q4 GDP print does not reflect any negative impact from the corona virus.
WTI crude started the day down -2%, it bounced back in the cash session to end up +0.1% to $52.10/bbl.
Gold was a big part of Friday’s post as the short-term price outlook improved substantially Friday. Gold gained +1.1% and closed above the psychological $1600 level to $1,603.60/oz, on a flight to safety trade. This is gold’s highest close in 7 years.
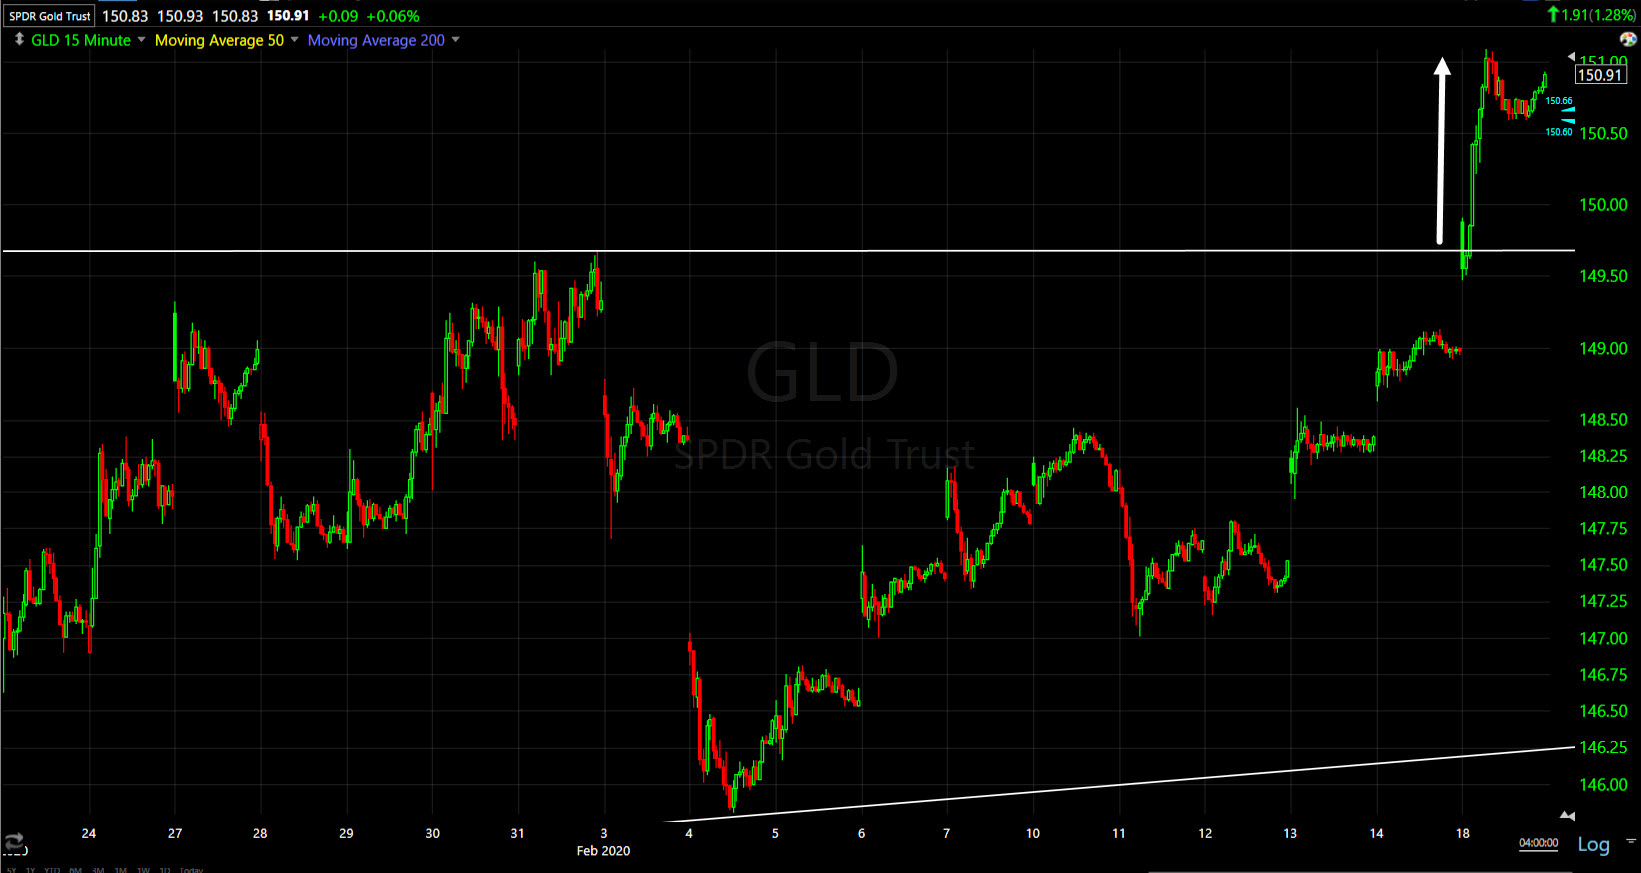 GLD (15m) with an impressive breakout blowing through resistance of its 6 week consolidation.
My second leg target for gold is about 7-8% higher.
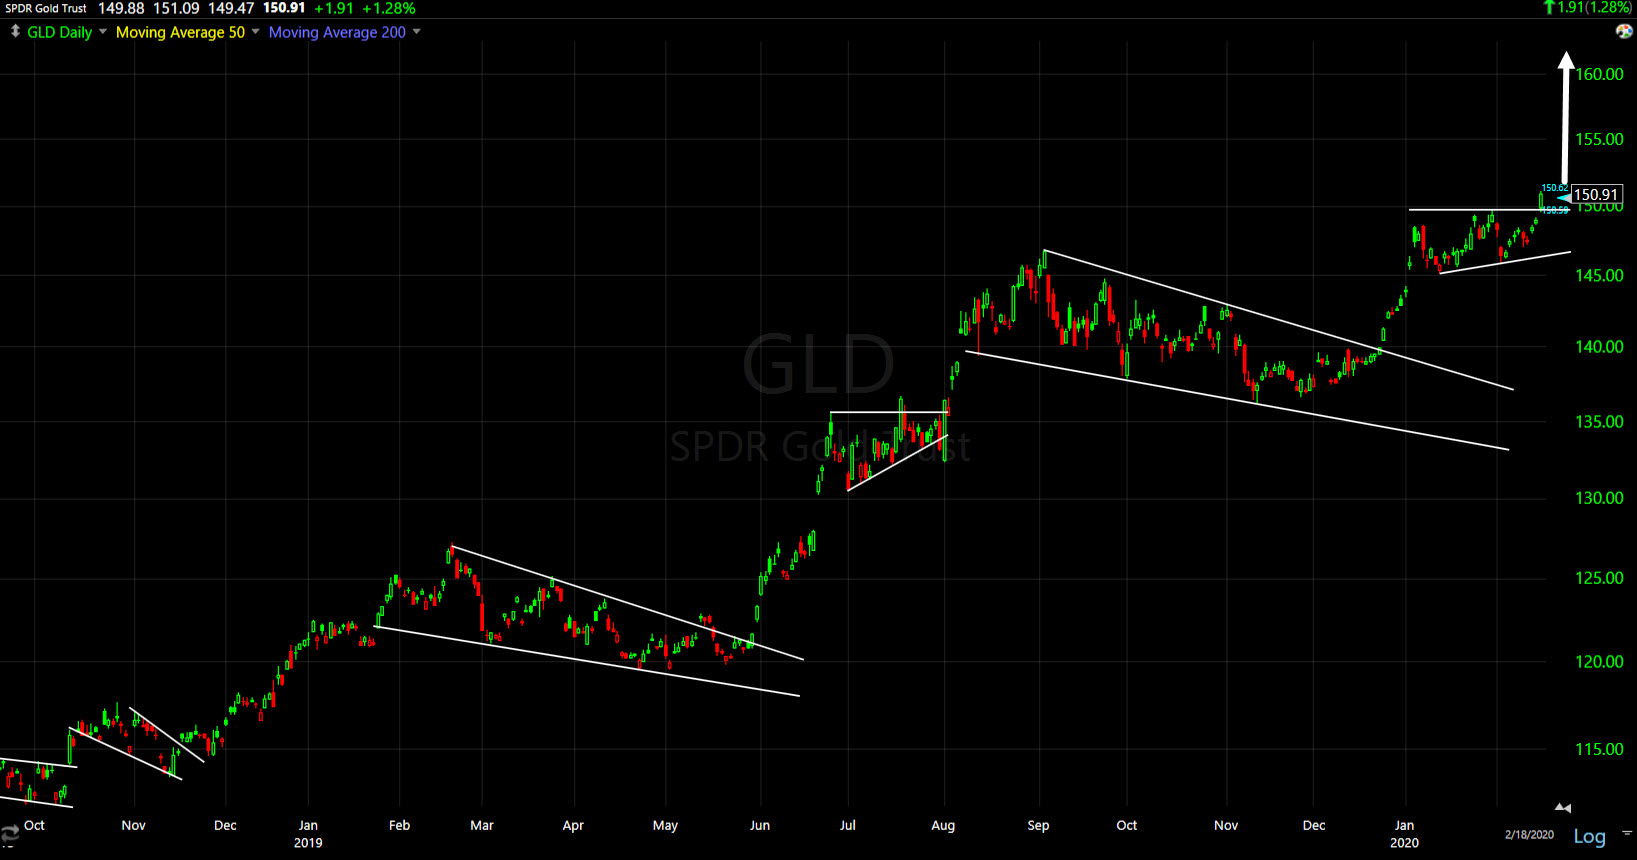
GLD (Daily) second leg target near $161
Leading Indicators
After failing to confirm a higher high (mid-January) with stocks, High yield credit broke the February rebound trend today and ended the day with bearish price action.
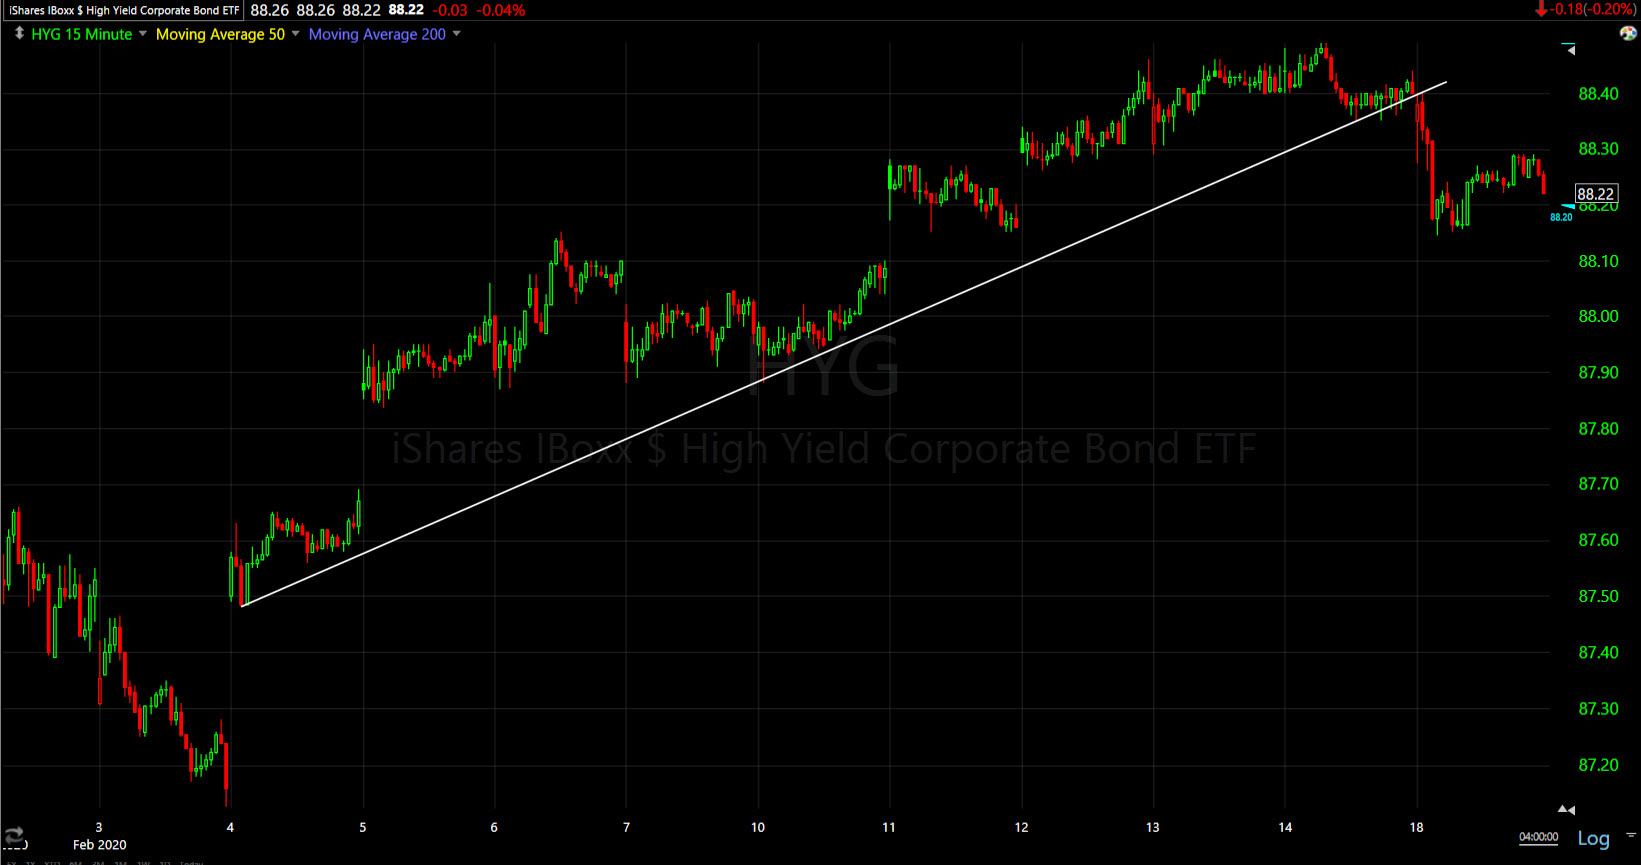 HYG (15m)
My equal eight index of credit related leading indicators has not broken trend yet…
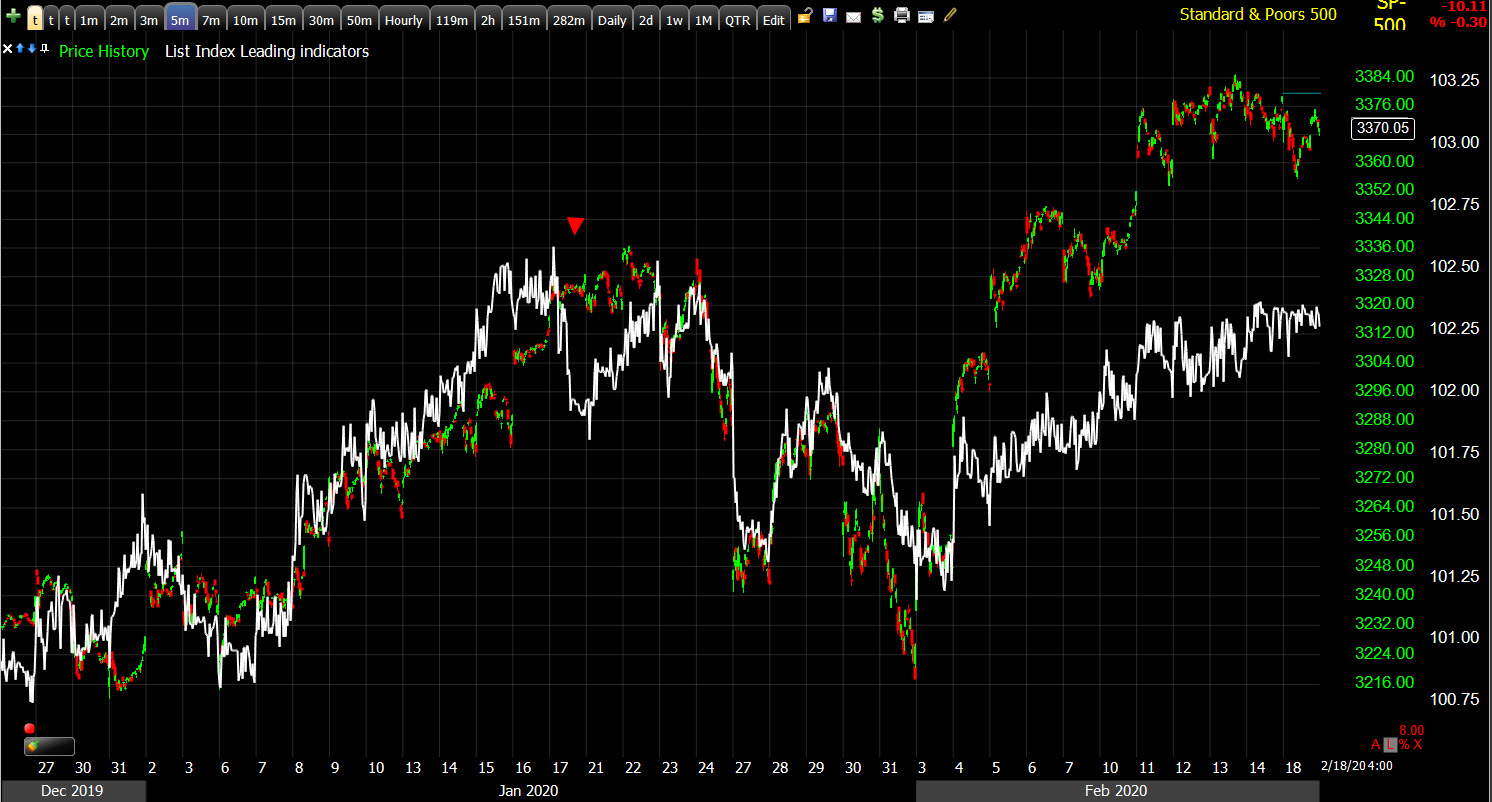 SP-500 and leading indicators (5m) – On January 17th they showed clear weakness with small caps, leading the broader market lower into the end of the month.
However, HYG is the most prominent of the group and is a risk asset substituted for the S&P by hedge funds. For that reason, today’s break of trend was notable, especially because it was not due to a decline in crude.
Summary
Overall the day was orderly, it seemed likely that it would be given how volatility looked this morning, also USD/JPY holding support. In other places, like gold, there was a much stronger instinctive flight to safety. The bearish equity downside signals are not from Apple’s warning or price action today, they have been in place since the mid-January weakness in cyclical sectors, Small Caps, commodities, bonds and currencies. Apple, however, may have broken the hermetic seal of invincibility.When crude and copper drop more than 10%, it’s obvious they’re pricing in an economic shock. Bonds, currencies and commodities priced this in weeks ago. Meanwhile stocks have not only been ignoring any negative impact or risk, but celebrating it because the more dire the economic outlook, the more stimulus investors expect from central banks. Those are really the two dominant and contrasting forces in the market, an economic impact and a stimulative impact. The third is mass psychology, which has been about as euphoric as I’ve seen considering the circumstances.
Some of the more growth sensitive areas are starting to falter. These sectors are the same ones that started showing weakness with small caps in mid-January and led the broader market lower into the end of the month. However, the 2020 market trend has been dominated by a handful of mega-cap stocks feasting on central bank liquidity, the FAANGs or MAGA stocks (FB, AMZN, AAPL, GOOG, MSFT). While Apple may have broken the seal in terms of the equity market’s view that any economic impact is negligible, many of the others held up well today and Amazon in particular was a big part of leading the afternoon bounce off the market’s lows. I don’t see a serious market decline until the 3 sectors that are dominated by these mega-caps break their up trends as well – Technology, Communications and Consumer Discretionary. Here’s a link to an early market update with their charts/trends.
Last Thursday small caps’ (IWM) 3C chart negatively diverged leading the other averages lower into Friday, which appeared to be “taking risk off the table” in front of a 3-day weekend. Most of the day there was little change on 3C charts, but into the close IWM started leading a little lower.
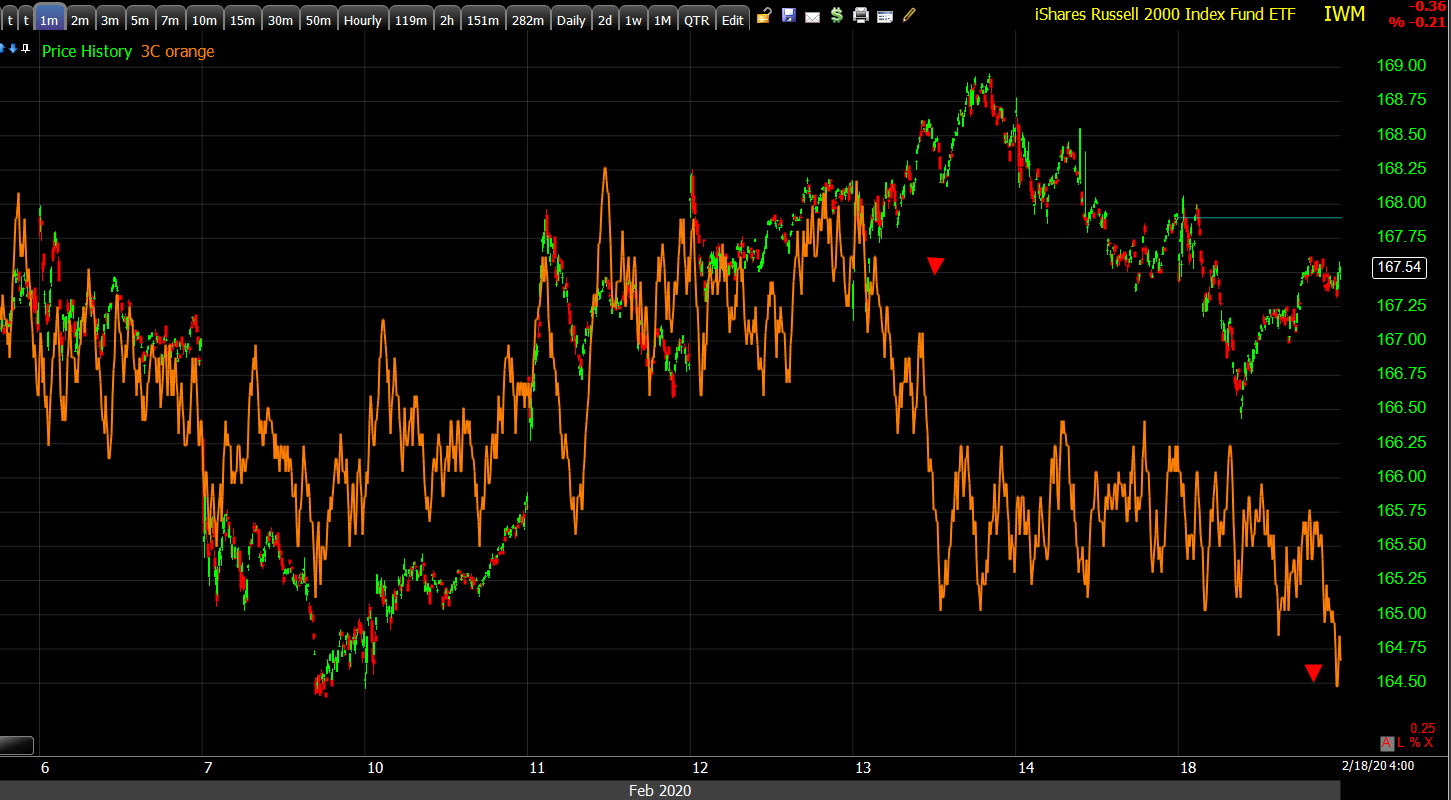 IWM (1m)
Overnight
S&P futures are +0.2% higher, continuing the bounce from session lows around noon time. 3C is close enough to confirming the bounce in most index futures that I don’t expect anything to change much overnight. 3C of NASDAQ 100 futures is starting to negatively diverge. We’ll see what it looks like in the morning.
VIX futures saw some evidence of buyers stepping in near the close, but overall still look a bit suppressed tonight.
Crude futures’ rebounded during the cash session, but now appear to be stalling out around $52.50
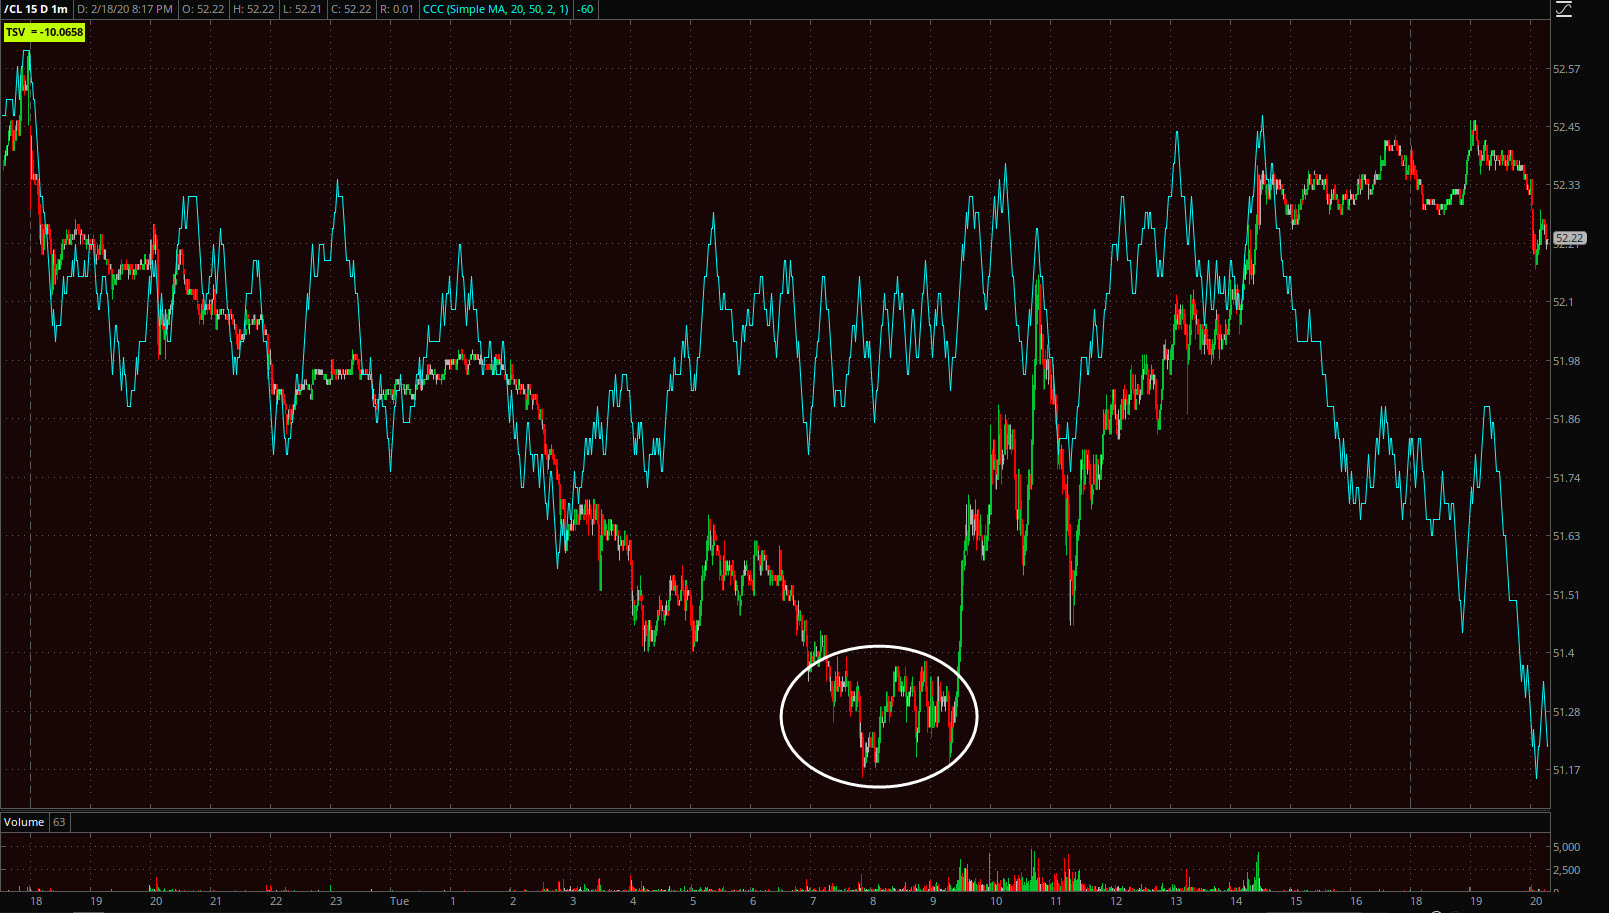
WTI Crude futures (1m)
Gold futures look good tonight, are up +0.2% after a small consolidation this afternoon.
Again I don’t expect any major developments overnight.
Investors will receive the Producer Price Index for January, Housing Starts and Building Permits for January and the weekly MBA Mortgage Applications Index on Wednesday.