Daily Market Wrap – July 24, 2019
The theme of the day was the market took bad news as good news, or just ignored bad news and bought the exact same trade talk news that was already out twice this week, that U.S. and Chinese officials would meet face-to-face next week. Stocks gapped down on the open, only to rally immediately as the market bought the same recycled news for a third time… Trade optimism.
The market also ignored Department of Labor announcing an antitrust probe into “market-leading online platforms”, weaker-than-expected eurozone flash manufacturing PMI for July, weak U.S manufacturing PMIs coming in the worst in a decade, and Caterpillar lowering its full-year EPS guidance.
After the disappointing eurozone manufacturing PMIs, ECB rate cut expectations for tomorrow soared (euribor futures). We’re right in the middle of the backwards world of, “The worse the economic data, the more stocks rally on easing hopes”. It’s strange in logical terms, but normal historically speaking.
On the other side, notable earnings-related gainers included Visa (V +1.3%), UPS (UPS +8.7%), Texas Instruments (TXN +7.4%), Northrop Grumman (NOC +5.9%), Chipotle Mexican Grill (CMG +5.2%), and Snap (SNAP +18.8%).
Averages
S&P and NASDAQ 100 set new record highs. S&P-500 +0.17% above July 15th’s close and NASDAQ 100 +0.55% above July 15th’s record close. The real standout leader was small caps, showing early relative strength and building on that throughout the day. The Dow ended red due to noticeable losses in Boeing (BA -3.1%) and Caterpillar (CAT -4.5%) following disappointing earnings reports.
S&P 500 ⇧ 0.47 %
NASDAQ ⇧ 0.70 %
DOW JONES ⇩ -0.37 %
RUSSELL 2000 ⇧ 1.57 %
Small Caps’ strength today was by far the most impressive development.
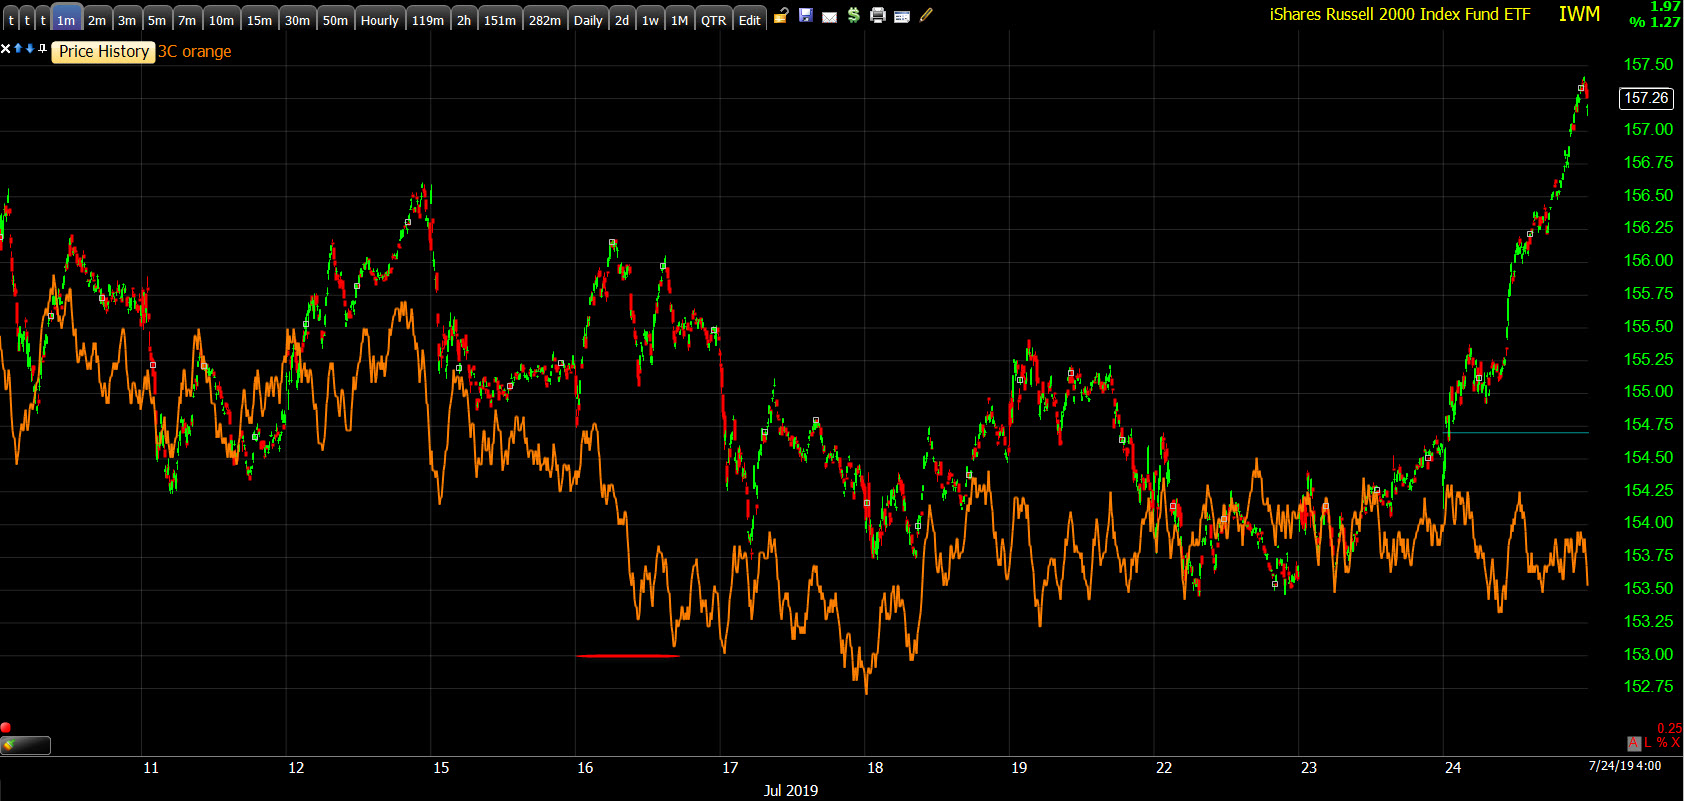
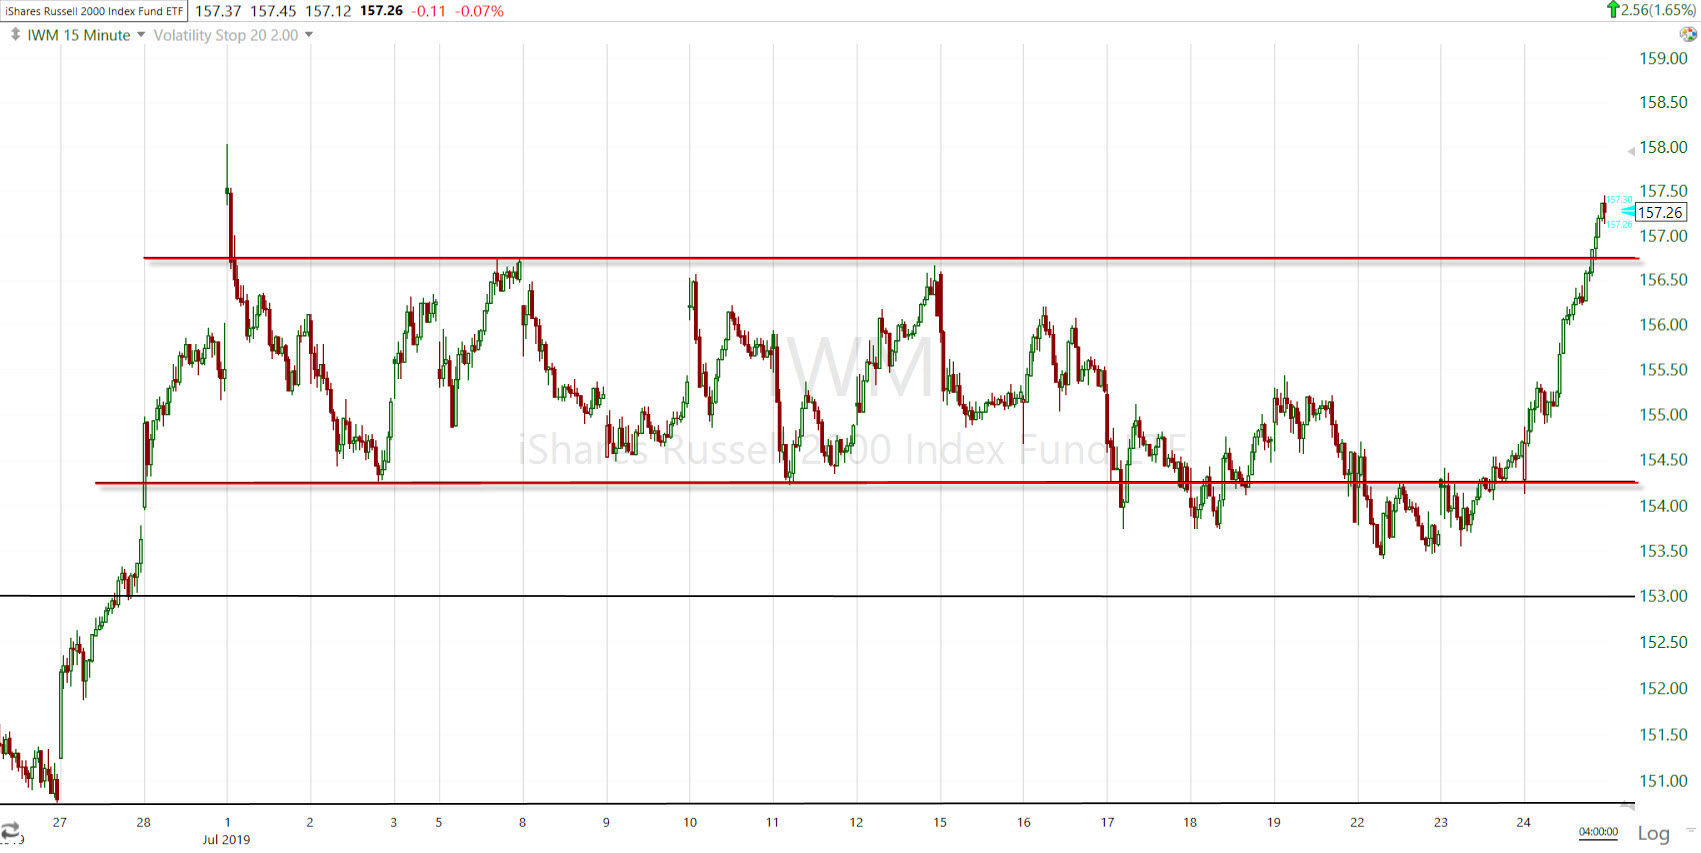 IWM (15m) after dipping below the July lateral range last week, Small Caps blasted higher today. IWM took out resistance at $156.75 and closed near the high of the day.
From a relative performance perspective, a case could be made that they were due.
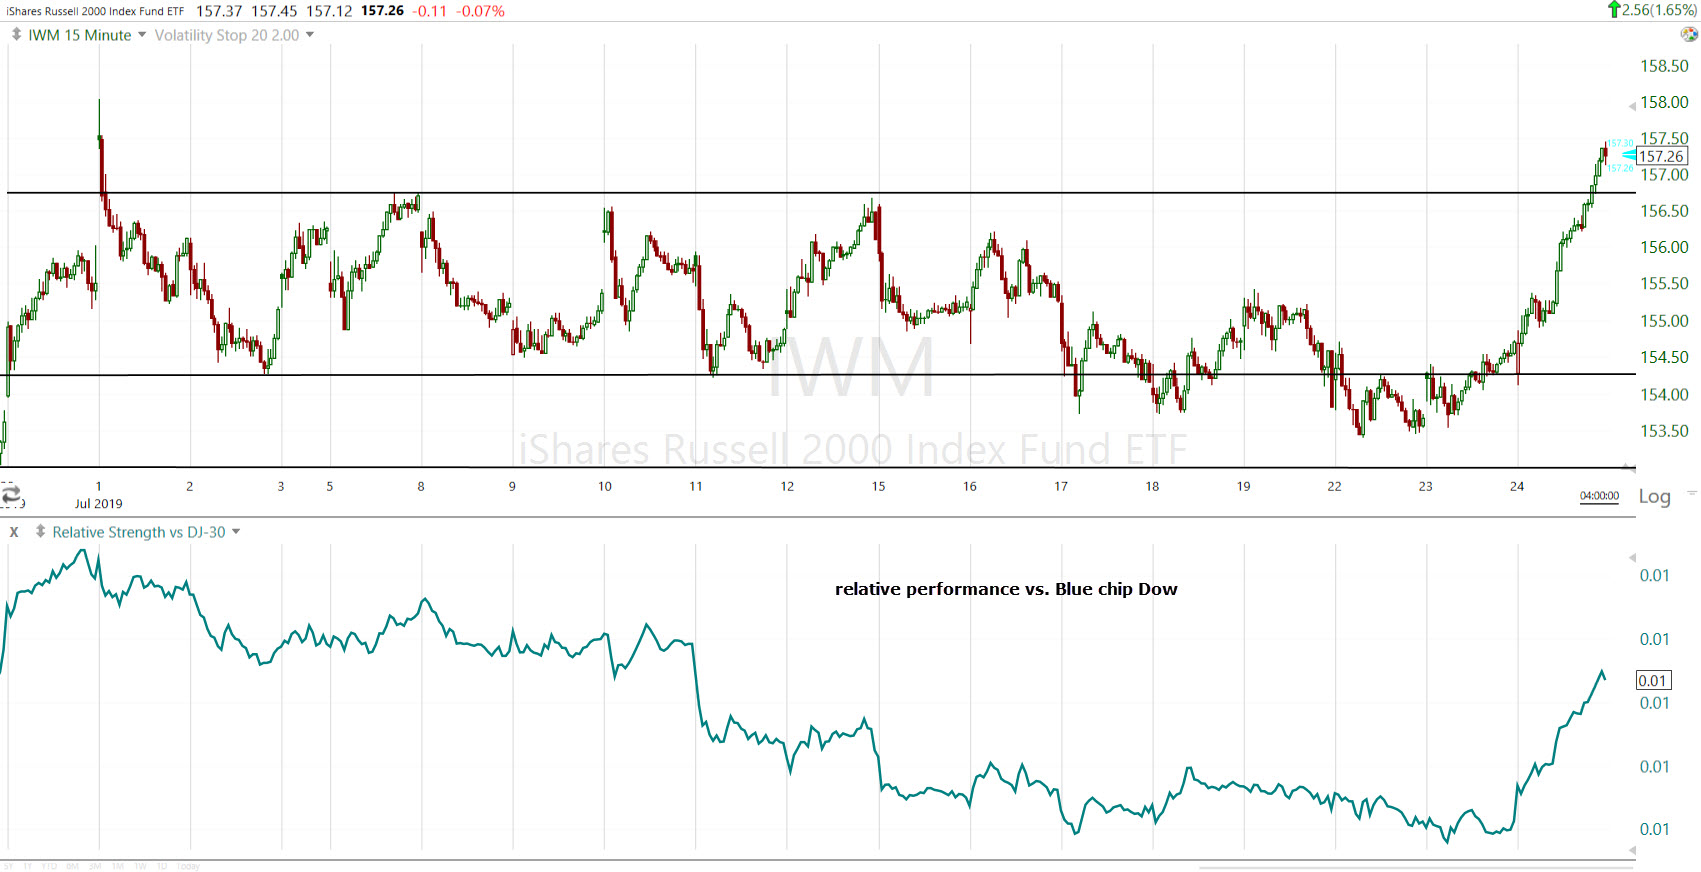
IWM (15m) and relative strength vs. the Dow Industrials. Small Caps led the broader market higher off May’s low as Powell made another dovish pivot. From June 7th, the Dow has far outperformed small caps by more than 2 to 1. More broadly, small caps relative performance vs. the Dow fell to a decade low just last Tuesday. The key support zone for IWM is now $156.75. There’s a substantial resistance zone from $159 to $161.
Beyond banks, much of small caps’ out performance today came on a short squeeze just after noon.
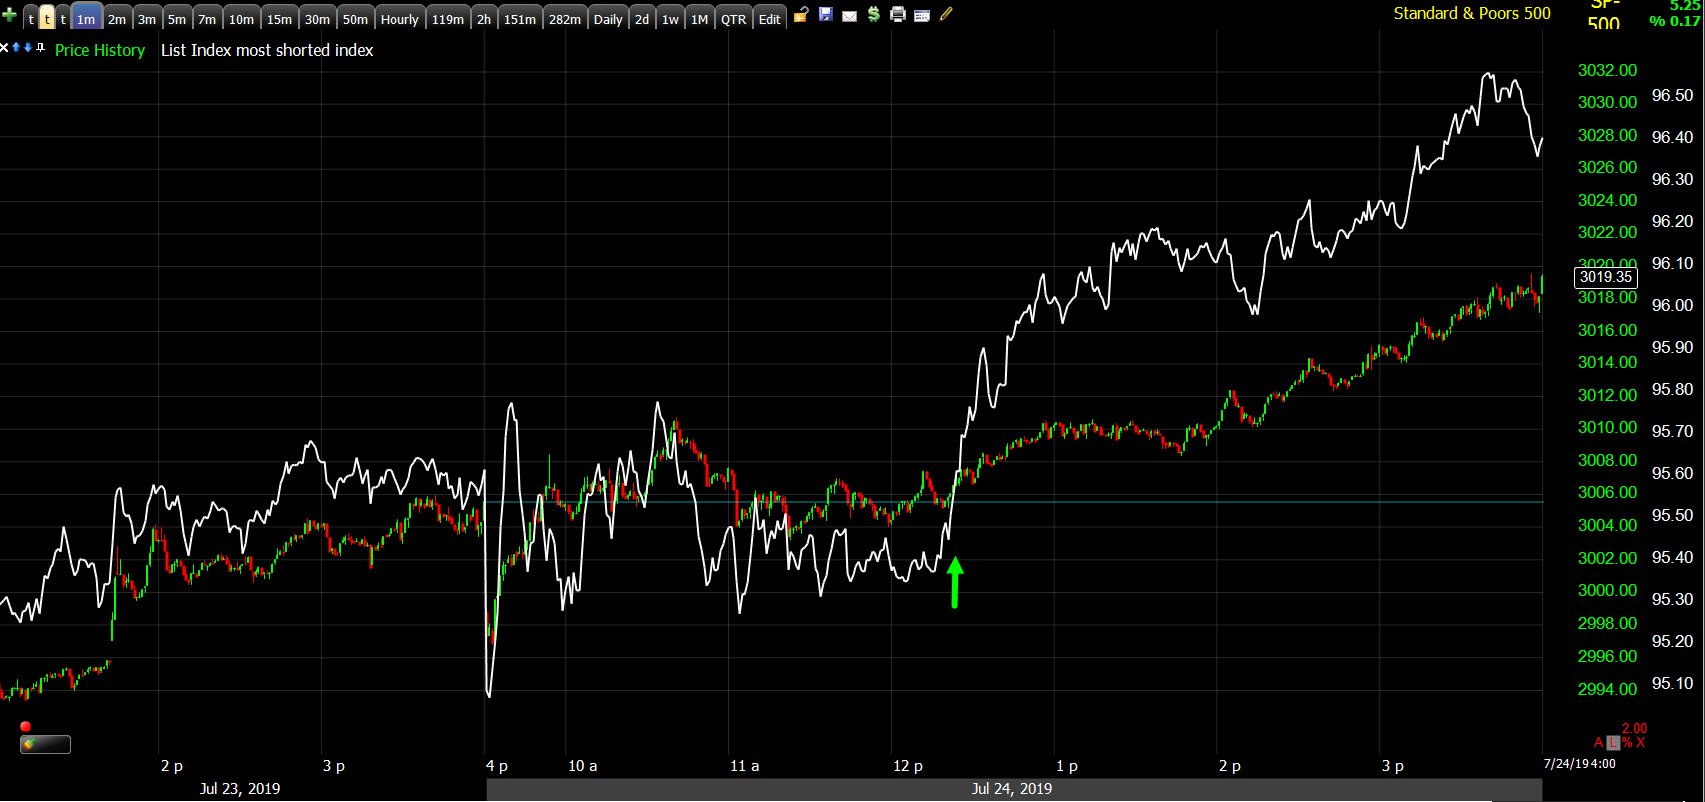
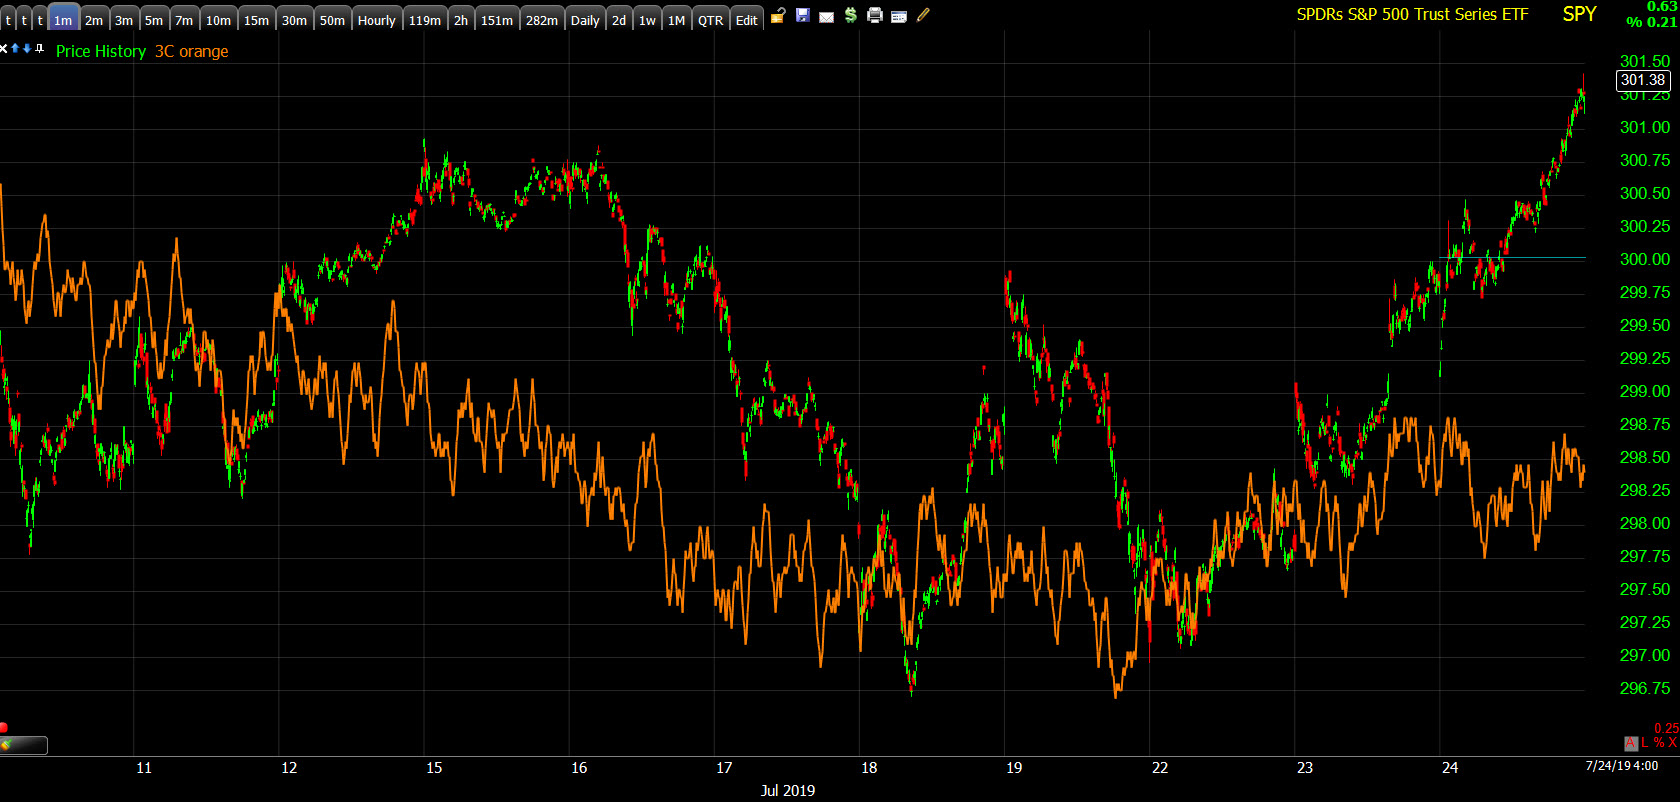
SP-500 (1m) and Most Shorted Index. Other than a small squeeze on Tuesday’s open, there have not been any substantial short squeezes for at least two weeks, until this afternoon (green arrow). If I replaced the S&P with IWM, it would look nearly the same as the most shorted index, which tells us where the bulk of the squeeze took place (in small caps stocks).
Dow Industrials were weighed on by the most heavily weighted Dow component, Boeing (BA -3.12%), dropping after initially having little reaction to earnings yesterday. The other Dow component weighing down the sector, Caterpillar (CAT -4.5%) after earnings this morning.
The Department of Justice probe announced last night (not to mention the FTC probe) of large cap technology companies on antitrust grounds, had no meaningful effect on the NASDAQ. The FTC also confirmed that Facebook (+1.4%) will pay a $5 billion fine for its privacy violations (the largest fine of its kind ever), but the stock still rallied heading into its earnings report after the close. Even Netflix (NFLX) that lost 15% since earnings, finally started to see some buyers today, closing up +3.46% after 9 consecutive days lower.
S&P Sectors
Eight of 11 sectors closed higher with a cyclical bias with Financials, Technology and Communications out-performing. The defensive and defensive oriented sectors were the worst performers. Materials, yesterday’s strongest sector by far, paused today (XLB $59.20 is key local support).
Materials ⇩ -0.07 %
Energy ⇧ 0.43 %
Financials ⇧ 1.03 %
Industrial ⇧ 0.43 %
Technology ⇧ 0.83 %
Consumer Staples ⇩ -0.67 %
Utilities ⇧ 0.08 %
Health Care ⇧ 0.05 %
Consumer Discretionary ⇧ 0.50 %
Real Estate ⇩ -0.08 %
Communications ⇧ 0.88 %
The banking index has shown recent notable strength, BKX closed up +1.5% and the smaller regional banks (KRE) closed up +2.4%. Discover Financial Services (DFS +9.06%) put in a strong performance after earnings. Along with small caps performance, this was one of the most constructive aspects of today’s trade as financials have been one of the more notable sectors to not to participate with the broader market. However, a day does not make a trend and that may change, see the chart below under the Treasuries section.
Even after mostly better-than-expected earnings last week, the Financial sector (XLF $28.58 +1.03%) has been trending sideways through July, like small caps. Today the sector broke out above the July lateral range, also like small caps. Now former resistance becomes key support for the sector at XLF $28.30 to $28.35. The next meaningful resistance zone is $28.75 to $29.
Semiconductors rallied on Texas Instruments’ (TXN +7.44%) solid earnings results as well as Intel (INTC 2.26%). The Philadelphia Semiconductor Index gained +3.1%, supporting the Technology sector.
The FANG stocks targeted in the Department of Justice probe were unfazed today: FB (+1.14%), AMZN (+0.32%) and GOOG (-0.73%) all gapped down, then raced back higher shortly after the open.
I posted a swing long trade idea for the Real Estate sector (XLRE) earlier today. I see no reason that REITs couldn’t work as well. The sector has pulled back 4% over the last two weeks to an area that’s last ditch support and put in a positive divergence. Since it’s last ditch price support, a stop can be placed very close to current prices to minimize risk and there’s at least a 3 to 1 reward over risk potential.
Internals
Internals started improving Tuesday, looked even better today. NYSE advancers ended at 2119 vs. decliners of 784 (+1335). This should be expected anytime small caps seriously outperform. NYSE volume was better at 777.5 mn shares. SPY and QQQ’s volume was unremarkable today, but IWM’s was impressive, higher yesterday on a small gain and higher today on a solid gain. DIA’s volume was a bit heavy on today’s losses.
Based on what I see above, I would normally expect a strong dominant price/volume relationship of Close Up/Volume Up for the Russell 2000, S&P-500 and NASDAQ 100 (not the Dow). Russell 2000 components did come in at the strongest relationship of Close Up/Volume Up, but it was not a dominant theme as none of the other averages did. Internals do not reflect a 1-day overbought condition.
Volatility
VIX was crushed today, actually starting yesterday.
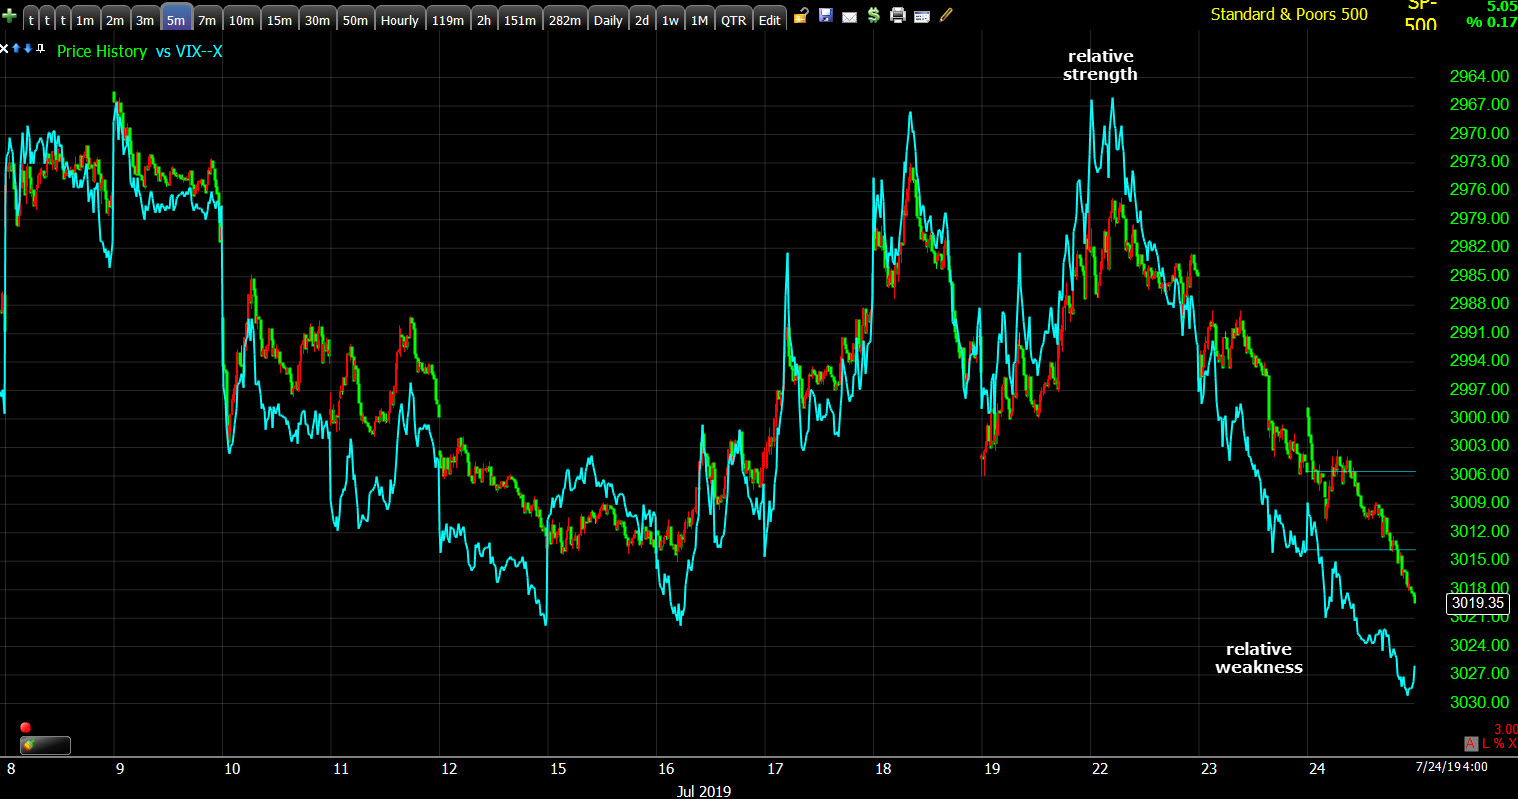
SPX (5m) inverted and VIX. This is just a rough depiction of the normal correlation. As mentioned late last week, VIX showed relative price strength, about 3% above what I expected. I thought that might be rolled off Friday to help deliver a strong close into the weekend, it didn’t happen. VIX’s relative strength was rolled off Monday and Tuesday, now showing very clear relative price weakness.
VIX futures had a positive divergence since yesterday, that was crushed today. However, VXX (cash market ETF) which also built a positive divergence yesterday, added to that during today’s price decline, moving to a slightly stronger 2 min. chart.
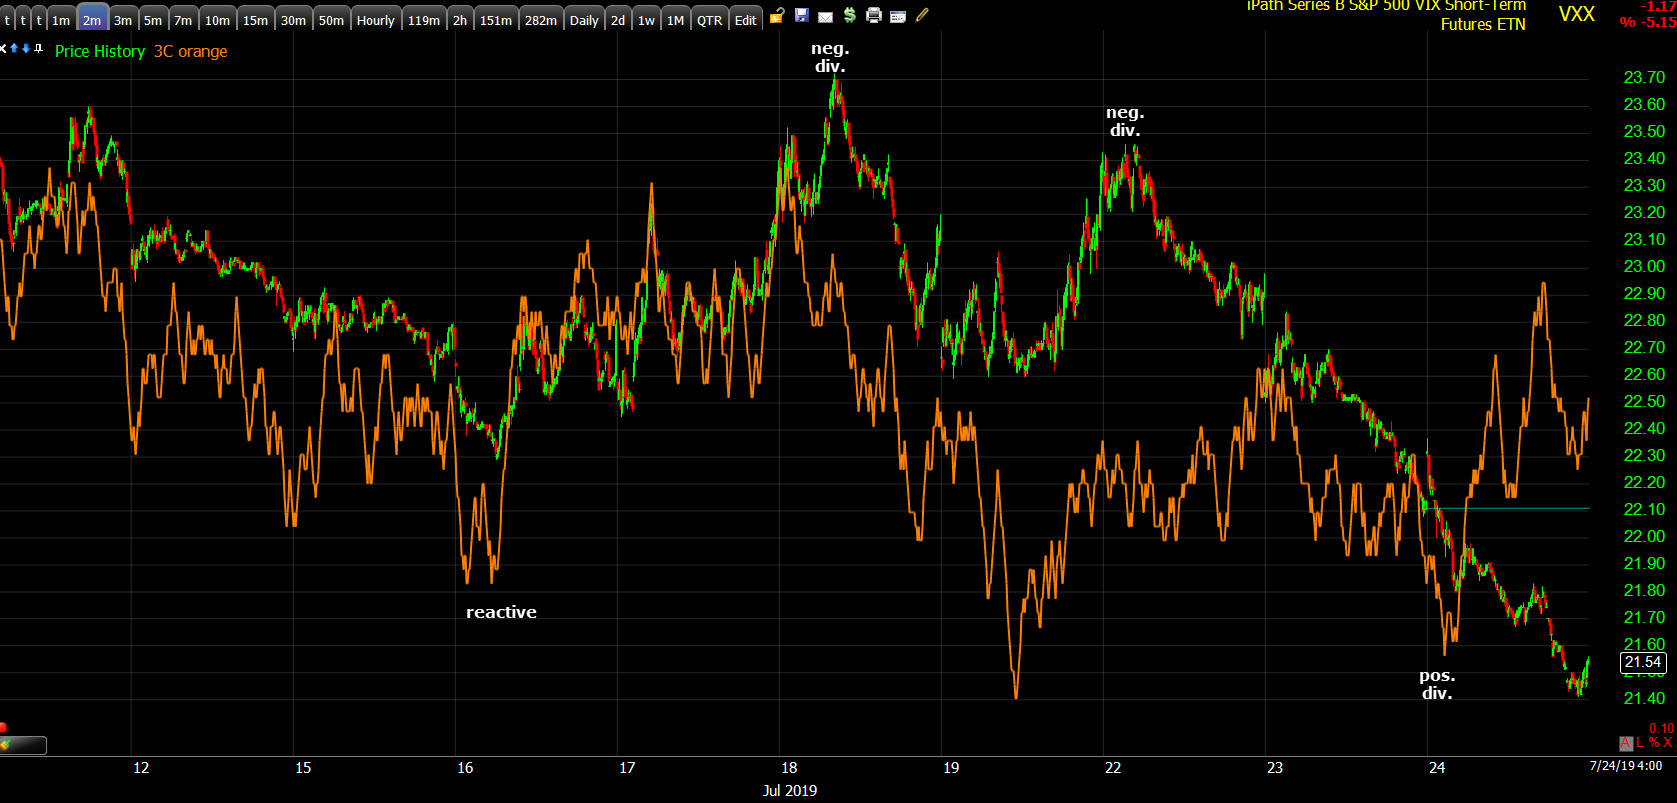
VXX (2m) moving up on July 16th, coming off last Monday (July 15th) record high. There’s a negative divergence at Thursday’s high (Fed’s Williams’ comments saved the market). VXX remained negatively divergent into Monday morning. The positive divergence started on the 1 min charts Tuesday and migrated to the stronger 2 min charts today.
There has been no sign of hedging downside equity risk, unlike the second week of June until the G-20 (July 1), after which volatility hedges were dumped instantly. That’s a little surprising given earnings.
Leading Indicators
Roughly half of the dozen leading indicators I follow on a daily basis, most of which have been supportive of the S&P since June, have begun negatively diverging from the S&P.
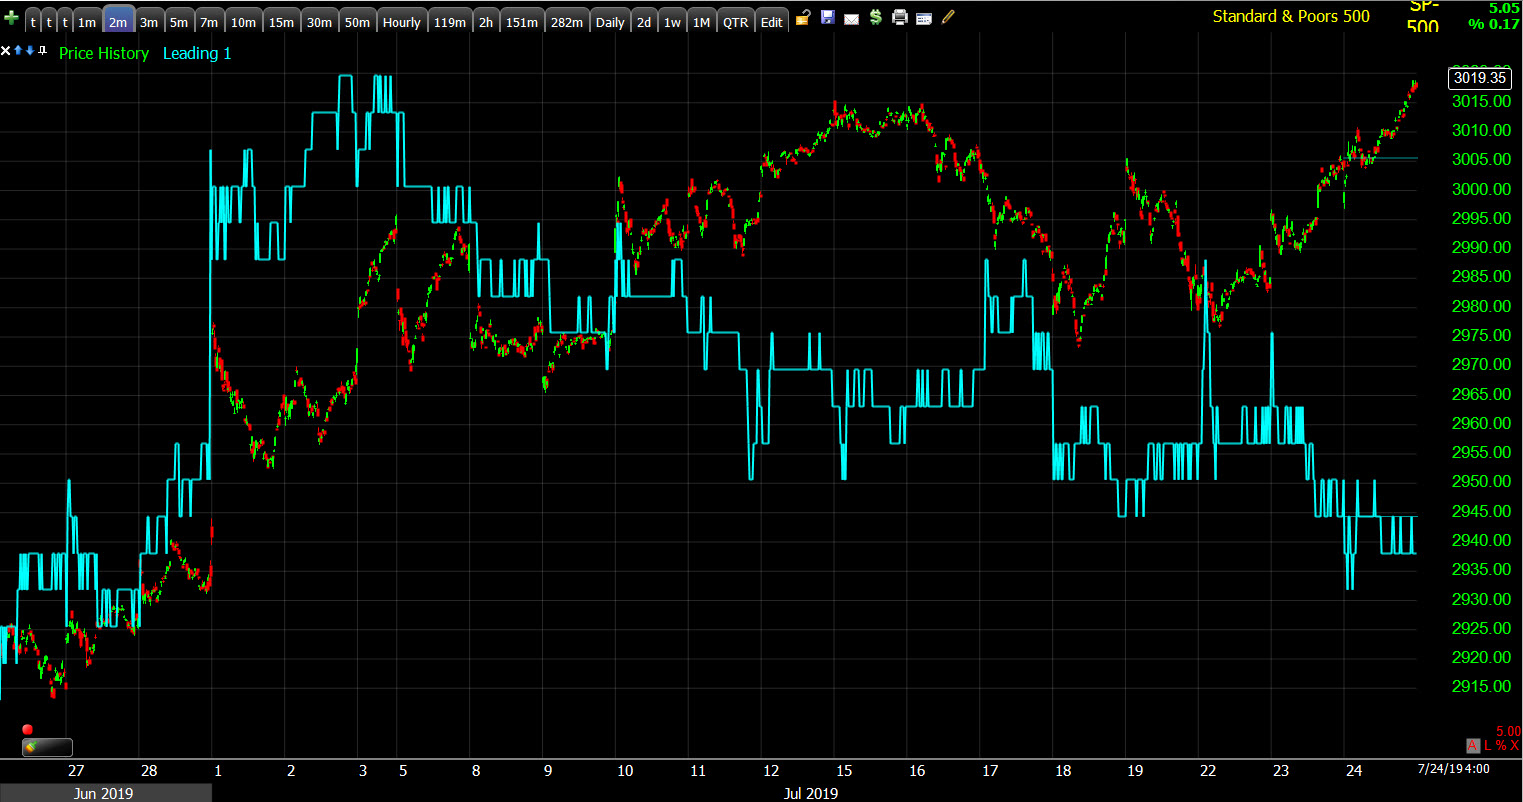
SPX (2m) the month of July. You may remember High yield credit (HYG) did not confirm throughout July, similar to small caps. Starting Monday of this week HYG has been one of the more constructive leading indicators, along with investment grade credit. Although HYG has not made a higher high since June 20th, not confirming any of the S&P’s new highs since. Above is another that had been very constructive since June, but diverging with the S&P into last Monday’s S&P record high, and continuing to make lower lows this week. About half of the leading indicators are tracking the S&P (HY and IG credit), and half are diverging, whereas all were either tracking with, or leading the S&P higher in June. Each of them are different, some are more closely related to crude/Energy like HY credit, some are more closely tied to treasury yields, and others have a broader overall application. Generally in a strong market such as early June, all confirm or lead the S&P higher.
If the break in crude’s consolidation today holds, I’d expect HY credit (HYG) to start moving lower due to its heavy exposure to energy companies’ credit/debt.
Treasuries
U.S. Treasury yields finished lower on Wednesday. The 2-year yield declined one basis point to 1.82%, and the 10-year yield declined two basis points to 2.05% in curve flattening trade. Financials and yield curves have been moving in lock-step with each other since July 12. I pointed out yesterday’s yield curve steepening and how closely the banks were following. That changed today today with curve flattening.
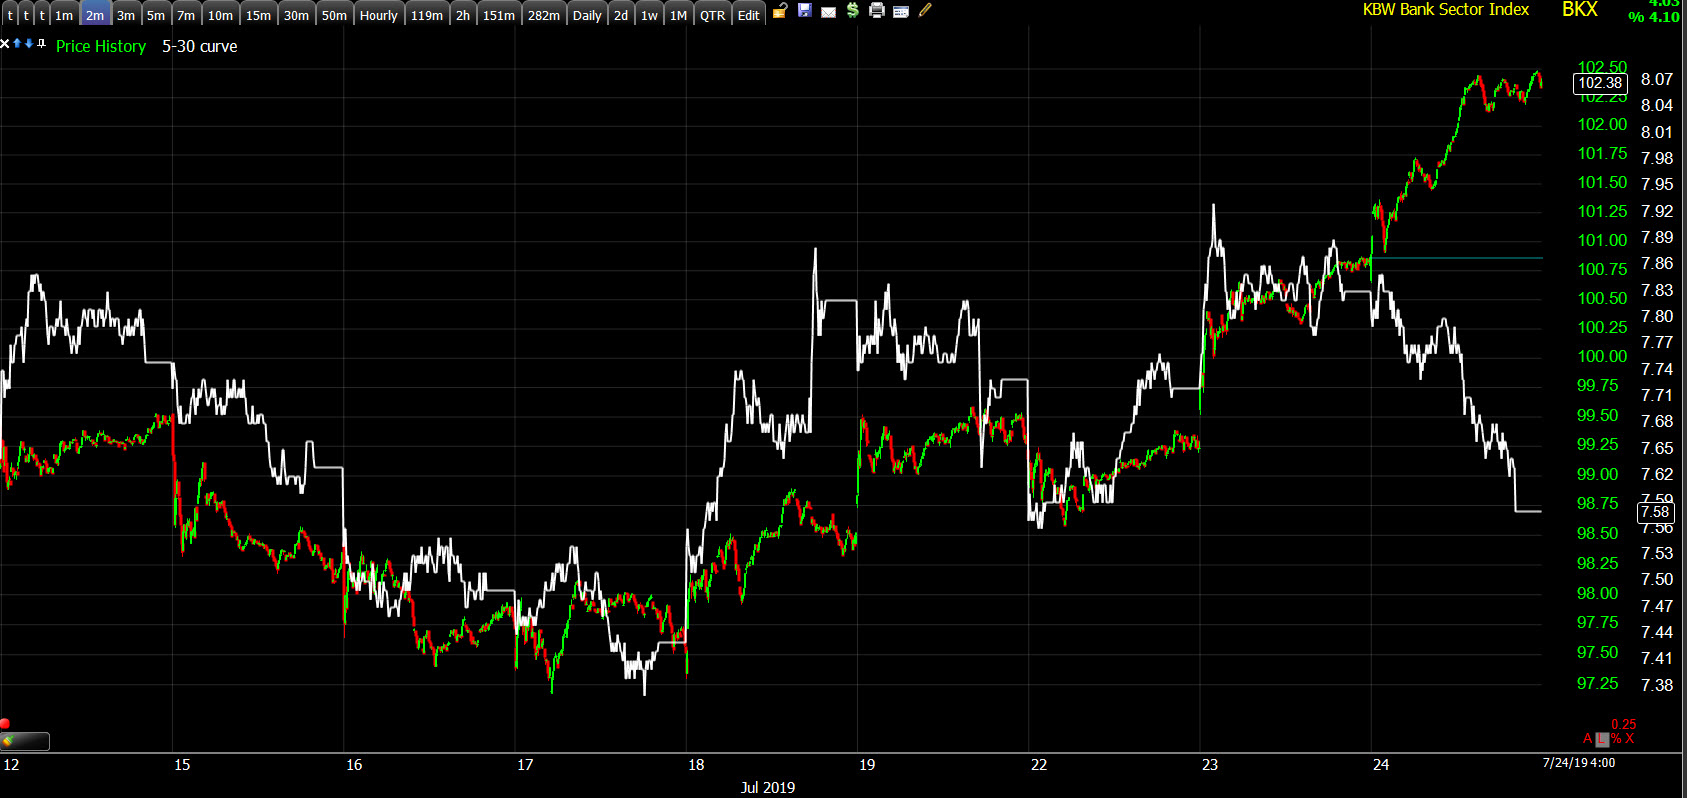
BKX/KBW Bank Index (2m). The banks have been moving in lock-step with yield curves from July 12. Today the curve flattened while banks kept moving higher, opening up a divergence between the two. Generally I’ve noticed changes in the direction of the curve tend to lead banks/financials by 2-3 days. Overall this is a net negative for the Financials sector and banks’ amid strong recent gains, especially if the curves flatten more.
Currencies and Commodities
After a 3-day winning streak, the U.S. Dollar Index closed unchanged at 97.72.
WTI crude lost -1.4% to $55.93/bbl.
Crude oil spiked higher after oil inventories this morning, but then turned sharply lower on news that Kuwait and Saudi Arabia will coordinate to resume oil output from the neutral zone shared by the nations. I’m surprised crude has not acted better in the face of escalation between Iran and the U.K and U.S.
Crude broke below a small 4-day consolidation trend that I mentioned earlier today that looked like a bear flag. The post, Small Caps/Banks Lead. Energy and Crude Bear flag? was posted about an hour before Crude broke under the 4-day bounce’s trend.
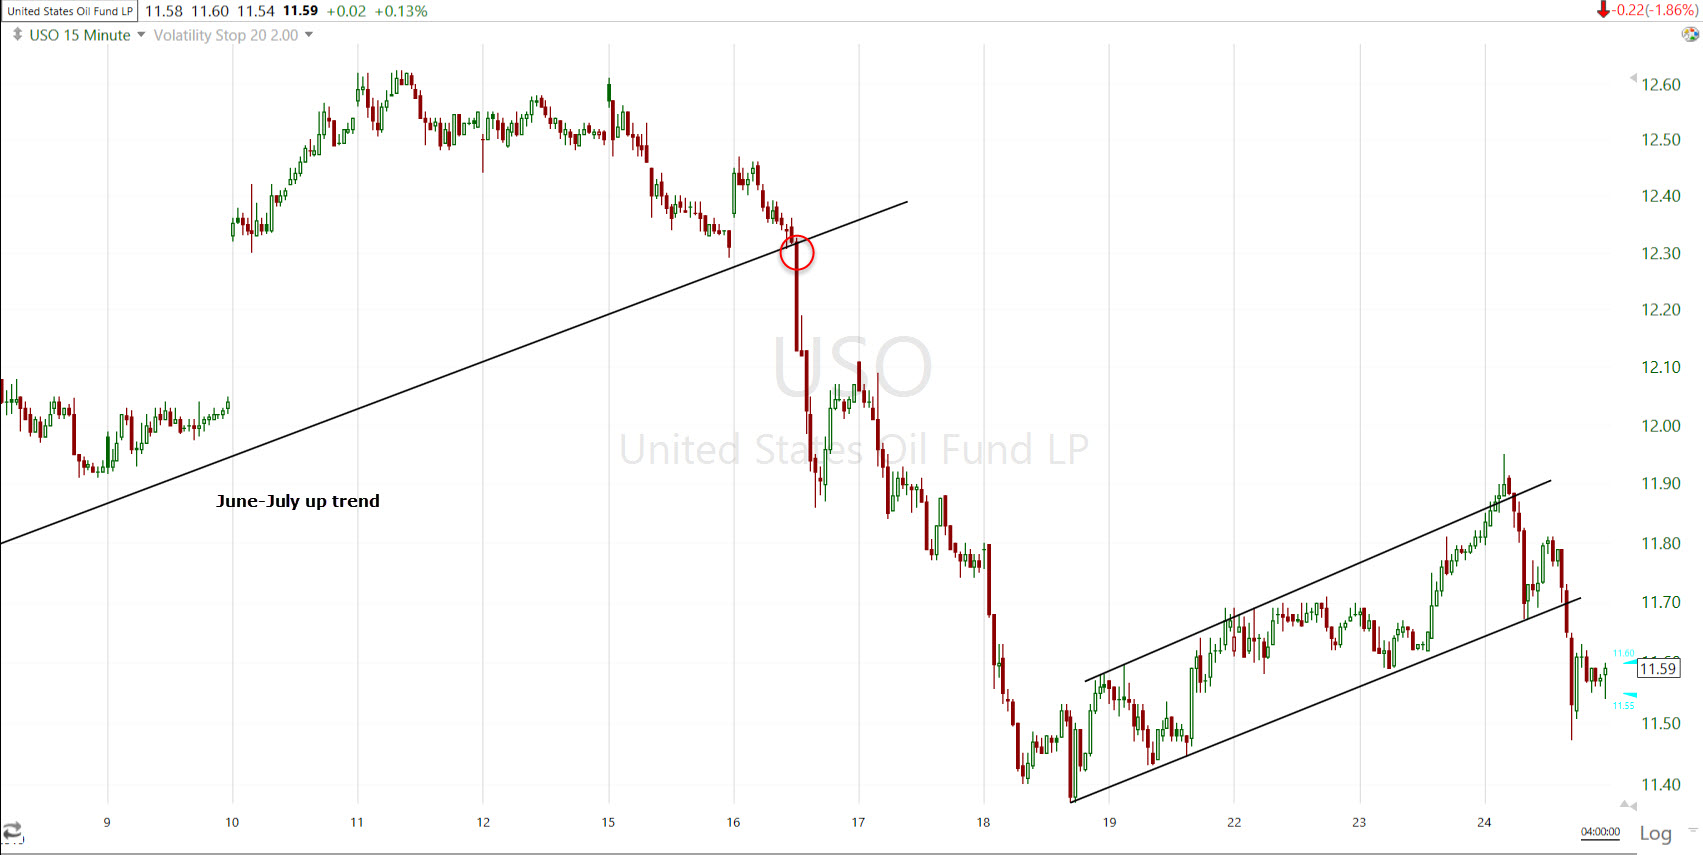 USO/Crude (15m) breaking the June-July uptrend early last week, and consolidating in a bearish flag the last 4 days. Crude broke below the flag despite reacting well to oil inventories this morning.
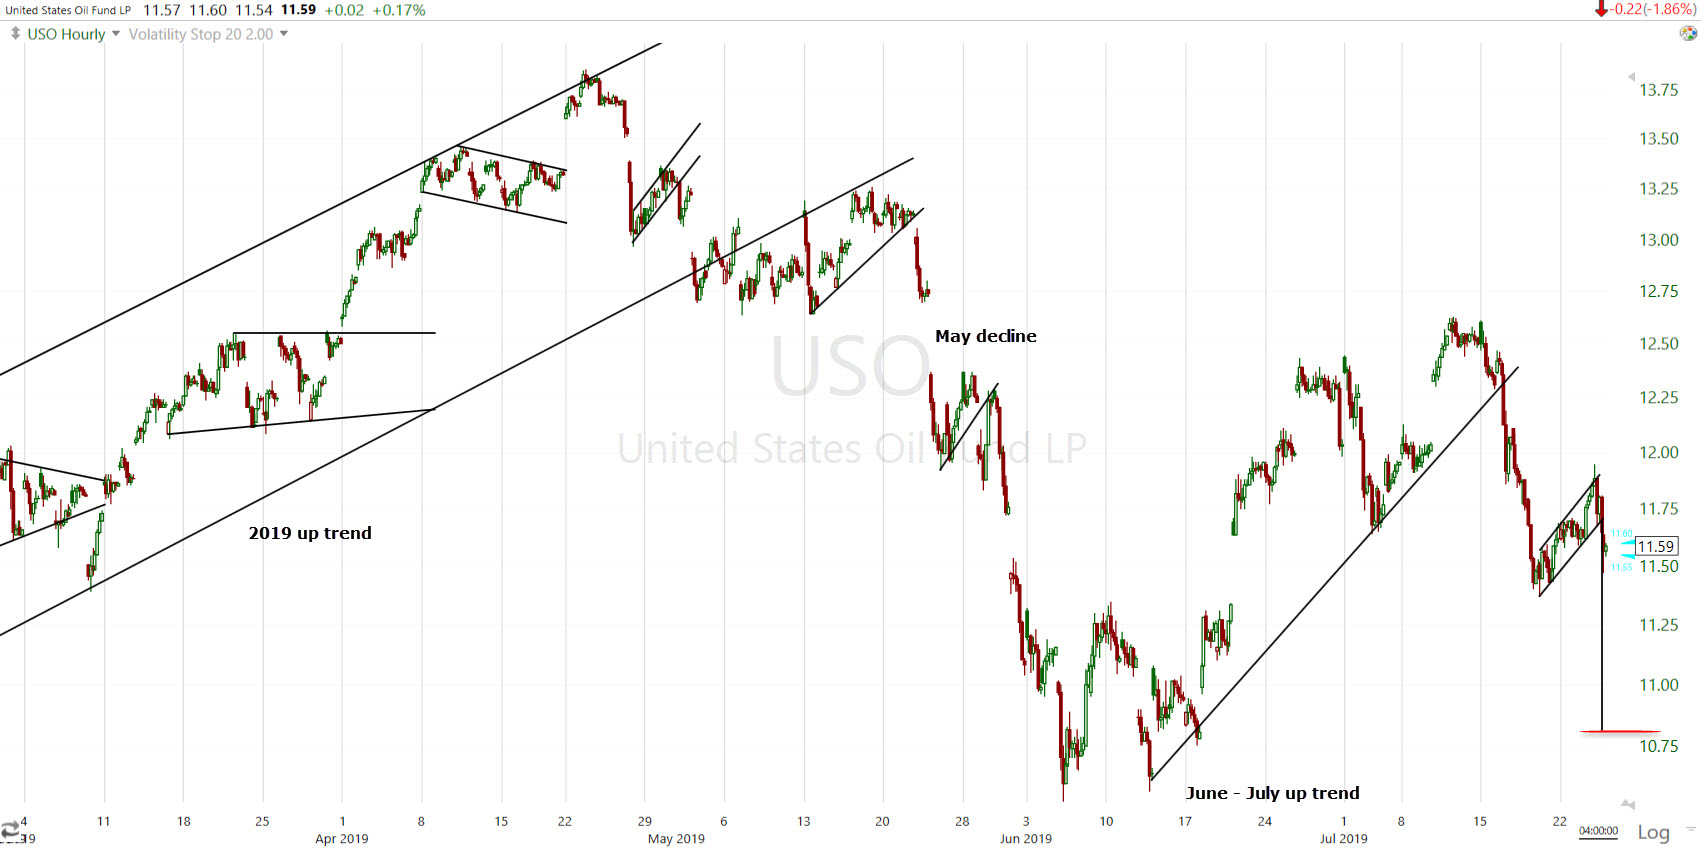 USO/Crude (60m) with several different trends including the major 2019 uptrend, broken in May, the June/July up trend broken last week, and a bear flag consolidation broken today. My measured move targets for a flag breakdown is (USO) $10.80, or about 7.5% lower.
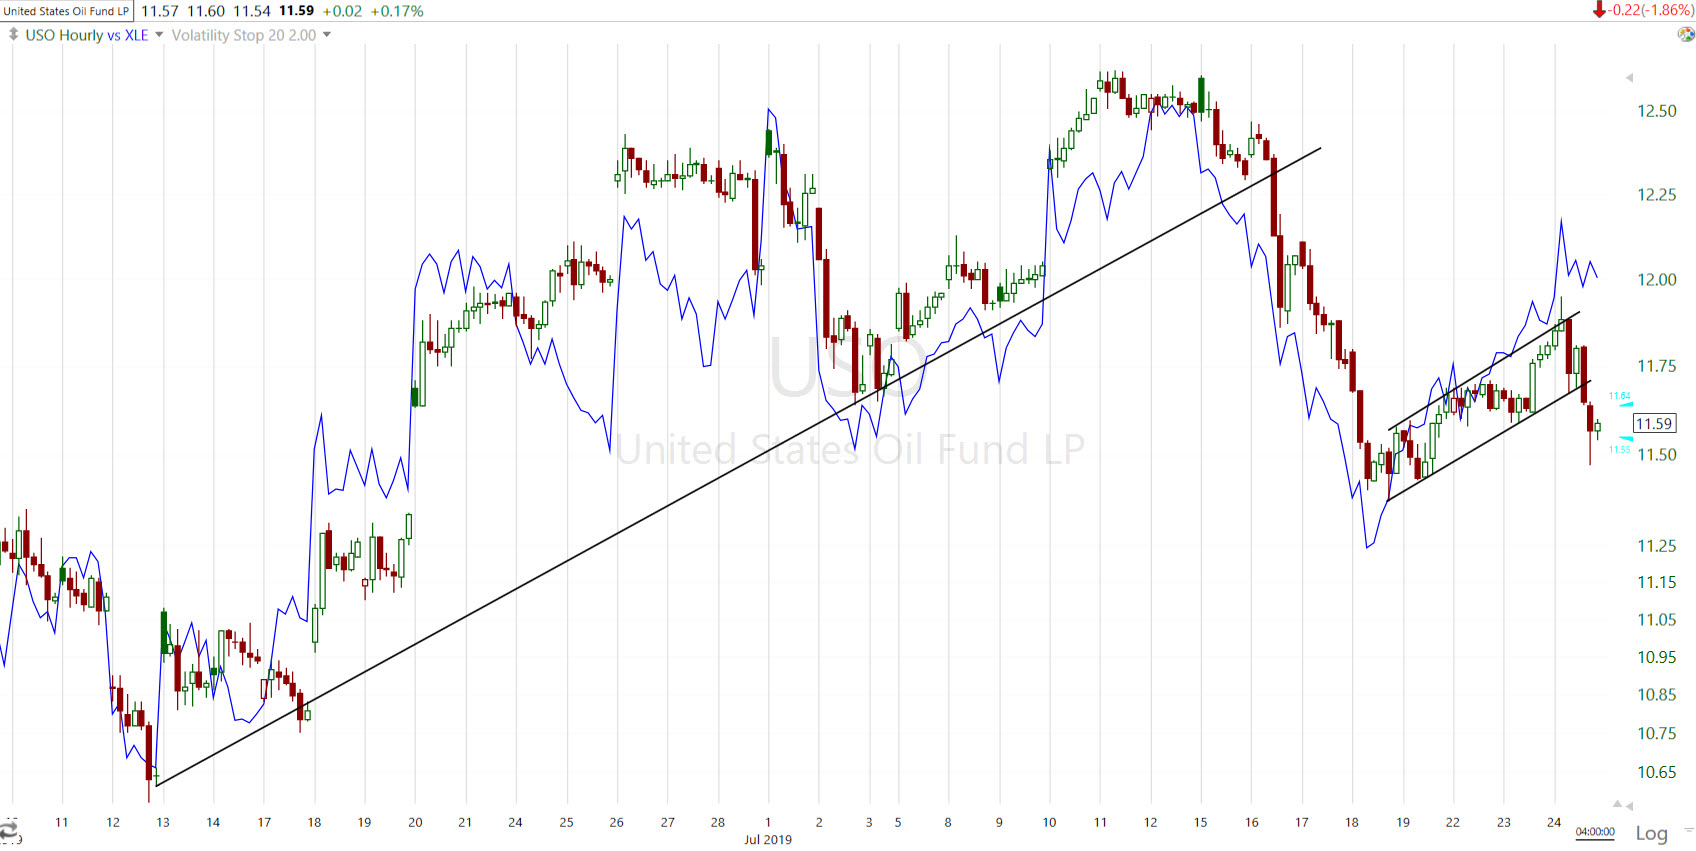 USO (60m) and XLE/energy sector (blue). Note how closely the energy sector tracks crude prices. Energy was one of today’s leaders, not breaking the trend yet which makes it an interesting trade on the short side as crude broke the flag trend.
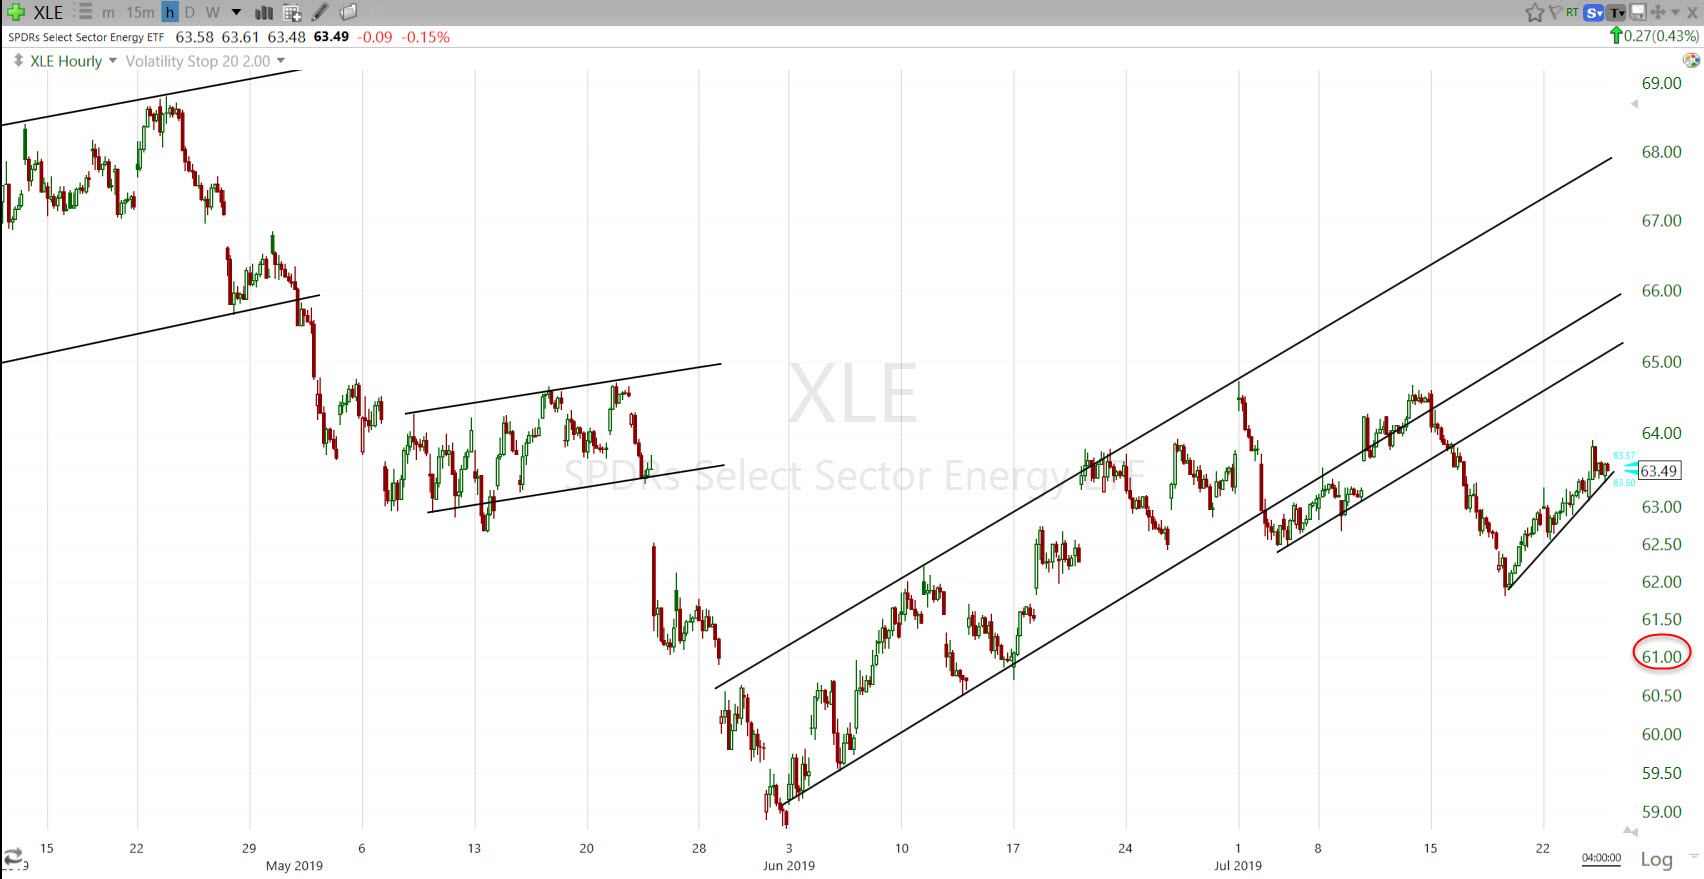
XLE (60m) flag-like consolidation after breaking below the June/-July up trend with the rest of the market. My measured move targets are between $60.30 and $60 from here for XLE.
While crude ended lower, gold gained and silver continues to outperform, making a new 13 month high since the run up starting last week.
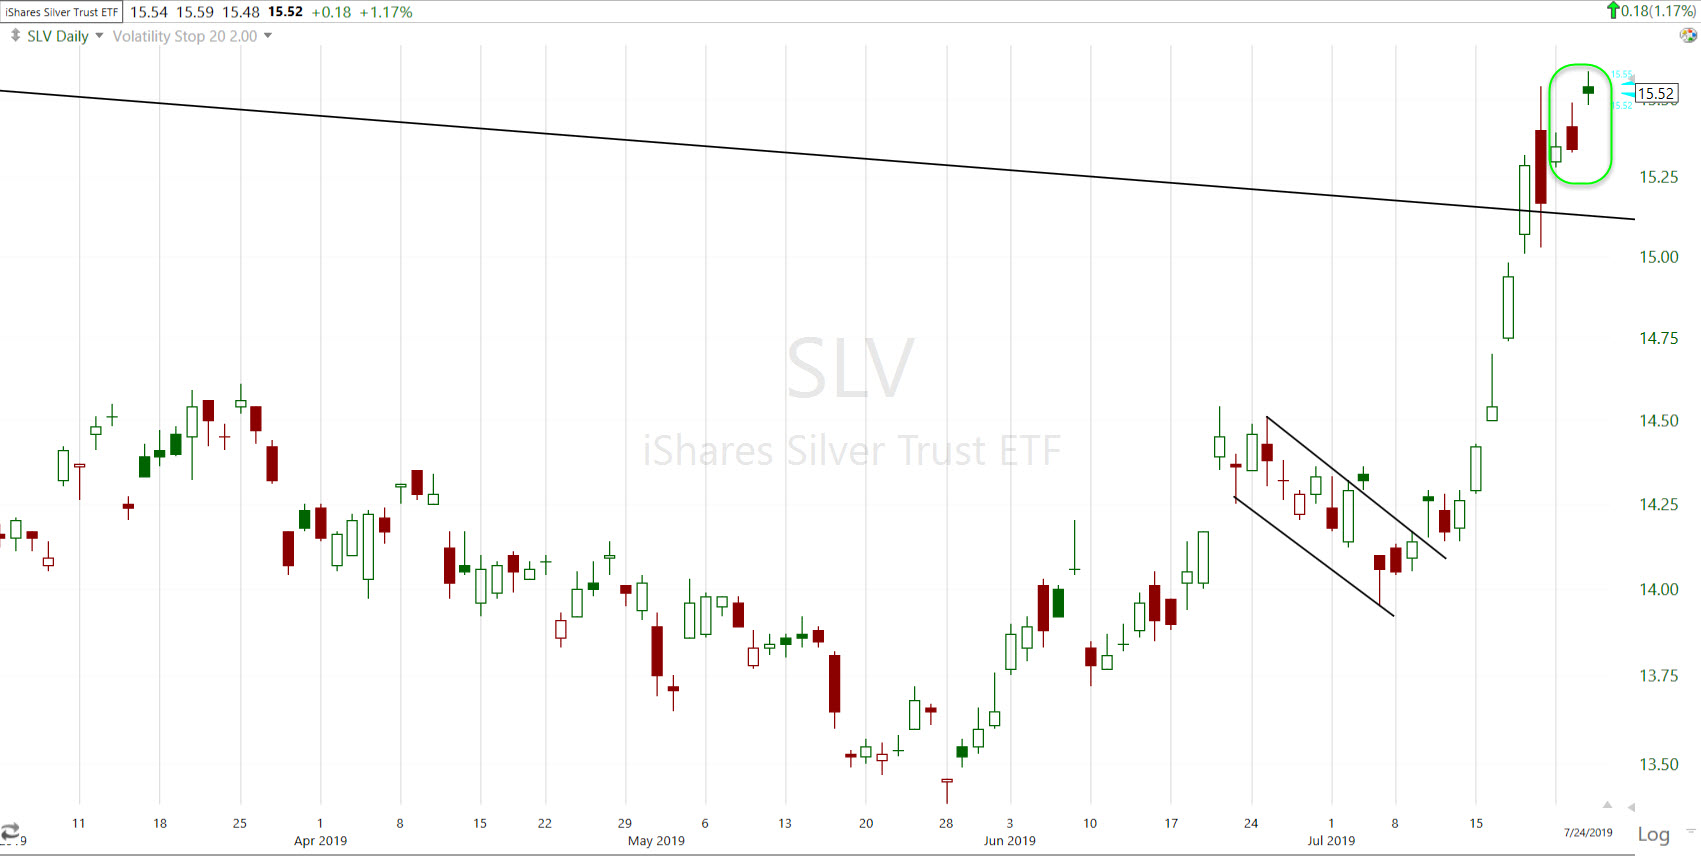
SLV/silver ETF (daily) adding +2.3% since Friday’s close. That’s 8 consecutive days silver has outperformed gold after reaching a 26 year low against gold just weeks ago. Silver has been doing some serious catching up to gold’s 2019 out performance.
Gold hasn’t added anything, but it hasn’t done anything wrong either.
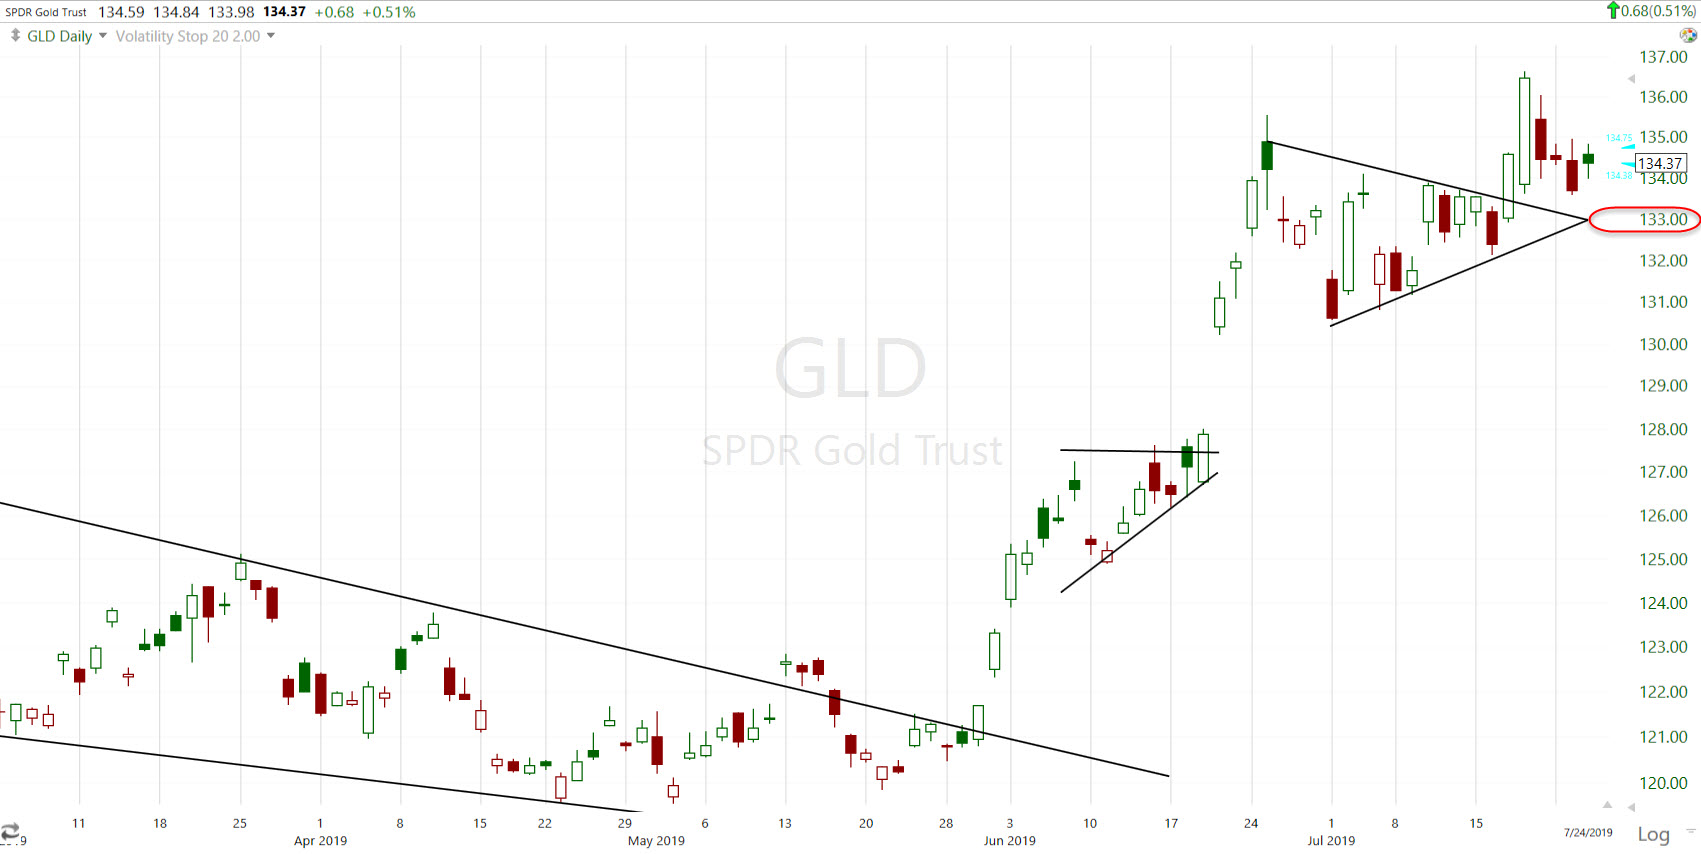
GLD (daily) last week silver dragged gold higher, outperforming the yellow metal for the first time in a long time. I don’t like that gold’s breakout attempt from a symmetrical triangle did not follow through. Still, for those who wish to remain long, I don’t blame them. Personally I would have a stop below GLD’s triangle consolidation’s apex around $133 (red).
GLD’s current price action is similar what happened to TLT mid-June with an attempted breakout from a symmetrical triangle that failed to follow through, only to form another triangle, and another subsequent breakout attempt resulting in a clear failed breakout and a sharper downside reversal.
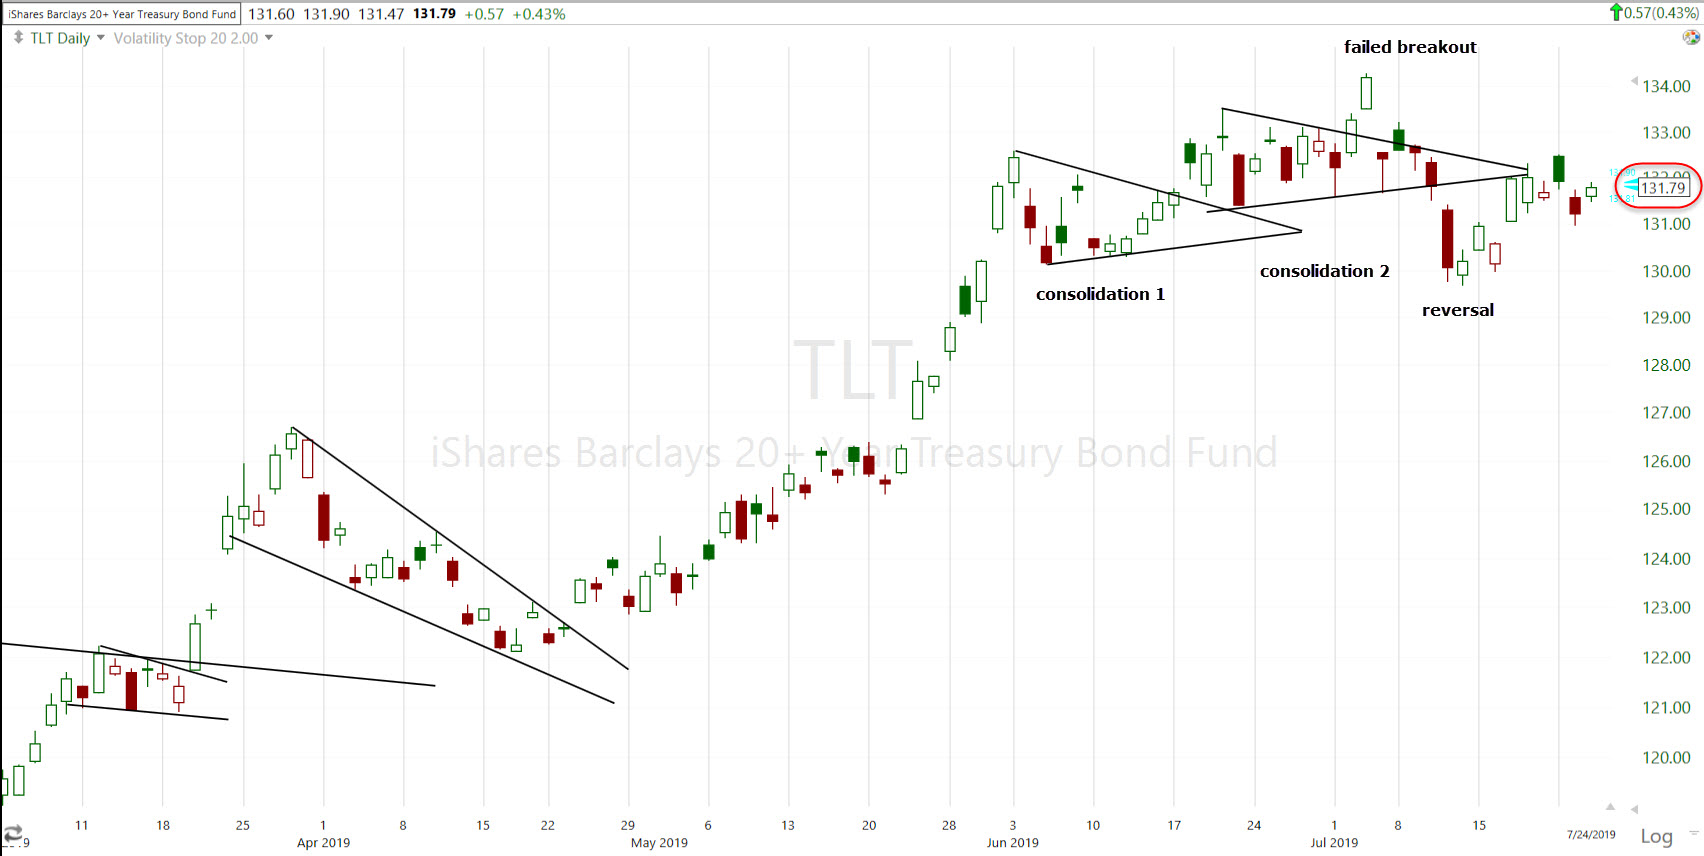
TLT (daily). After the failed breakout and fast reversal, 3C gave signs of support for a bounce on July 12th, with a subsequent target of $132 which TLT reached last week. I don’t have any updated views on TLT’s near term direction since it hit the upside target, not much has happneed on 3C. Before the bounce, I expected a pull back to at least $128. If I see some short term weakness on the 3C chart soon, that’s where I expect it will go and that’s where I’d be interested in being a buyer again.
I’m not concerned about either GLD or SLV’s 3C charts near term. They’re not super constructive, but also haven’t done anything wrong beyond reflecting consolidation probabilities. SLV’s 3C chart has been reflecting that the past few days.
Summary
If earnings season isn’t strange enough with its typically range bound trade with sharp moves up and down on individual earnings, at least until the larger earnings trend appears, we also have the summer doldrums, and the late cycle central bank easing dynamic. The latter is best summed up as, “the worse the economic data, the higher the expectations for central banks to ease policy”. Or said another way, “the worse the economic data, the more stocks can rally on easing hopes”. I’ve seen this for 2 decades and I never get use to it. It defies conventional wisdom. If I had told you a week ago that European manufacturing PMIs this morning were going to be the worst in 6 years, and the U.S. manufacturing PMI was going to be the worst reading in a decade, a rounding error away from contraction, you might have reasonably concluded that the market reaction would have been negative. Instead ECB rate cut odds soared this morning, and the data supports the Fed’s July rate cut which stock love.
As shown in the weekend video update about 2 weeks ago, late cycle dynamics can be odd, and run counter to conventional wisdom.
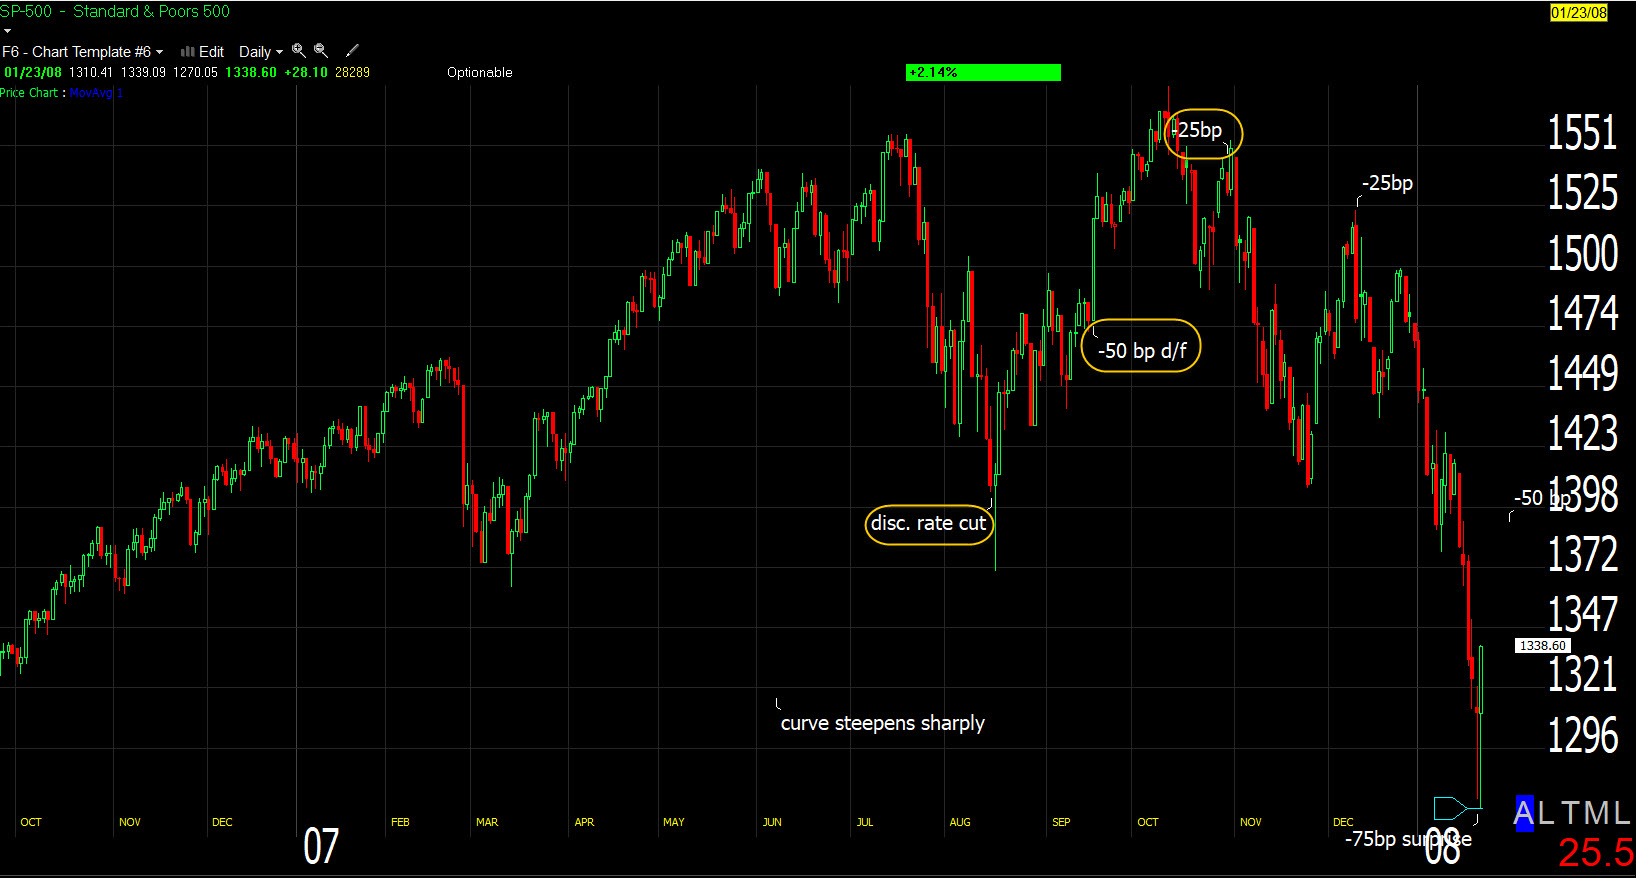
SP-500 (daily) rolled back to the 2007 S&P record high in October, as the Fed started cutting the discount and Fed funds rate. After the first cuts the S&P went on to make a new record high. Then the bear market started, eventually wiping out all of the bull markets gains and then some.
The last two economic cycles went into recession 3 months after the first Fed rate cut. In 2007 that was just a couple of percent off the S&P’s all-time record high. Tricky and deceiving markets. Most people can’t fathom the possibility of a recession as the S&P makes new record highs every week or so. For some perspective…
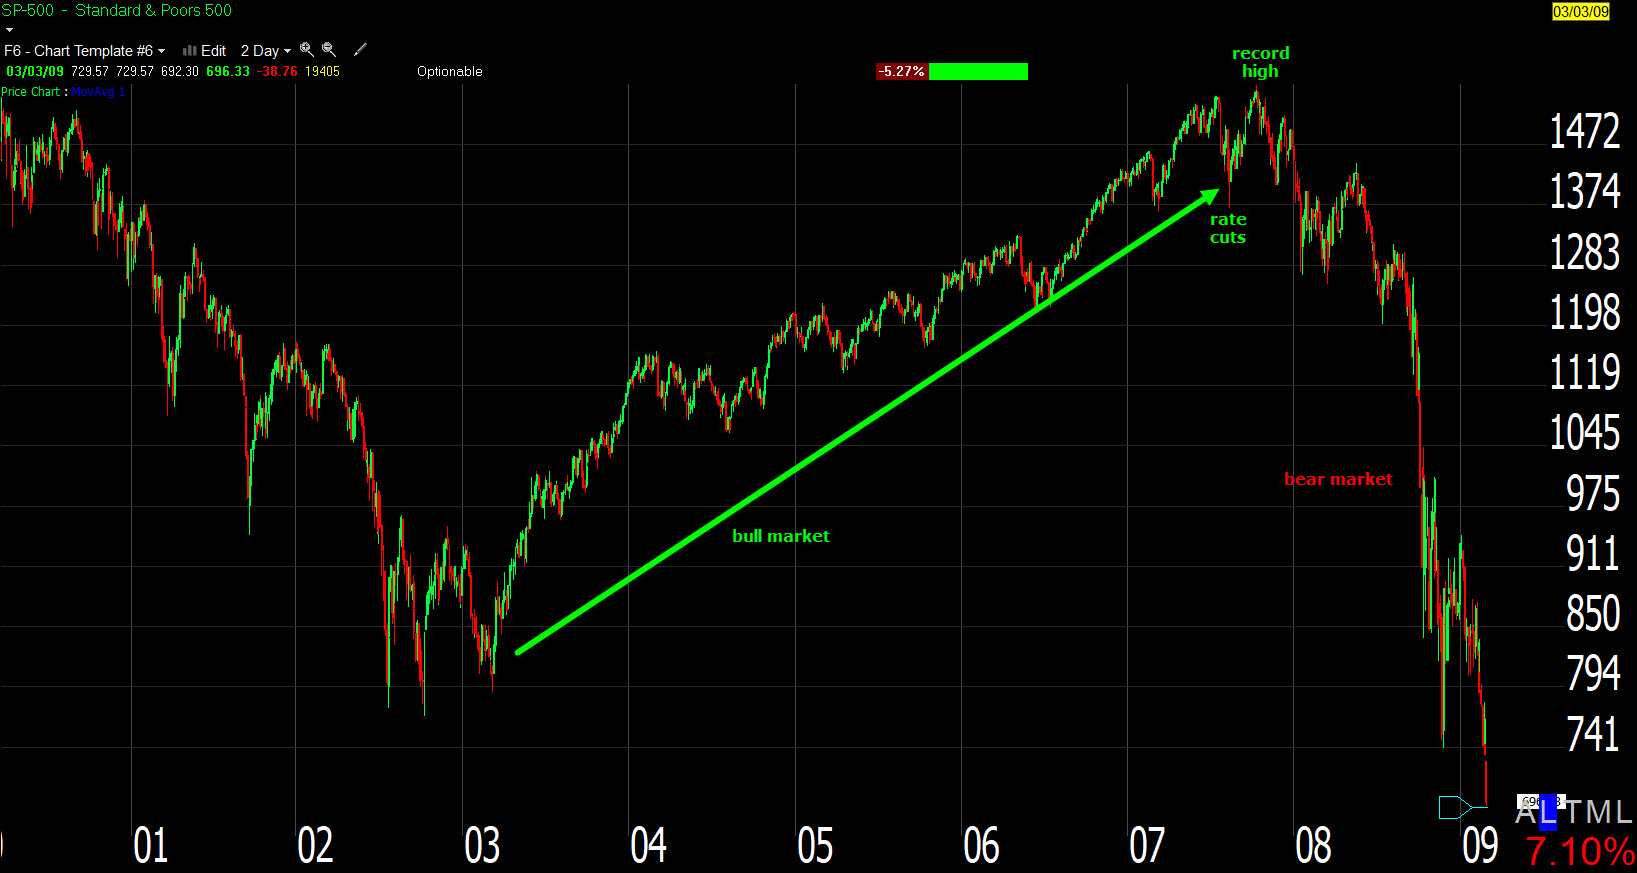
The bear market retraced all of the prior bull markets’ gains and then even more.
It’s not unprecedented for the market to gain more and celebrate initial Fed rate cuts. That’s not to say that this is the rule either. The first rate cut at the dot-com bubble top was almost 9 months after the high. It’s just to say that it’s not unprecedented.
The main market narrative now is that the Fed’s rate cut will offset any weakness currently developing and if the trade war escalates, the Fed will cut further to offset that weakness, or… “The Fed has out back”. The other narrative is that the expected July rate cut is just an insurance rate cut, just in case, like 1996 and 1998. The key difference is that at no time during the 1990’s did the bond market price in a recession ( yield curves did not invert). Yield curves have inverted before each of the last 5 U.S. recessions.
I updated the 3C charts for the averages earlier today. A little surprising, there was little change as of the close as the averages gained the most after 2 p.m.
 SPY (1m)
IWM (1m)
Overnight
There have been some less than stellar earnings reactions, a few include: Bristol Meyers Squibb (BMY -3.66%), Spirit Airlines (SAVE -13%), Ford (-5.85%), Tesla (TSLA -10.8%), Las Vegas Sands (LVS -2.9%), Paypal which gained +0.9% in the cash session to an all-time new high (PYPL -4.1%), and Facebook (FB) initially surging +5.8%, then retracing all and dropping -3.6% and currently +0.9%.
S&P futures are down marginally (-0.05%) and still in line with today’s price gains. NASDAQ 100 futures have been erratic and chaotic on 3C charts since Tuesday night and still are, down -0.30%.
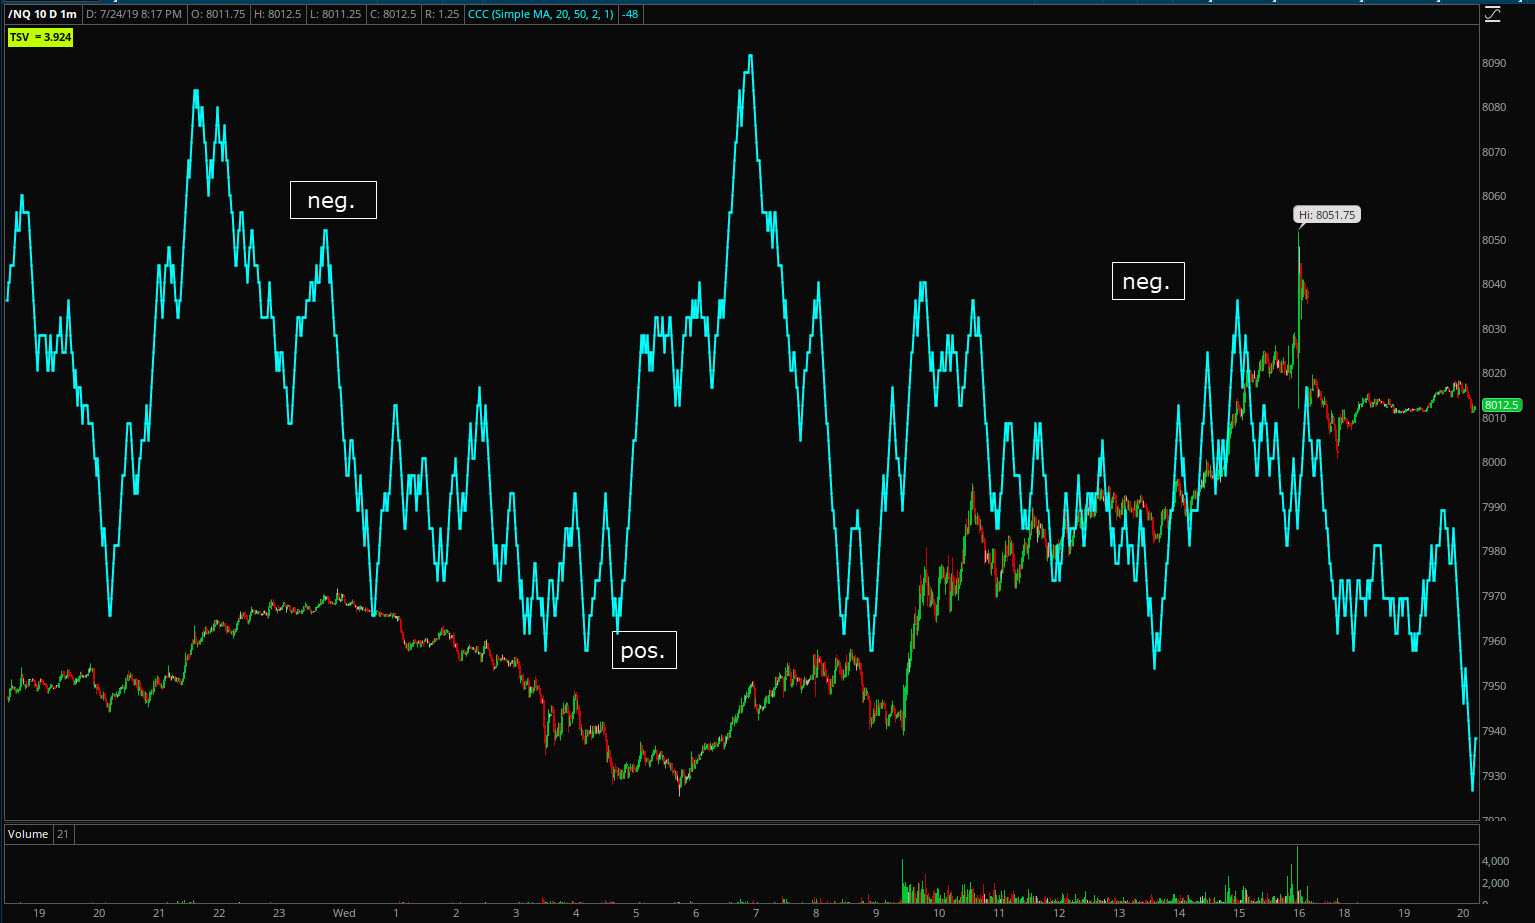
NQ (1m) I posted a chart earlier today that was scaled better. The chaotic price and signals have skewed things. There was a negative divergence Tuesday night, a positive divergence early Wednesday morning well before the open, and a negative divergence into the cash session. Since the close the negative divergence is starting to lead lower.
Crude futures are unchanged and the chart is unremarkable into the overnight session.
Gold and silver futures are near flat, also unremarkable charts tonight.
Euro futures look like they’ll continue to move lower overnight. Remember the ECB’s policy statement is tomorrow morning. As such the U.S. dollar should move higher overnight.
I would lean toward some slight weakening in futures overnight based on what I see now. Remember the ECB meeting and policy statement is out tomorrow morning. After the dismal PMI’s traders upped bets on the ECB being even more dovish than previously expected, so that could be an important event for the market in the early going.