Daily Market Wrap – March 4, 2020
Joe Biden’s Super Tuesday performance over Bernie Sanders lifted index futures overnight and sent Health care stocks and the sector higher today. Yesterday as the market was down following the Fed’s emergency rate cut, financial pundits mostly thought it was a mistake. With the market green today their tune changed. It’s amazing how much perspective changes depending on whether markets are green or red that day. However, even as stocks fell after the rate cut, credit markets looked good Tuesday and that continued early this morning, leading the S&P higher.
After the opening gap up stocks traded sideways in a small range…
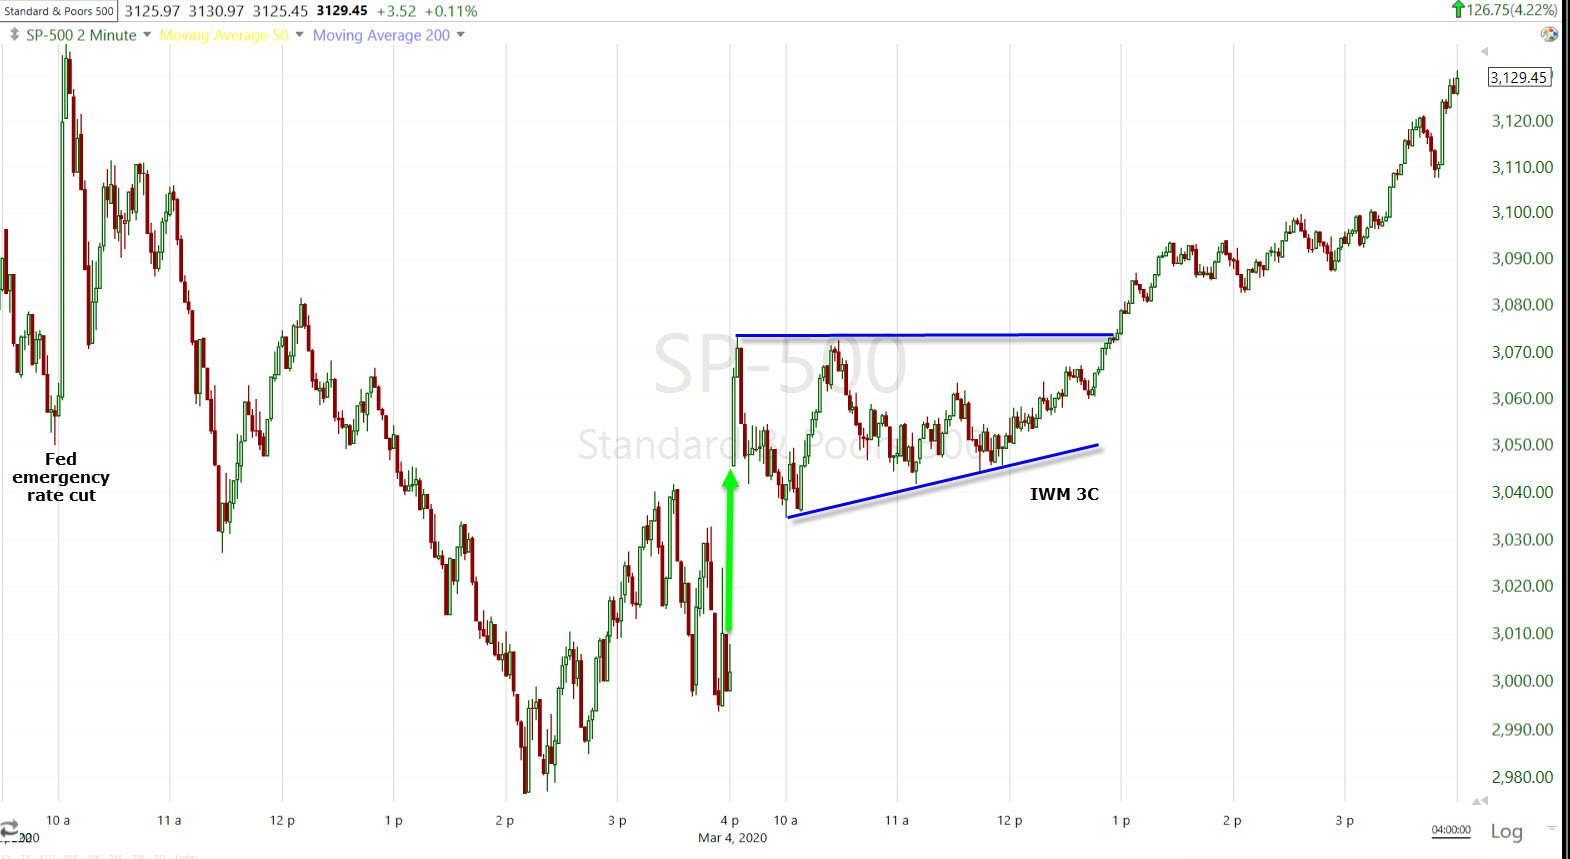
SP-500 (2m Tuesday/Wednesday)
Small Caps were a laggard from the open, but Small Caps/IWM’s 3C chart improved after noon time and the broader market followed to run higher into the close.
The Treasury market did not share the optimism of the stock market, though midday action saw Treasuries back down from their highs as equities rallied to best levels of the day.
In economic data,
- The ADP Employment Change report came in better than expected pointing to 183,000 nonfarm payrolls added in February (consensus 165,000) while the January reading was revised down to 209,000 from 291,000
- The weekly MBA Mortgage Index spiked 15.1% to follow last week’s 1.5% increase. The Refinance Index spiked 26.0% while the Purchase Index fell 2.7%
- ISM Non-Manufacturing Index for February beat estimates and increased to 57.3 (consensus 54.8) from 55.5 in January, which is well before any impact from the virus, but it showed the services economy came into the period with a decent head of steam.
- The Federal Reserve’s March Beige Book noted that activity expanded at a modest to moderate pace during the survey period, though St. Louis and Kansas City reported no growth. Consumer spending increased, but in uneven fashion. There was no significant growth in tourism with early indications of reduced activity due to the coronavirus.
Also the Bank of Canada (BOC) joined in global central bank easing and surprised by cutting rates by an unexpected 50bps, from 1.75% to 1.25%.
Averages
The major averages erased Tuesday’s losses. The Dow outperformed due to health care names most of the day. NASDAQ was more of a laggard this morning, but Technology started to improve this afternoon led by semiconductors. Small Caps were the weakest performer on a relative basis, but their 3C chart improved after noon time.
S&P 500 ⇧ 4.22 %
NASDAQ ⇧ 4.13 %
DOW JONES ⇧ 4.53 %
RUSSELL 2000 ⇧ 3.04 %
I posted some levels of interest this afternoon starting with what Noruma’s quant identified as a CTA re-leveraging level (SPX 3079). And some closing levels, of which 3096.46 (Tuesday’s open) was significant in that a close below would have posted an inside day and took some of the shine off today’s advance.
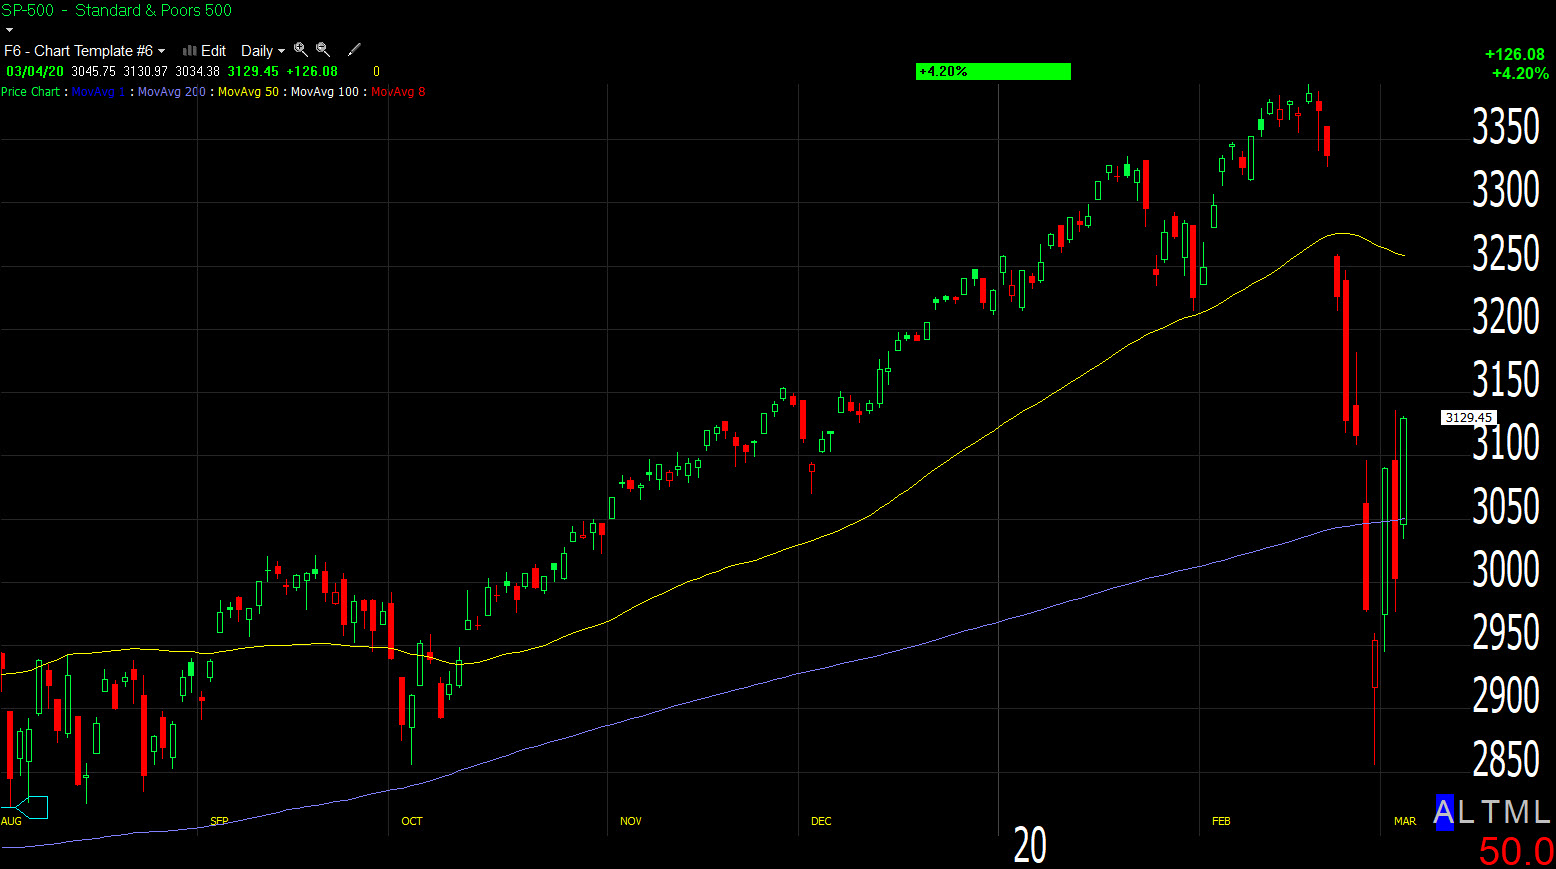 SP-500 (daily) made a higher closing high and closed at the high of the day, both very constructive. A higher intraday high would have been even more constructive.
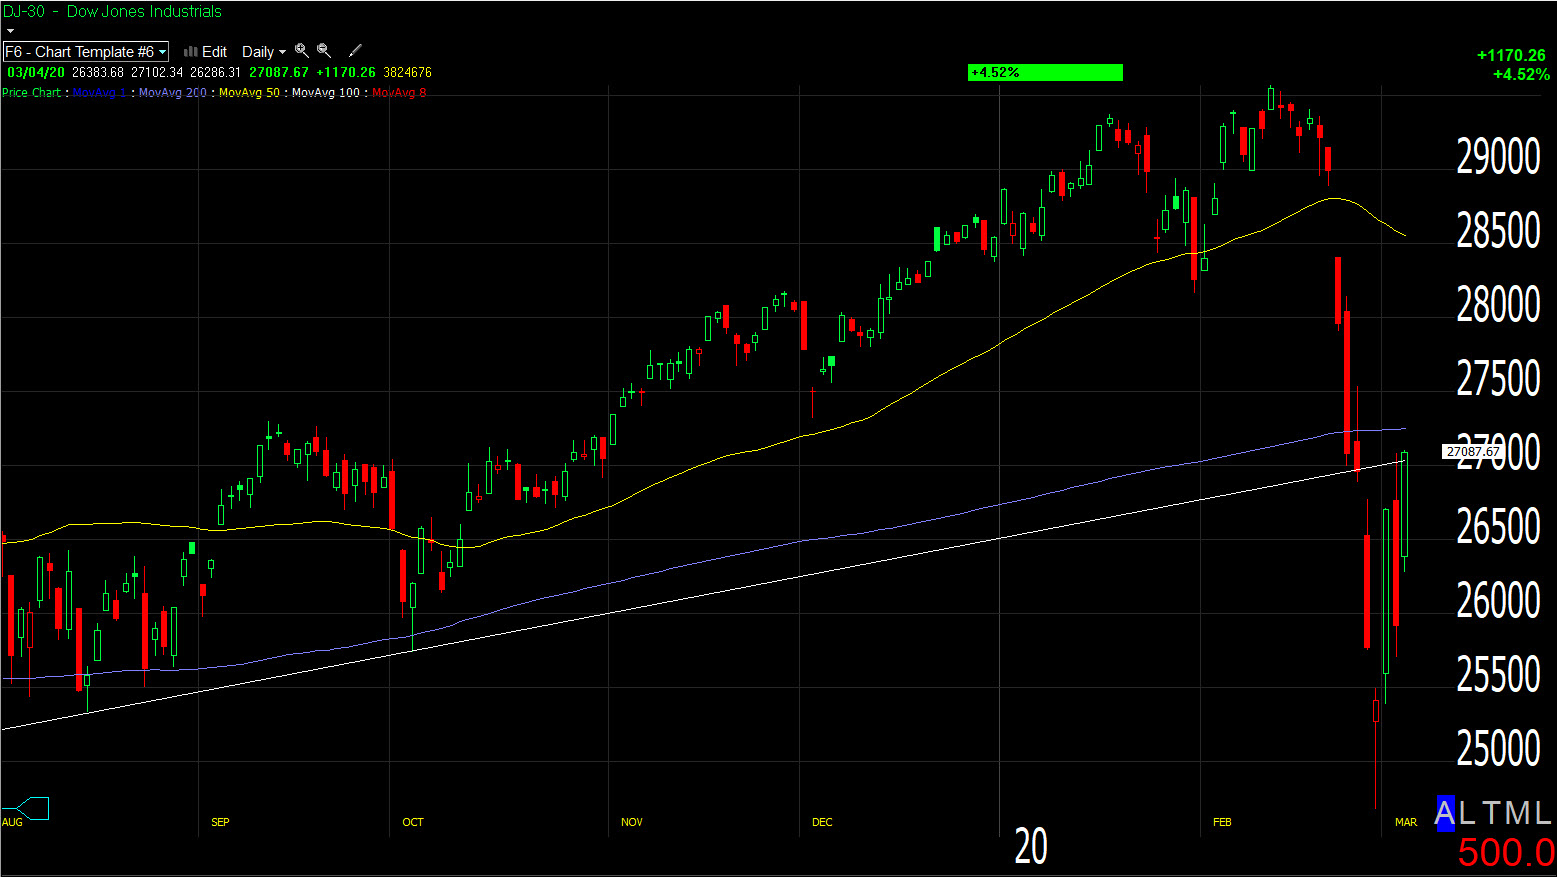 Dow (daily) closed right near several potential resistance areas I posted this morning, from the trend line to the 200-day just above (27,248.93). I wouldn’t be surprised to see some resistance in the area.
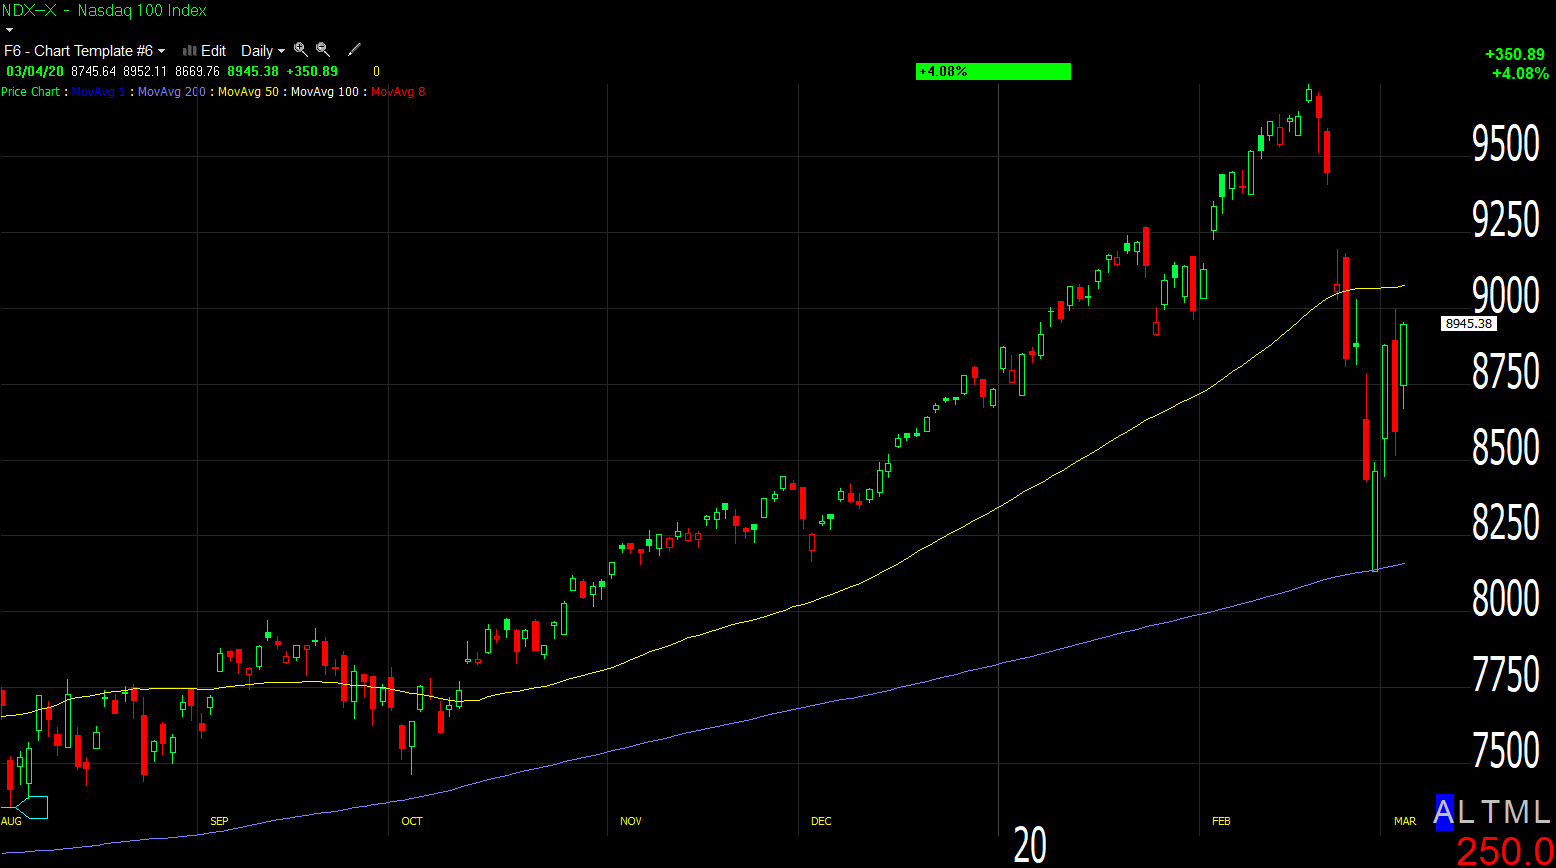 NASDAQ 100 (daily) the 50-day is at 9075.77, again it wouldn’t be surprising to see some technical resistance at the 50-day.
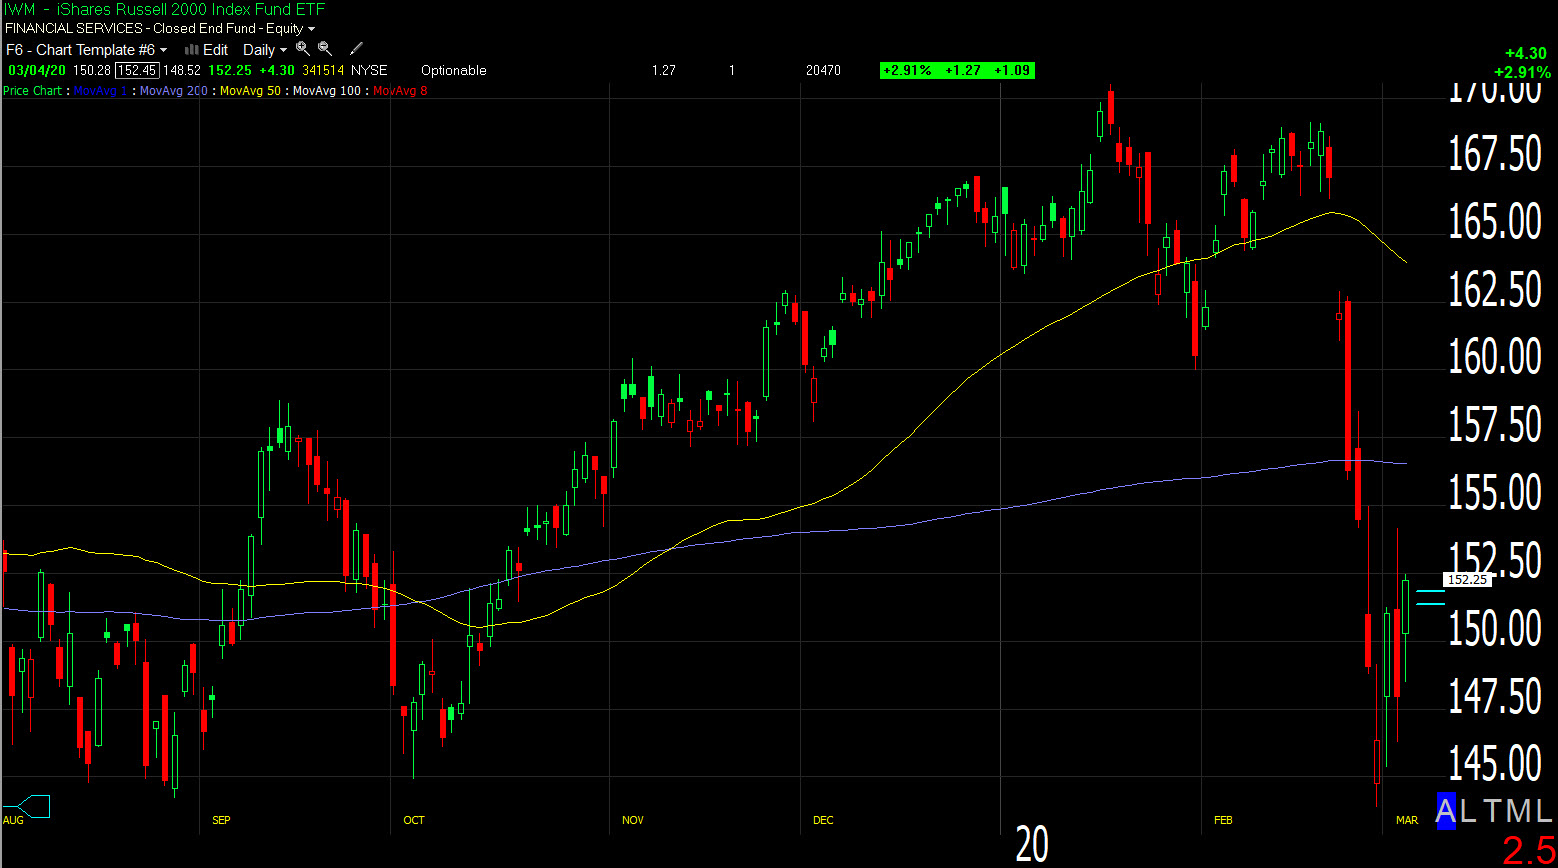
IWM (daily) small caps are the laggard thus far on the week. Generally speaking they tend to lead the broader market so their relative weakness is not all that surprising considering the week’s bounce is a correction of a bad break down. IWM’s 3C charts did improve today and if that’s reflected in price’s relative performance in the next day or so, then I think a better case is made for the averages overcoming technical resistance like the Dow and NASDAQ’s moving averages, and IWM making a run for its 200-day moving average at $156.56.
Prices correct oversold conditions in one of two ways, through price or through time (or both).
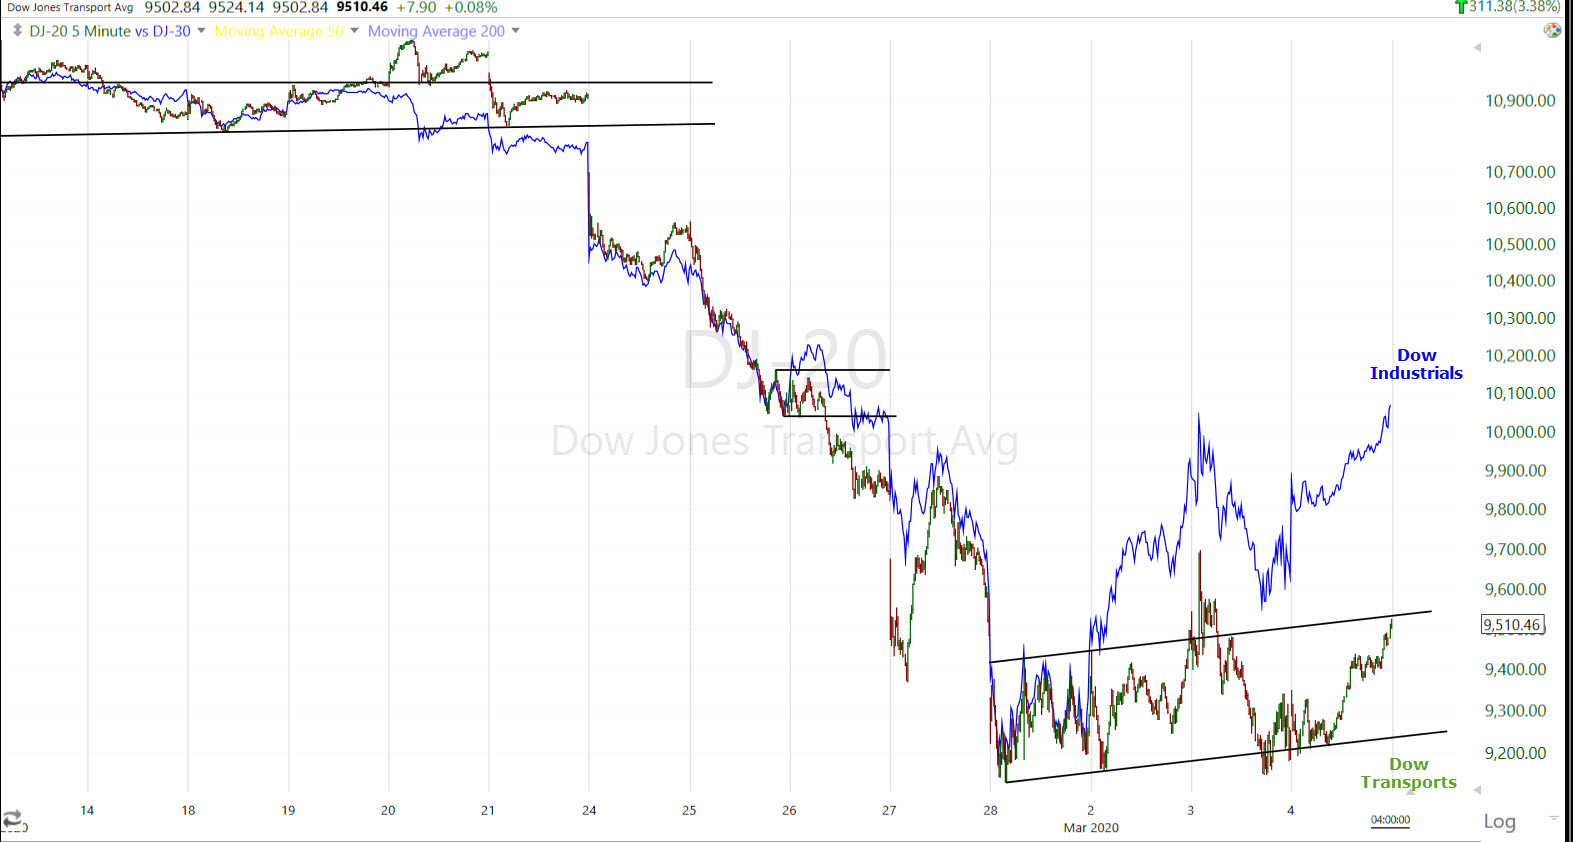 Dow Transports and Dow Industrials (5m)- This chart is normalized so you can see Transports’ weaker relative performance. Transports are trading in a pretty classic bearish flag correction while Industrials are a tad stronger than a bear flag. The weaker relative performance of Transports is another sign that this week’s bounce/rally is corrective in nature. Transports are essentially killing time while the market works off an oversold condition.
In fact if you’ve been watching the various sector updates for the last several months you may recall the negative change in character across multiple sectors in November 2019, as well as Dow Transports.
![]()
Dow Transports and Industrials (60m). Price and performance had been pretty bullish up to the green box, then there was a change in character in price from a bullish flag to a bearish flag. We saw the same thing occur at the September 2019 market highs over the course of a week. After that Transports only made one higher high in January, but still showing relative weakness. Then Transports couldn’t get and stay above resistance at 10,950/11,000 and failed to make a higher high in February with Industrials. I’m old school and believe Transports, that ship goods, should confirm Industrials that produce goods.
Here’s where the S&P’s corrective trend for the week will be by tomorrow’s close…
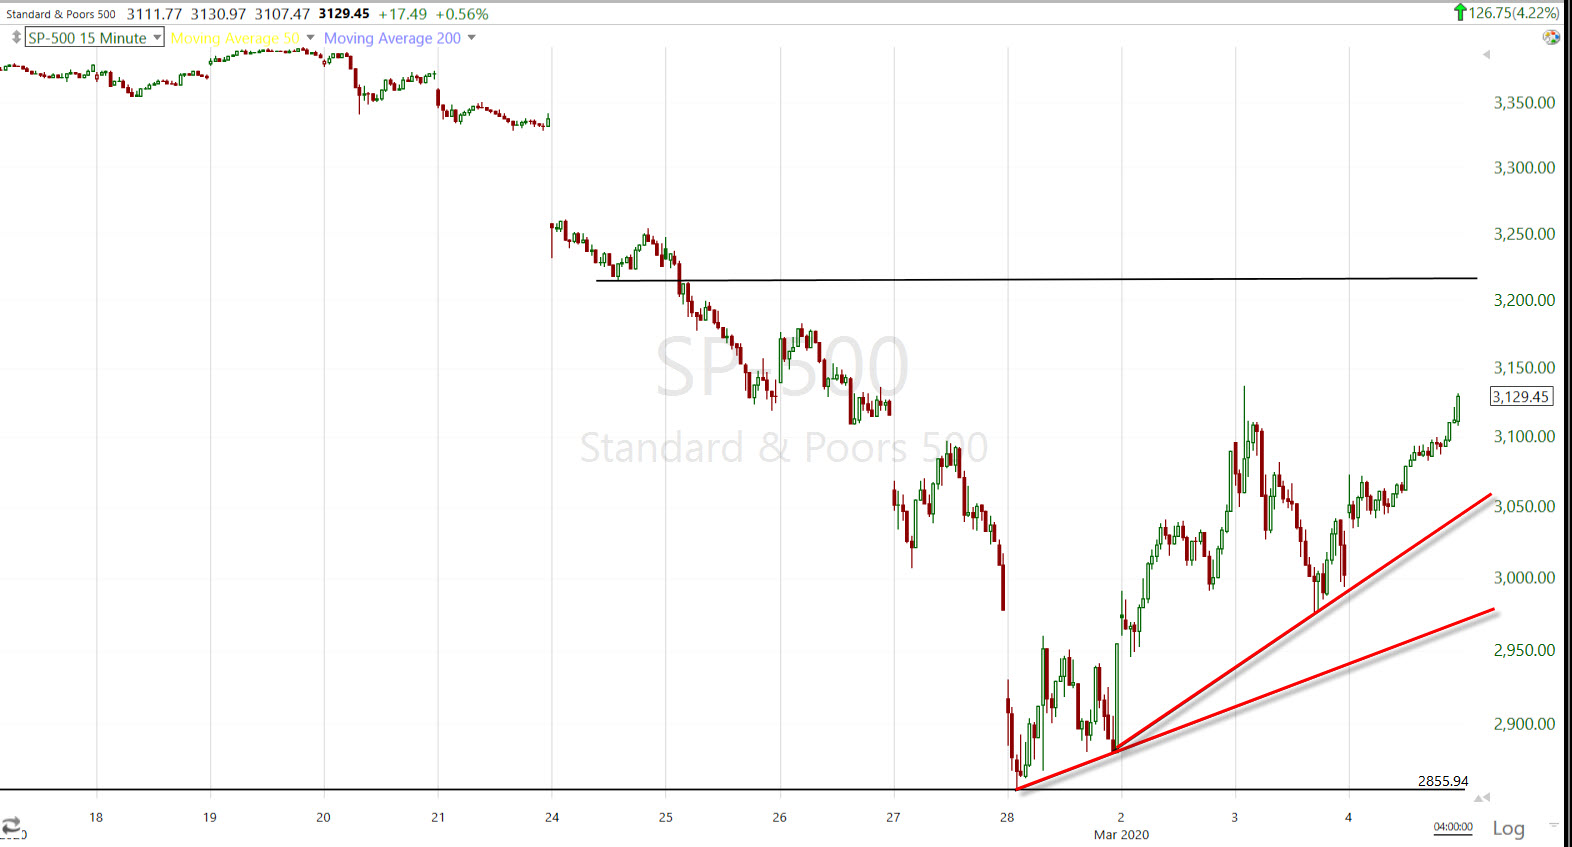
SP-500 (15m) I added a trend line and kept the shallower trend. I don’t know how many times I’ve seen price come back to the original trend. By the close tomorrow the two trend lines will be at $3100 and $3000. I have the $3215 level drawn in above, not because it’s my target, but because it was a significant break in which everything changed last week, so it’s a significant level where a lot of traders/investors are trapped (overhead supply).
Volatility
Volatility has been resilient so far this week. You might notice that VXX is starting to show better relative performance than VIX, this is a result of volatility’s term structure moving to backwardation, in fact last week was the most extreme since the end of the Financial Crisis (see the last chart of this post).
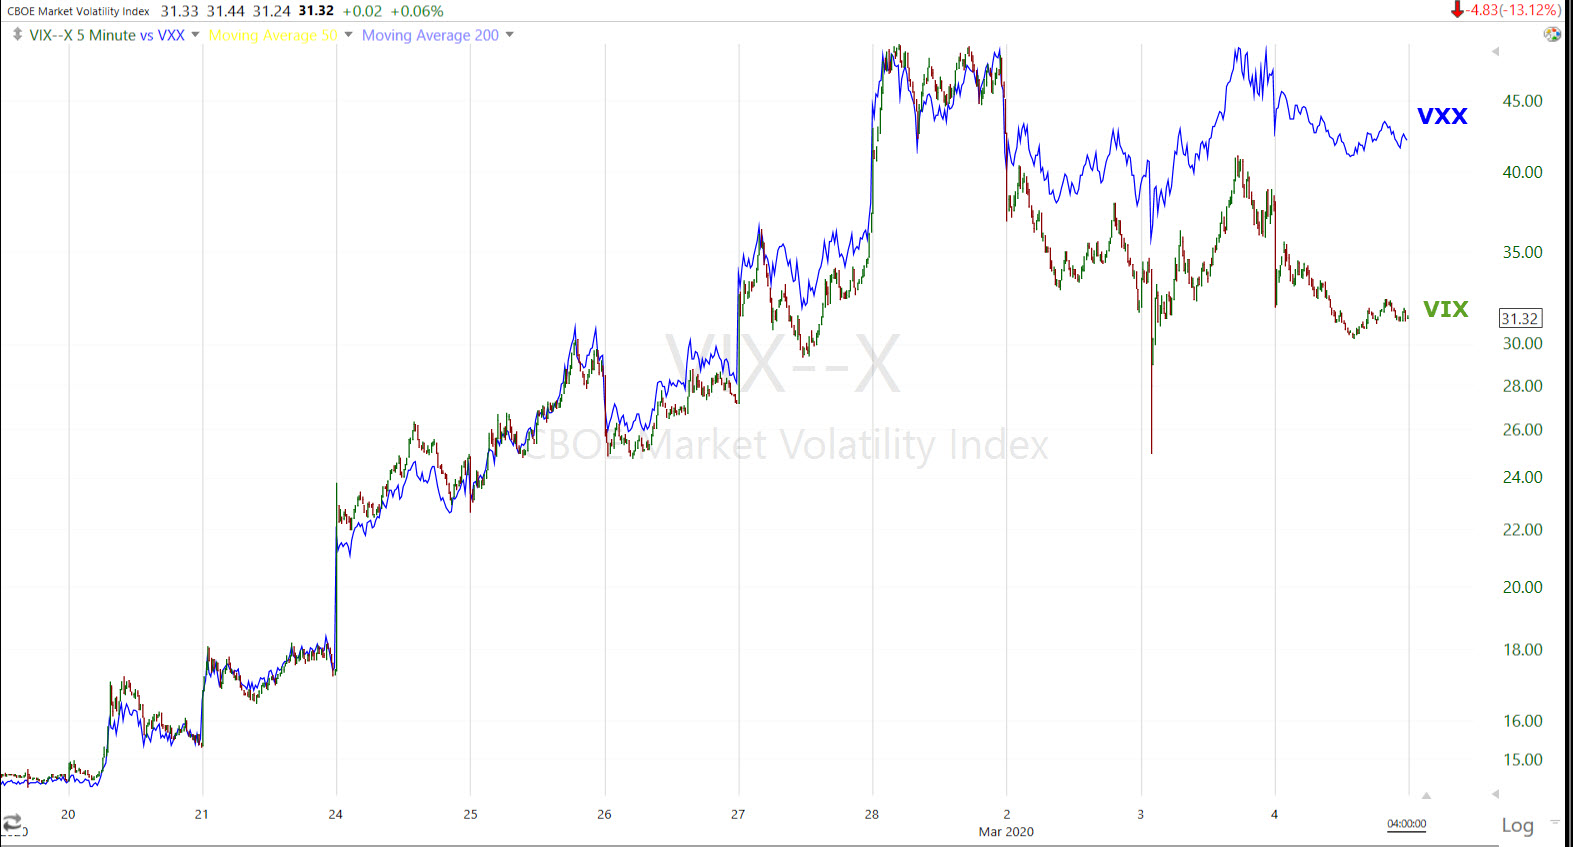
VIX/VXX (5m)
However, for the first time this week, VIX futures 3C chart softened up Tuesday night. This was also reflected on VXX’s charts today.
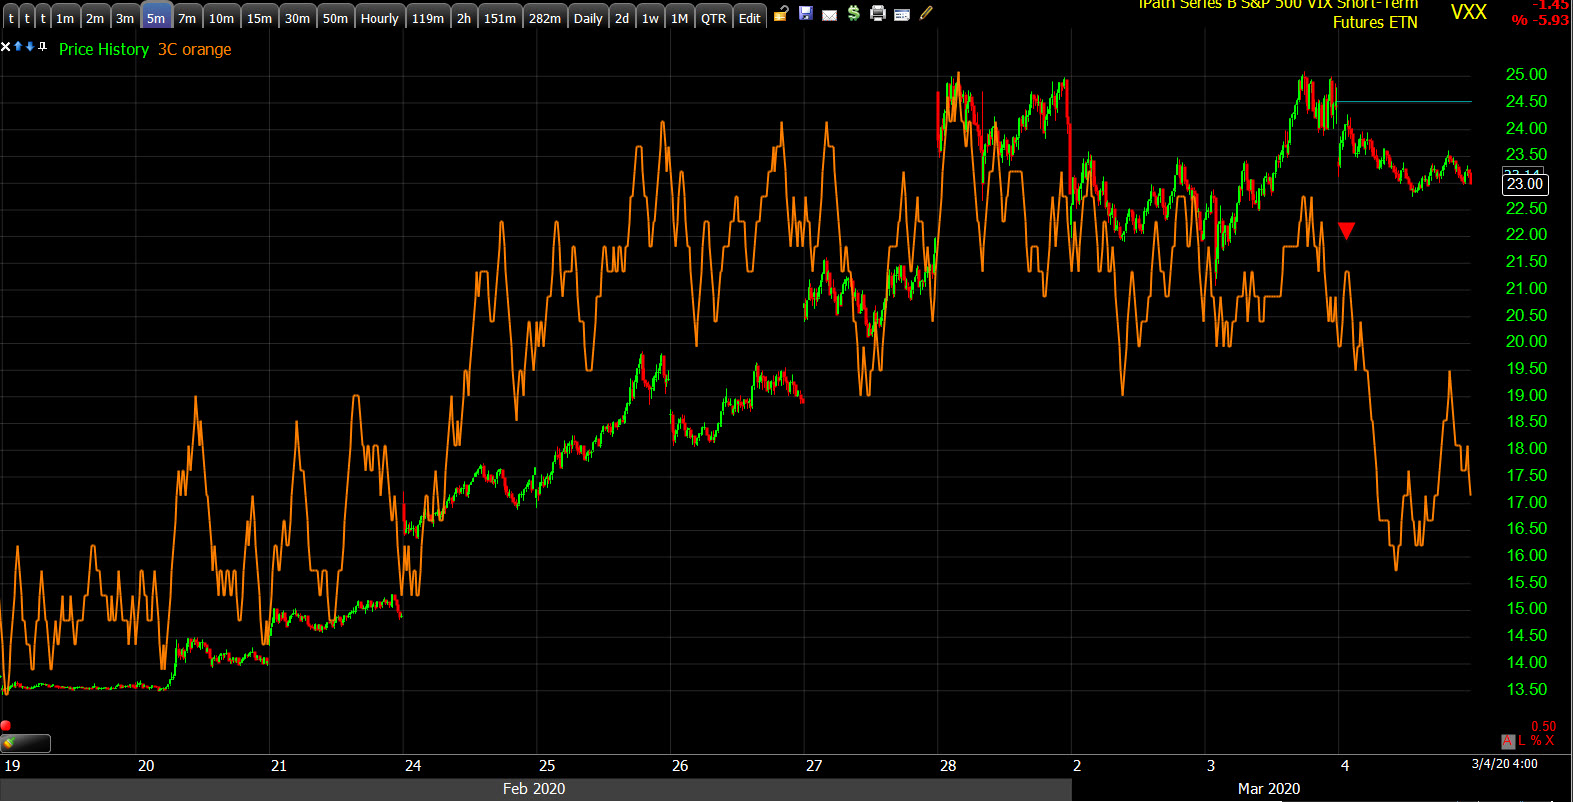 VXX (5m) – I wouldn’t read too much into it. I think this is pretty natural at this point 3 days into a correction of last week’s losses. The market is starting to regain some confidence. Lower volatility does allow funds, like CTAs for example, to leverage up long positions.
VVIX (114) is still extremely elevated in the red zone (above 110) so this isn’t any time to get complacent on the long side.
S&P sectors
While the rally produced big gains, the tone is still defensive with defensive sectors leading. The Health Care sector held the lead throughout the day thanks to big gains in insurer stocks after Joe Biden won the bulk of yesterday’s primaries, seizing the delegate count lead from Bernie Sanders, who favors nationalizing the health insurance industry.
Technology ended up finishing just ahead of the broader market and Semiconductors showed relative strength as the PHLX Semiconductor Index jumped 4.9% with all 30 components ending in the green. The semis performance today may suggest investors are starting to get a little more confident which I think needs to happen to add significantly more to the gains. We need to see the mega-caps in Technology, Communications and Consumer Discretionary show leadership, and the 3rd most heavily weighted sector, Financials, but for that to happen the defensive bias needs to back off, bonds need to come down (yields rise).
The Energy sector was the laggard as Crude oil gave back early gains after the OPEC meeting.
Materials ⇧ 4.15 %
Energy ⇧ 2.37 %
Financials ⇧ 3.31 %
Industrial ⇧ 4.13 %
Technology ⇧ 4.29 %
Consumer Staples ⇧ 4.91 %
Utilities ⇧ 5.67 %
Health Care ⇧ 5.76 %
Consumer Discretionary ⇧ 3.46 %
Real Estate ⇧ 3.89 %
Communications ⇧ 3.60 %
Earlier today I posted the short term price trends for all S&P sectors. All sectors are correcting last week’s decline, some more through price, some like Transports, more through time.
Internals
Advancers (2411) were nearly 6-to-1 over Decliners (416), but on lighter volume of 1.23 bln. shares. QQQ’s volume is the lowest in 8 trading days.
The Dominant price/volume relationship reveals weaker character of the advance coming in at Close Up/Volume Down with about 85% of major average components falling into the category. Additionally with all 11 sectors green and advancers better than 2:1 over decliners, the P/V relationship rounds out a 1-day overbought signal.
Market breadth for the week is not surprising, it’s not great, but it’s not horrible, about what I’d expect given small caps have been laggards on both up days this week and only showing relative strength yesterday as the market as down (which is a positive even on a down day).
To illustrate the damage done last week and how little was repaired thus far this week…
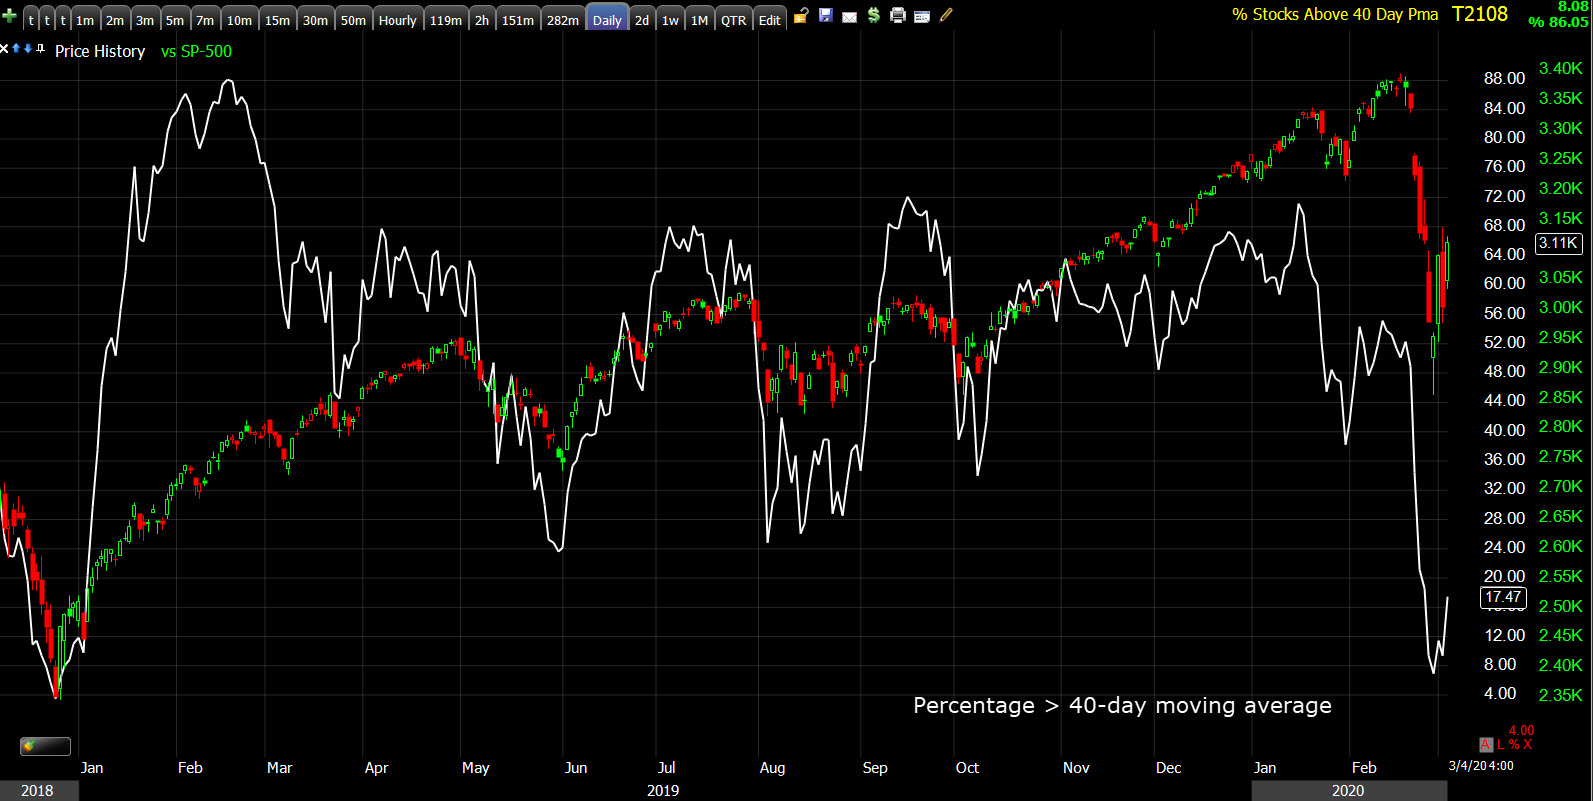 SP-500 (daily) and the percentage of NYSE stocks above their 40-day moving average. The S&P is back to last Tuesday’s close and -7.5% off February’s record high, but the breadth indicator is at the lowest level of the past year excluding last week’s decline. The most important signals though were before the sell-off as the indicator made a lower high as the S&P made a higher high.
The deeply oversold conditions are starting to be alleviated…
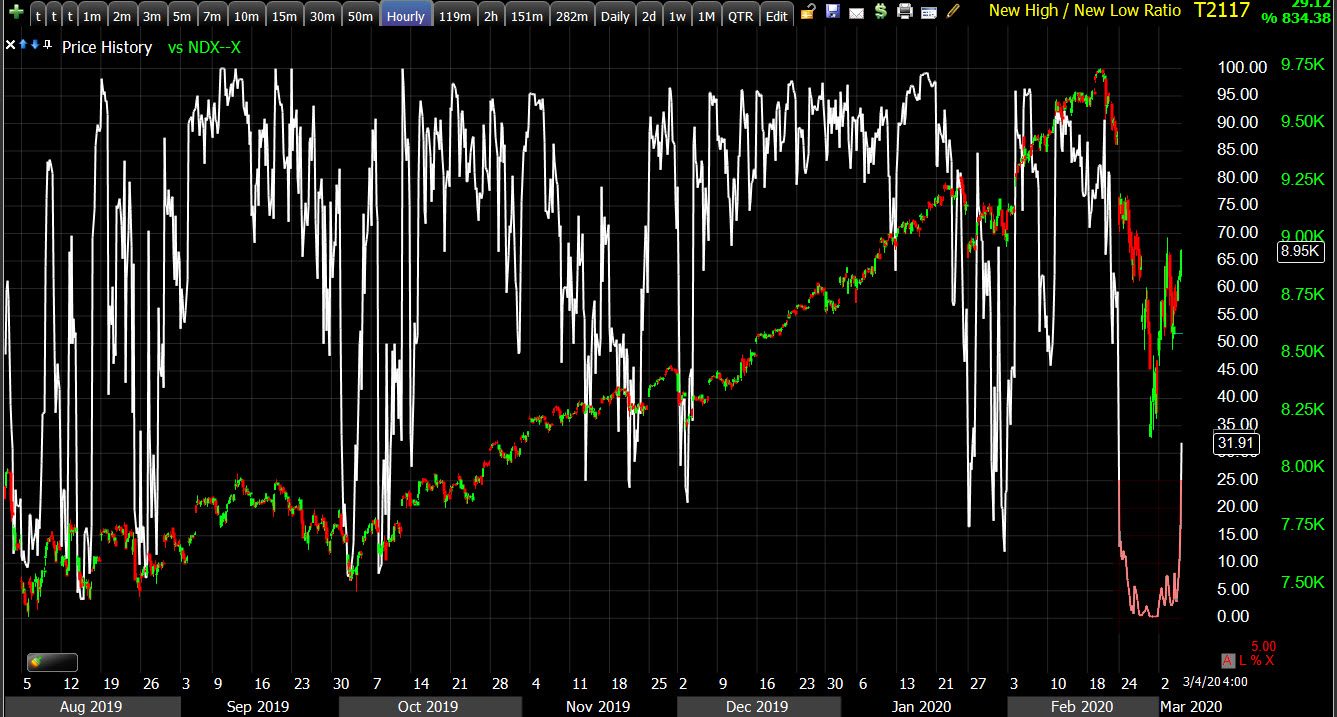
SP-500 (60m) and NYSE New High/Low Ratio. I don’t think it’s a good idea to sell short when a market is that oversold and ideally I’d like to see it near overbought levels again (+80) before entering a new short.
Treasuries
The 2-year yield fell nine basis points to 0.63%, the 10-year yield slipped another two basis points to 0.99%, while the long bond came in with a slight loss, moving to session lows as stocks reached session highs- all resulting in massive yield curve steepening.
Many financial pundits will applaud the steepening yield curve, that’s what the Fed’s trying to do.
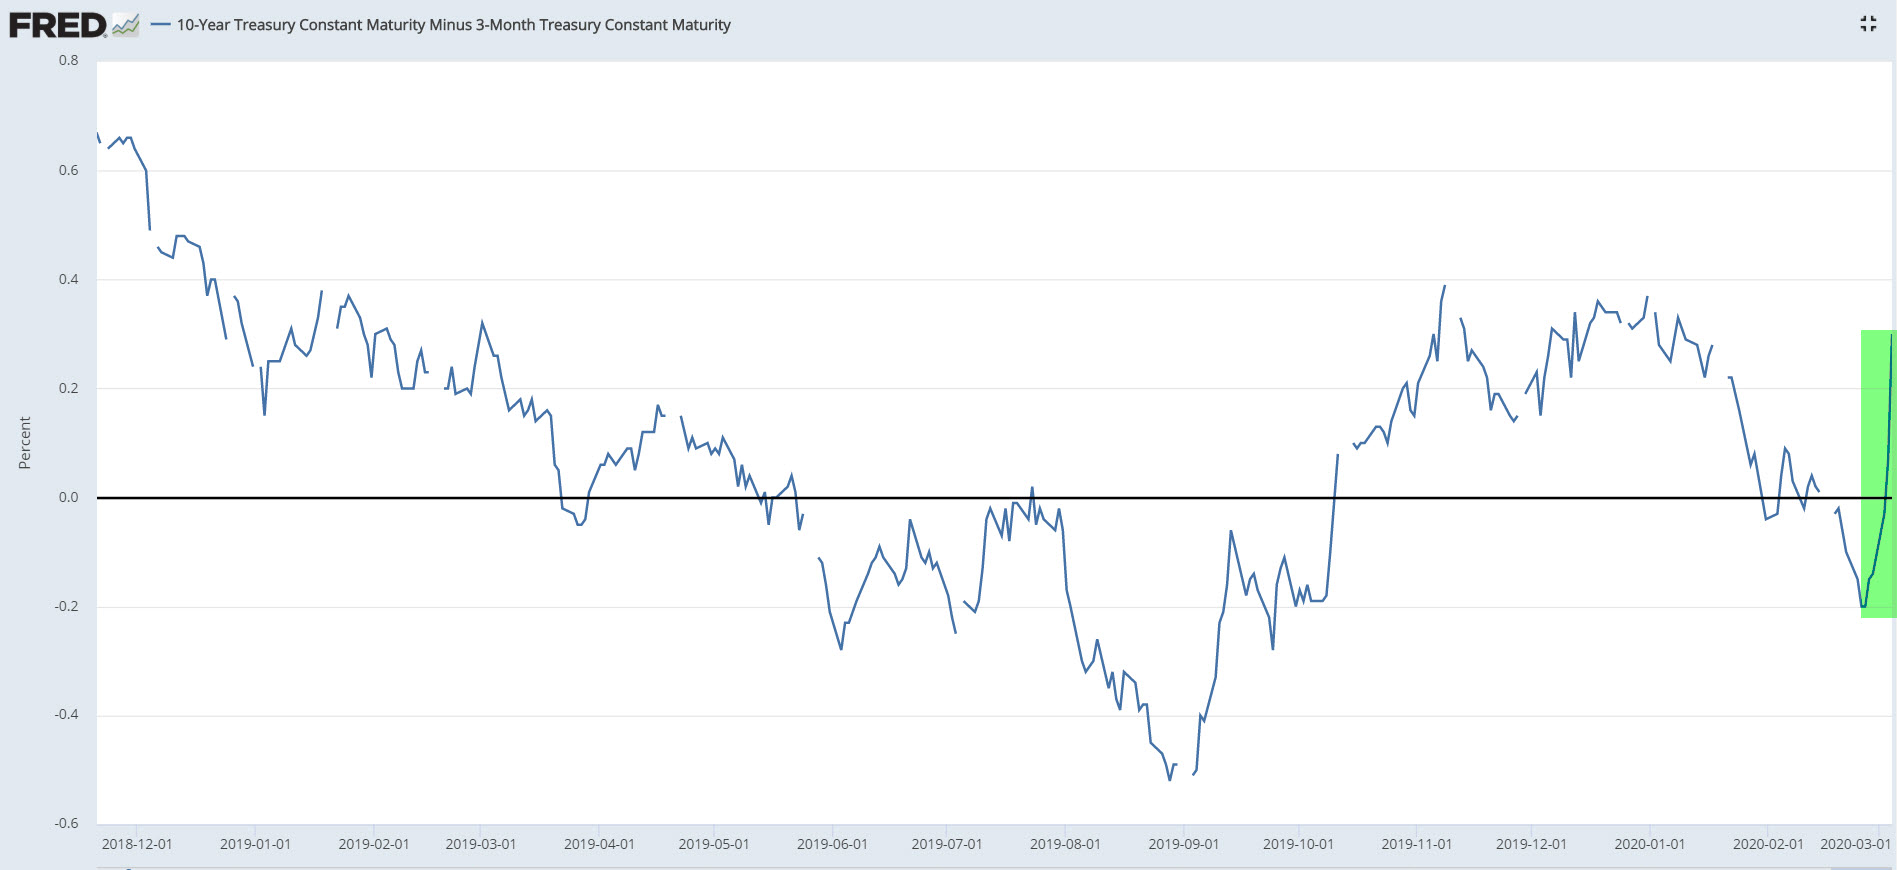
3m-10y
However, historically speaking, sharp steepening after inversion has preceded just about every U.S. recession….
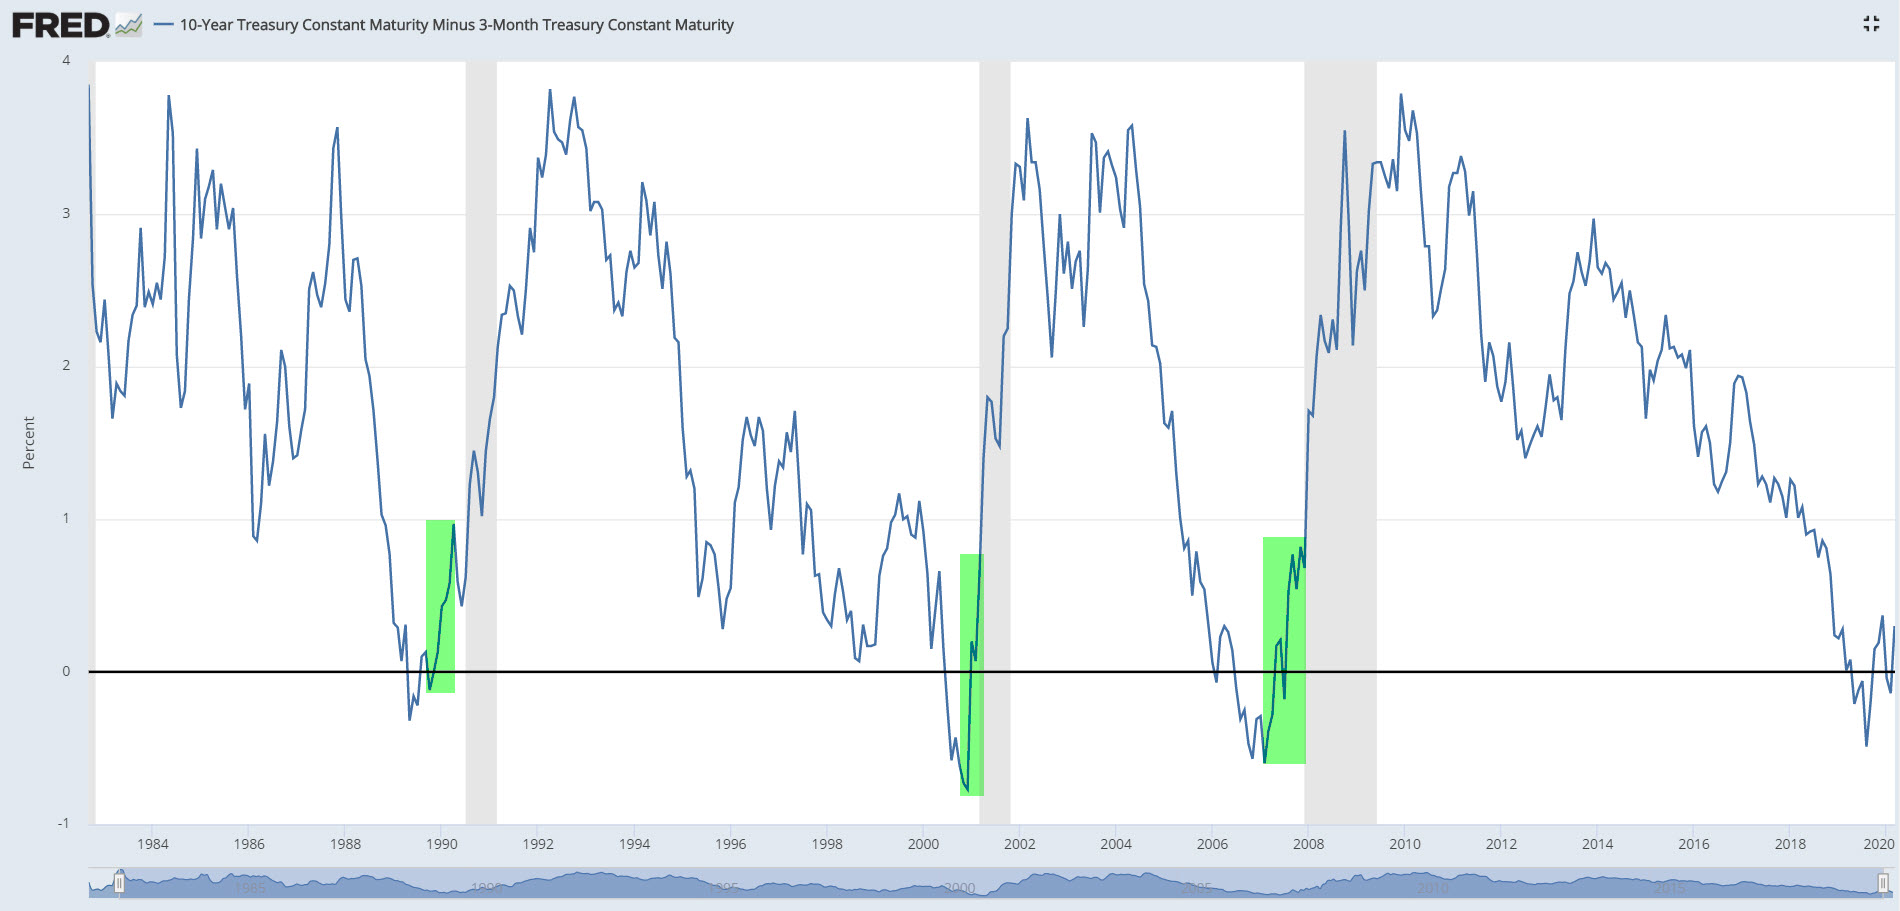
Recession shading in gray.
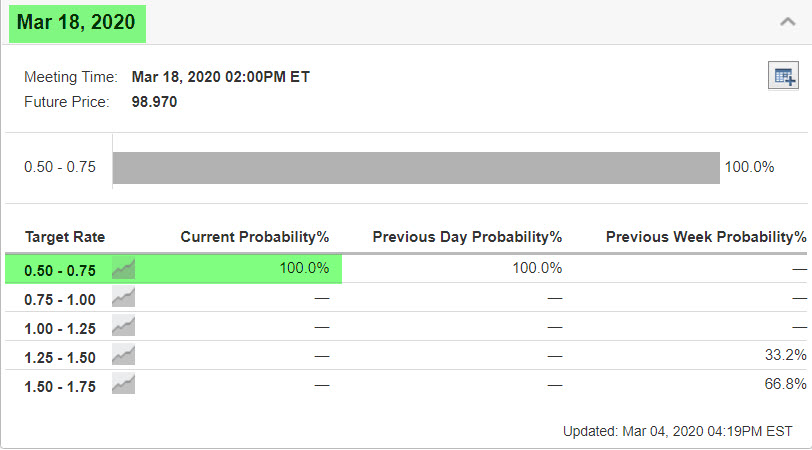
The market is already pricing in another 2 Fed rate cuts (50 bp) by the March FOMC, and this is likely contributing to bond’s resiliency and thus pressuring the banks/financial sector.
Currencies and Commodities
USD/JPY is still very defensive after having made a lower low (near 5 month low) yesterday with bond yields.
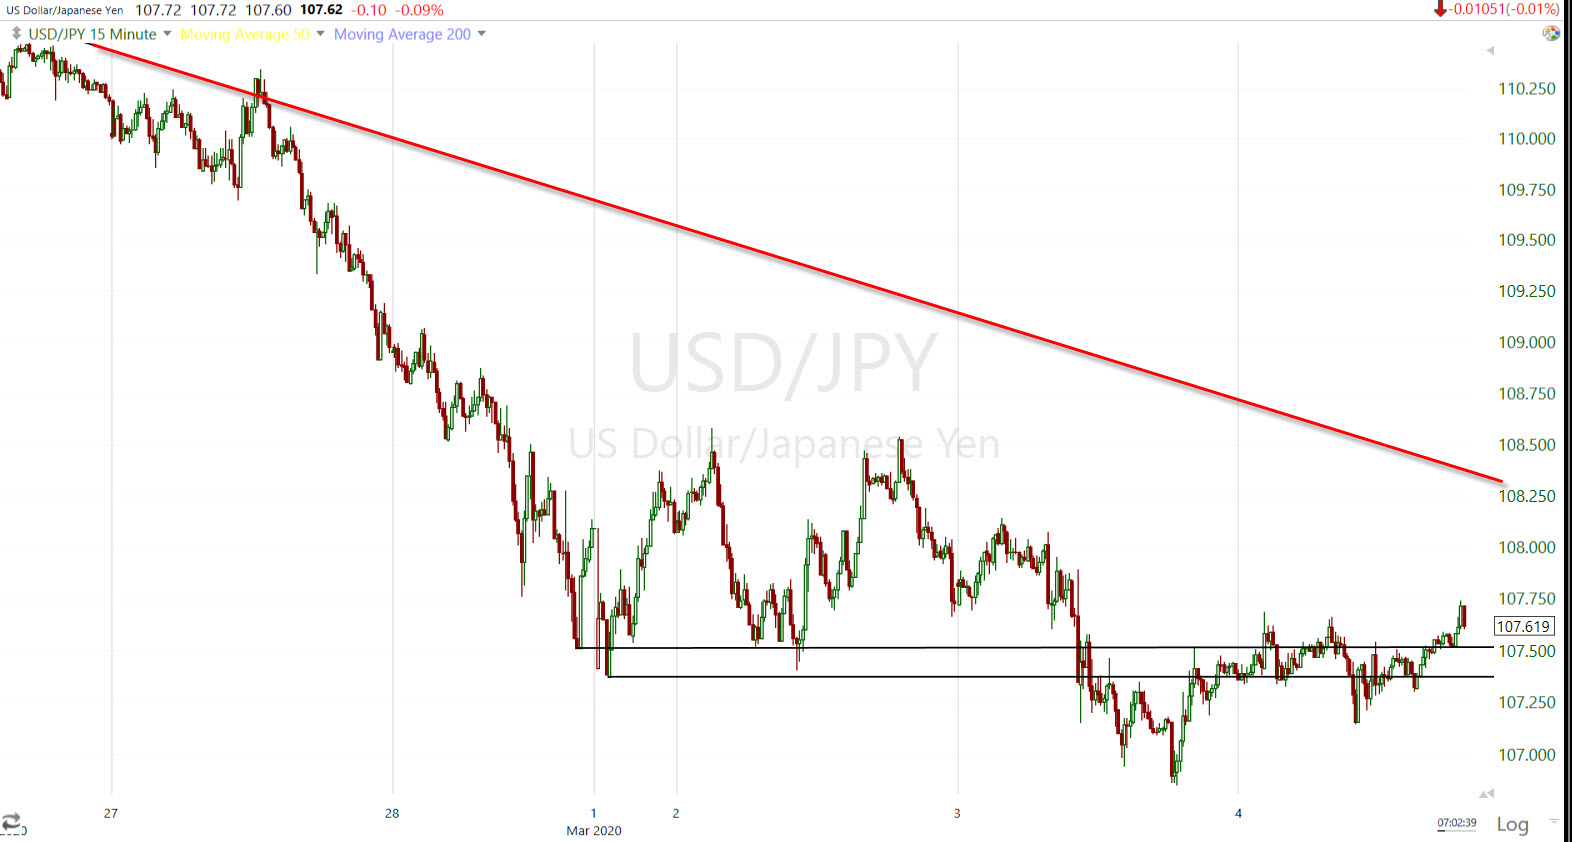
USD/JPY (15m) the red trend line is last week’s risk-off trend (below the trend line).
A few currency pairs are bouncing and are worth keeping an eye on. USD/CNH fell back below the $7 line in the sand, but I don’t think it’s a great proxy for risk sentiment right now. Chinese markets, the Chinese yuan and copper prices all look manipulated. China’s economic data crashed to record lows and copper has barely moved lower. They’re still worth watching, but I think you have to be aware that China is trying to put the best face on things possible and protect their economy.
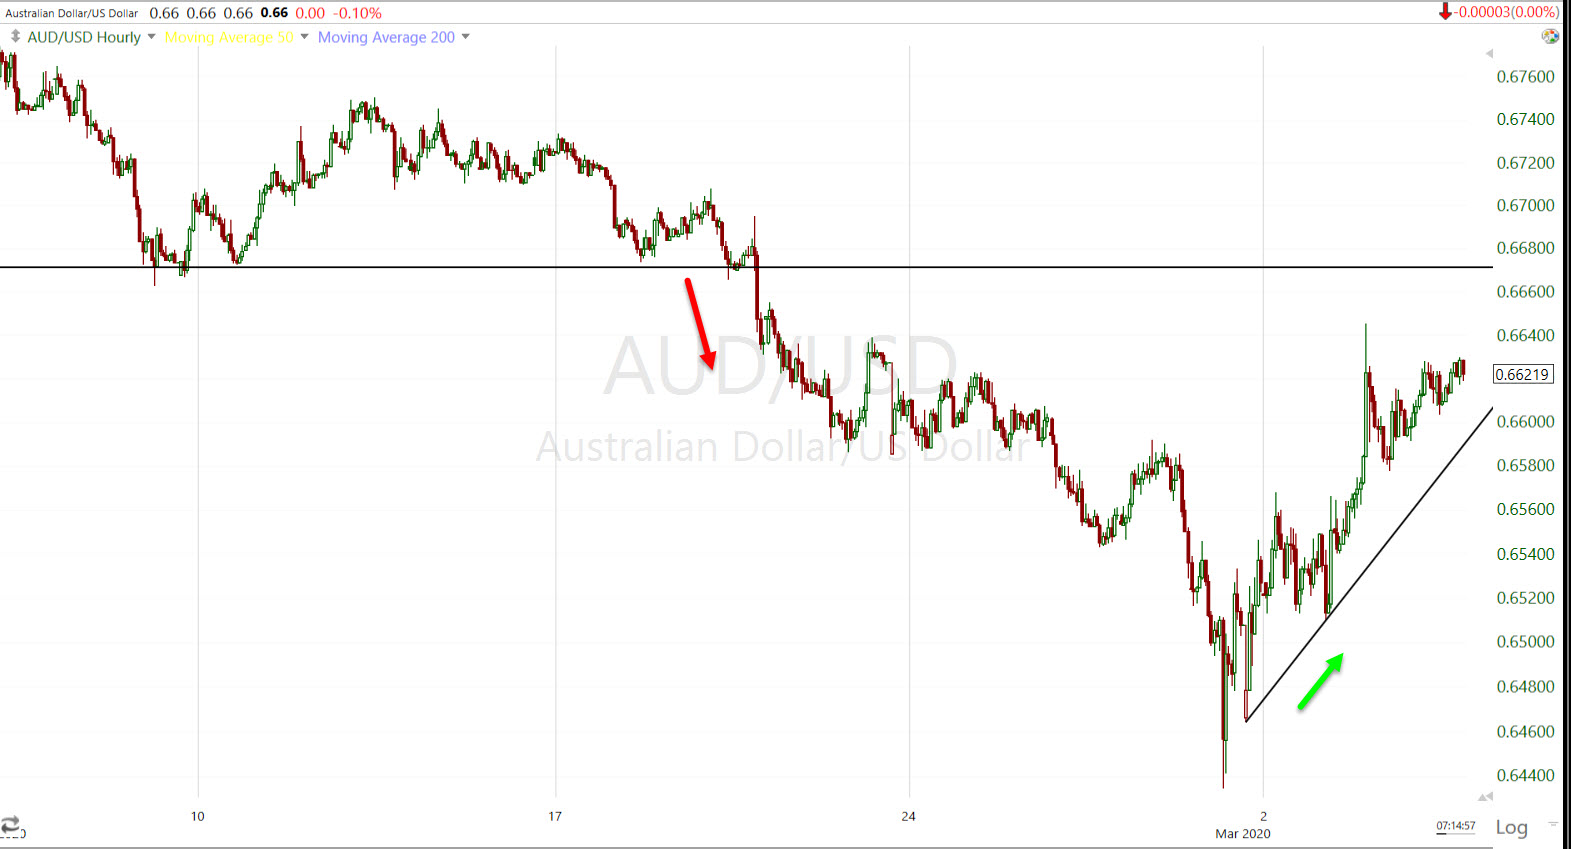
AUD/USD (60m) was one of the FX pairs to lead stocks lower into the sell-off. It has been correcting (bounce) from an 11-year low since Friday. There is a level of resistance coming up.
WTI Crude oil closed lower by -1.0%, to $46.77/bbl. Oil surged overnight on OPEC+ hopes, and inventory data, but Russia’s Energy minister left the meeting having suggested leaving existing production cuts in place. WTI crude has a congestion area that could provide resistance at $49.50. I posted it earlier today with USO’s chart. And the next level is a major one, the 2019 support at the $50.50 area.
Gold futures were close to flat, only lower by -0.1% to $1,643.00/oz as action quieted down a bit following yesterday’s surge higher as a result of the Fed’s emergency rate cut.
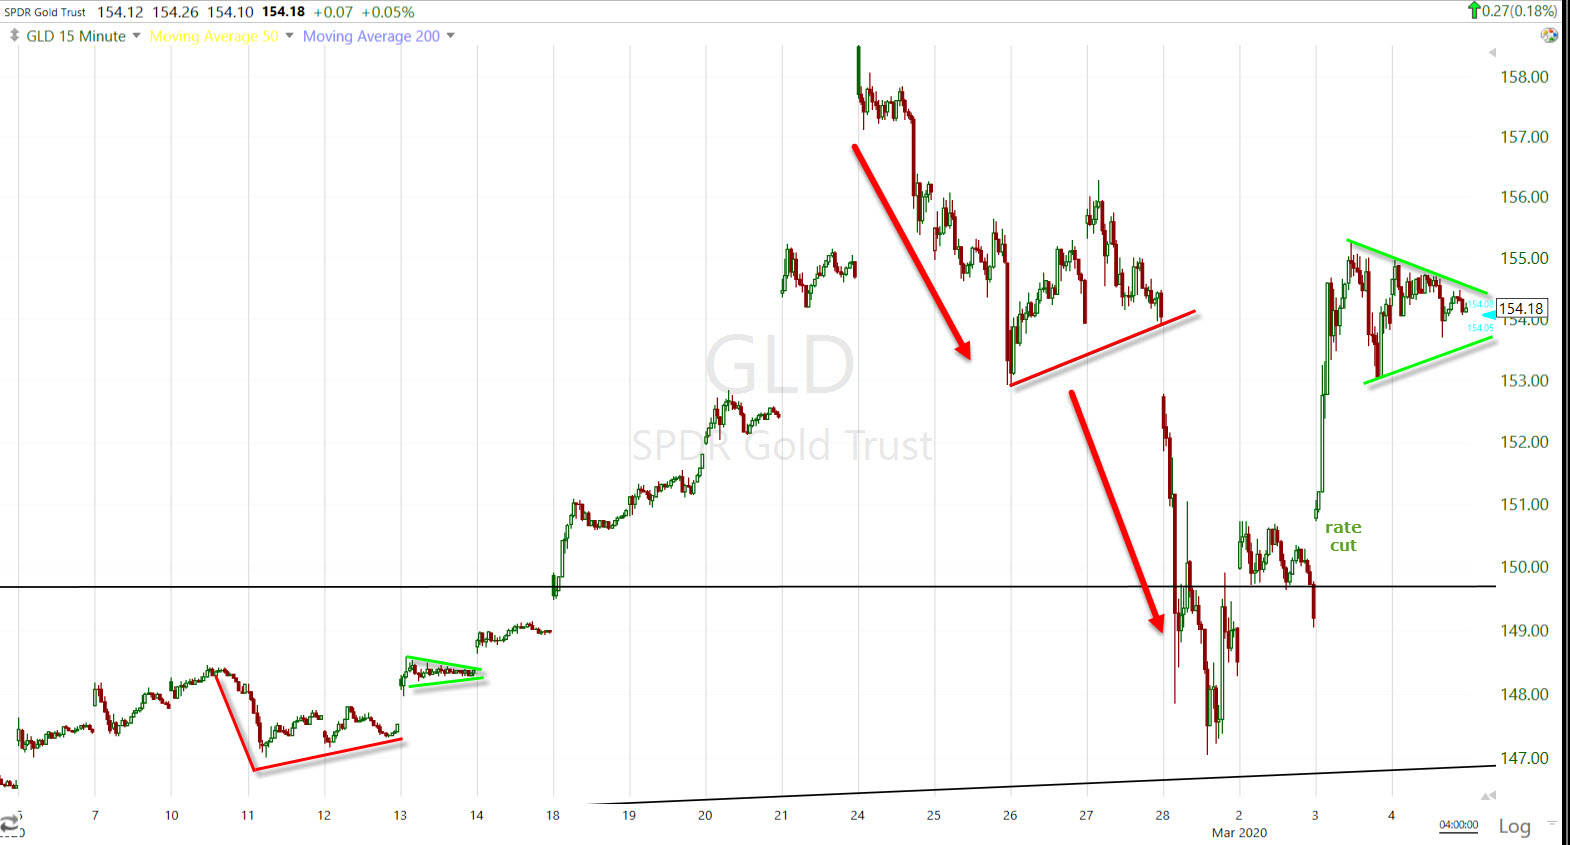 GLD (15m) last week gold made a 2 leg pull back and started this week with a small consolidation. I think a test of last week’s low would have been likely, but gold jumped on the Fed’s emergency rate cut as the U.S. dollar dumped Tuesday. The price action since yesterday’s advance is thus far bullish. It reminds me of gold a couple of weeks ago with a small downside correction (to the left in red), then price action suddenly improved (green) and gold broke out, which was one of the signals leading stocks lower almost a week ahead of time. It’s only a day, but with various potential resistance areas for stocks nearby, like moving averages, I suspect it will hold up fairly well here, perhaps right into U.S. non-farm payrolls on Friday. If Payrolls come in much worse than expected, gold could move higher. I am keeping an eye on Gold miners too. I know there’s some interest in them.
Summary
I think the market acted well today led by credit, which was the one bright spot yesterday as stocks sold off following the Fed’s cut.
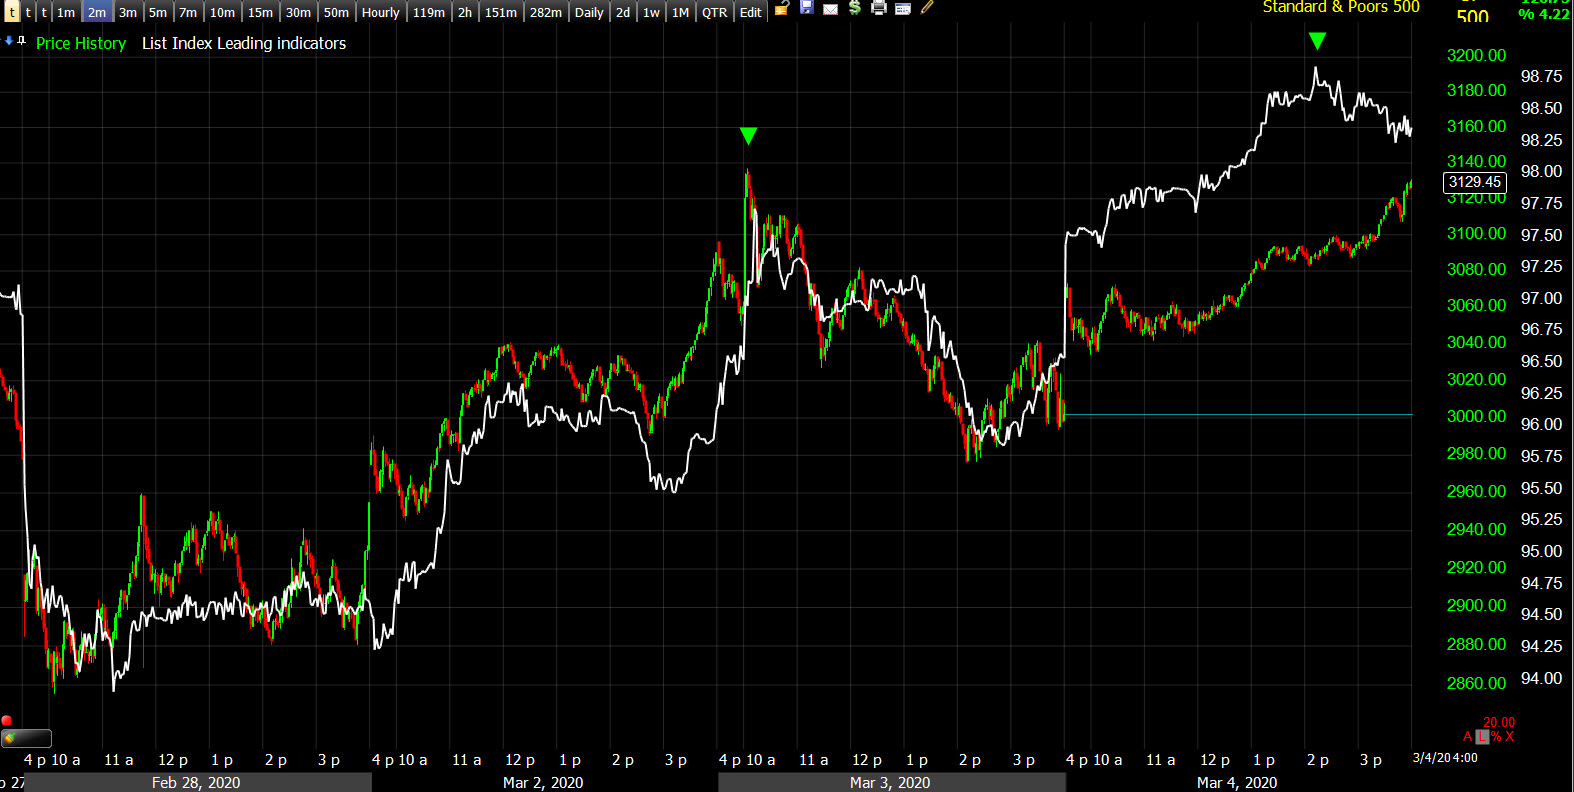
SP-500 (2m) and an equal weight index of credit assets- notice how credit assets made a higher high, vs. Tuesday but the S&P hasn’t yet surpassed yesterday’s intraday high. Credit is still leading the S&P higher.
There are various probable resistance areas coming up, for instance moving averages. DIA and IWM 3C charts look pretty good here. You can see them in the Afternoon Update. SPY and QQQ’s charts are pretty much in line, they don’t add anything to the analysis yet.
I think the averages can add to gains for the week’s correction. So far it has been defensive sectors leading and that’s completely understandable, but at some point I think Small Caps need to show leadership, or the mega-caps that populate the Tech, Communications and Consumer Discretionary sectors. Financials are another heavily weighted sector and they’ve been weighed down by banks, which are weighed down by treasuries’ strength and the negative reaction in yields to the Fed’s rate cut. At some point soon these sectors need to show some leadership. Semiconductors acted better today so it may be a start to a shift in confidence.
I do think that this is a correction, not a bottom, and probabilities favor more downside eventually. I anticipate selling short at some point, but I don’t know when or where that will be, it depends on how the market develops and that is likely to depend on how the virus and its impact develop. No one knows how this virus outbreak will proceed so I’m taking the market one day at a time. I do have some long exposure to Financials last week that I hope will turn around by mid-March.
If you are looking to sell short (like me), then you want to see investors regain confidence and start feeling invincible again, as if nothing can knock the market down for long, not even this virus. You also want to see the deeply oversold conditions alleviate and that’s starting to happen now. I think we will see signals just as we did before, but this time I don’t think they’ll be weeks in advance, but much faster requiring a faster response.
Could stocks recover here? Sure, but I don’t think this is it. What we have so far is a pretty classic correction from a deep oversold emotional extreme. The market steps back, see’s what the response is from central banks for instance, see’s how things develops and then makes an assessment. It’s way too early for any of that. We’re seeing an emotional/technical process play out. If there was material improvement I think yields would be leading higher, cyclical sectors would be leading, not defensive sectors.
Overnight
S&P futures are down -0.6%, and not too surprising given Tuesday’s intraday highs (the knee jerk reaction to the Fed rate cut) are immediate local resistance.
VIX futures are closer to neutral tonight than last night as 3C charts softened up (weaker last night).
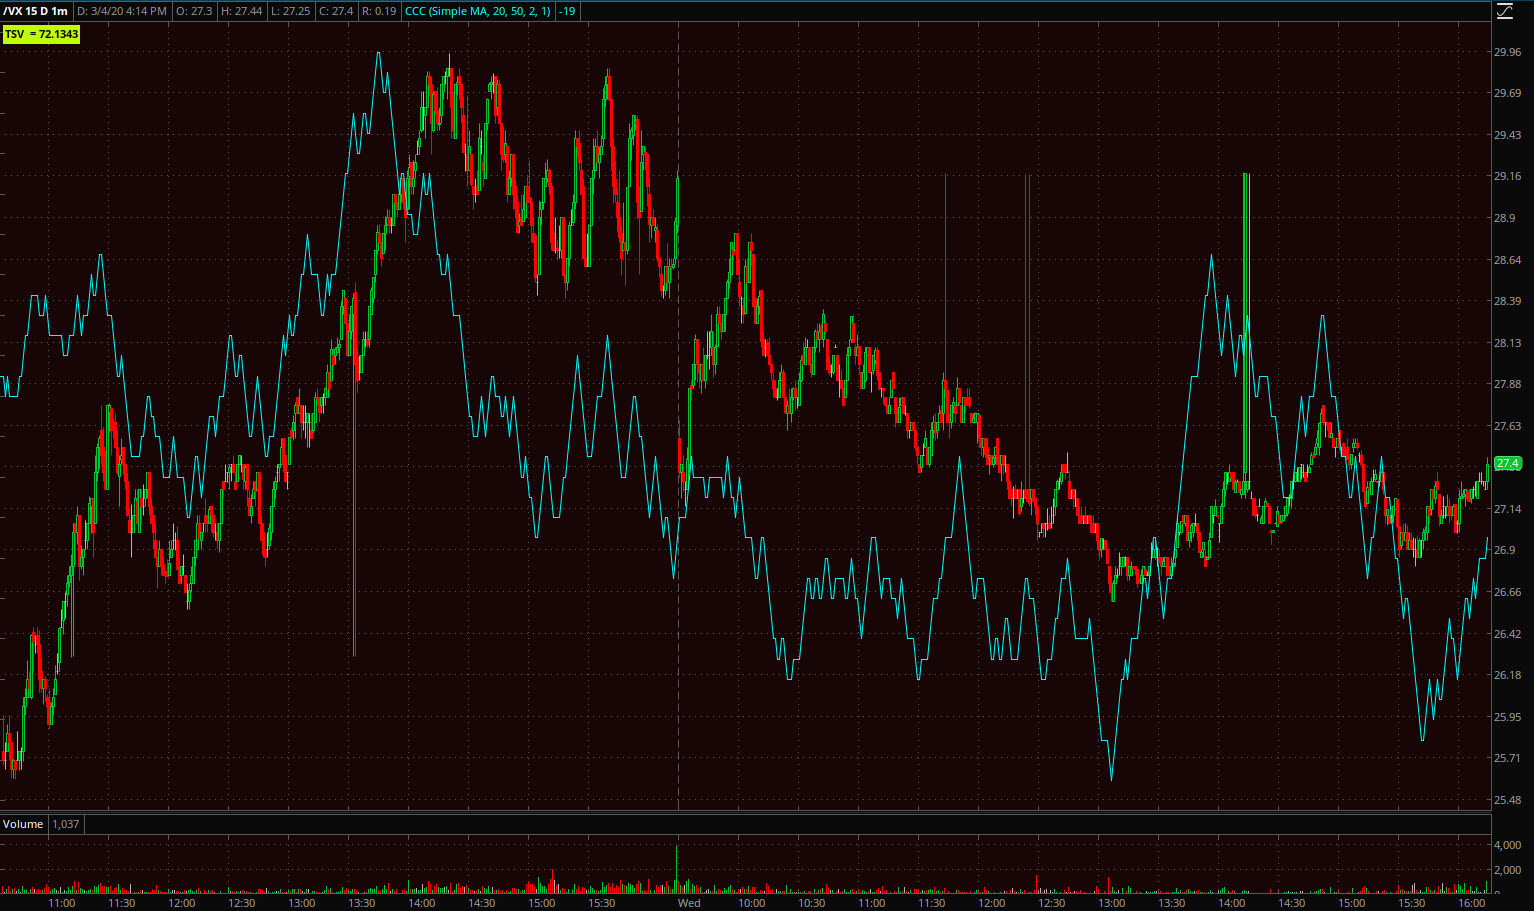 VIX futures (1m)
Treasuries declined to session lows as stocks closed at session highs, but just as index futures are off session highs, Treasury futures are off session lows.
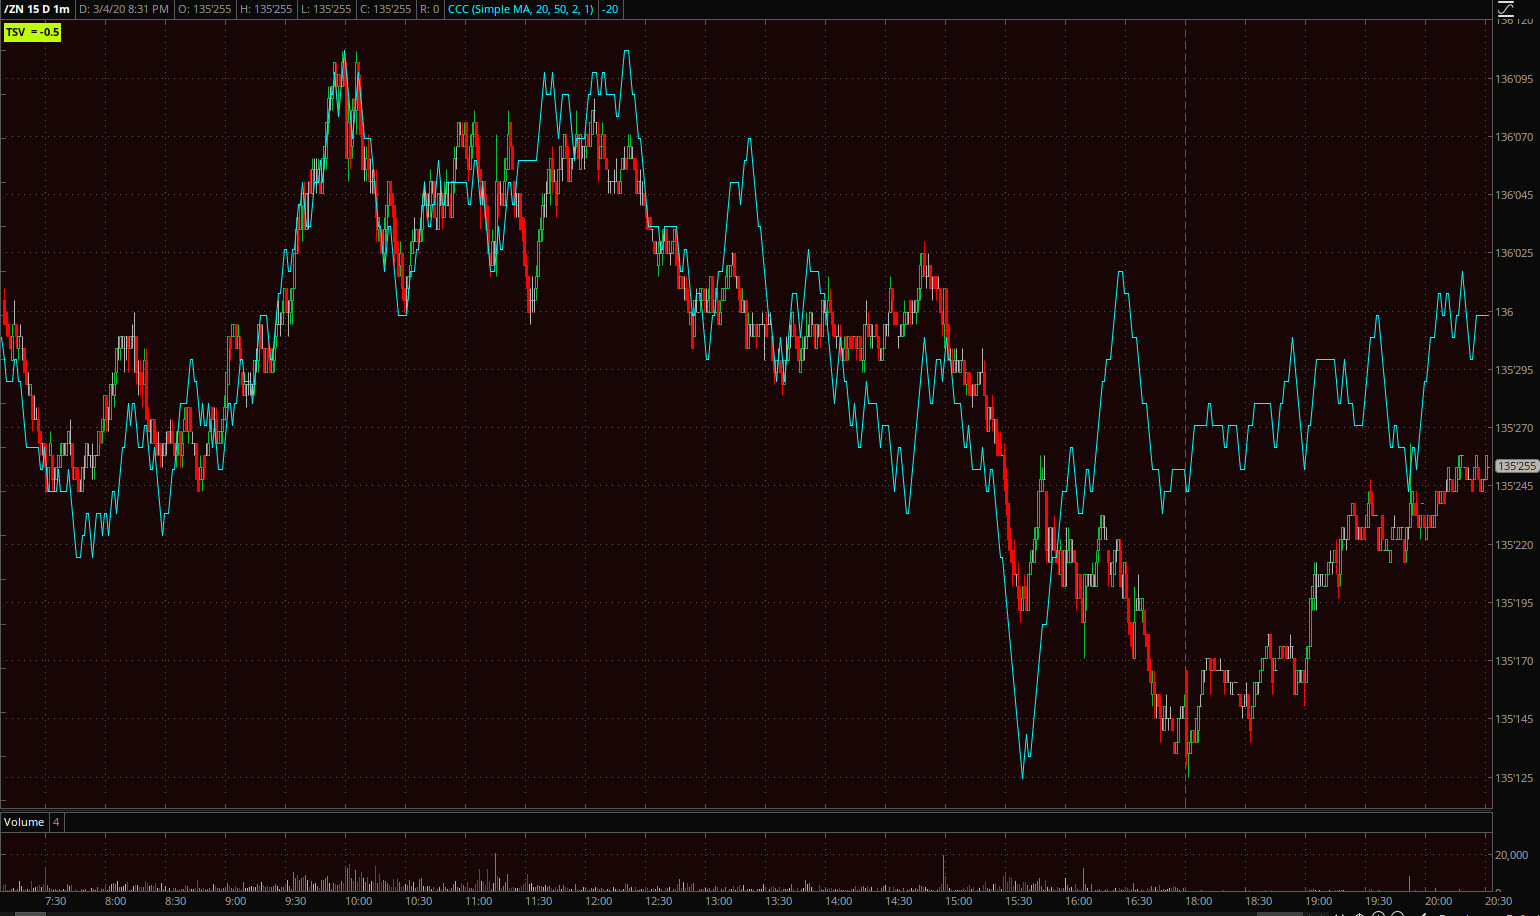
10-year Treasury futures (1m)
I’m not reading too much into it yet, it kind of makes sense given index futures’ /averages facing Tuesday’s highs just above.