Daily Stock Market Analysis
The S&P gained a tenth of a percent (+0.1%) in a defensively oriented session. The Dow Jones Industrial Average also eked out a positive finish, while the NASDAQ Composite closed slightly lower. The Russell 2000 dropped -1.6%. Apple (AAPL +2.4%) provided influential support for the market after Bloomberg reported the company asked suppliers to increase production for its next-gen iPhone by 20% this year. Otherwise, the counter-cyclicals (defensive) sectors led.
In pre-market the PPI revealed that producers are encountering higher prices that will create profit margin pressures if they are not passed along in higher costs to consumers. This followed a much hotter (inflation) than expected CPI report yesterday. Producer prices for final demand rose 1.0% m/m (consensus +0.6%) while producer prices, excluding food and energy, also rose 1.0% m/m (consensus +0.5%). Year-over-year, they were running noticeably hot at 7.3% and 5.6%, respectively.
Yet bond yields fell on the day, which was supportive for the mega-cap stocks like Apple. Yields fell in response to comments by Fed chair Powell in pre-market. The averages best levels of the day were at the open following remarks from Fed chair Powell. In his prepared remarks to Congress for his semiannual testimony on monetary policy, Mr. Powell remarked that “reaching the standard of ‘substantial further progress’ is still a ways off.” That suggested the Fed still isn’t ready to tone down its extraordinarily accommodative policy, even with the high rates of inflation that the Fed Chair acknowledged. Powell added that inflation is likely to remain high in coming months before moderating.
However, local resistance for the indices identified in recent days and the Early Update exerted their influence.
Averages
S&P 500 ⇧ 0.12 %
NASDAQ ⇧ 0.17 %
DOW JONES ⇧ 0.13 %
RUSSELL 2000 ⇩ -1.63 %
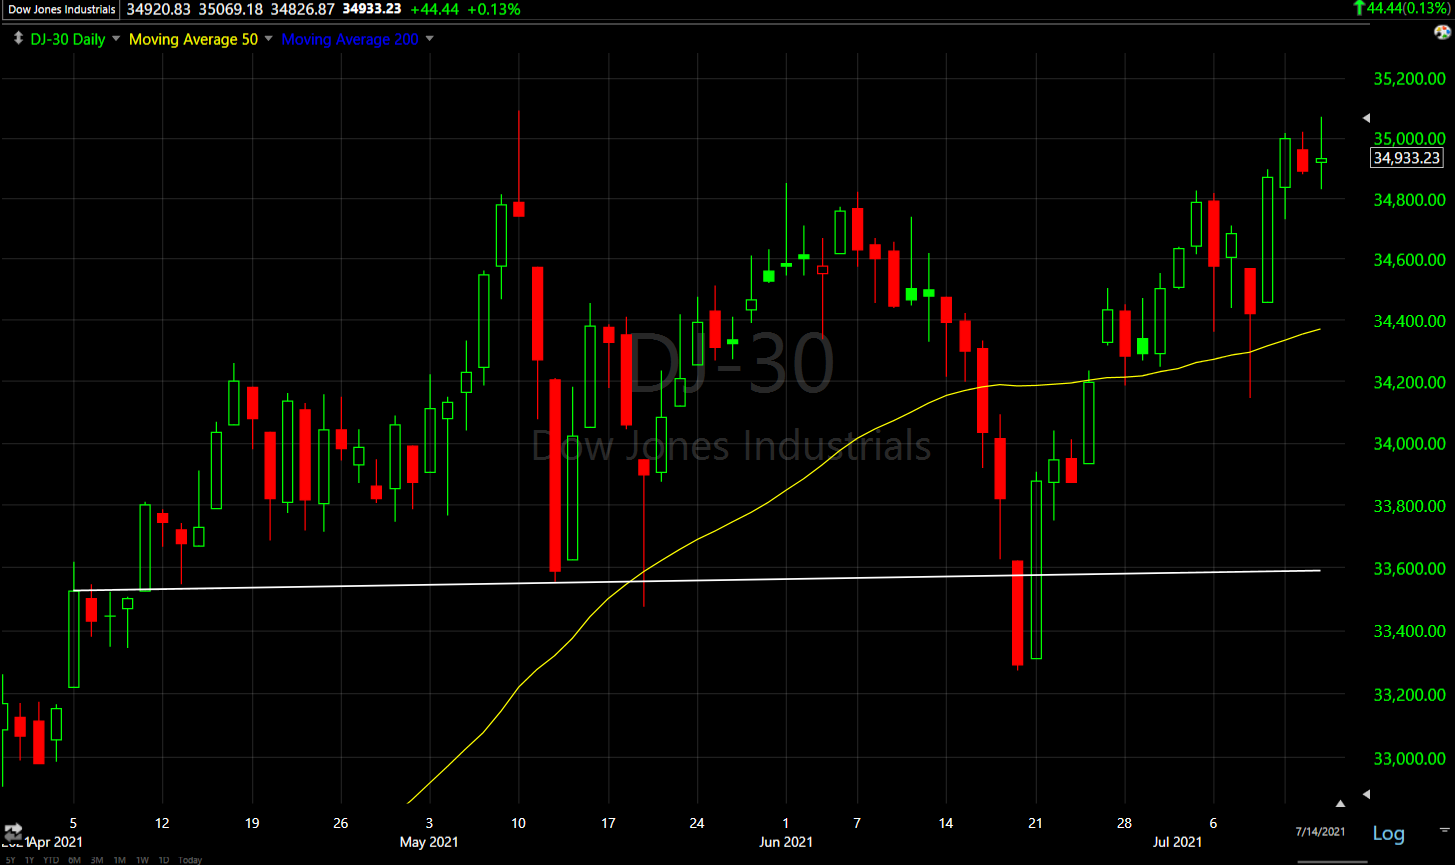 Dow (daily) price action today confirms local resistance around $35k
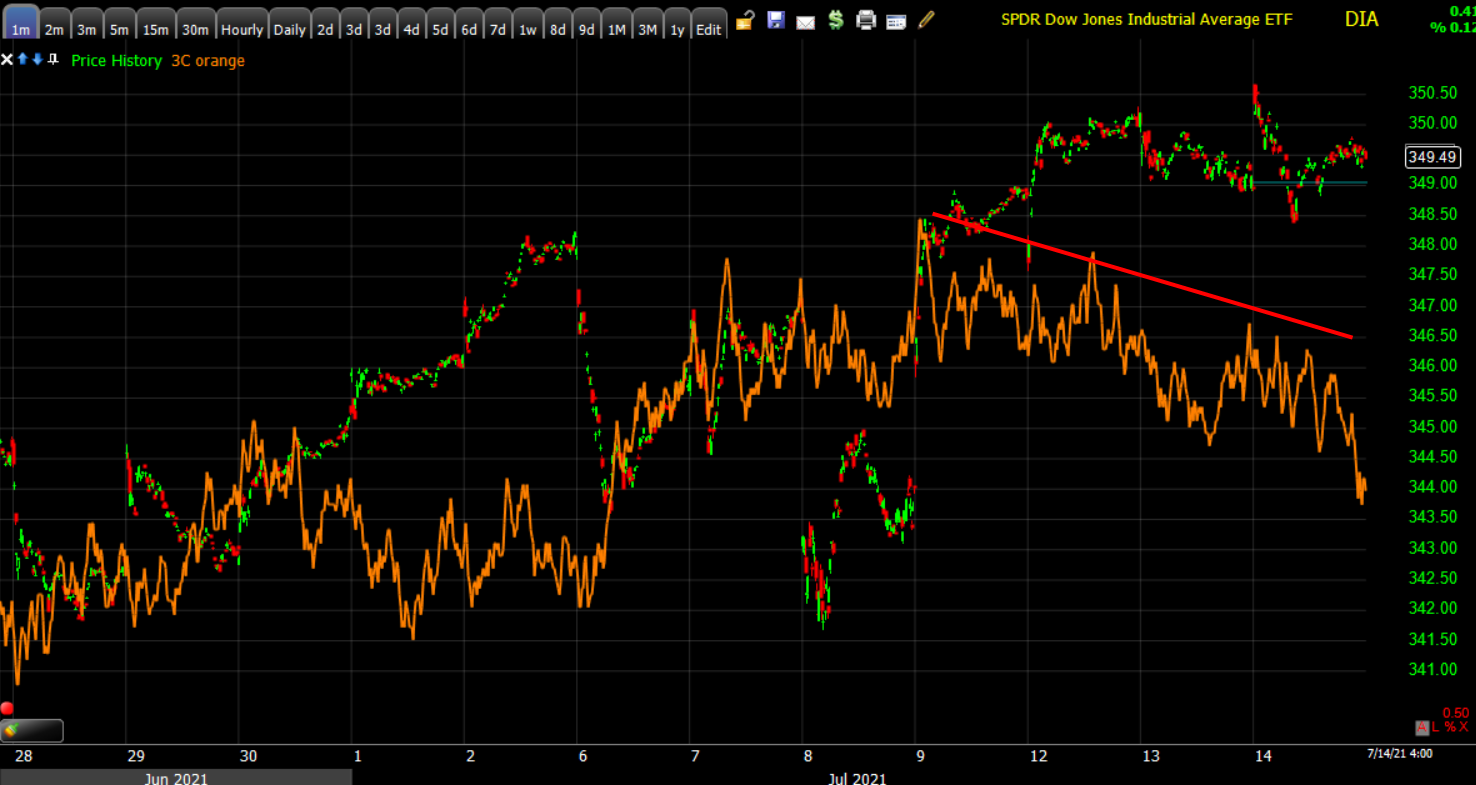
DIA (1m) while this is not the worst 3C divergence, it has lent credibility to the idea of local resistance at $35k
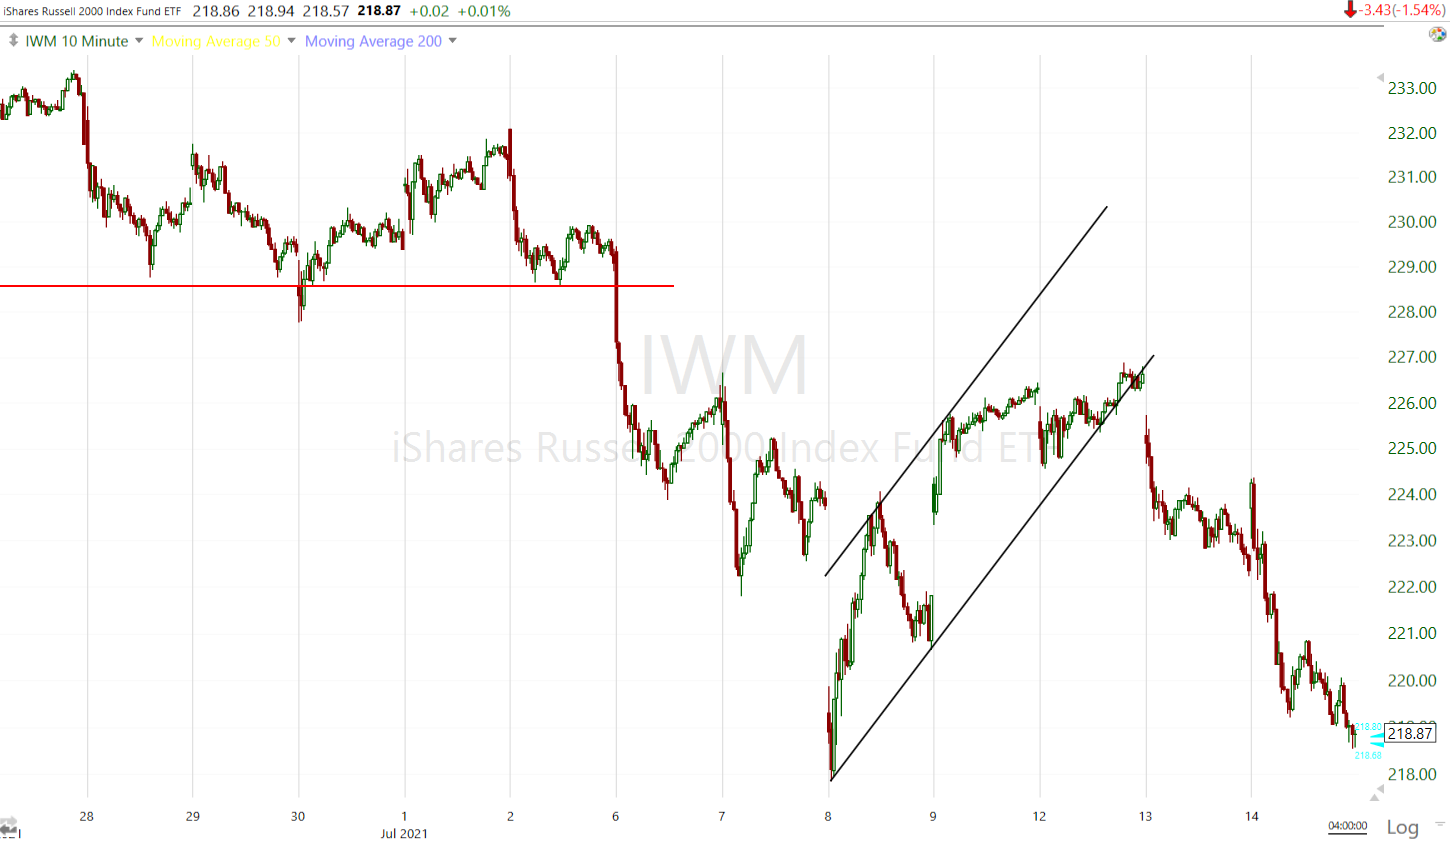 Small Cap IWM (10m) followed through to the downside on the break of the bear flag.
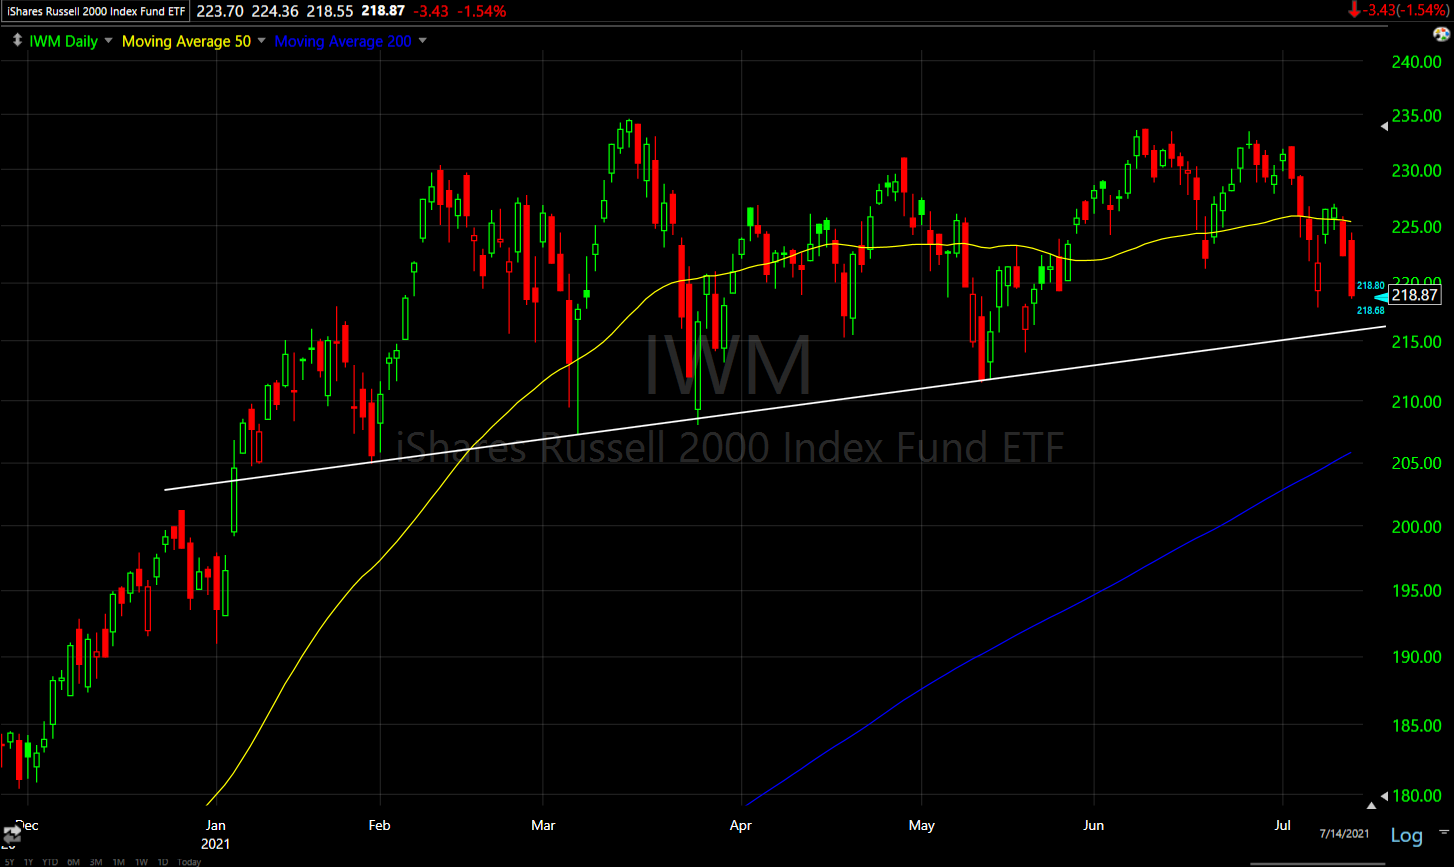 IWM (daily)- Small Caps are only -1.25% from the anticipated measured move downside target, which is the 2021 toppy pattern’s neckline.
IWM’s 3C chart has been leading price lower and continues to, so I see no reason price won’t reach the trend line.
 IWM (1m) 3C leading lower
Small Caps continue to more deeply diverge with the S&P.
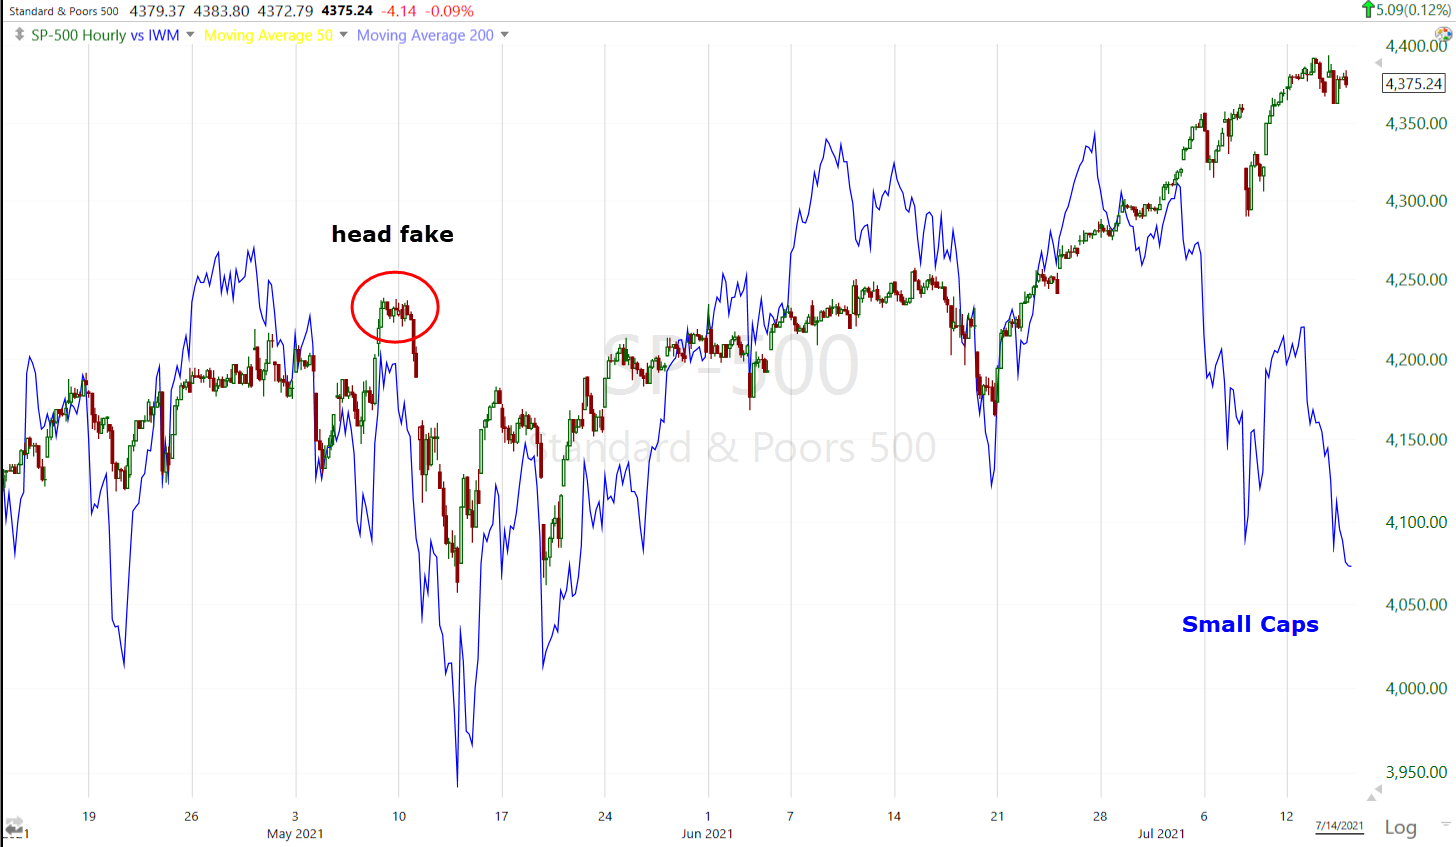
SP-500 (60m) and Small Caps normalized
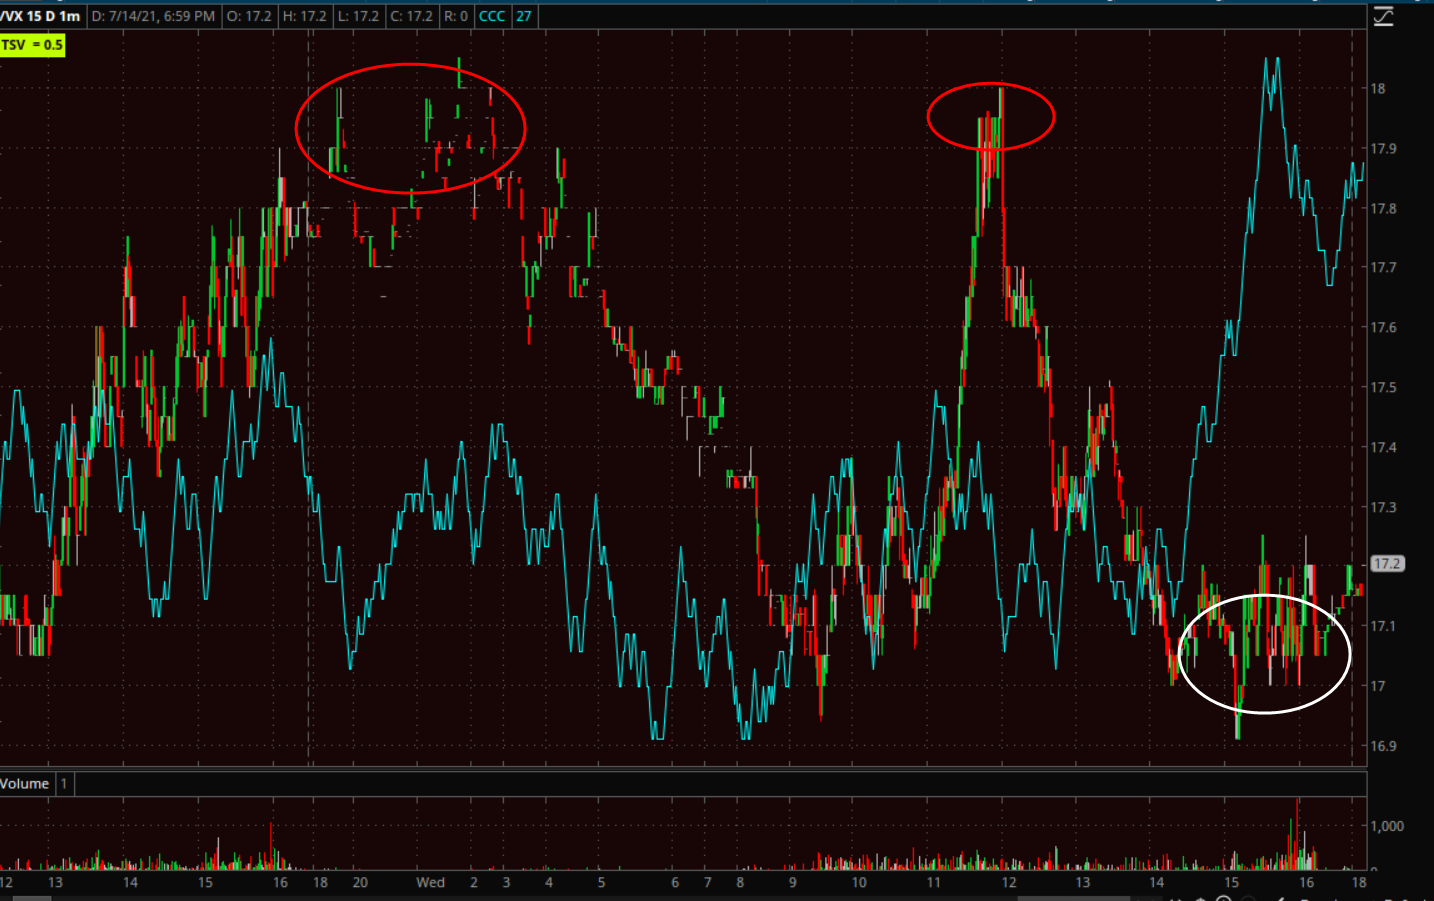
VIX (-4.6%) still maintains a trend of relative strength from July 2nd and found support again in the area of $16.
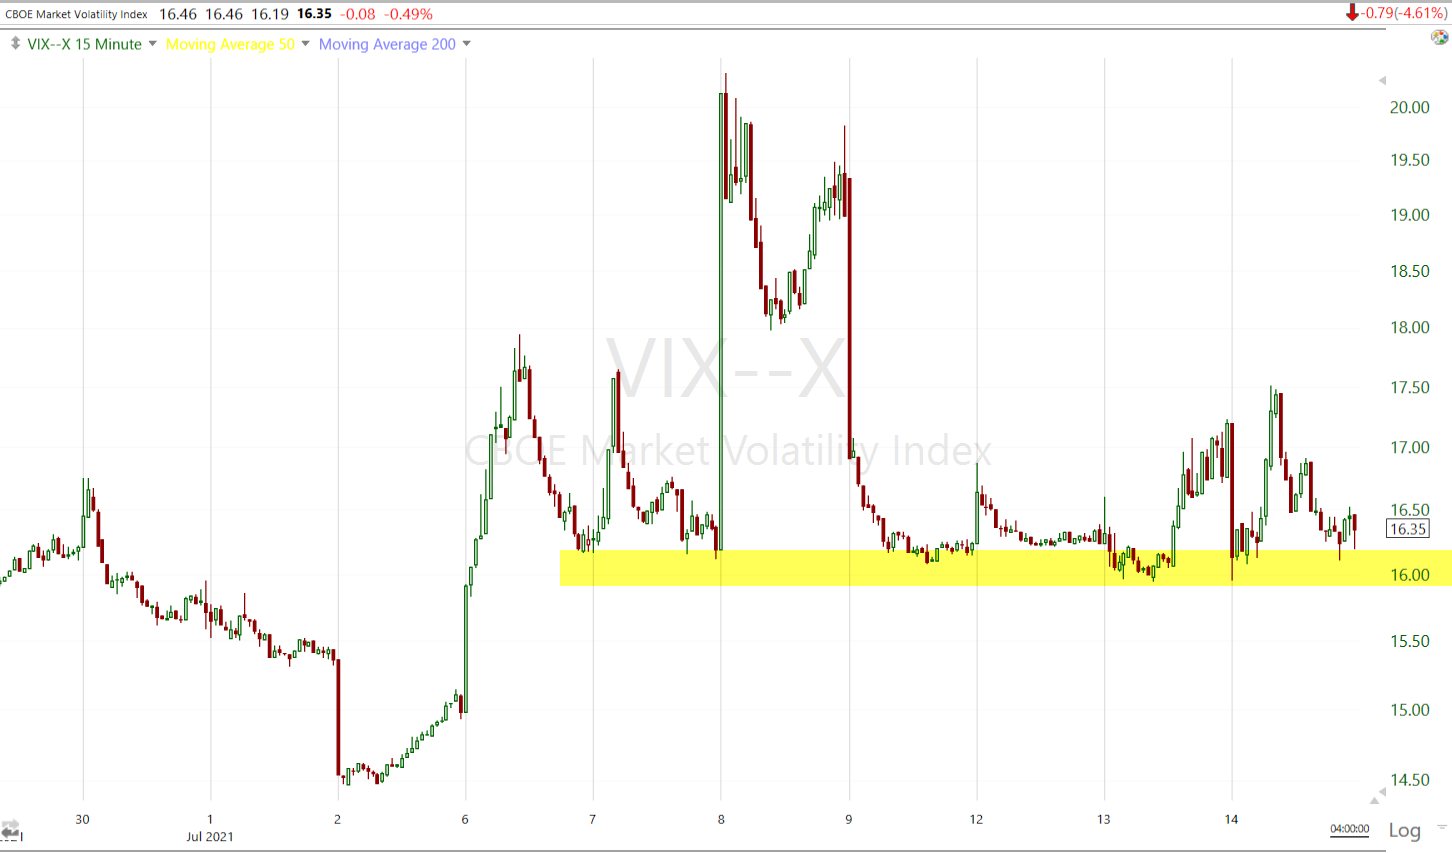 VIX (15m)
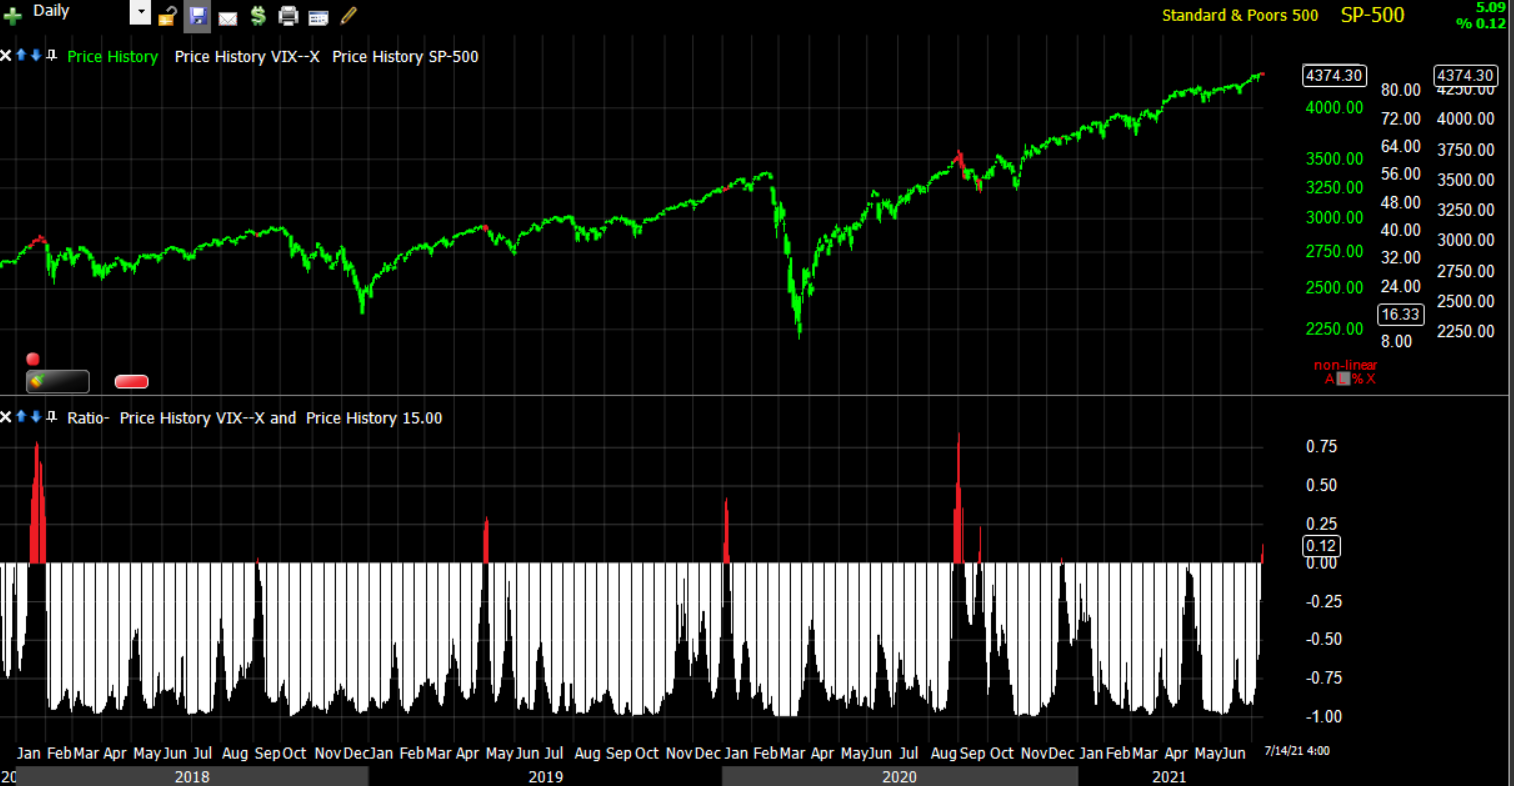 VIX’s 15-day correlation with the S&P is positive (red), which has typically been seen at market corrections.
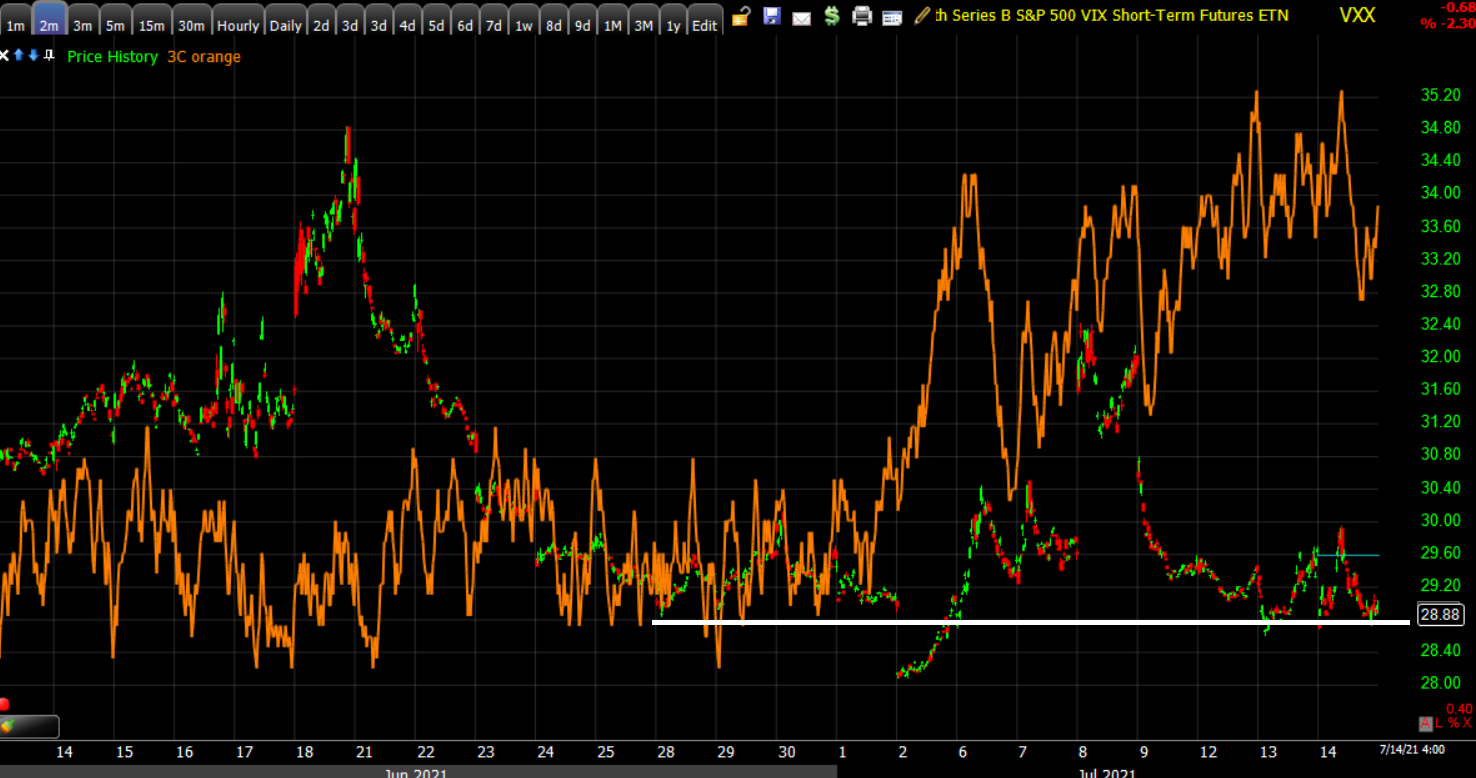 And VXX’s (2m) 3C chart has a positive divergence around the area of VIX $16.
Don’t forget that the Absolute Breadth Index traded down to 13 again yesterday suggesting a high probability of a double digit percentage move coming up in VIX.
S&P sectors
Four of 11 S&P sectors closed green. The day’s sector bias was very fluid with mega-cap heavy sectors (Technology, Communications and Consumer Discretionary) initially leading, which is a more defensive bias than cyclicals. Then more defensive bond proxy sectors took over leadership (Consumer Staples, Utilities and Real Estate).
The economically sensitive cyclicals underperformed with energy the worst amid lower oil prices (-2.9%). The Financials sector had to contend with negative reactions to EPS beats from Bank of America (BAC -2.5%), BlackRock (BLK -3.1%), and Citigroup (C -0.3%). Wells Fargo (WFC +4.1%) rose following its report. The banks kicked off earnings season yesterday and thus far the reaction to mostly better than expected results has been poor. Remember that the market is contending with not only peak economic growth concerns, but Q2 peak earnings growth worries.
Materials ⇩ -0.21 %
Energy ⇩ -2.98 %
Financials ⇩ -0.46 %
Industrial ⇩ -0.01 %
Technology ⇧ 0.74 %
Consumer Staples ⇧ 0.89 %
Utilities ⇧ 0.87 %
Health Care ⇩ -0.09 %
Consumer Discretionary ⇩ -0.18 %
Real Estate ⇧ 0.88 %
Communications ⇩ -0.07 %
While the most influential S&P sector, Technology’s, price trend remains supportive and solid…
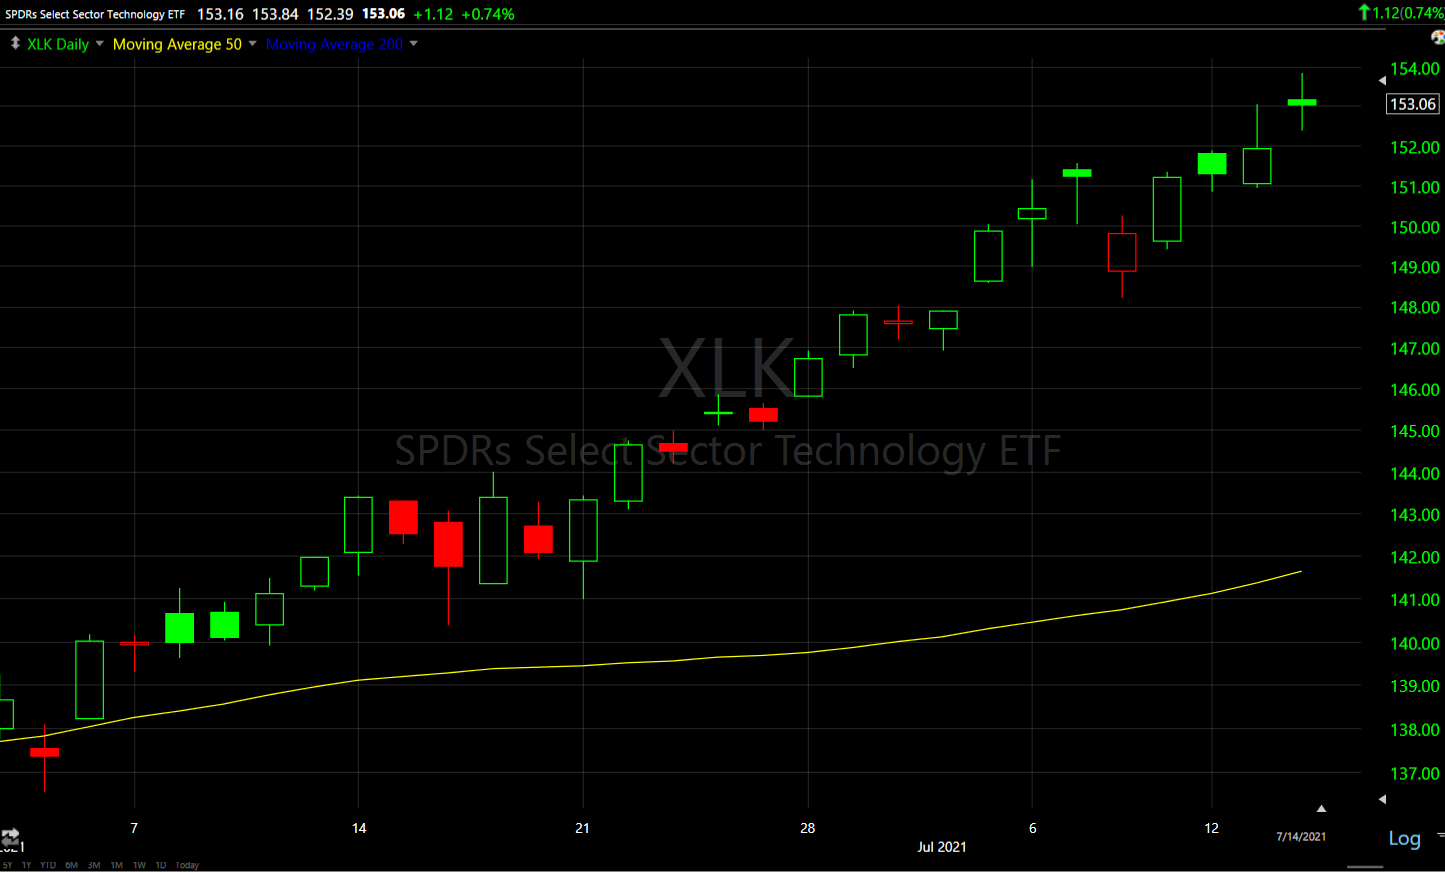 Technology sector (daily).
The more cyclical semiconductors (which underperformed Tech today — SOX -0.35%) within Tech that tend to be a canary in the coalmine for the Tech sector, have a worse looking chart.
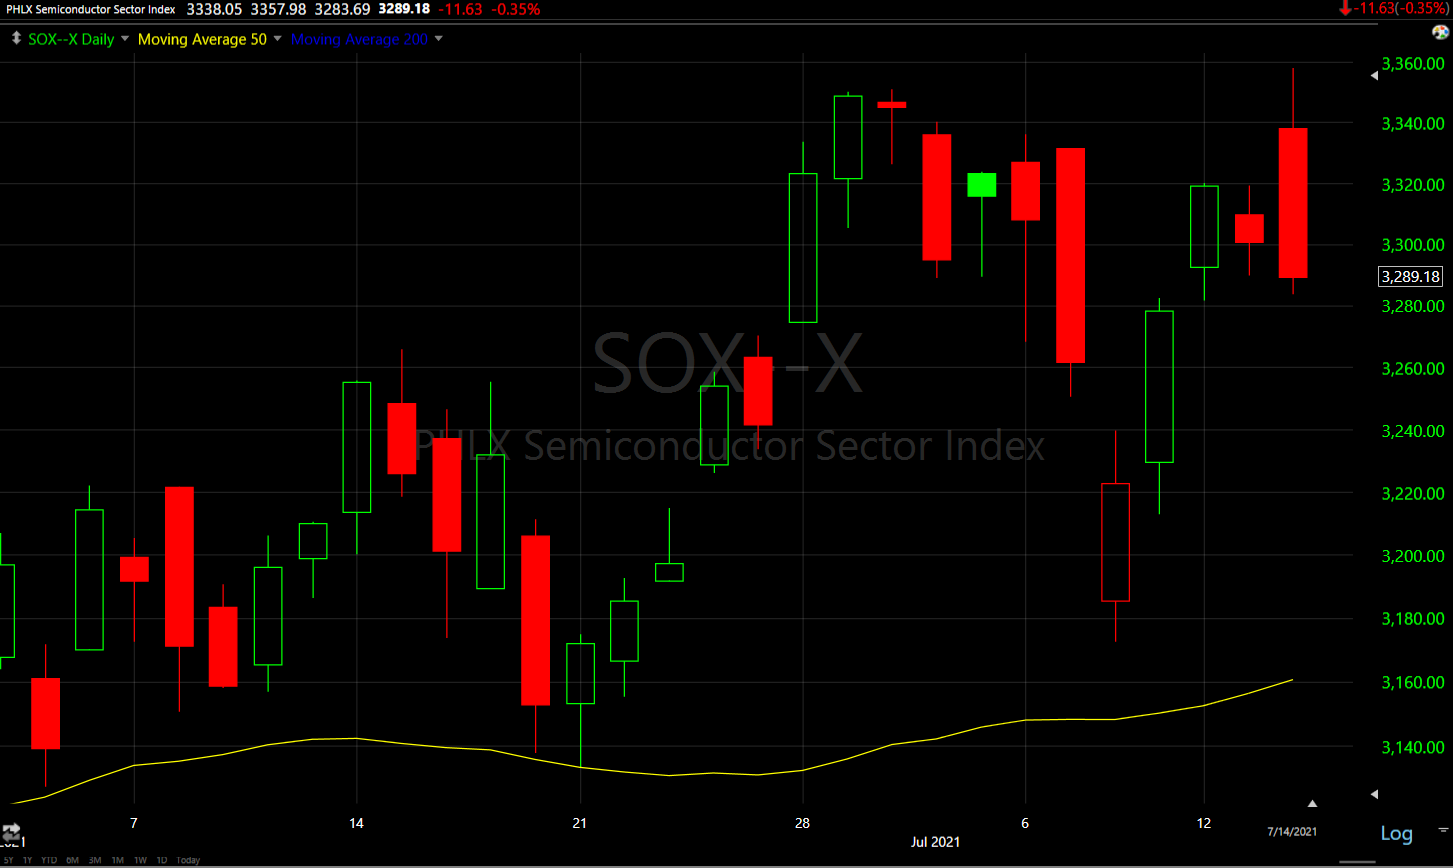 SOX Index (daily) with an inside day yesterday (higher probability reversal candle) and that saw bearish confirmation today with a bearish engulfing candle.
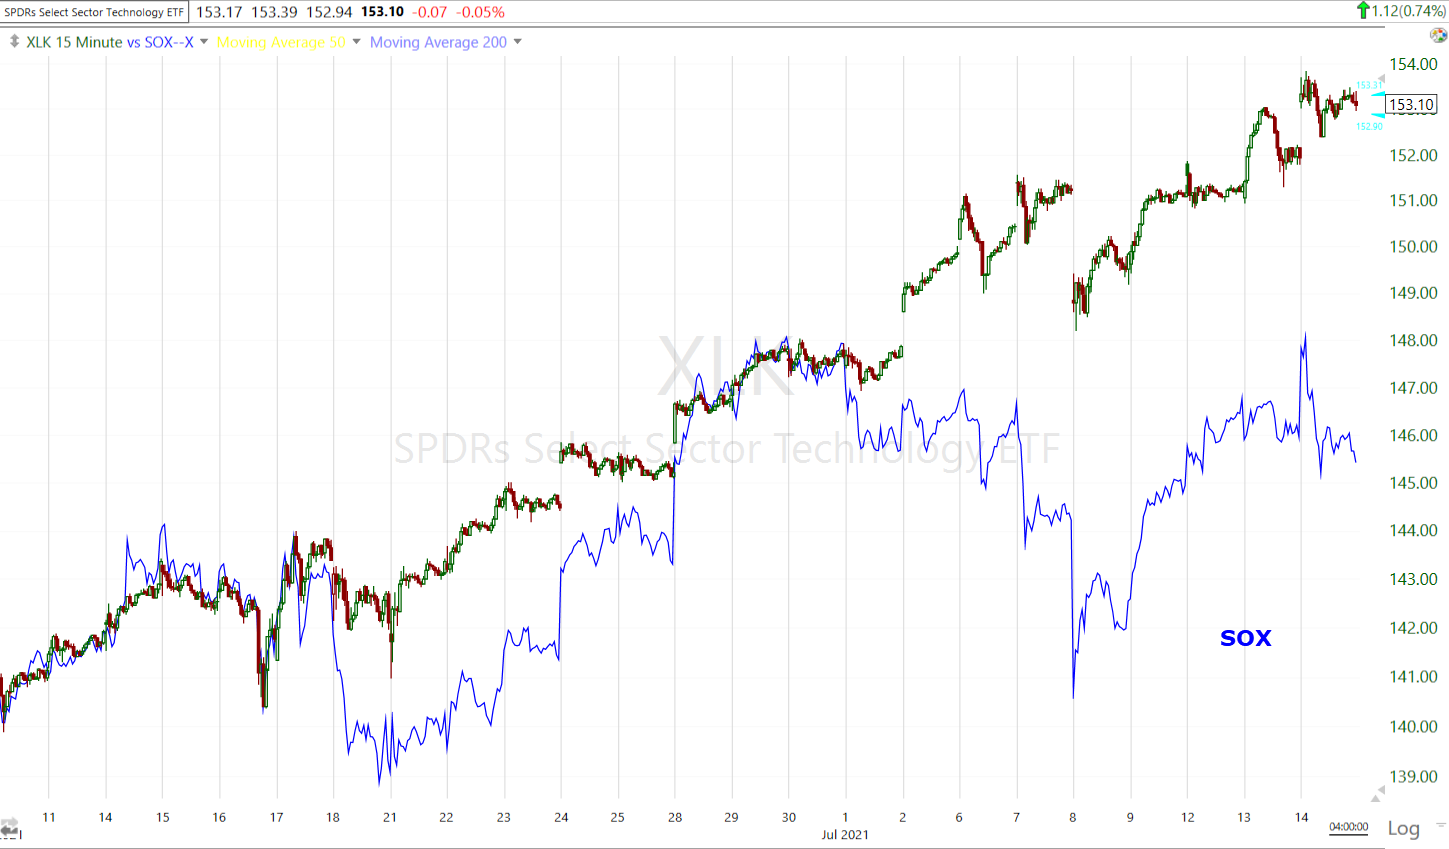 Technology sector (15m) with Semiconductors (blue) lagging.
Also of interest given the mega-cap sectors’ (Tech, Discretionary and Communications) early leadership is their close.
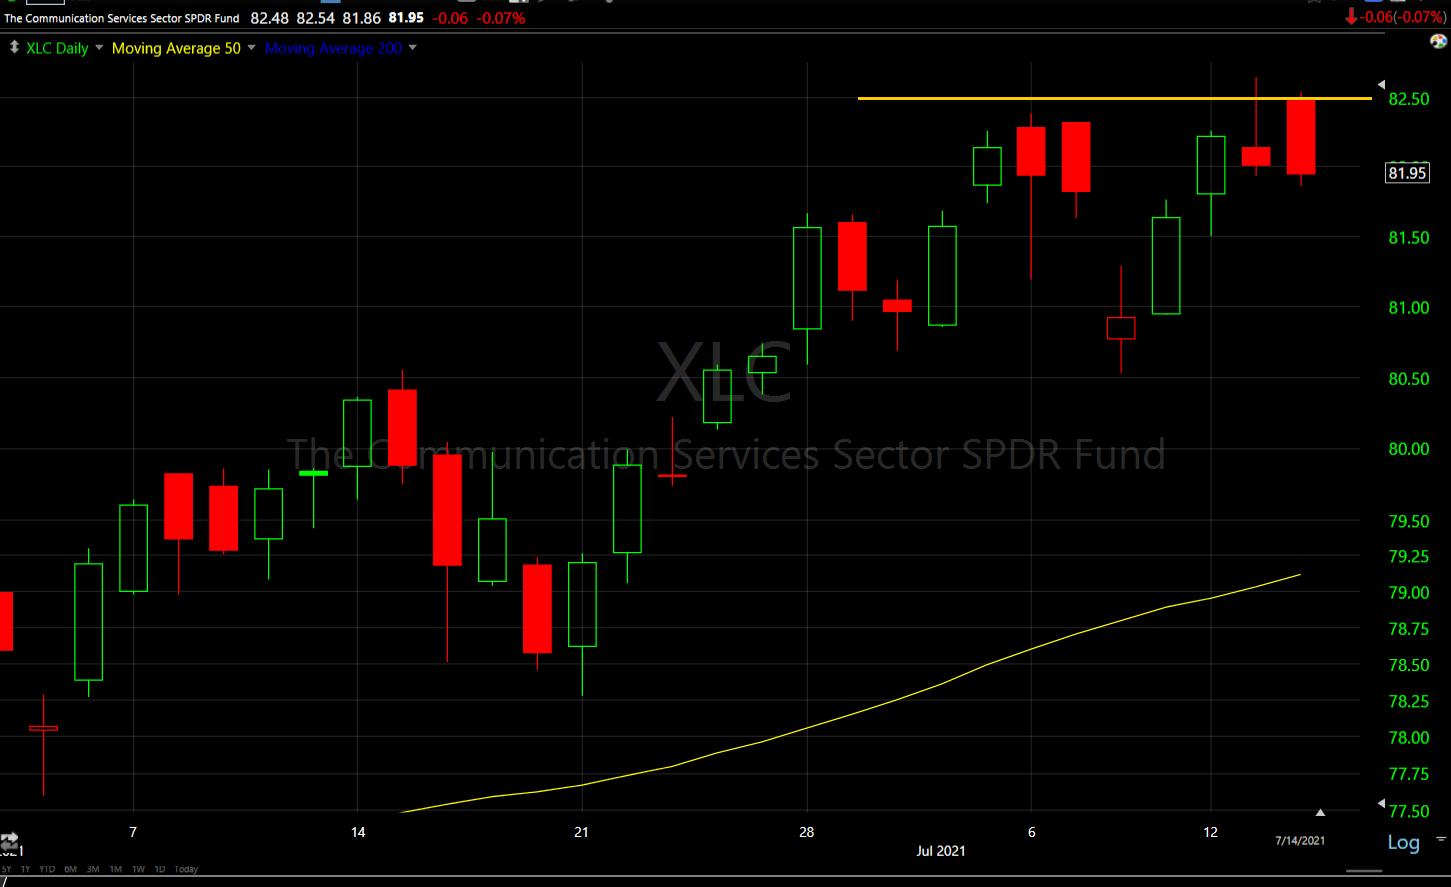 Communications (daily) appears to have resistance around $82.50 with a bearishly biased inverted hammer candlestick yesterday, and a bearish engulfing candle today with prices closing near session lows which is never a good look.
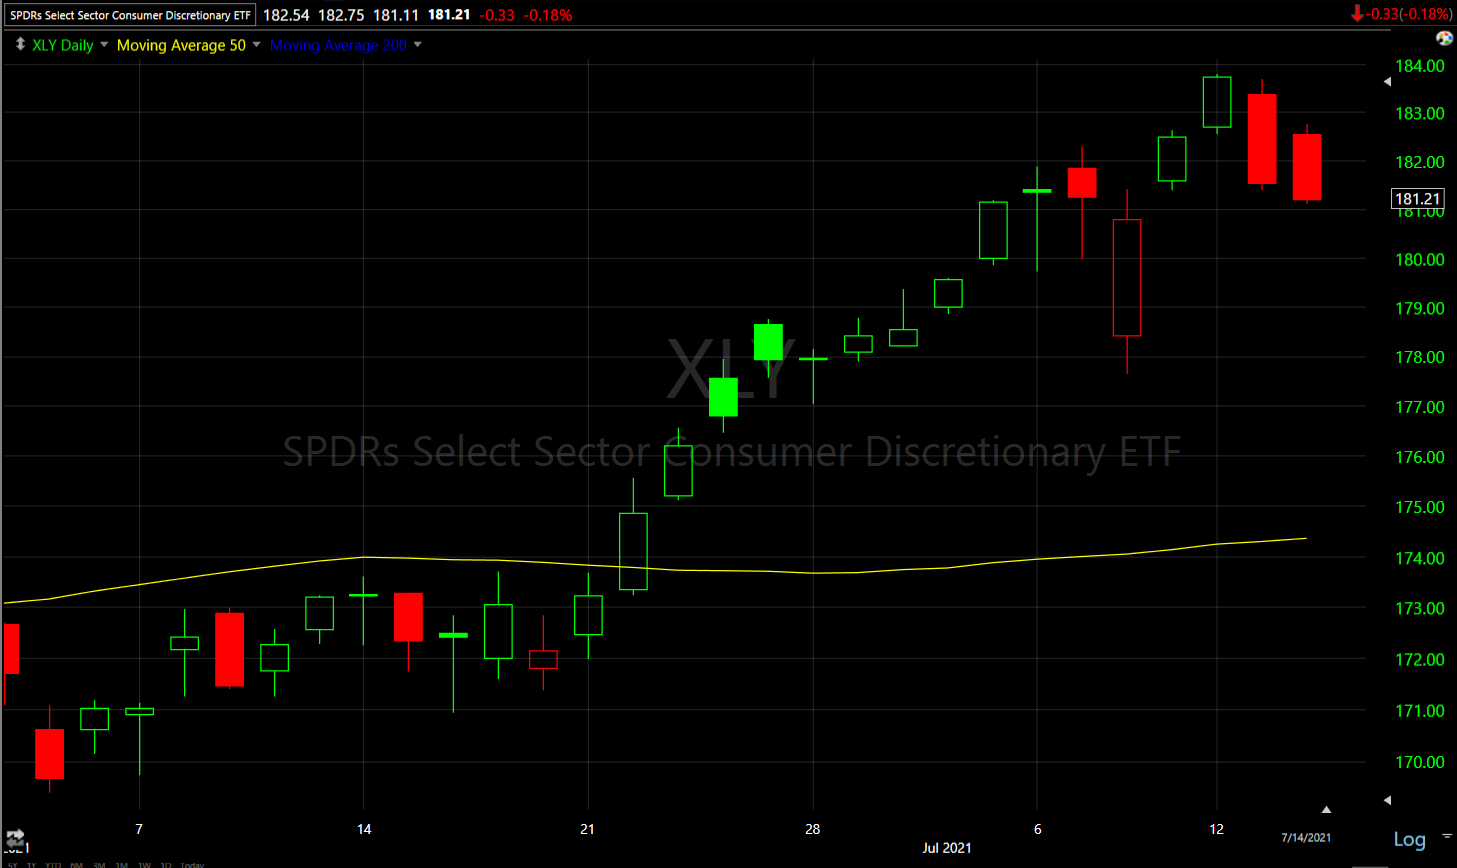 Consumer Discretionary (daily) was another early top-performer amid lower bond yields, but it too closed in the red giving up early gains and near session lows for a second day. While bond yields were supportive for these sectors today due to Powell’s comments, the real threat to them is inflation and despite Powell’s reassuring comments, we have had two back-to-back inflationary report in as many days come in much hotter than expected. This may have been the reason these sectors struggled to hold early gains.
Within cyclical sectors price action remains bearish.
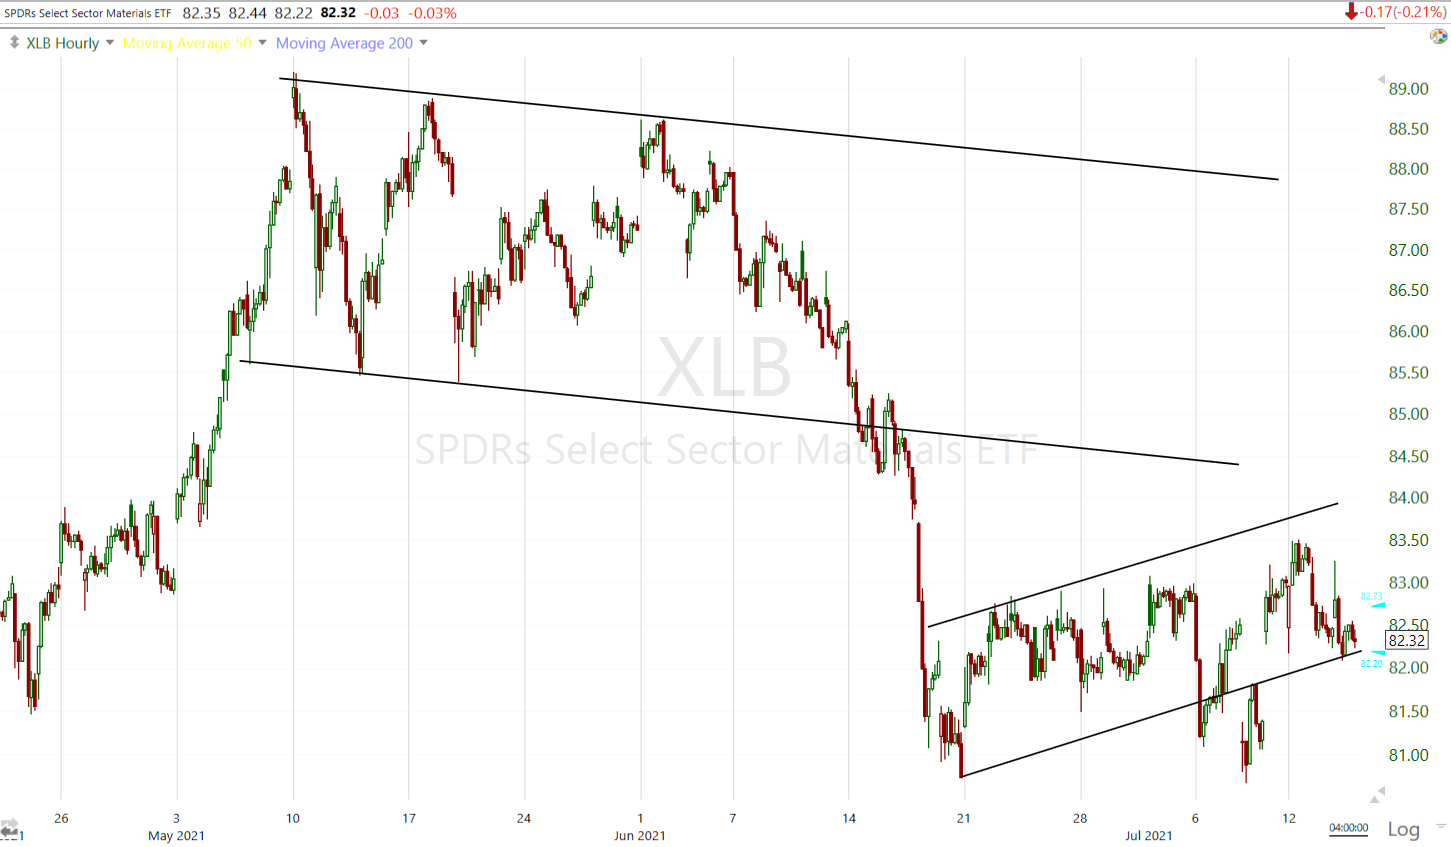 Materials sector (60m) bearish flag under a failed bull flag consolidation.
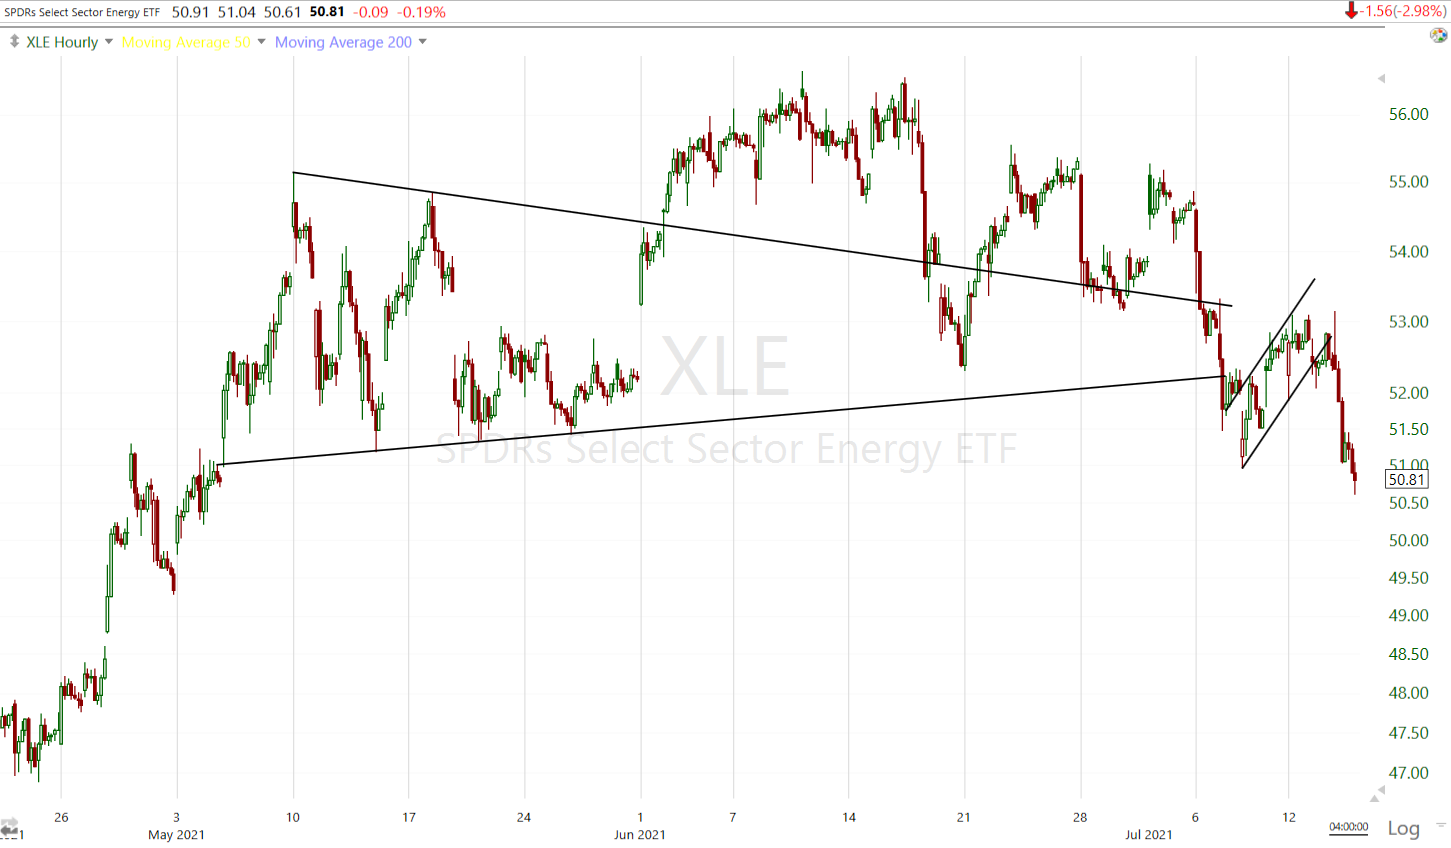 Energy sector (60m) a failed breakout from a bullish consolidation, and as suspected over a month ago, the all-too common fast reversal with the sector breaking down from a small bear flag yesterday and today.
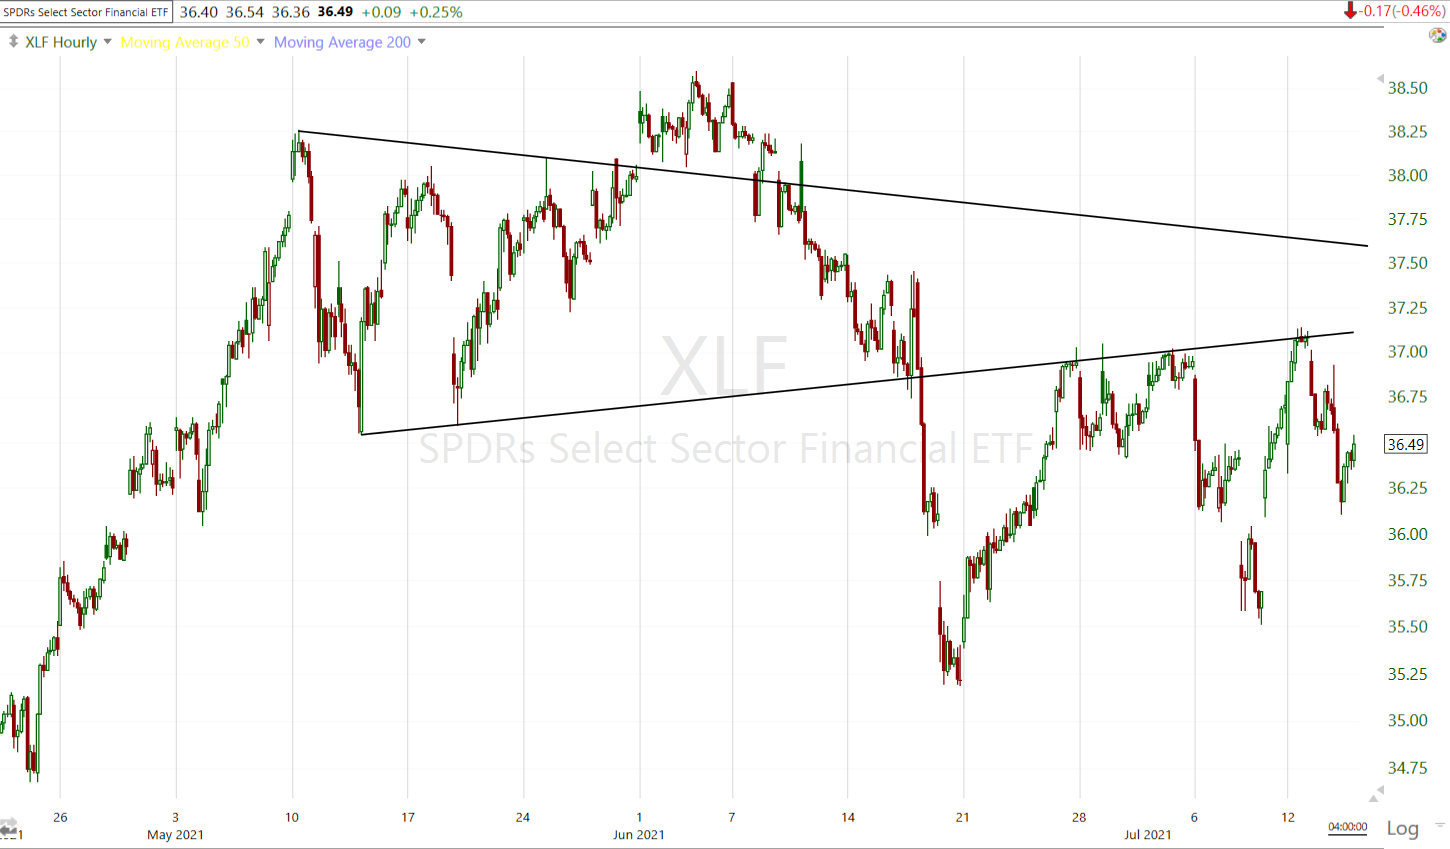 Financial sector (60m) is another example of a failed breakout from a bullish triangle and fast reversal. The sector has been bumping up against (back-testng) the former triangle.
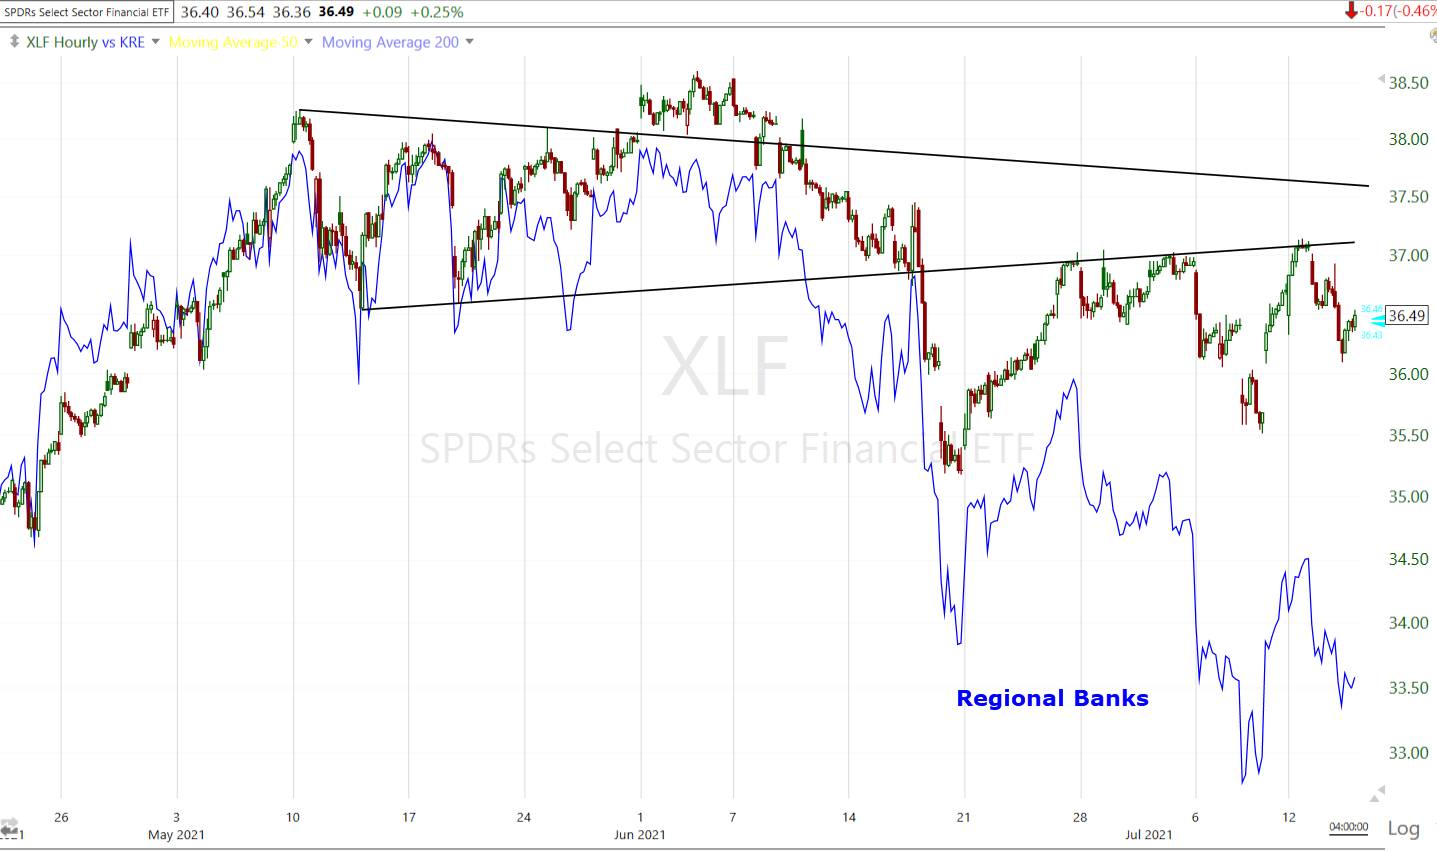 The Regional Banks (blue 60m) are leading the Financial sector lower and the banks are being led lower by the yield curve crash post June FOMC.
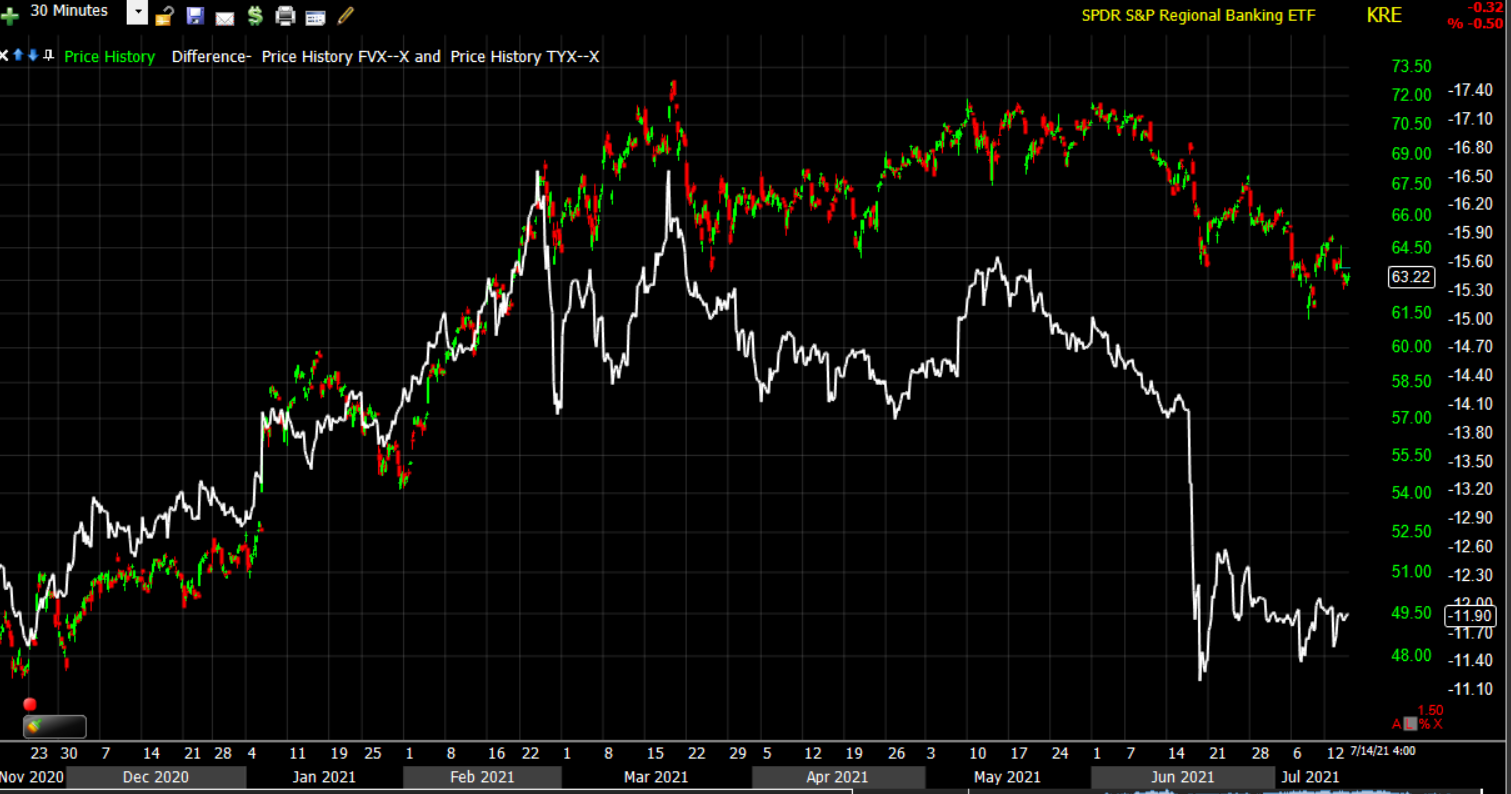 Regional Banks (30m) and the 5s-30s yield curve/spread in white leading banks lower.
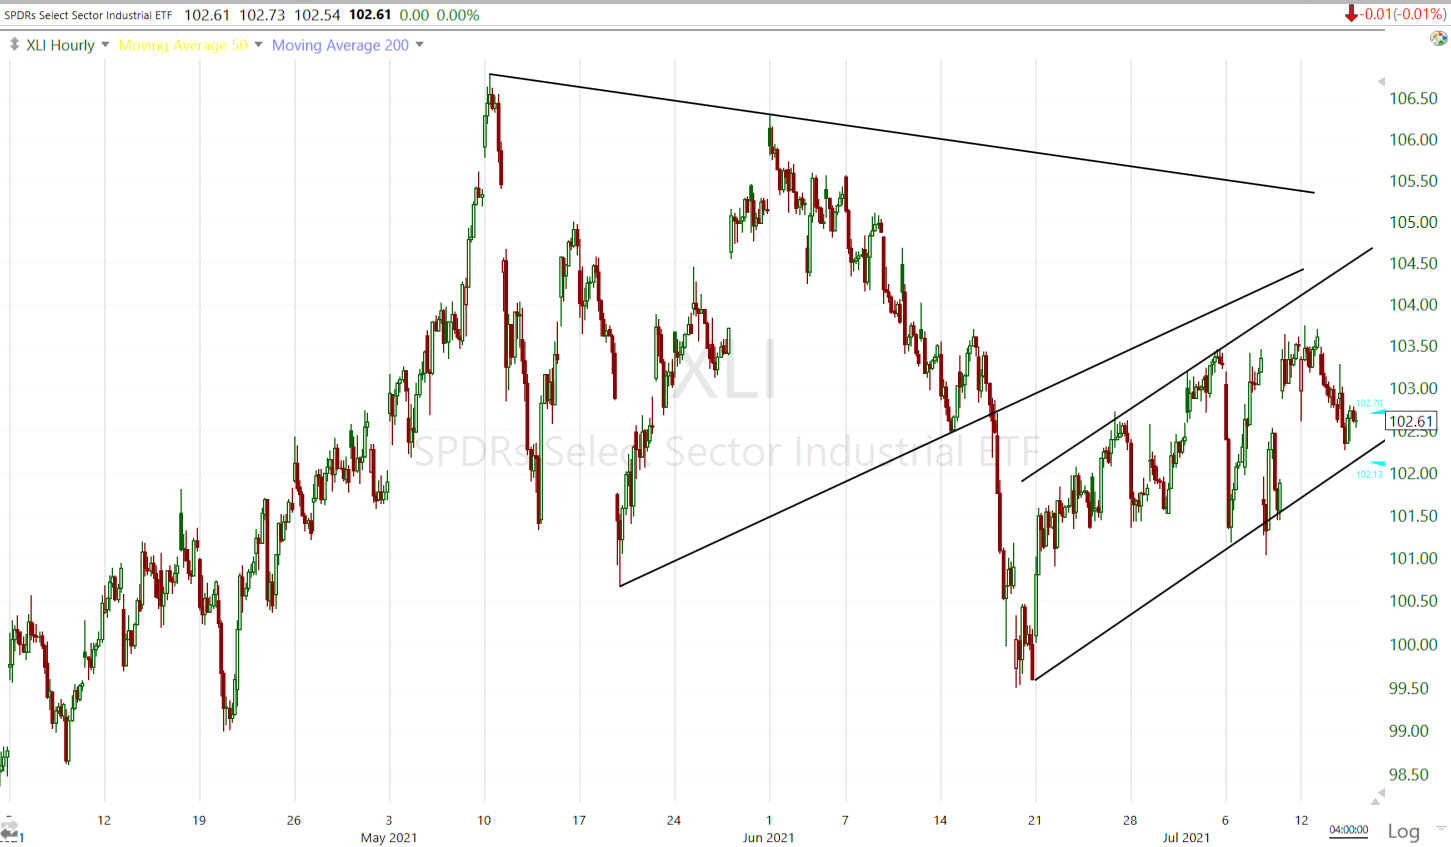 Industrial sector (60m) another failed bullish triangle and subsequent bear flag. Transports look worse and suggests that Industrials are more likely than not to resolve lower, as does their bear flag.
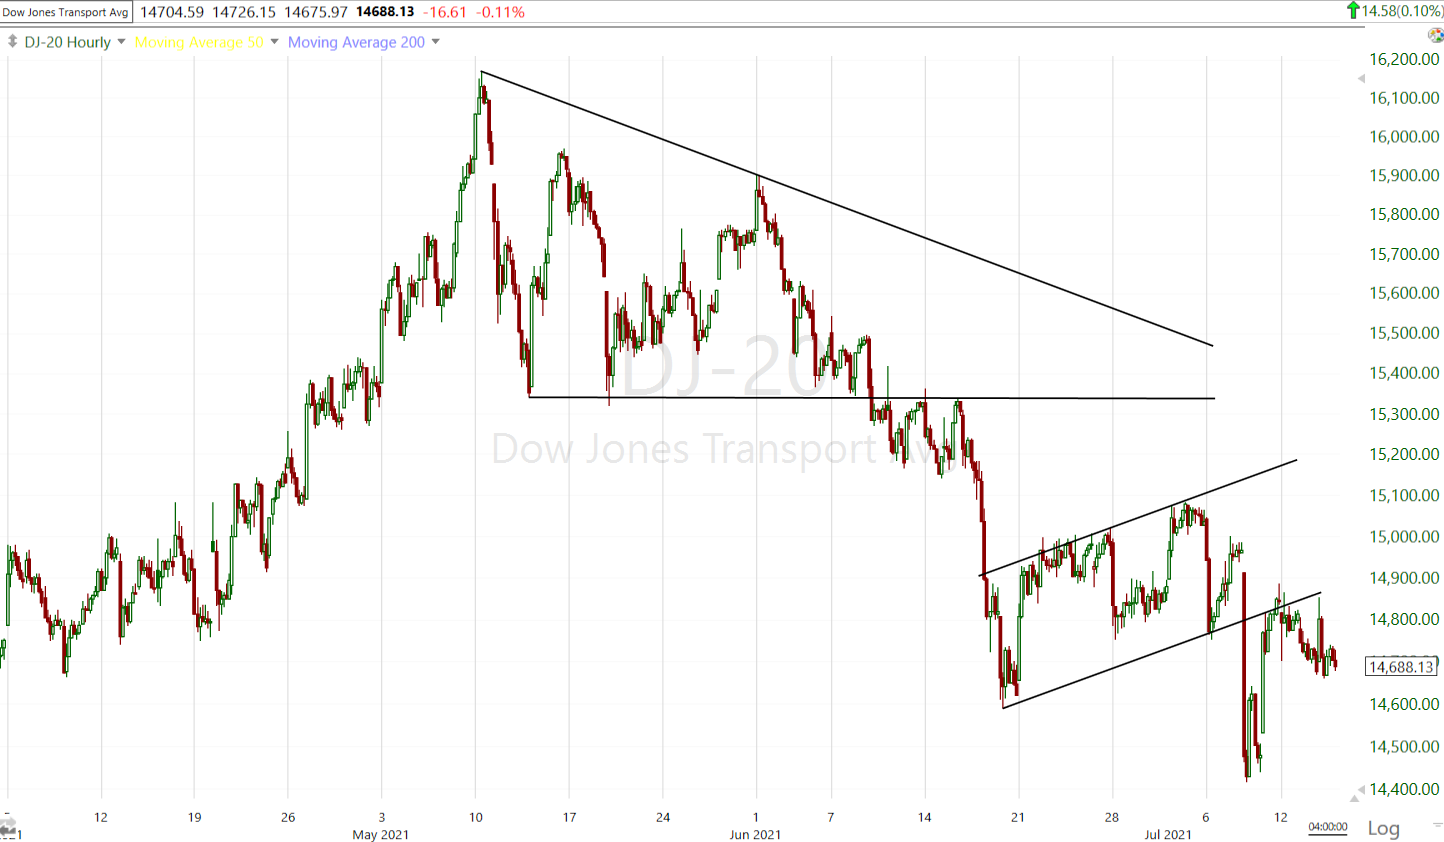 Dow Transports (60m) broke down from a bearishly biased descending triangle with a subsequent bear flag that has broken and is back-testing.
Even some of the defensive bond proxy sectors don’t look great.
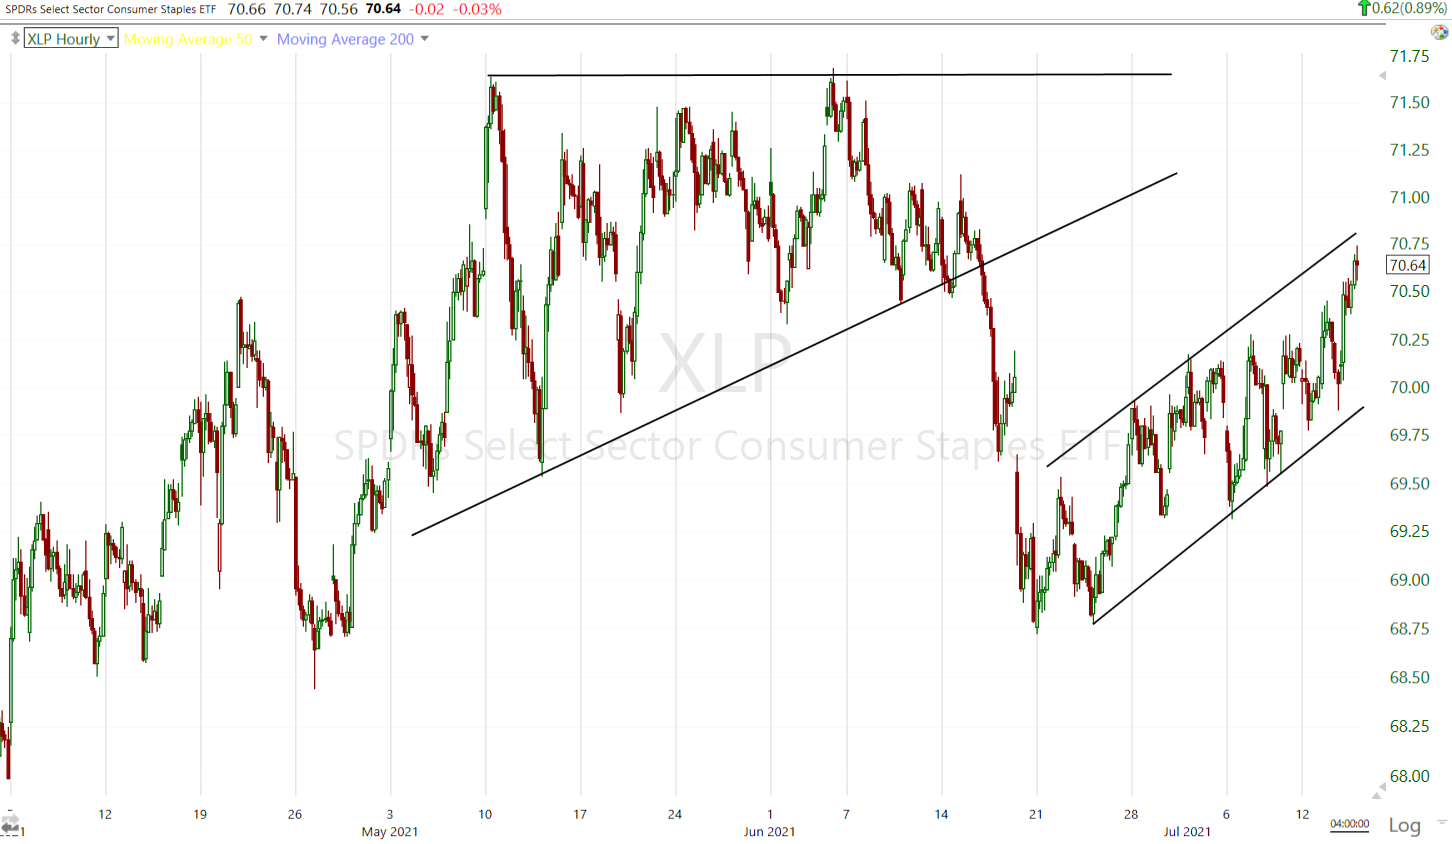 Consumer Staples (60m) with a failed bullish ascending triangle and subsequent bear flag. Today’s Producer price index tells us exactly why the sector is facing an uphill battle as producer prices see inflation, that has to either be passed on to customers, or absorbed in the way of an earnings hit by the companies.
That’s not to say there aren’t a few sectors that look decent including the most influential, Technology.
 Defensively oriented Health Care’s (60m) price trend looks bullish and solid, although it may be a little stretched and due for a consolidation/pull back.
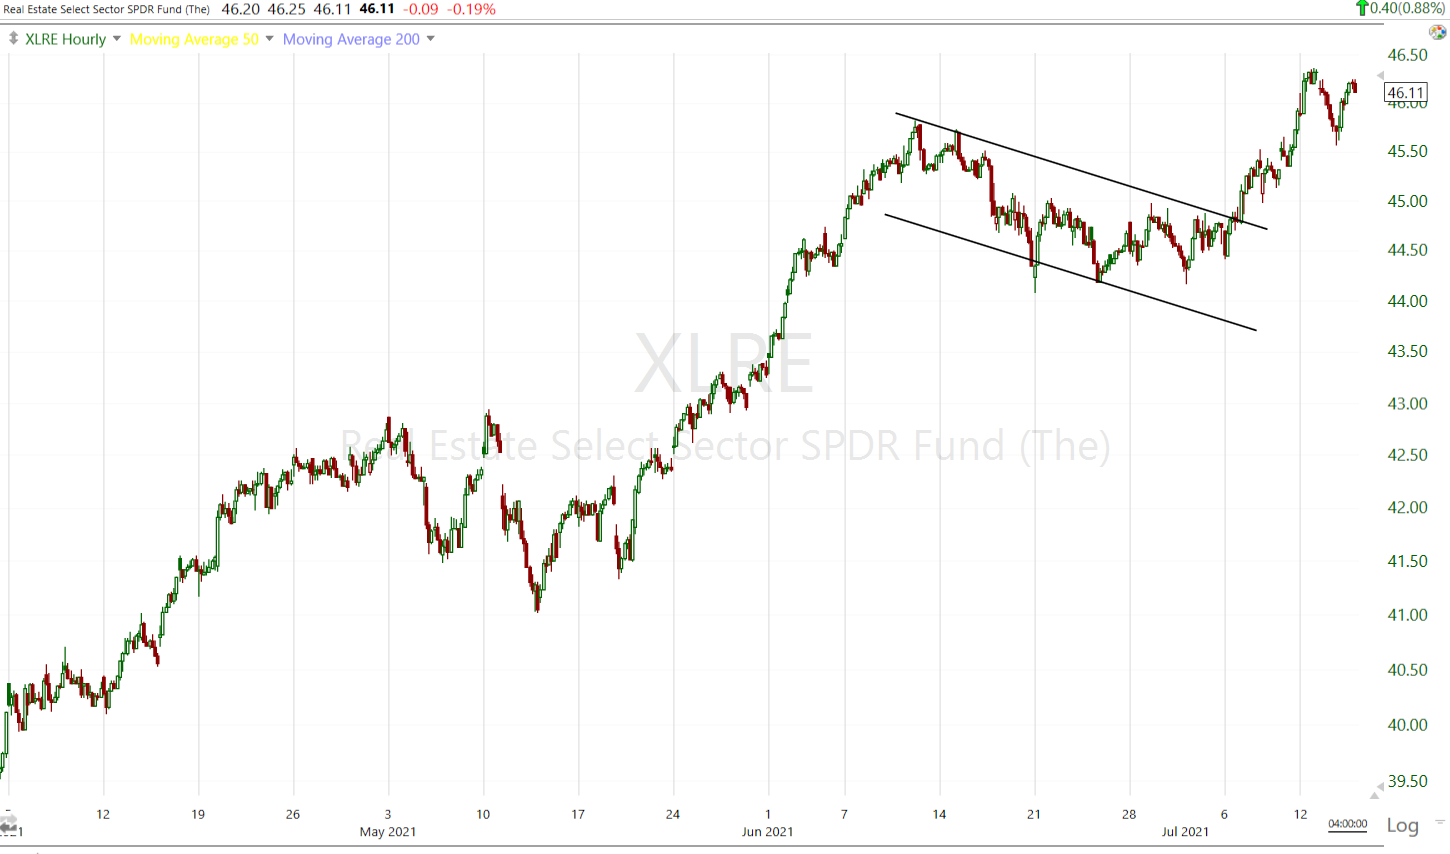 And defensive Real Estate (60m) has a nice looking price trend with an advance, bull flag and another advance. It too may need to do some correcting/consolidating in the near term.
On the whole, there aren’t a lot of great looking sectors and this explains in part the market’s horrendous breadth. Technology’s achilles heel would be a continued surge in inflation.
Internals
NYSE Decliners (1867) outpaced Advancers (1342), but not by a wide margin. NASDAQ’s decliners were 2-to-1 over advaners. NYSE’s volume came in a little heavier today at 870 mln. shares.
There is no Dominant price/volume relationship and internals do not reflect any kind of 1-day overbought/oversold conditions.
Despite a positive start for the averages, the NASDAQ Composite’s advance/decline line was signalling early trouble in the Early Update.
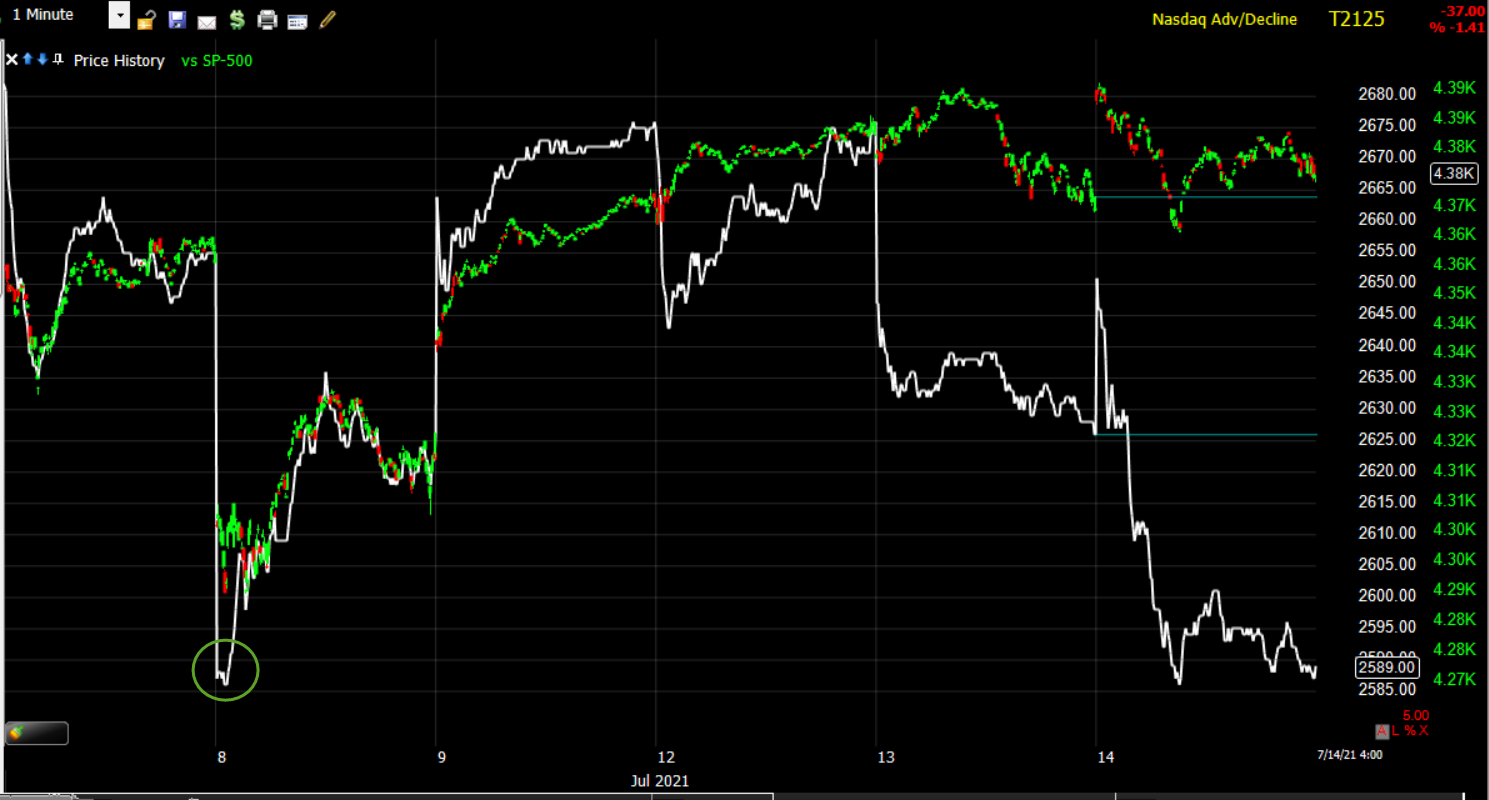 While the S&P-500 hasn’t moved more than a tenth of a percent (0.1%) the last 3 days, the A/D line plunged back to last Thursday’s low, which is an 8 week low.
This breadth chart is shocking, it’s so bad it’s difficult to scale it in a way that does it justice.
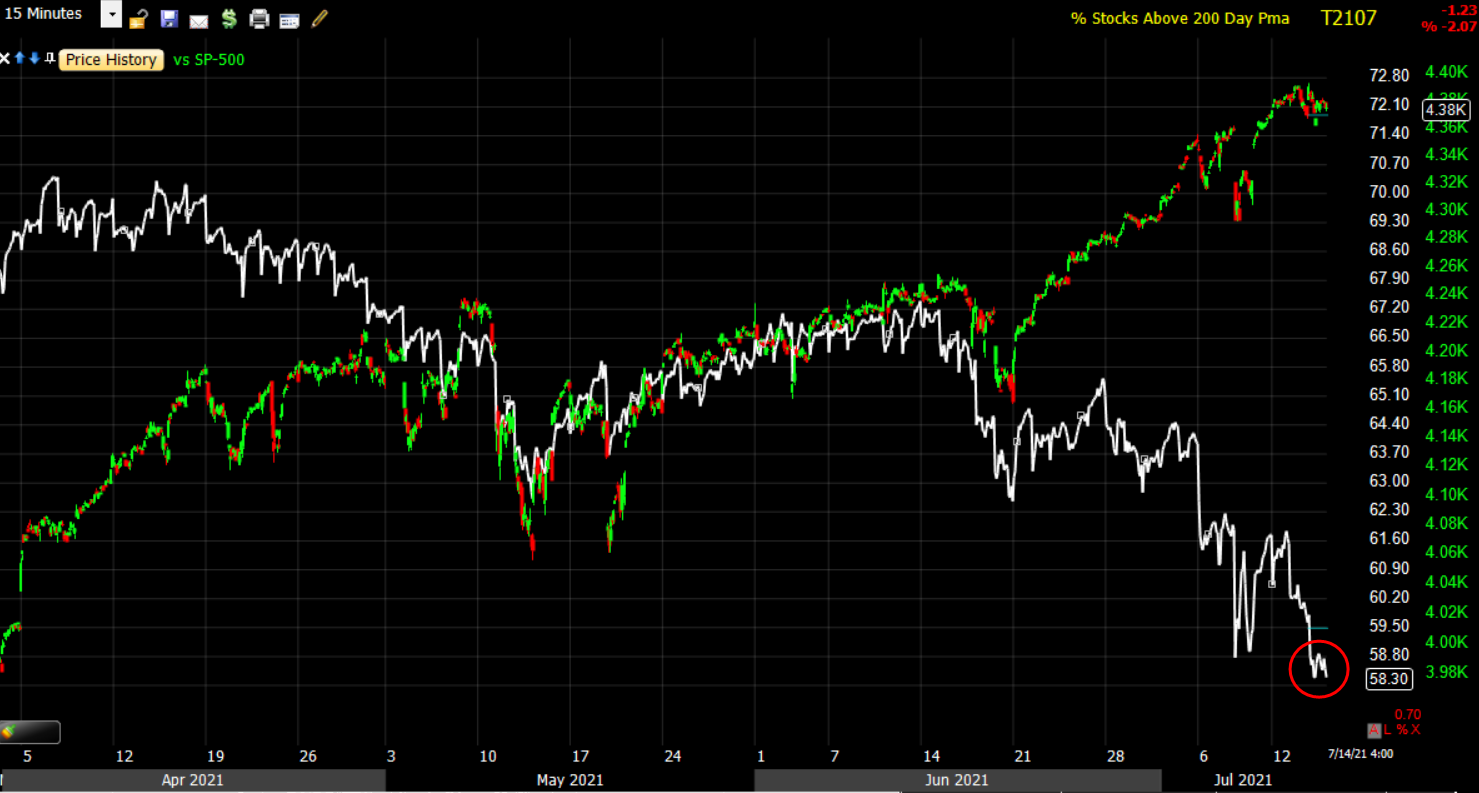 SP-500 (15m) and the Percentage of NYSE stocks trading above their 200-day moving average fell to lows today not seen since November of 2020 when the S&P was 25% lower! More immediately, you can see how sharply breadth has deteriorated over the last 4 weeks as the S&P rallies from it’s 50-day moving average in June, while more and more NYSE stocks slip below their long-term 200-day moving average.
Treasuries
Treasuries gained and yields fell fairly sharply, the opposite of what would be expected given the second hot inflationary report in as many days (CPI and PPI), but this was due to Powell’s prepared remarks in pre-market. The 2-year yield decreased three basis points to 0.22% as the market took Powell’s comments to mean that the Fed would not hike as soon as the market expects, but remember that the Fed chair is just one vote on the FOMC committee and their last dot-plot shows a much more aggressive rate hike path as of June.
The 10-year yield fell six basis points to 1.36%
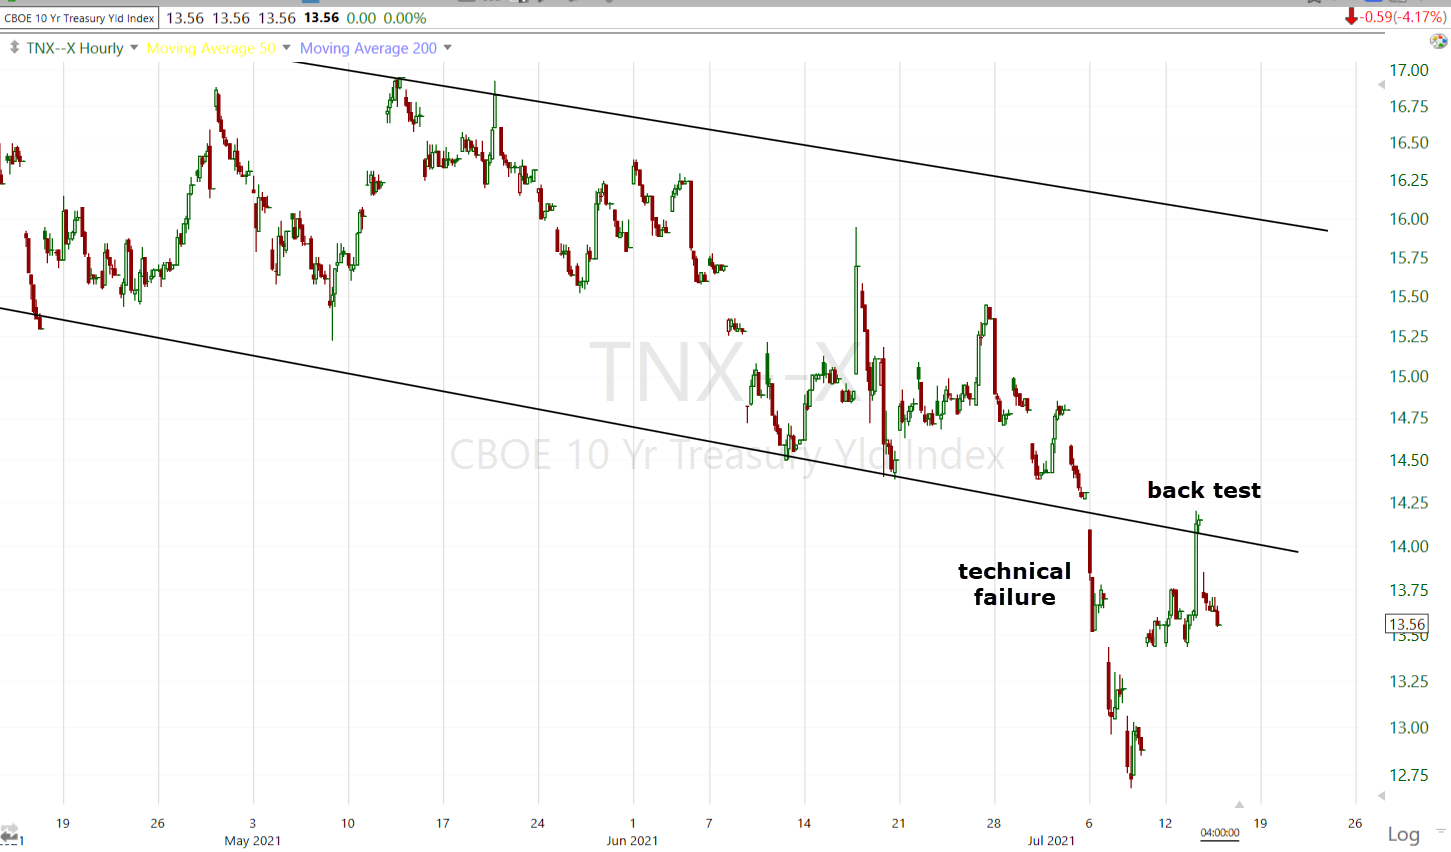 10-year yield (60m)
TLT (+1.14%) pulled back from last Thursday’s high/equity market’s low, and I’ve expected a bullish consolidation to develop, but before today it was too early to tell if I was correct, and what type of consolidation. Today’s price action gave us a little more color.
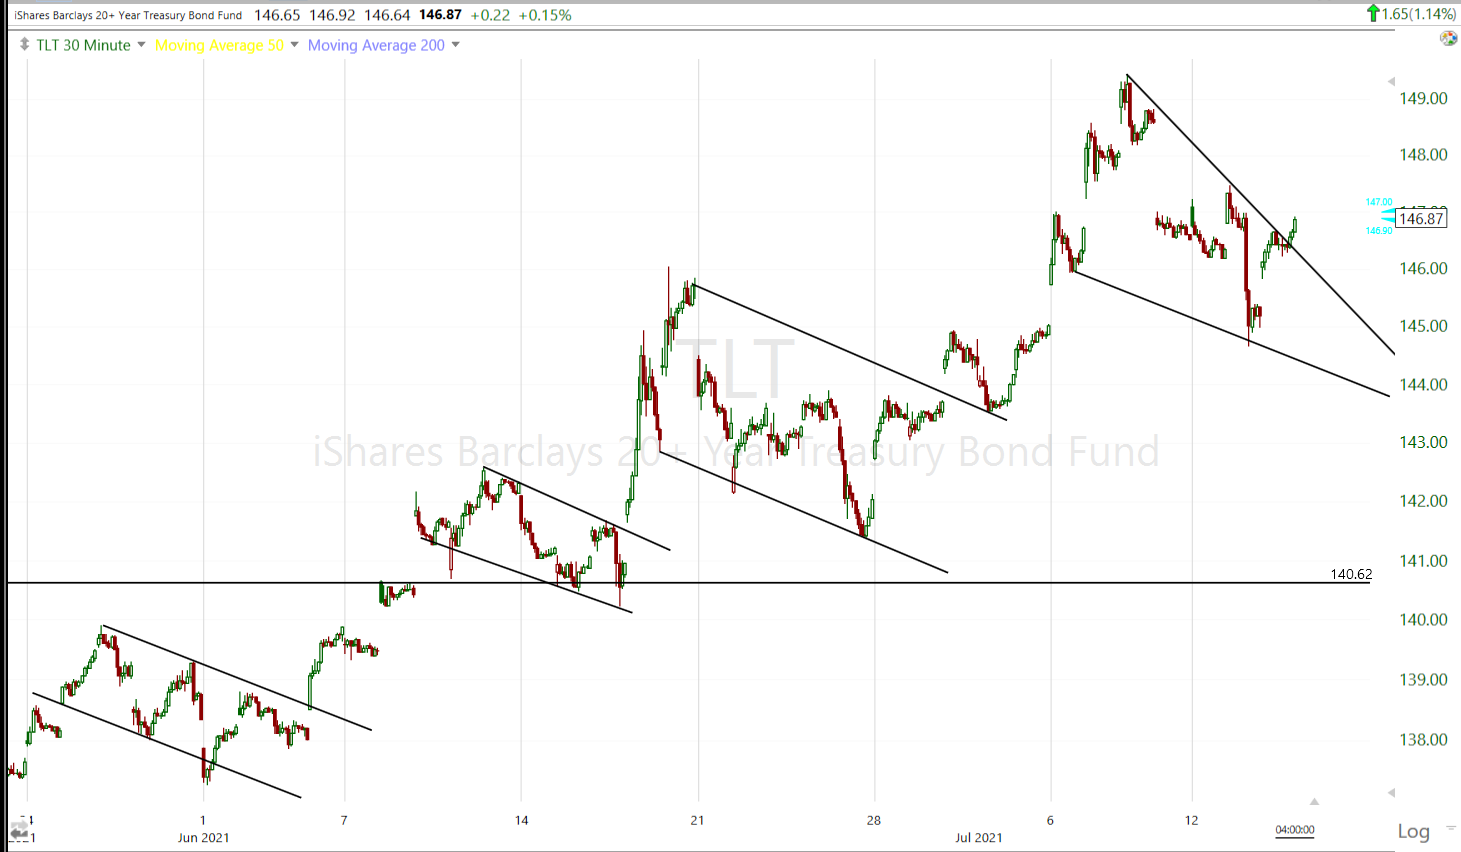 TLT (30m) this looks like a bullish descending wedge with an apex around Friday, but recall that the last large bull flag also started as a wedge and widened out to a bull flag. The slight push above the trend line toward the close suggests there’s a possibility that this develops into another bull flag, still bullish, but we lose something on the timing of the narrowing trend lines to an apex. Either way, I still expect TLT to fulfill the last bull flag’s measured move up toward $151.50.
Credit has been flashing some warning signs in recent days.
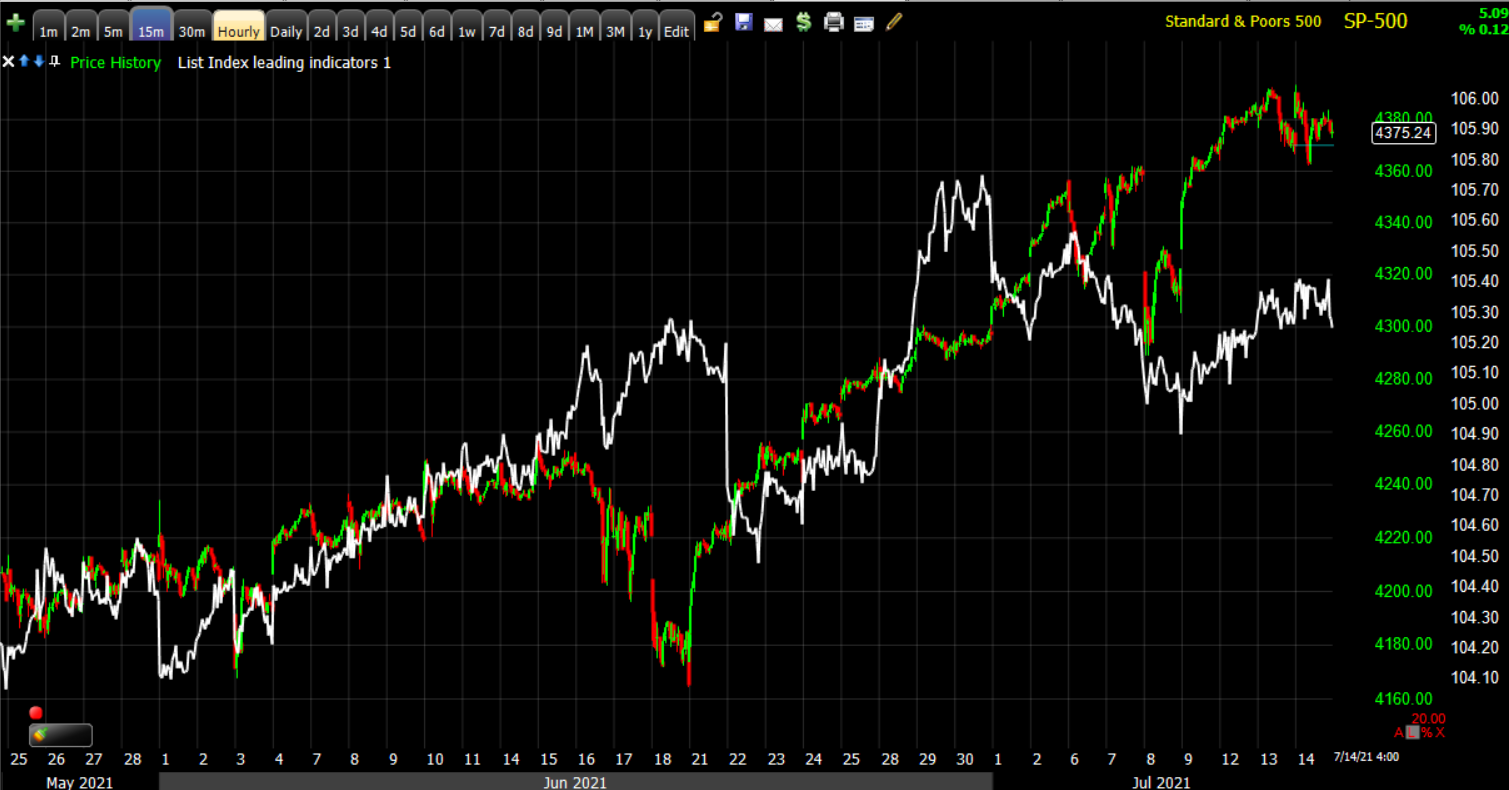 SP-500 (15m) and my equally weighted index of credit assets. In my experience, High Yield Credit or HYG specifically, is one of the most insightful of my leading indicators as it gives us a window into what institutional money is doing and they appear to be backing off risk exposure.
 SP-500 (2m) and HYG (blue), the latter has been diverging lower for almost a week. When I took a look at HYG’s intermediate trend 3C chart I was quite surprised.
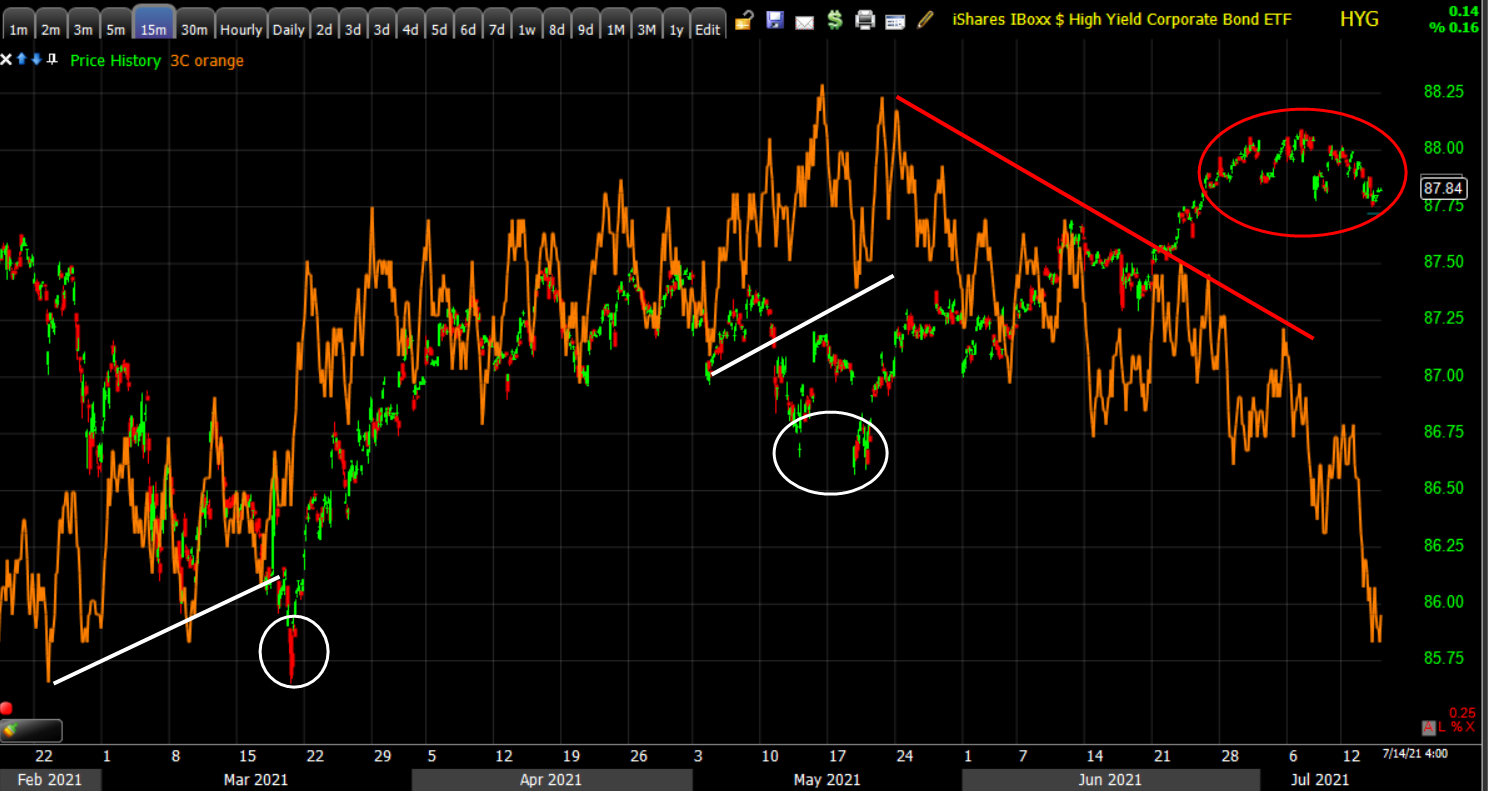
HYG (15m) positive 3C divergences in white and negative in red. Not only is 3C negatively divergent, but has started to lead lower.
Currencies and Commodities
The U.S. Dollar Index fell -0.4% to 92.37 on Powell’s comments ( a dovish reaction from the Dollar despite sharply higher inflation).
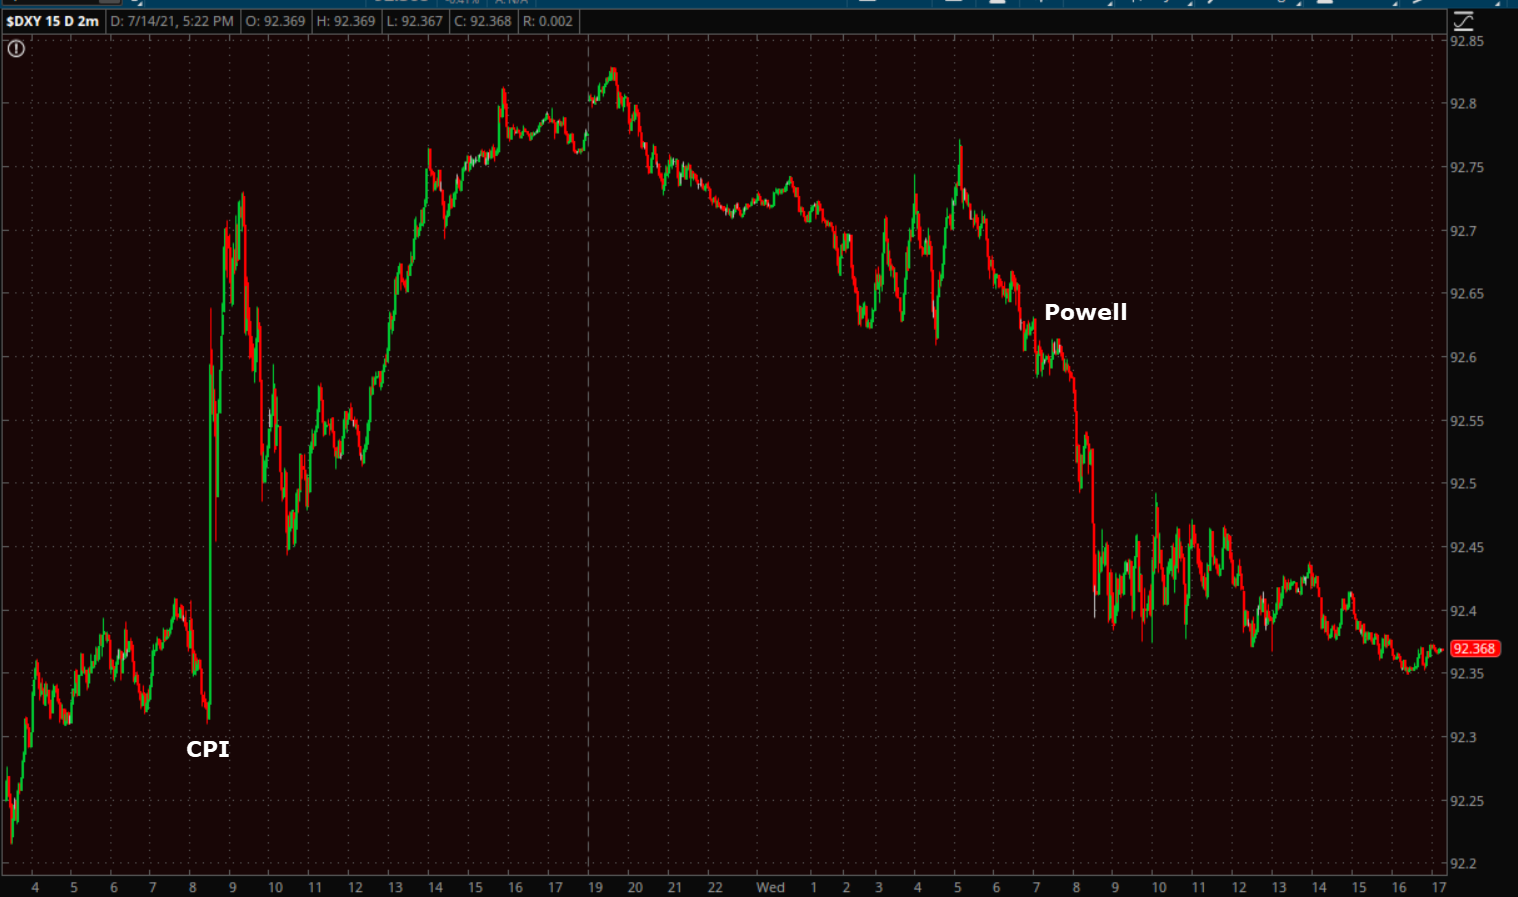 U.S. Dollar Index (2m) – the Dollar’s spike on CPI data yesterday reflected expectations the Fed would be forced to tighten due to surging inflation. Powell’s prepared comments in pre-market allayed those concerns and the Dollar retraced the CPI gains, despite another hot inflationary print from PPI this morning. The Fed chair’s words gave the market comfort that the Fed chair still doesn’t see inflation as such a big problem as to force the Fed to begin tapering monetary accommodation that has helped lift the averages and other risk assets off the 2020 crash lows.
WTI Crude oil closed lower by -2.9% to $73.07/bbl. Oil prices struggled after OPEC+ reportedly reached an agreement to increase production after failing to do so earlier this month. The news overshadowed the eighth-straight weekly inventory draw out of the EIA.
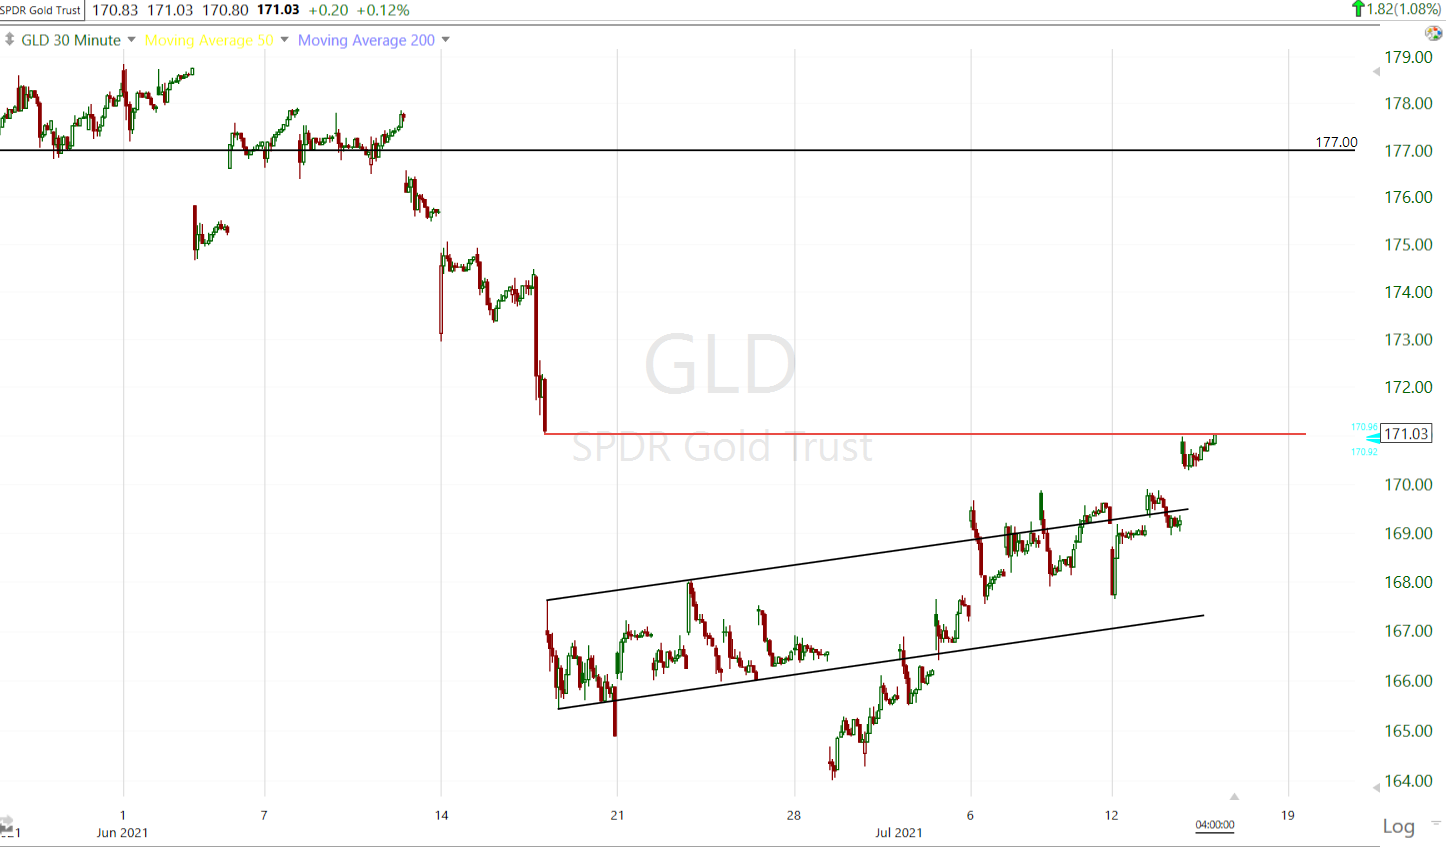
Gold futures settled higher by +0.8% to $1,825.00/oz, aided by a modest slip in the dollar and yields.
 As mentioned in last night’s Daily Wrap,
” GLD (gold) seems to have negated the last bear flag, but still has work to do to carve out a tradeable bottom in my view. GLD may try to fill the gap above before that happens.”
GLD filled that gap to the penny today.
Summary
Another day and another unexpectedly high inflationary print from PPI, following yesterday’s 30 year high in CPI. Coincidentally, and probably luckily, Powell’s semi-annual congressional testimony gave him the chance to counter the negative effect and send yields lower by intimating that the Fed not only expects inflation to be more persitient than initially assumed, but that the Fed will tolerate it for longer before countering it by tightening financial conditions. Some think the Fed is making a mistake. Amherst Pierpont’s Stephen Stanley said the FOMC is “in the middle of making a serious policy error,” in a note he wrote to clients. “The inflation crescendo is building everywhere except within” the central bank panel.
BlackRock CEO Larry Fink said higher prices are more than a transient phenomenon.
“The Fed chair is deeply committed to the transitory narrative, putting the dual mandate of full employment in all caps while price stability is in lower case letters,” said BTIG’s Julian Emanuel.
This would not be the first serious policy mistake the Fed has made. Just in 2018 Powell pushed rate hikes too far and crashed the S&P by 20%. This is to say nothing of the bubbles the Fed inflated during the dot-com era leading to a full-bore bear market, despite a rather mild economic recession, and the Fed’s policies led to the Financial Crisis which almost toppled the U.S. Financial system, but the Fed hasn’t had to deal with inflation for decades. I don’t think any current Fed members were around when the Fed had to take the Fed funds rate up to 18% (currently at zero).
In any case, in the meantime macro signals haven’t changed much except Credit has joined in the assets on my radar. What I did find more interesting after a long period of quiet, confirming 3C charts, is the sudden and rather sharp deterioration in SPY’s short and intermediate term 3C charts.
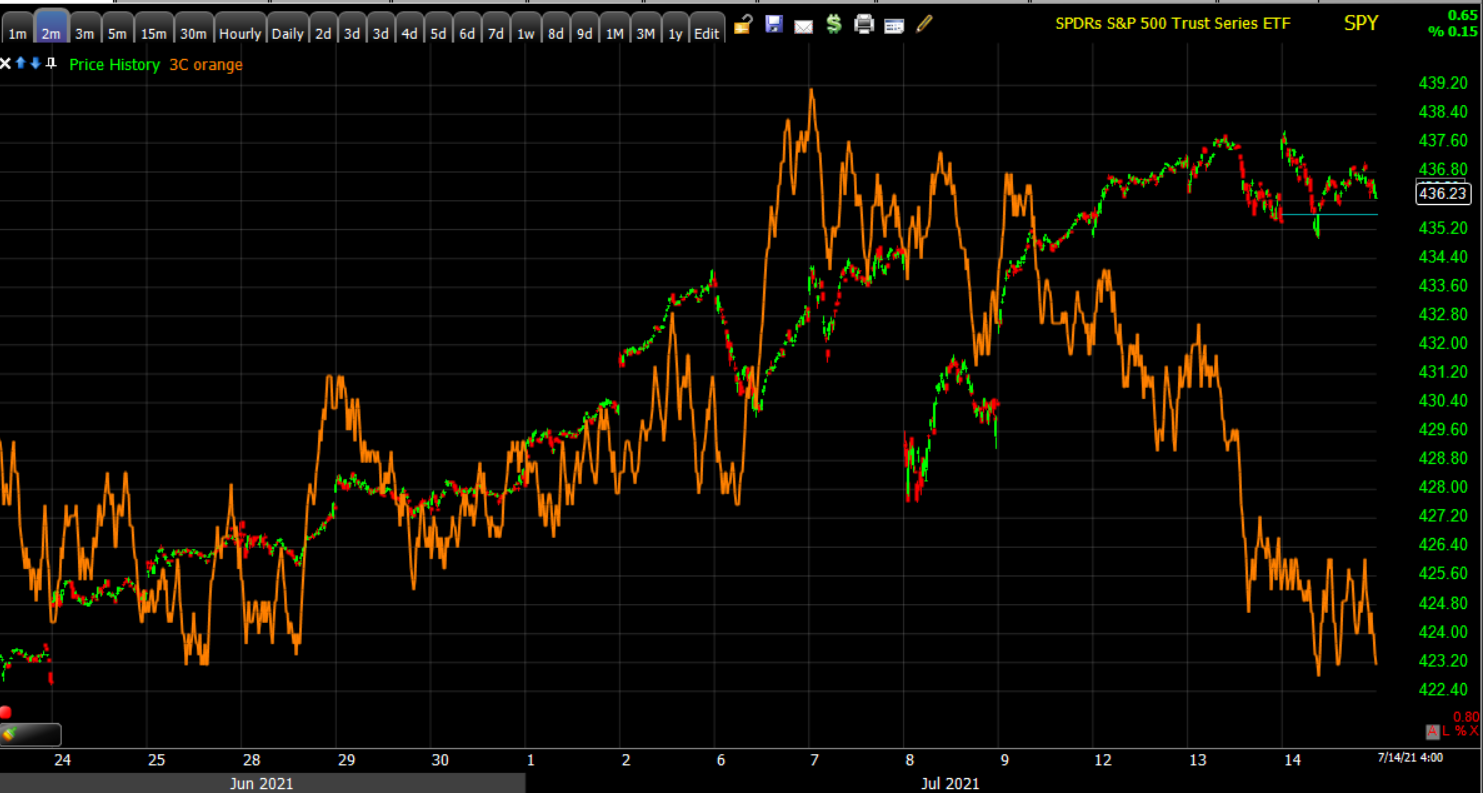 SPY (2m)
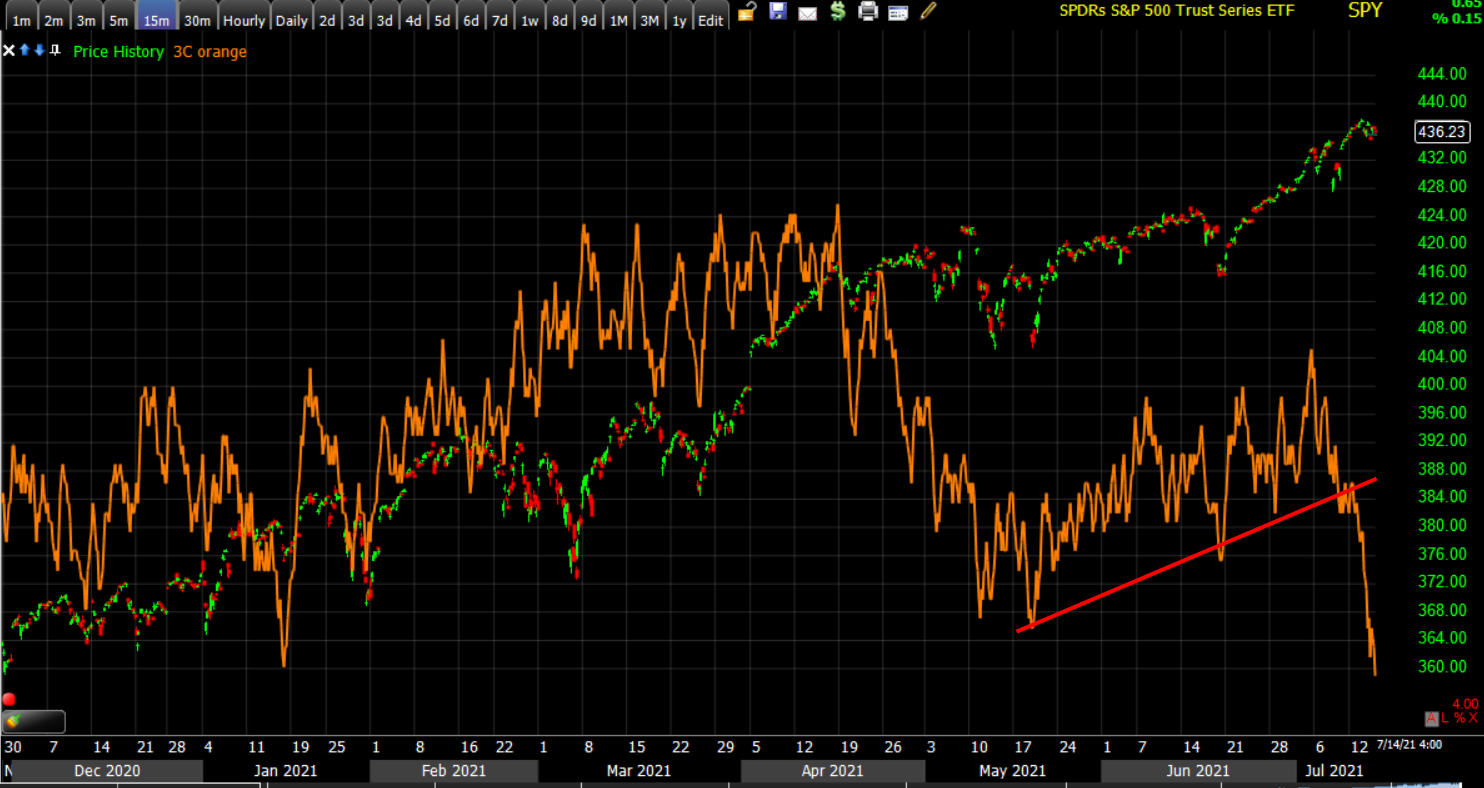 However, it is this stronger intermediate term trend 15 min SPY chart’s sharp divergence that really caught my attention. I’ve featured this chart numerous times since the S&P’s bounce off its 50-day in May. This is the kind of divergence that jumps off the chart and suggests there’s some serious distribution happening under the surface. This is the most surprising development today, perhaps the most surprising in several weeks. I would not take it lightly.
The averages are usually pretty dull in the summer and more so in earnings season, but with signals like SPY’s above popping up, I’m on my toes.
Overnight
S&P futures are flat. 3C charts of index futures are largely unremarkable tonight. Dow futures do have a slightly worse looking chart with 3C leading slightly lower, Small Caps have a slight positive divergence after being the worst performing average by far.
VIX futures have had a lot of intraday 3C action.
 VIX futures (1m) -negative divergences in red and positive in white. Typically volatility is under selling pressure ahead of major Fed events like Powell’s testimony today, but I doubt he’ll say anything new or market moving tomorrow. See VXX’s 3C trend above.
Looking ahead to Thursday, investors will receive the weekly Initial and Continuing Claims report, Industrial Production and Capacity Utilization for June, the Empire State Manufacturing Survey for July, the Philadelphia Fed Index for July , and Import and Export Prices for June. Taiwan Semi (TSM +0.4%), UnitedHealth (UNH -0.9%), and Morgan Stanley (MS -0.8%) will report earnings tomorrow morning.
- Bank of Korea monetary decision Thursday
- Bank of Japan interest rate decision Friday