Daily Stock Market Wrap
Stocks jumped out of the gate this morning after markets across Asia and Europe had another good showing overnight. The sharply higher start was accompanied by another massive short-squeeze on optimism about a potential plateau in coronavirus cases, but the major averages hit their best levels within the first five minutes of action, followed by a daylong slide as short squeeze momentum was narrower and focused on lightly weighted, less influential sectors.
Just hours before the U.S. open, sentiment among small businesses collapsed by the most on record. Of course the rally this week is not about the economic data or outlook, it’s about the coronavirus data over the past few days, which show rates of new deaths and infections apparently easing in several major economies, and that’s driven a short squeeze and optimism that the worst is behind us. Most market participants over the last decade have known nothing but a bull market, and one in which central banks put out any and all minor forest fires along the way. As of 2018 fewer than 30% of professionals on Wall Street ever experienced a recession or bear market. Not to date myself, but this will be my third. I started trading in the middle of a bear market. It’s stunning to me how much talk there is of the bottom being in.
House Speaker Nancy Pelosi told Democratic lawmakers that she wants the next spending package to be at least $1 trillion. Meanwhile, Senate Majority Leader, Mitch McConnell, said that he expects the increase to the small business loan program to be approved on Thursday.
The leading stocks of Monday’s rally were those whose earnings estimates for 2021 had fallen the most, according to Bespoke. As mentioned this morning, that included cruise-lines and airlines.
Averages
At morning highs the S&P was up +3.6% and Small Caps over 5%. Small Caps started the day leading to the upside, but the relative strength of about 150 basis points fell off quickly this afternoon. Unlike yesterday, today’s close was ugly at session lows. As was the case this morning, NASDAQ 100 was the laggard and I believe that’s due to less short activity to be squeezed.
S&P 500 ⇩ -0.16 %
NASDAQ ⇩ -0.40 %
DOW JONES ⇩ -0.11 %
RUSSELL 2000 ⇧ 0.03 %
The short squeeze this morning was less broad-based as compared to Monday, mostly in lightly weighted sectors like Materials and Energy. It became apparent that with zones of thick overhead supply in the area, and short covering becoming less of a driving factor, that the averages started losing momentum and shifting to a consolidation phase, a symmetrical triangle, which is still a bullish consolidation.
 SP-500 (5m) stalled in the zone of the overhead supply levels posted in last night’s Daily Wrap. Most sectors respected the lower trend line of the small triangle, S&P dropped a bit below as sellers stepped up at the close.
 Dow (15m) very similar with overhead supply above and a triangle consolidation intraday.
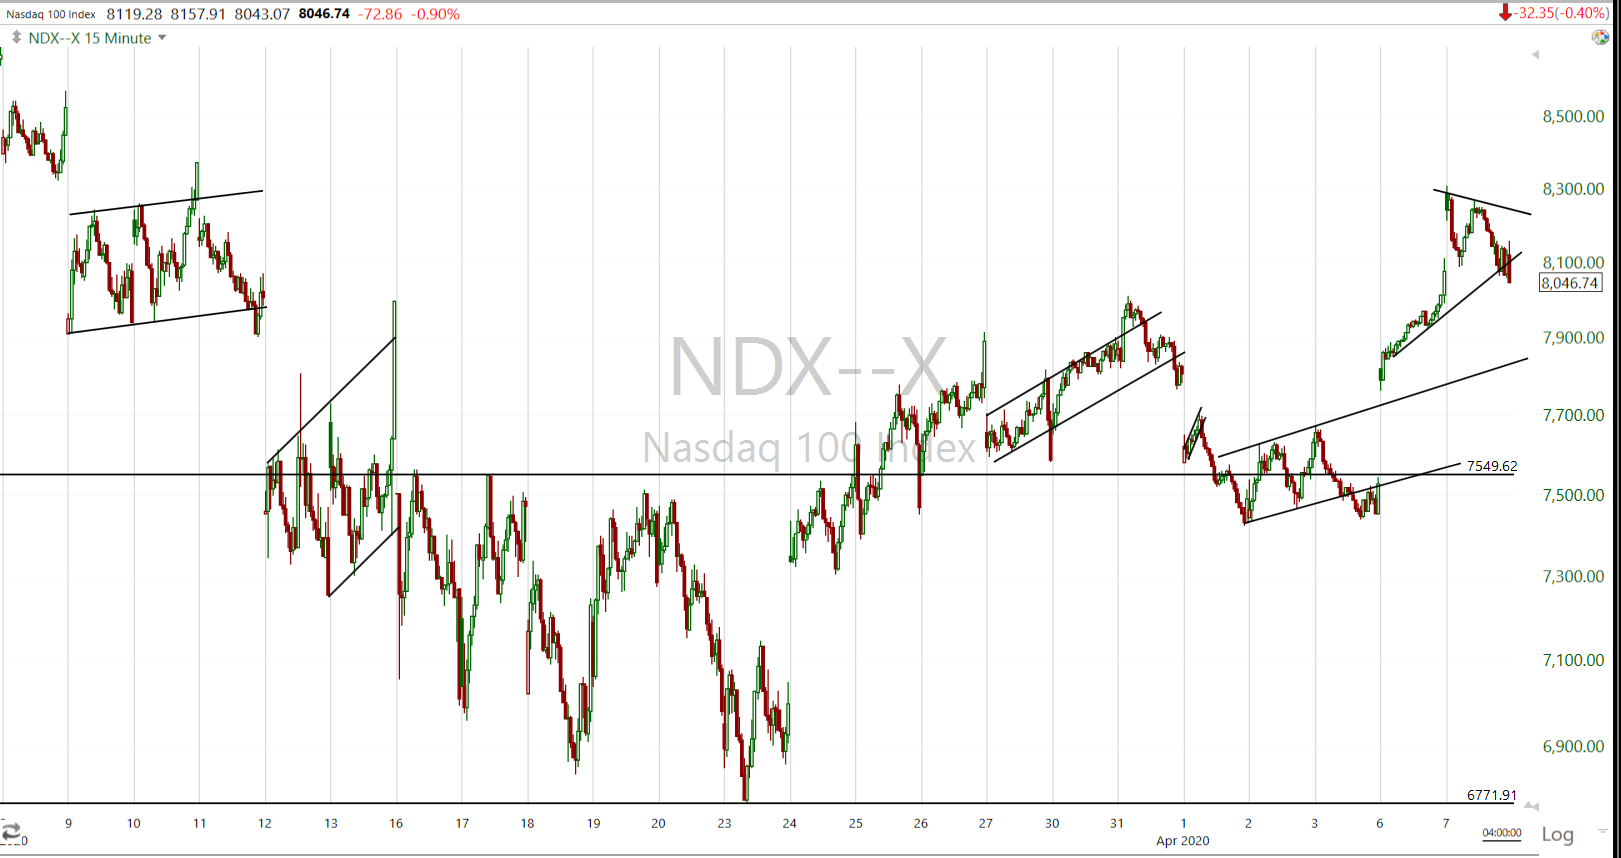 NASDAQ 100 (15m)
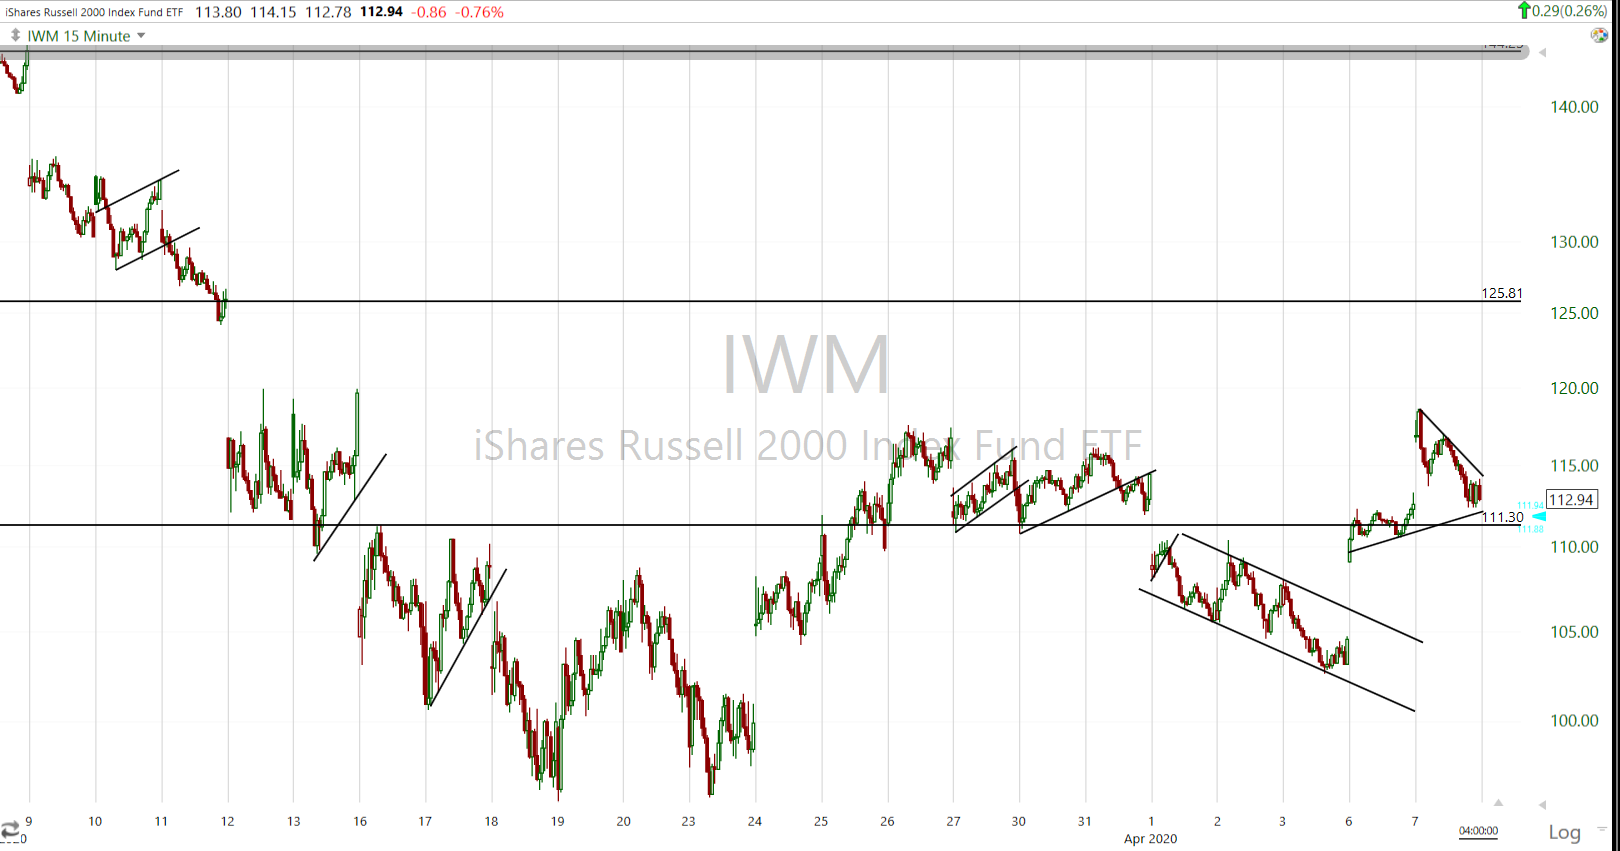 IWM (5m) has a much larger zone of overhead supply between $120-$130 with local support in the $10-111 area.
I don’t usually use exponential moving averages, but since the market has been moving so fast, they respond better than simple moving averages…
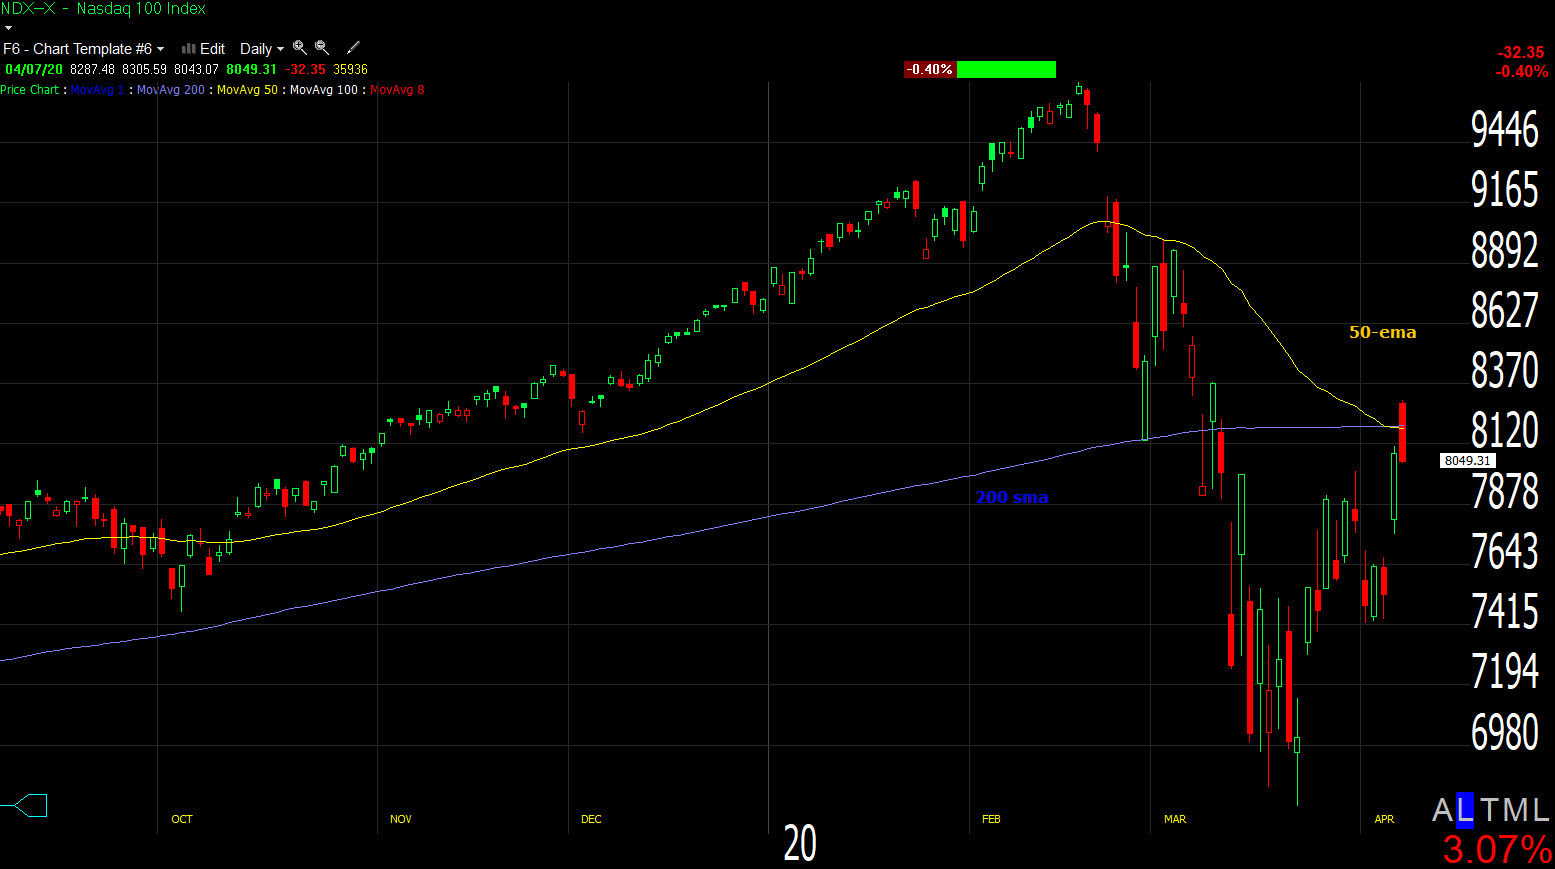 NASDAQ 100 (daily) traded up to and failed above its 50-ema and 200-sma. See VIX below for an interesting parallel.
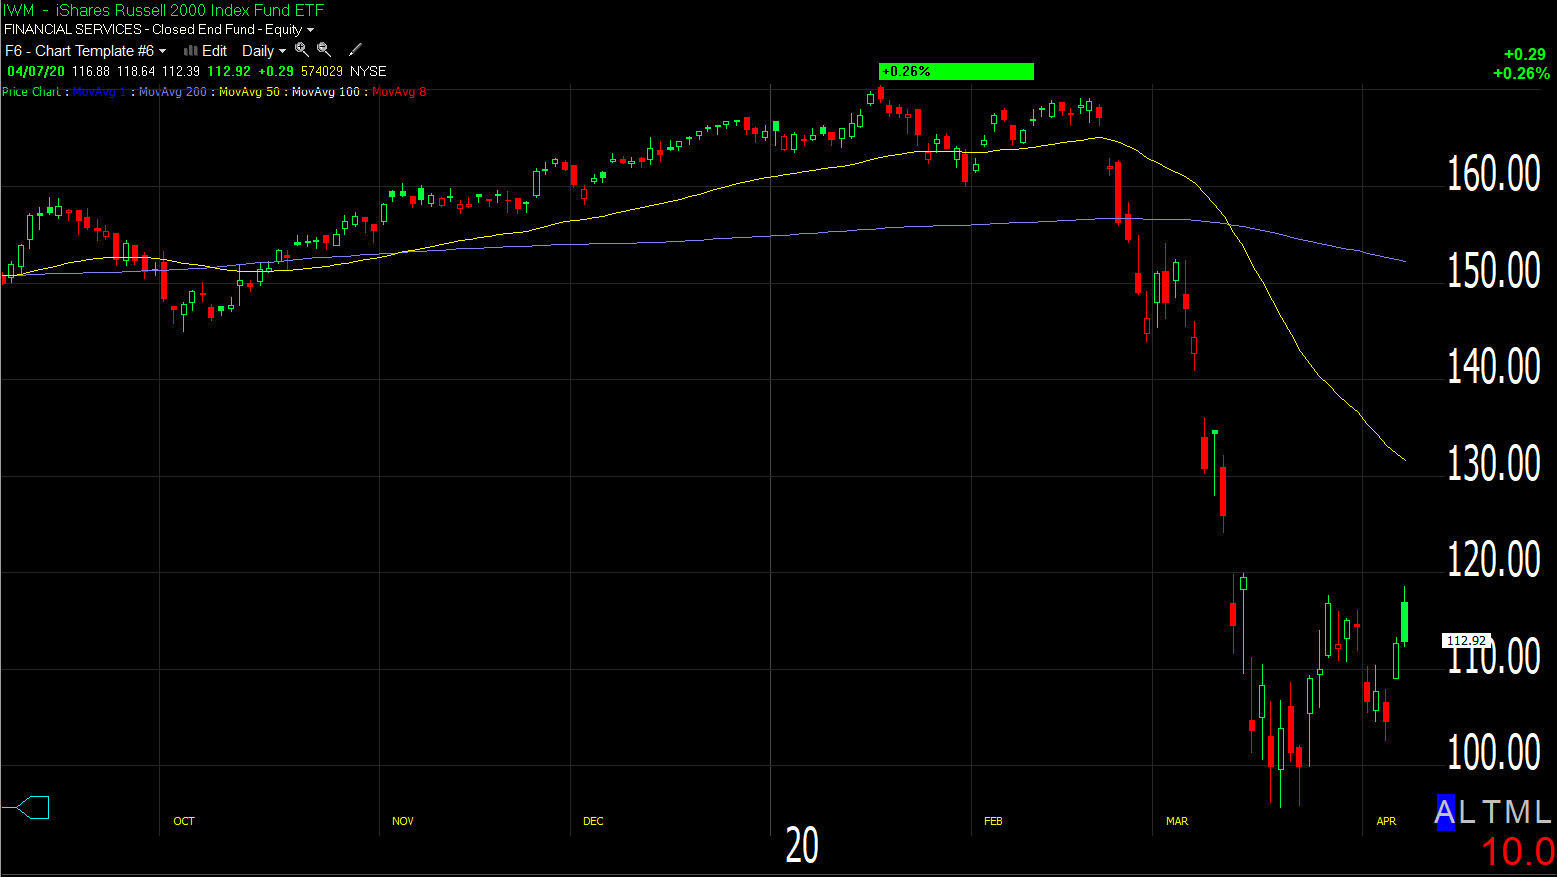 IWM (daily) shows pretty clear resistance around $120 and looks much more like a consolidation (bearish) than a counter-trend rally.
S&P sectors
The best performing groups are the ones that had the most short exposure. The energy sector was able to remain in the green, even though crude oil slumped this afternoon. Among the weakest performing sectors are the two most influential, Health Care and Technology.
Materials ⇧ 2.66 %
Energy ⇧ 2.13 %
Financials ⇧ 1.00 %
Industrial ⇩ -0.23 %
Technology ⇩ -0.90 %
Consumer Staples ⇩ -1.15 %
Utilities ⇩ -1.25 %
Health Care ⇩ -0.82 %
Consumer Discretionary ⇧ 1.49 %
Real Estate ⇧ 0.03 %
Communications ⇧ 0.73 %
Internals
NYSE Advancers (2090) were still better than 2:1 over Decliners (813) on slightly heavier volume of 1.47 bln. shares
There is no Dominant price/volume relationship today. There is no 1-day overbought condition.
There are no major changes in market breadth. Advance/Decline lines are a bit behind price on a relative basis, but not leading lower.
Volatility
All of last week volatility was systematically sold. Monday volatility showed the first sign of firming up with relative strength vs. the S&P. That continued today, additionally with volatility’s term structure moving deeper into backwardation despite the strong green open in stocks, indicating a rising level of concern for the near term.
 VIX (5m) last week I suspected the $50 area could get interesting. The S&P has made 5 higher highs since Monday’s open, VIX has not made lower lows (relative price strength).
Using the same 50-day exponential moving average for the same reason, there’s an interesting parallel to NASDAQ 100
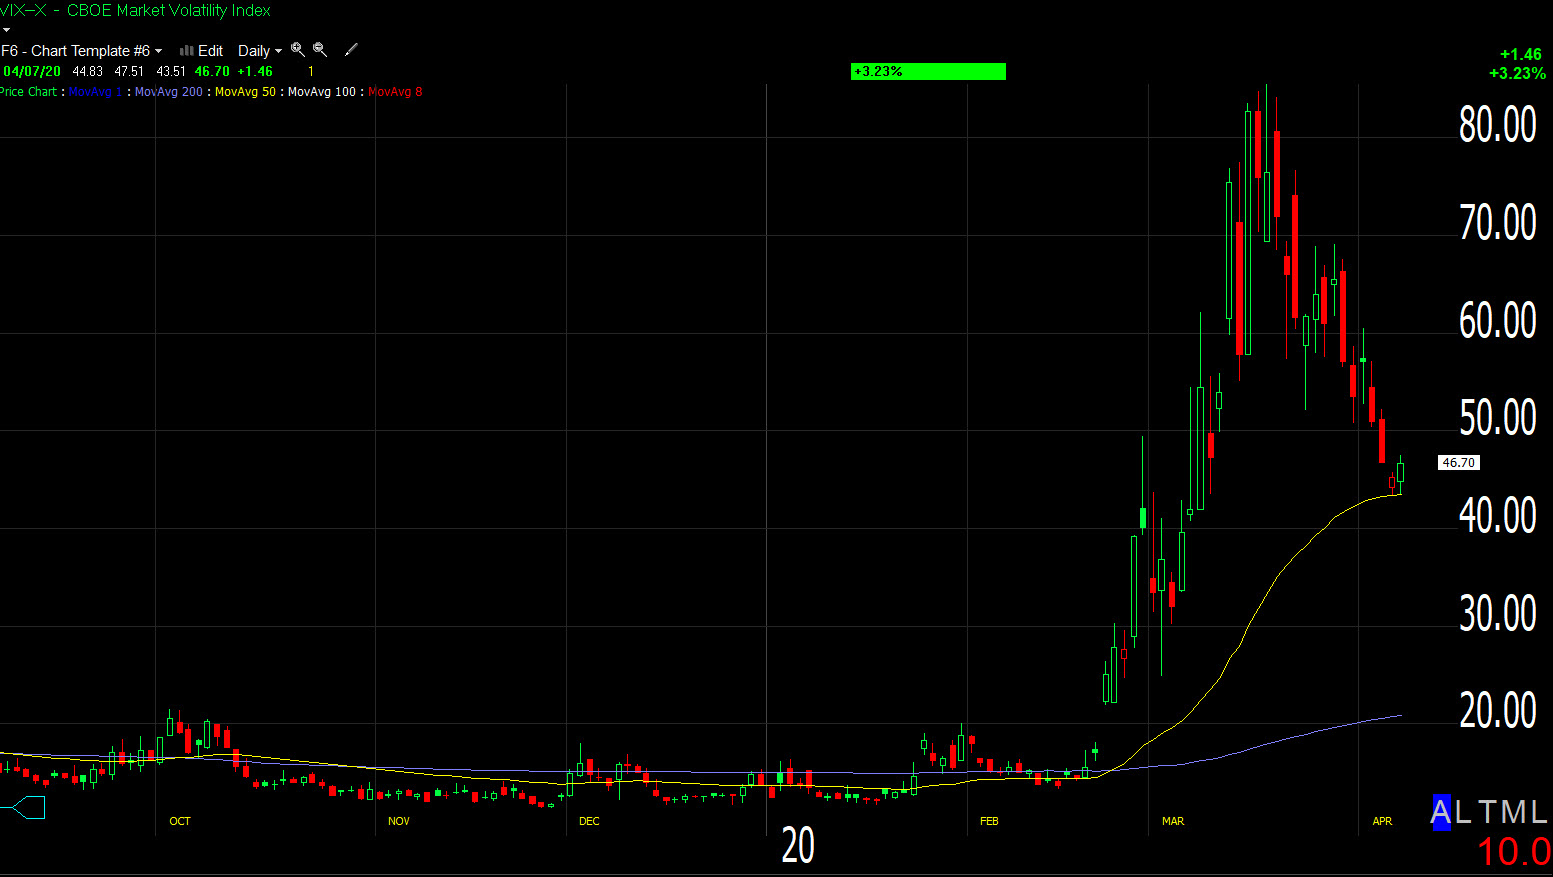
VIX (daily) tagged its 50-ema as well and that is where, for the first time in more than a week, there’s a positive 3C divergence appearing in VIX futures and VXX.
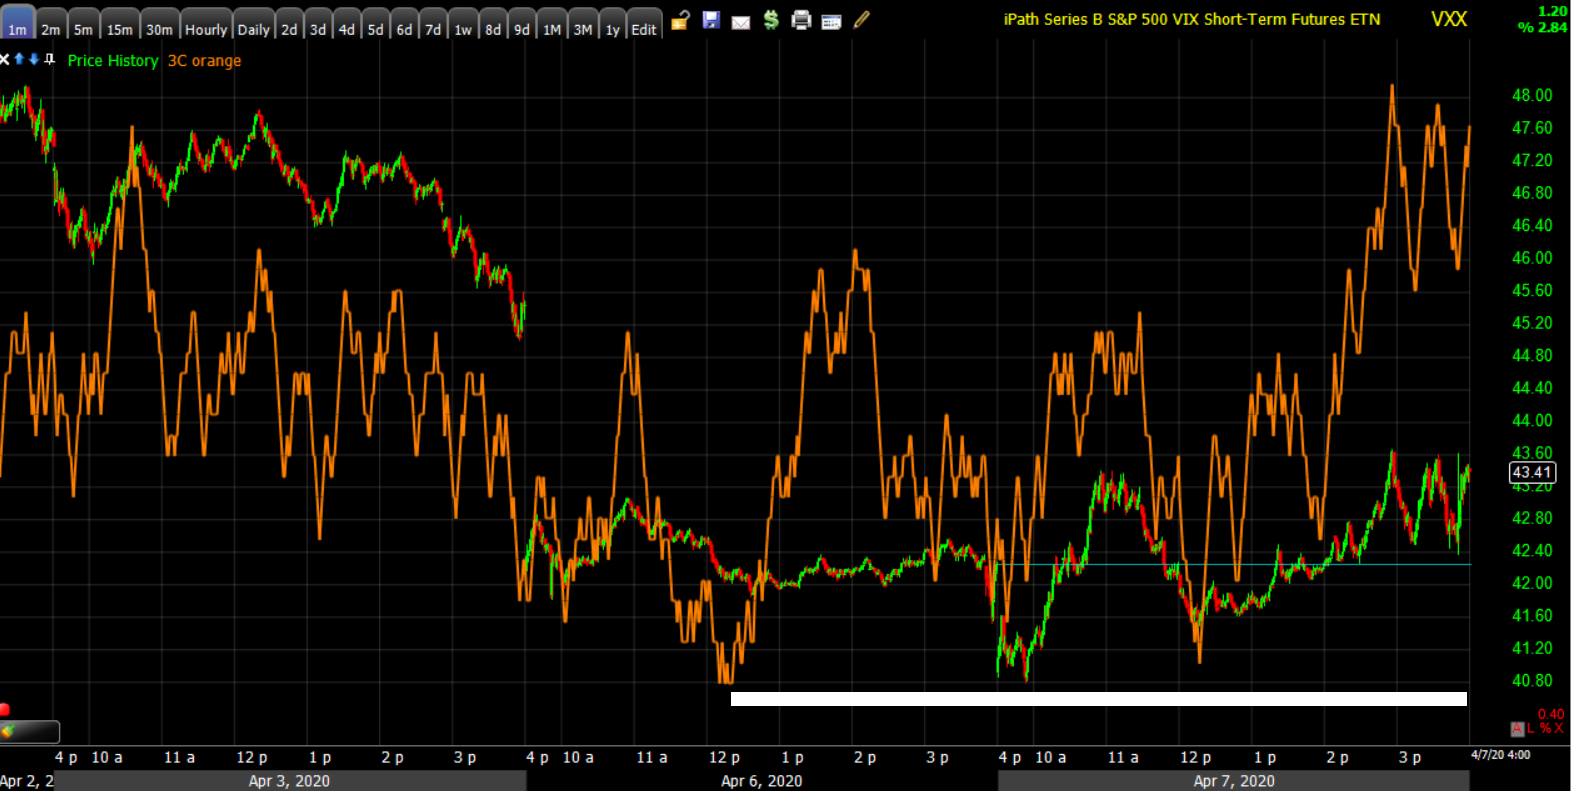 VXX (1m)
Treasuries
Treasuries retreated during the first half of the session sending yields higher, but narrowed their losses as the day went on and yields came down with crude oil prices. The 10-year yield ended higher by six basis points at 0.74%.
Very short term (2-day)…
 SP-500 (2m) and 10-year yield trading in-line
Intermediate term (2 weeks)…

The bond market is not buying into the v-shape recovery that is part of the narrative for the bulls in stocks. My ideal scenario is that the strategic or longer term signals, and the tactical or shorter term signals, align and additionally are confirmed by currencies and commodities.
Currencies and Commodities
The U.S. Dollar Index fell -0.8% to 99.88, returning to levels from Thursday. The weaker Dollar the past 2 days is helpful for stocks. For about a month the U.S. Dollar has had an inverse relationship to stocks, this is a typical “crisis” relationship between the two asset classes. Here’s an example…
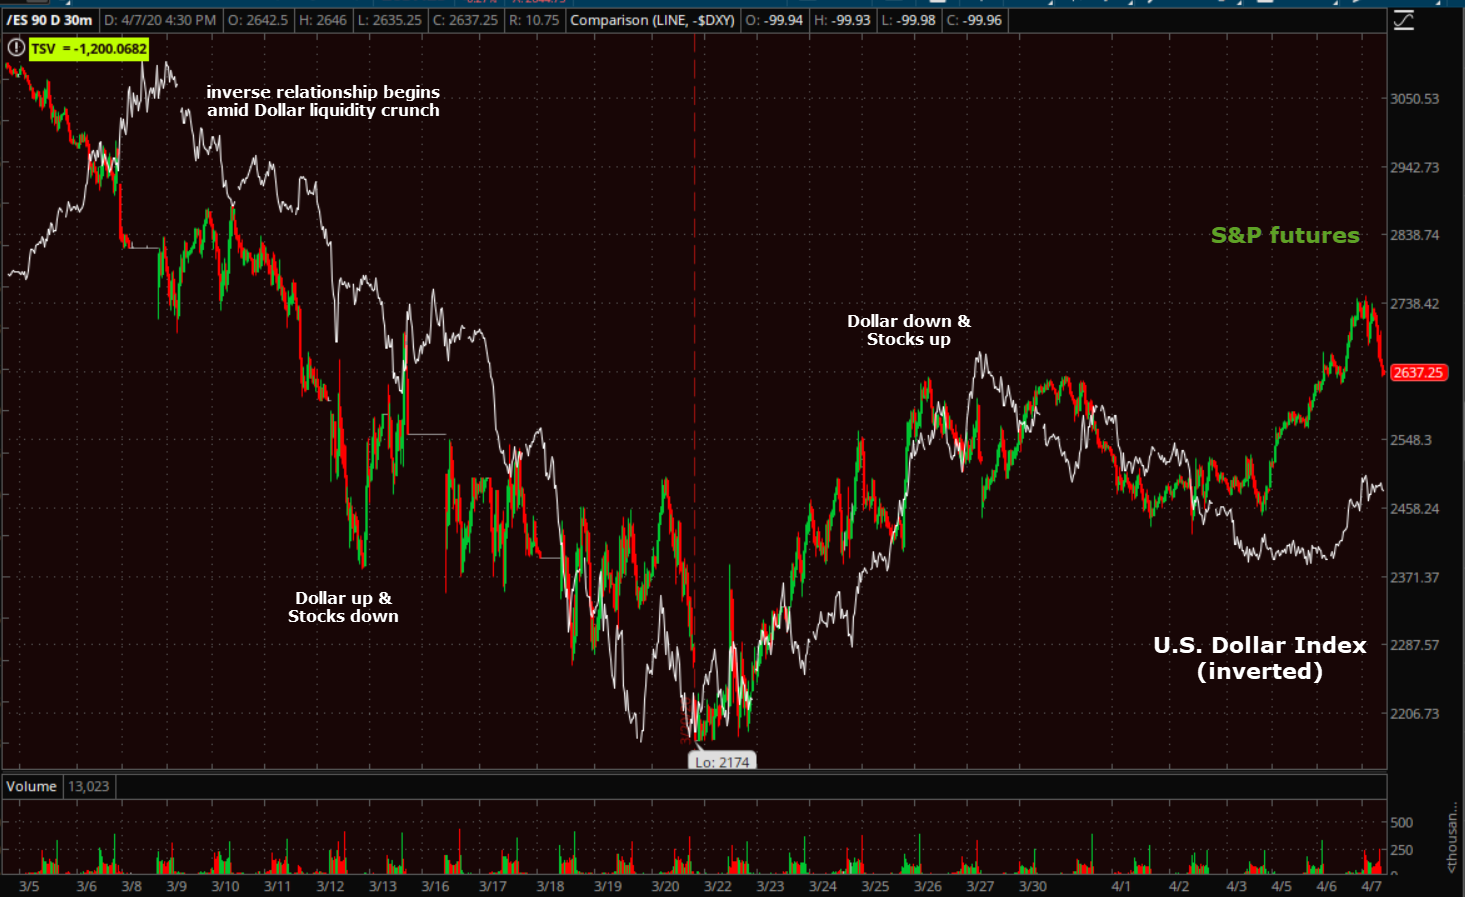 S&P futures (30m) and U.S. Dollar Index inverted (white). The inverse correlation began about a month ago, the same time that there was a Dollar liquidity crunch that the Fed has been aggressively trying to sooth with their alphabet soup of rescue programs. It was around the same time that stocks, bonds and gold became dangerously correlated, all selling off together. In essence investors were selling all asset classes, even those that had been performing well like bonds and gold, in an effort to meet stock margin calls and raise cash. As you can see, the relationship has continued as the dollar funding crisis simmers below the surface.
As a side note, the FRA-OIS spread started moving higher again today indicating dollar funding issues. Also the TED Spread (an indication of stress in the banking system) started rising after a couple of days of declining.
*Don’t assume that this relationship is a constant. The U.S. Dollar’s relationship to stocks changes throughout the economic cycle, sometimes referred to as the “Dollar smile”. There are at least 3 different relationships as the economic cycle progresses, and it depends on how other economies perform relative to the U.S.
Another useful currency pair is the commodity currency, Australian Dollar, vs. the U.S. Dollar. AUD/USD was one of three asset classes that I was pointing to in January and February 2020 that was screaming trouble ahead for commodities, the economy and stocks, as stocks traded at all-time record highs.
Here’s a chart while the S&P was at its record high….
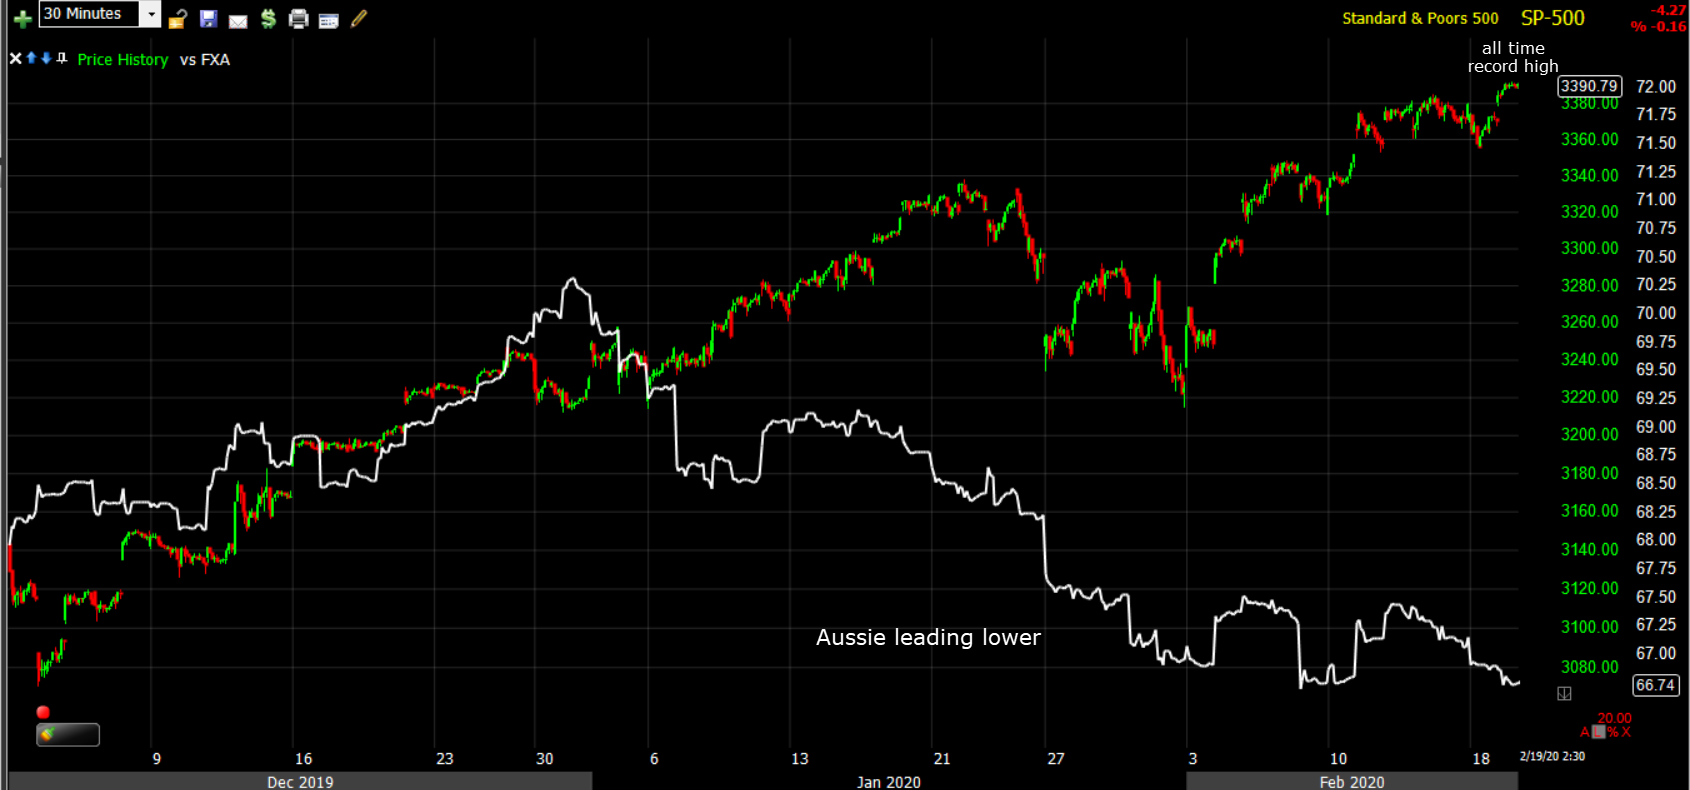 Aussie leading lower as stock investors were oblivious at all-time record highs. The crash followed.
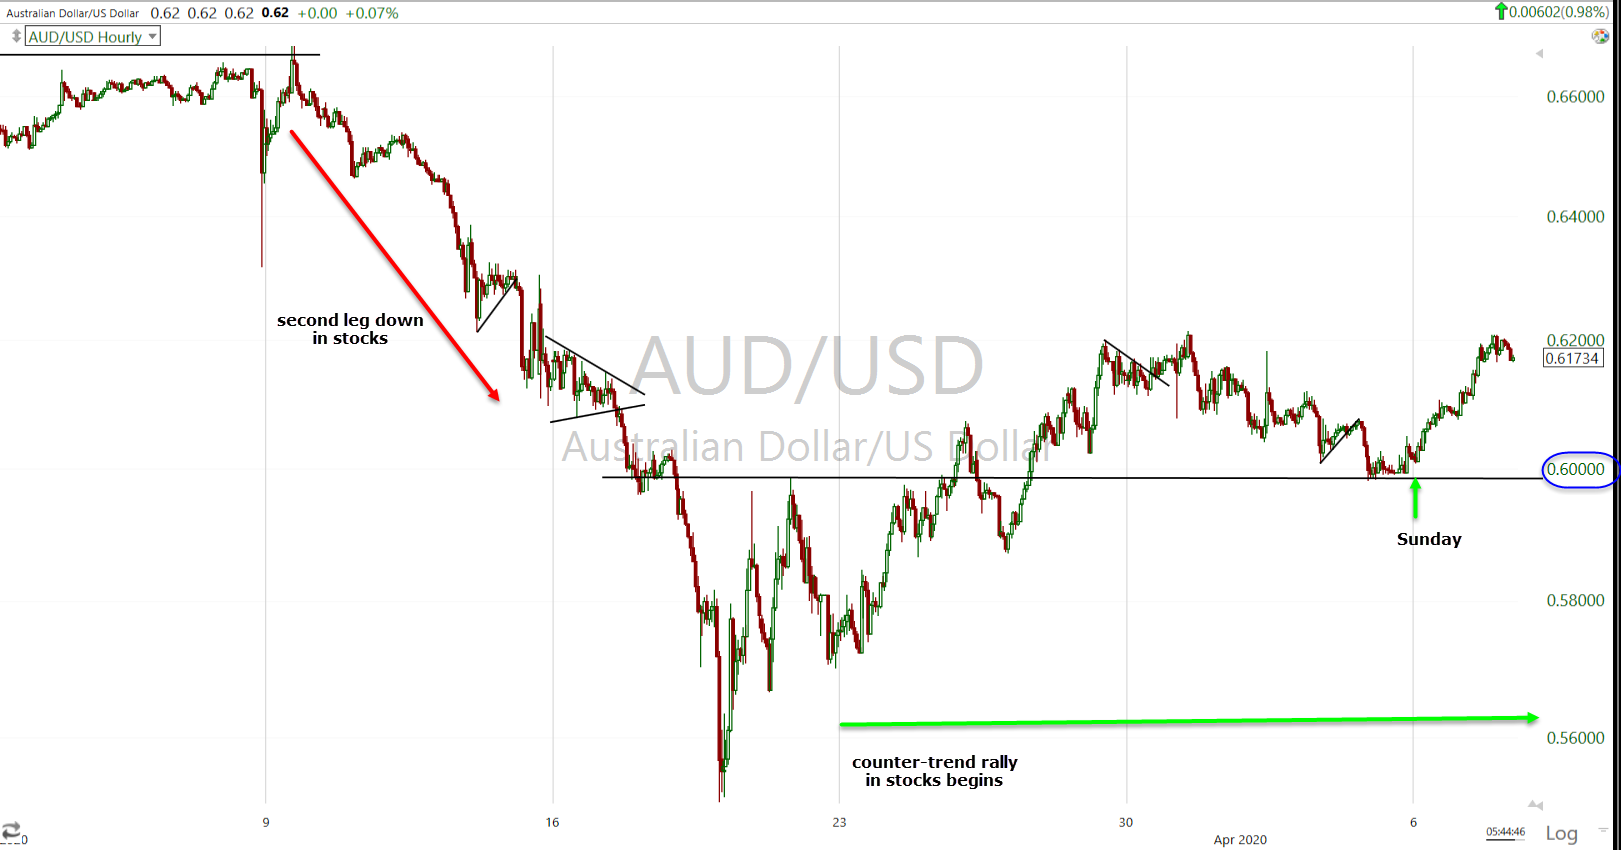
AUD/USD (60m) led stocks lower, it also bottomed about 3 days before the stock market rallied off crash lows. I identified 0.60 as a line in the sand for risk sentiment about 3 weeks ago. It continues to be a useful level. As of Friday’s close, price action in AUD/USD was short-term bearish, but was holding right at the key area, then rallied Sunday night with index futures.
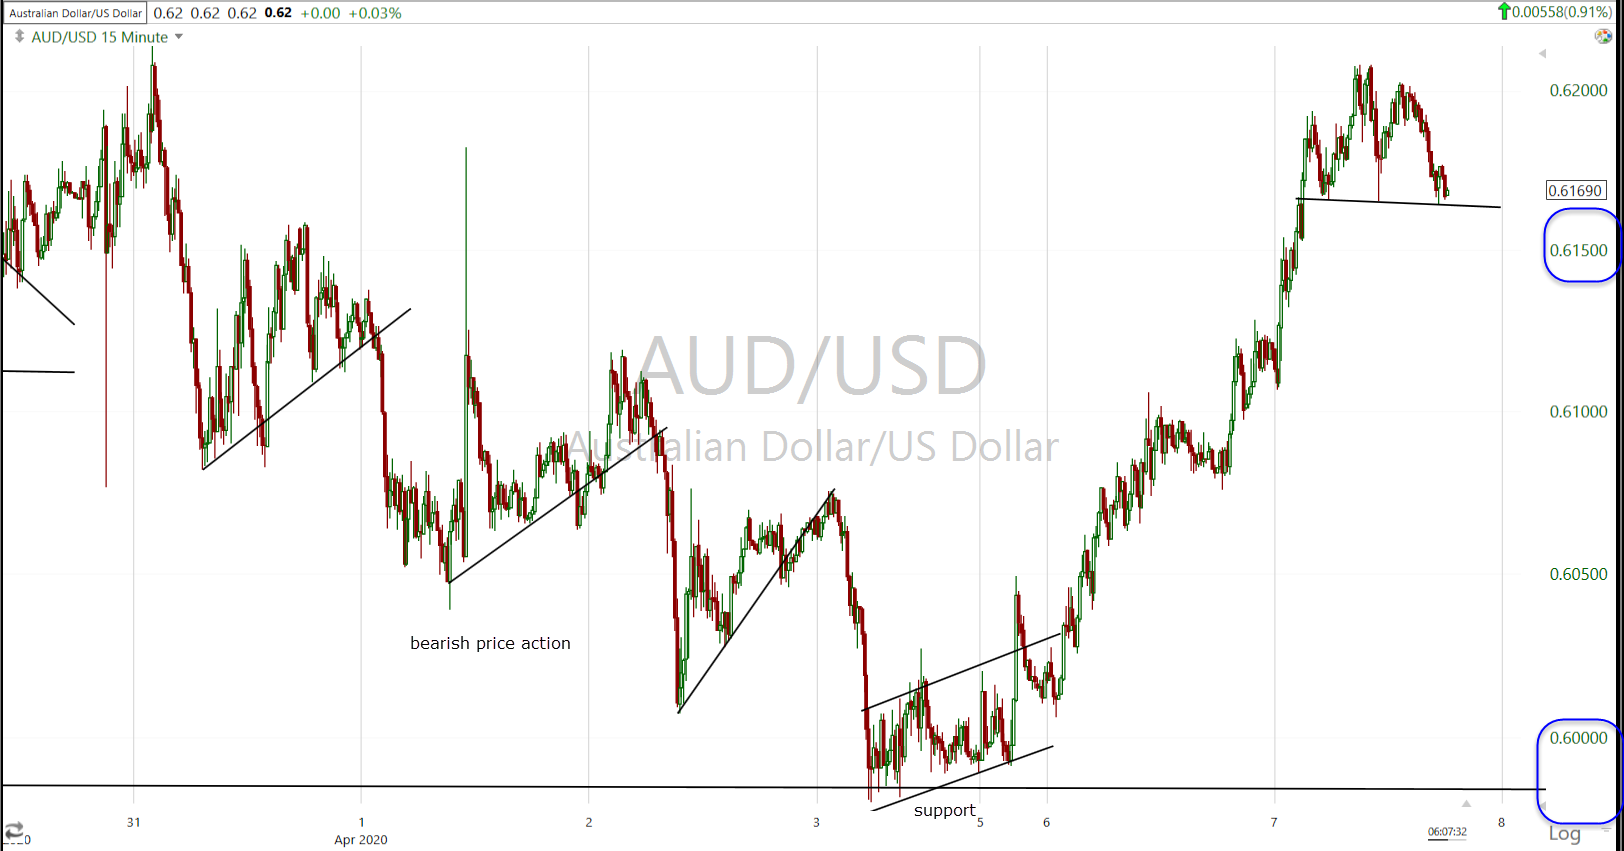
AUD/USD (15m) in the near term I’m watching the 0.6160 to 0.6150 area, and still the 0.6000 area.
WTI Crude oil went from a small gain and then dropped this afternoon, closing lower by -9.3% at $23.78/bbl. Crude lost -7.5% Monday, but it had no meaningful effect on crude’s bullish consolidation. Today’s drop did have a meaningful impact.
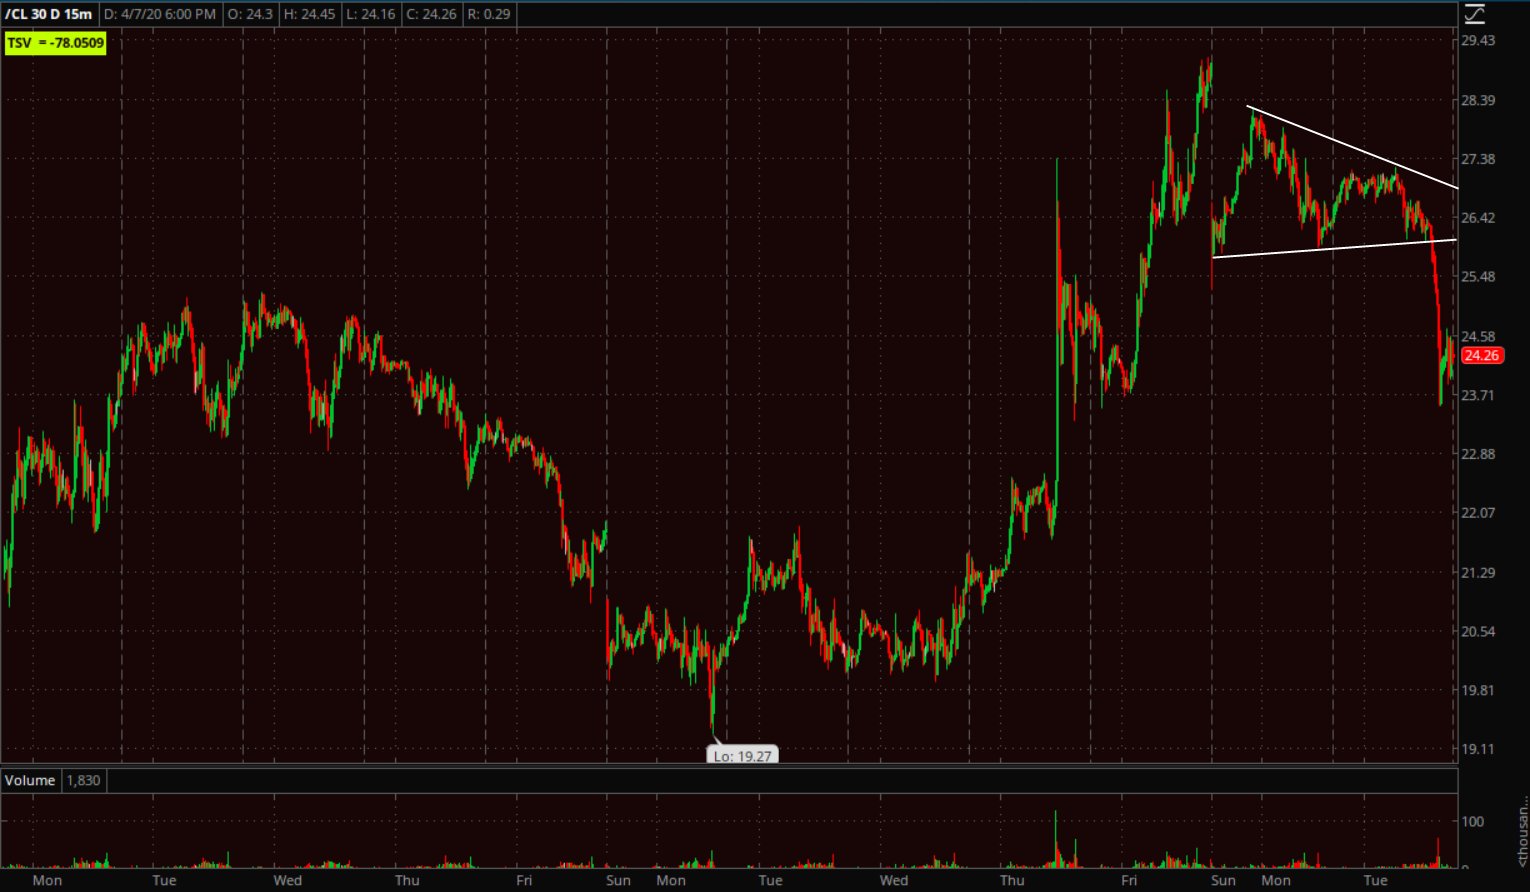 WTI Crude oil futures (15m) the bullish consolidation is wrecked and price action tonight remains short term bearish with a high potential for another -10% decline.
 USO (5m)
The OPEC+ meeting was initially scheduled for Monday, but it fell apart over the weekend. It’s now set for Thursday. Keep in mind that U.S. markets are closed Friday for Good Friday.
Summary
As discussed since yesterday, the market has been rallying on Corona virus data, not economic or fundamental.Said another way, sentiment. The gains this week have greatly benefited from short covering, but as seen in Tech and Health Care today, buyers outside of short covering, really need to step up to push through larger zones of overhead supply. Before Monday there had not been even a minor short squeeze in more than a week so a lot of complacent bears were caught off-guard. This is very normal bear market activity.
The short-term price action for this week is still bullish with the consolidations this afternoon. I’m waiting for a high probability scenario and good risk/reward before taking any positions of size. My bias is to the short side, but I have no problem trading long, I’m just not chasing a gap up and short squeeze. I’m watching the bond, currency and commodity markets, as well as volatility. The commodity market, or oil specifically, definitely cracked the market’s bullish mood today and volatility is quietly bubbling under the surface of a calm facade.
A few have asked my longer term view. I usually don’t speculate about things like this unless I have some solid reasons I can show, but since a few have asked… Bear market rallies are interesting. Most people agree that we’re heading for the worst economic crisis in almost a century, yet investors are very willing to buy the idea that the bottom is in. I’m not in that camp.
My view is that this is an economic downturn unparalleled in our lifetimes. Just like Ben Bernanke before the financial crisis, Janet Yellen said in 2017 that she didn’t think we’d ever see another economic crisis in our lifetimes. It was the Fed that virtually guaranteed it! Over the last 2 decades, the Fed’s solution to one crisis is the genesis of the next, worse crisis. It was the Fed’s QE and interest rate policy that allowed corporations to leverage up their balance sheets and use debt to buyback shares and pay dividends. Now share buybacks are viewed as reckless and irresponsible, but no one had any problem with it 2 months ago.
We haven’t even begun to see second and third order effects, or really even seriously contemplated them. I really don’t think the market has “priced in” what will likely be the deepest recession in a century, and global. It doesn’t even know where to start, which is why it hasn’t reacted to any of the horrible economic data, but rather follows the slope of infection rates. That’s one metric, but alone is short-sighted, lacking imagination.
There’s a lot of talk of retesting the lows, or “the bottom is in”. The v-shaped recovery that every bull is terrified of missing, especially since there was a massive and recent example of this at the 2018 market lows into 2019, is not the norm. That was exceedingly rare. And remember there was no recession at that point, it was simply the cycle turning and growth and inflation turning down as the Fed was hiking rates right into the slowdown. In early 2019 the Fed course-corrected and sopped tightening, eventually cutting, but the market rallied on essentially hopes of growth, not actual growth. An argument could be partly made that the market has simply taken back the excesses of 2019.
The norm after a crash is to correct and that can be done through price and through time, or both.
Here are two not-so-distant examples…
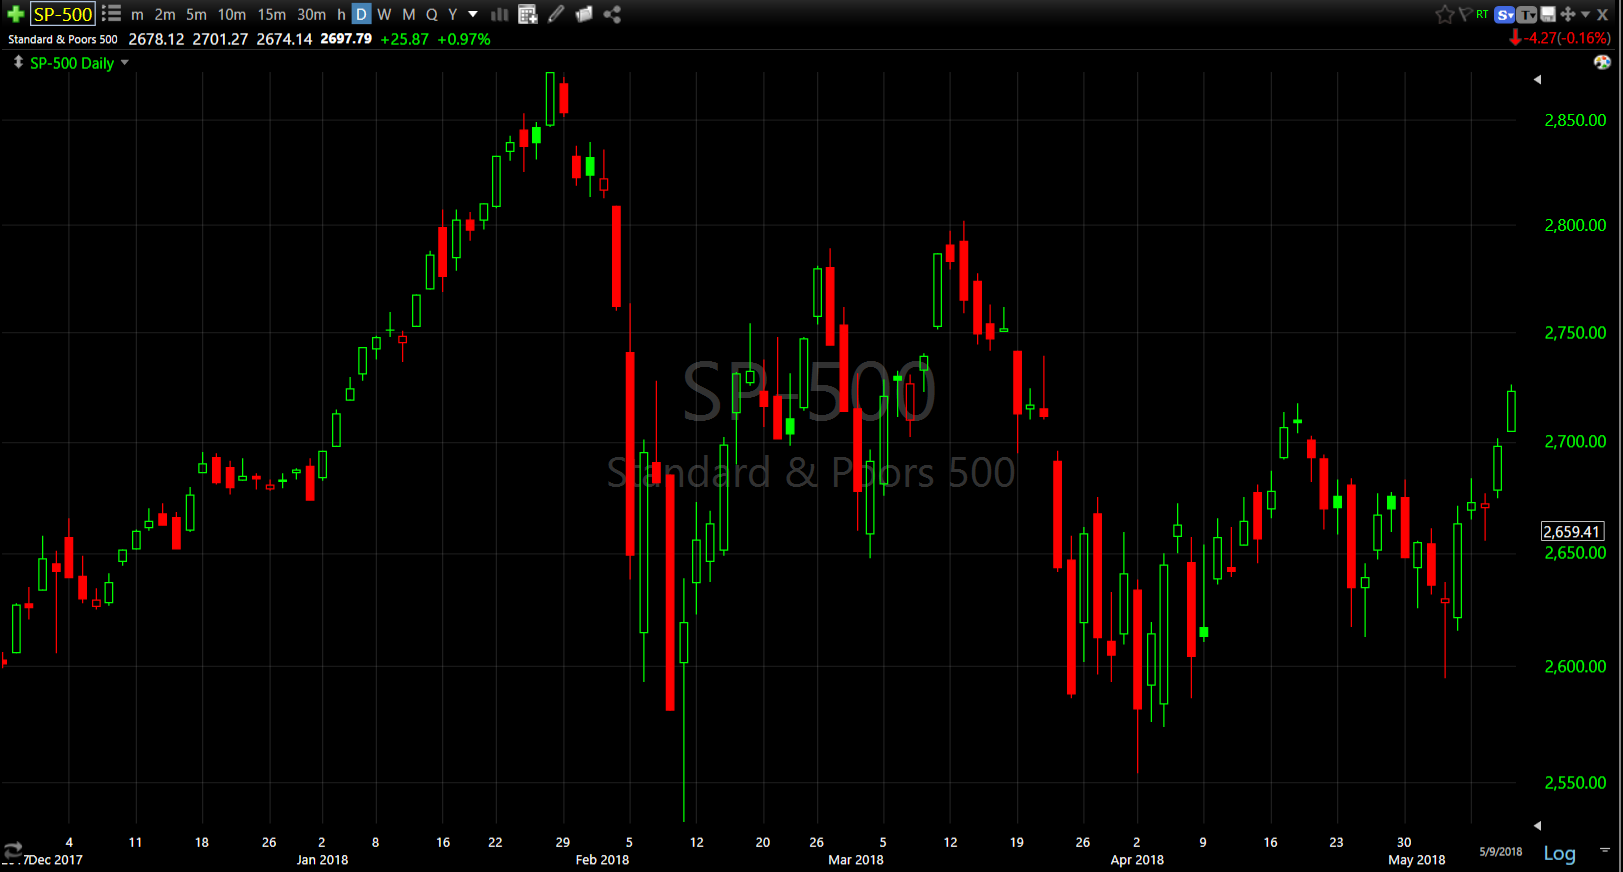 SP-500 (daily 2018) after a sharp sell-off prices initially rallied, then tested the low and then churned for nearly 4 months before starting to trend higher. There was no recession in sight.
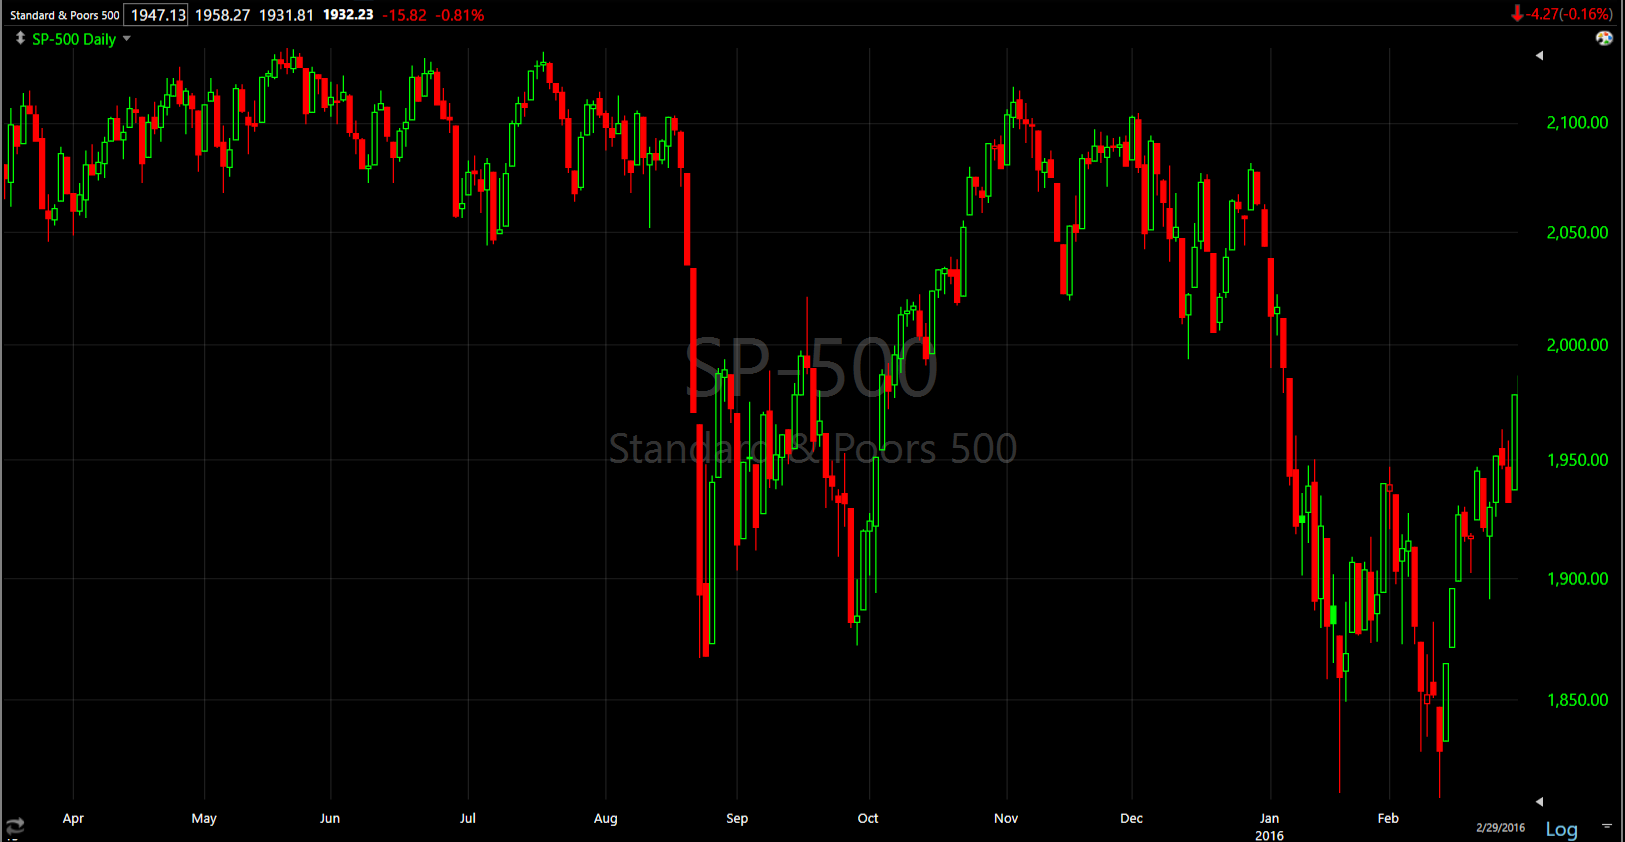 SP-500 (daily 2015-2016) sharp sell-off, a bounce/rally and test of the low followed by a rally to a lower high and a failed test/new low that was eventually tested again. Again in this case, while there was a manufacturing recession, there was no broader economic recession (although close).
Then there was 1937, which for a year and a half was my preferred scenario until recently. The parallels between the period from the end of the Great Depression to 1937 , and from the end of the Financial Crisis (2008) until recently, were stunning. Prior to the 1929 crash optimism in stocks had run rampant like the run-up to 2008. After the crash of 1929 the Federal Reserve engaged in its first ever asset purchase program just like QE during and after the Financial Crisis. U.S. interest rates hit zero during the depression, similar to after the Financial Crisis. In fact those were the only two times in U.S. history that rates hit zero. The extremely low interest rates were part of the reason for a huge wealth gap in the years following the depression into 1937, which sparked a surge in populism and populist leaders globally. The same thing happened following the Financial Crisis. The recent wealth gap was/is the widest since the period following the depression and it has manifested in similar ways like political leaders that have been elected since, whether nationalist populists (Trump), or socialist populists (AOC, Bernie Sanders, etc.), the trend has been toward populists.
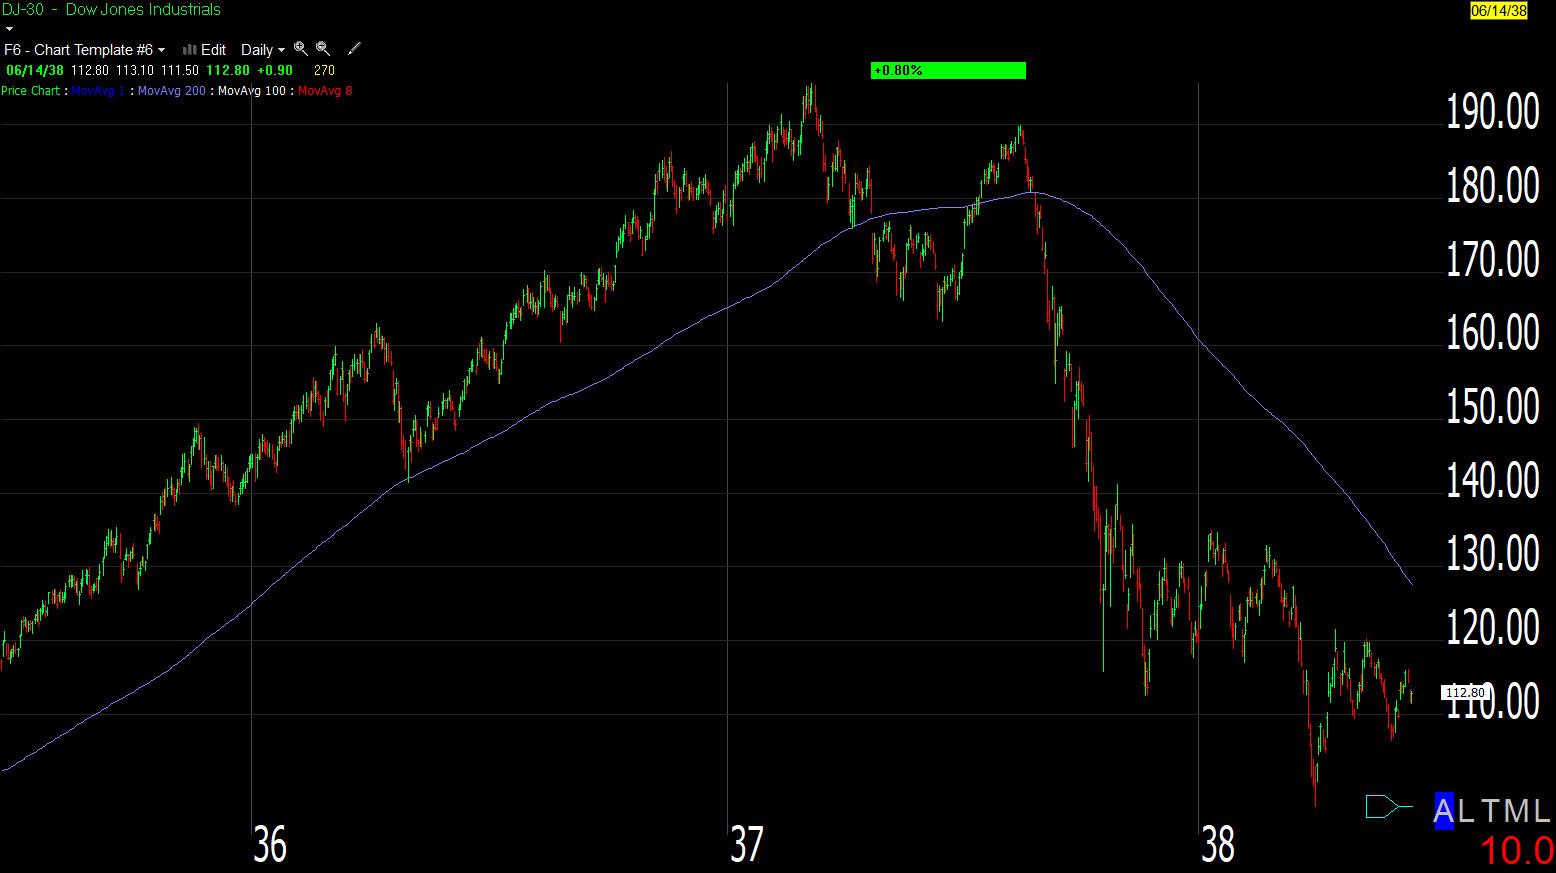 Dow 1937 was about a 50% decline followed by months of churning in a large volatile range, a new low and finally recovery.
I said, “until recently” that was my preferred scenario. I imagine that the economic recession we’re in now will be the worst since the depression and might become a depression. Generally speaking a garden variety recession means a decline in stocks on the order of 30-40%, a bad recession like the financial crisis on the order of 40-60%, and a depression being 60%-80%.
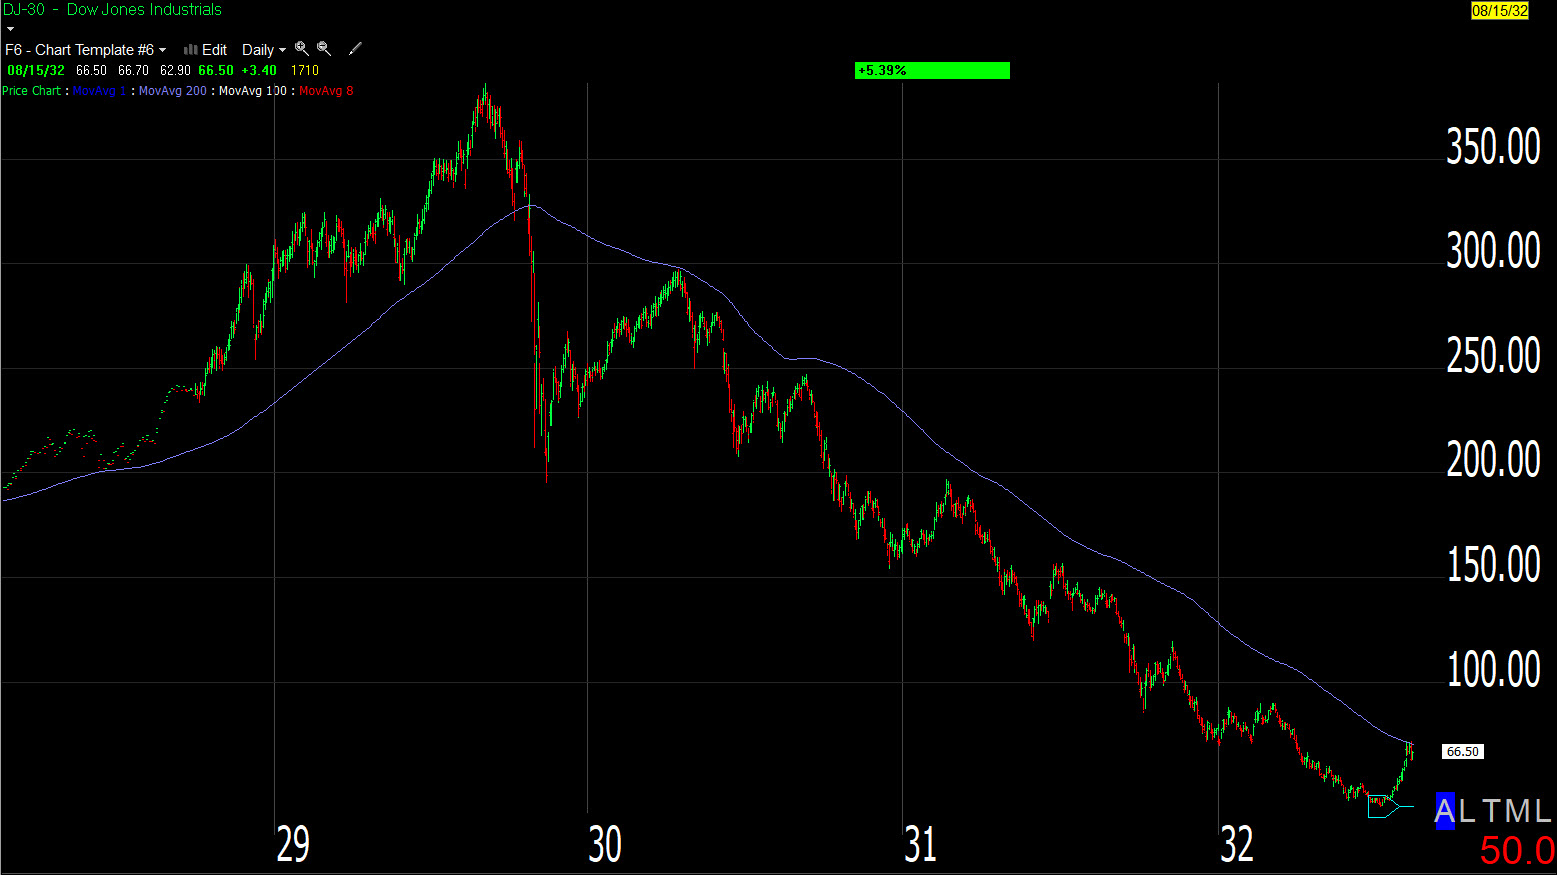
Dow 1929-1932. It’s hard to get a feel for the scale of the counter-trend rally immediately following the 1929 crash, but it was just about a 50% gain over 5 months. That’s a believable sucker’s rally. From there the Dow rolled over and ultimately put in another half dozen bear market rallies on its way to eventually losing just shy of 90% before recovering and rallying into 1937. Bear markets are not defined by water-fall crashes, although many start that way. They are a persistent, grinding trend lower with numerous counter-trend, sucker’s rallies along the way, and those rallies are some of the most spectacular you’ll see. I’ve said that here for well over a decade and now we’re seeing it in real time.
That period was marked by massive fiscal stimulus and public works projects like the Golden Gate Bridge and Hoover Damn built in those years. That’s the same chatter we’re hearing now, because central bank’s only have so much influence. You may have heard the phrase, “Pushing on a string”.
I don’t have a strong opinion on what this time will look like, except to say that this is not the end.
I fell very strongly that the bottom is not in, and that we’re in fact in the very early stages of this. I lean toward a test of the low or a lower low, and an eventual 3-5 month rally as it “seems” like things get back to normal, before realizing that theaters, restaurants, stadiums, planes are not going to return to recent norms any time soon and after an enthusiastic re-start, many will fall by the wayside. Anyone who thinks that restarting a business after being closed for 2 months is going to be seamless and easy, probably doesn’t run a business. Then there are the issues of second and third order magnitude like debt defaults. The last 11 years has been an record setting accumulation of corporate debt. That has not unwound in 2 months. Other considerations are ongoing rolling shutdown of various economies that will impact supply chains far worse than the trade war, which already fractured them and splintered globalism and global growth. I expect that period will be the slow, steady decline of the typical bear market like the Dow after the initial crash and counter-trend rally.
That’s just my rough opinion. Other potential scenarios could include stocks tearing to the upside, although not for a good reason. Think Venezuela. I don’t think this is a high probability, but if the Fed and government’s spending breaks the Dollar, there could be a hyper-inflationary surge that drives asset prices like stocks higher. People have expected inflation from the Fed’s perverse balance sheet expansion for as long as I can remember, but they haven’t even been able to meet their 2% target, so I don’t think it’s a high probability.
The bigger point I’m getting to is that I think is that the bottom is not in, and we’re likely very early in the initial shock stage of a much longer and broader economic event. If you want to use the 1929 parallel, we’d be early just after the first crash. Sticking with that parallel, I think we could get the 3-5 month rally like then as the economy restarts and everyone hopes for a v-shaped recovery back to business as usual.
Overnight
S&P futures are down -0.2% and trying to find some support around $2625-$2630.
Crude is up +5.5%, but this is nothing more than a bearish consolidation so far.

WTI crude futures (1m)- there’s a higher probability of another -10% decline. Remember that OPEC is suppose to meet on Thursday.
Here’s an updated chart of AUD/USD which is taking a turn for the worse.
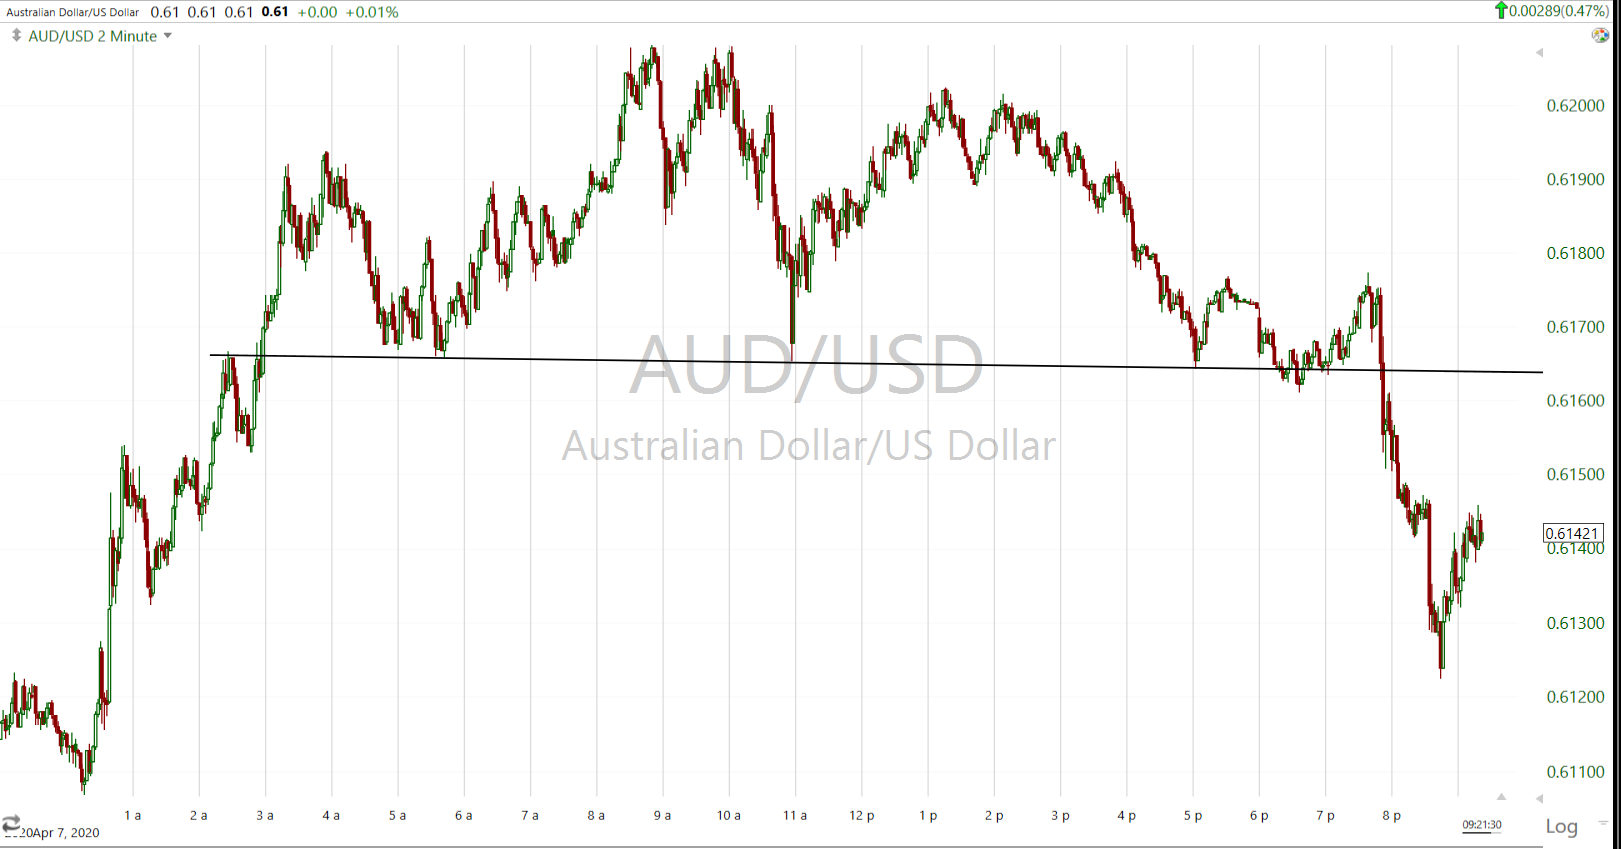
AUD/USD (2m) this is the short-term consolidation area mentioned above, now broken.
Following crude’s drop earlier, AUD above is a second strike. Keep an eye on the dollar, yields and credit. I think that if one of those puts in a third strike I’ll be entering the next trade.
There’s very little in the way of economic data out tomorrow, but the market hasn’t paid it much attention any way.