Daily Stock Market Wrap
There seems to be some confusion as to what caused the market’s worst performance in a month today (and a dull month it was). The DoorDash (DASH) IPO is being scapegoated due to the timing of the market decline, and that it was Tech stocks and Momentum style factor (-2.5%) hit with selling hardest. DASH shares opened at $182 per share after pricing its IPO at $102 per share, accentuating the frenzied demand for IPOs and representing a speculative excess in high-growth areas of the market.
If true, the implication would be something I touched on several times this week , that there’s not much cash on the sidelines, so it has to be pulled from other areas to finance new purchases like DASH. I’m not convinced DASH was the cause. I think the timing was coincidental, or DASH may have been an exacerbating factor, but not the cause.
A change in character was already underway well before DASH started trading. For instance VIX futures firmed up overnight and a positive 3C divergence was evident before the cash open. Yesterday VVIX led VIX lower from the cash open. Today VVIX led VIX higher from the cash open. VVIX gained +10.8% and VIX +7.7%. Both displayed relative price strength vs. the benchmark S&P index. That doesn’t make any sense if DASH was the cause.
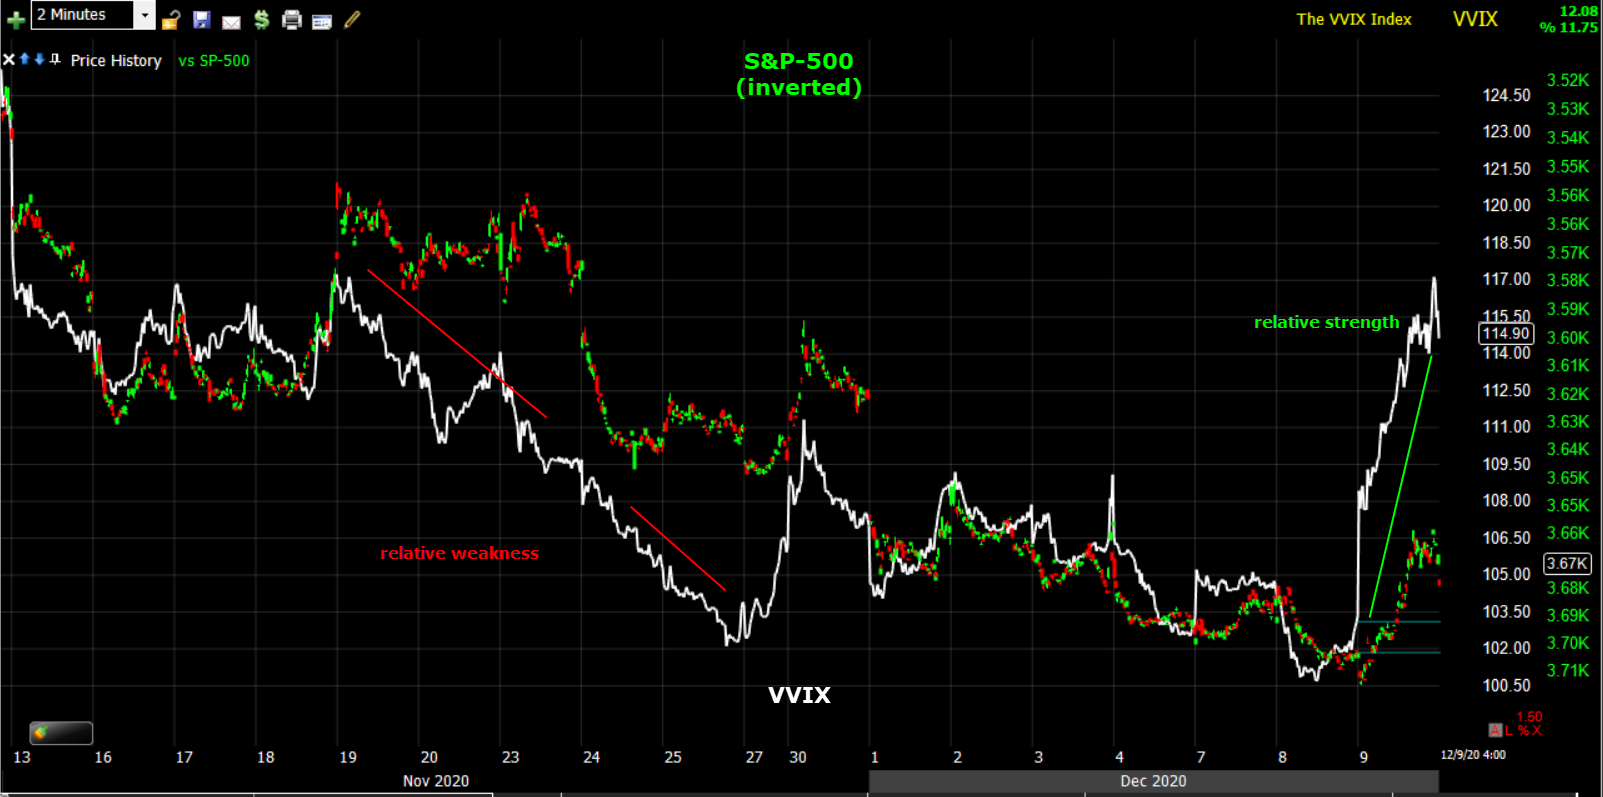
SP-500 inverted (2m) and VVIX (white) with areas of VVIX relative weakness (red) and today’s relative strength (green) which is notable with VVIX tagging its 50-day for the first time in 3 weeks as the equity market posted its worst day in a month.
Massive short squeezes have driven small caps higher for well over a month. This morning started like many over the last month with the most shorted stocks squeezing higher, but today something changed and they rolled over early on.
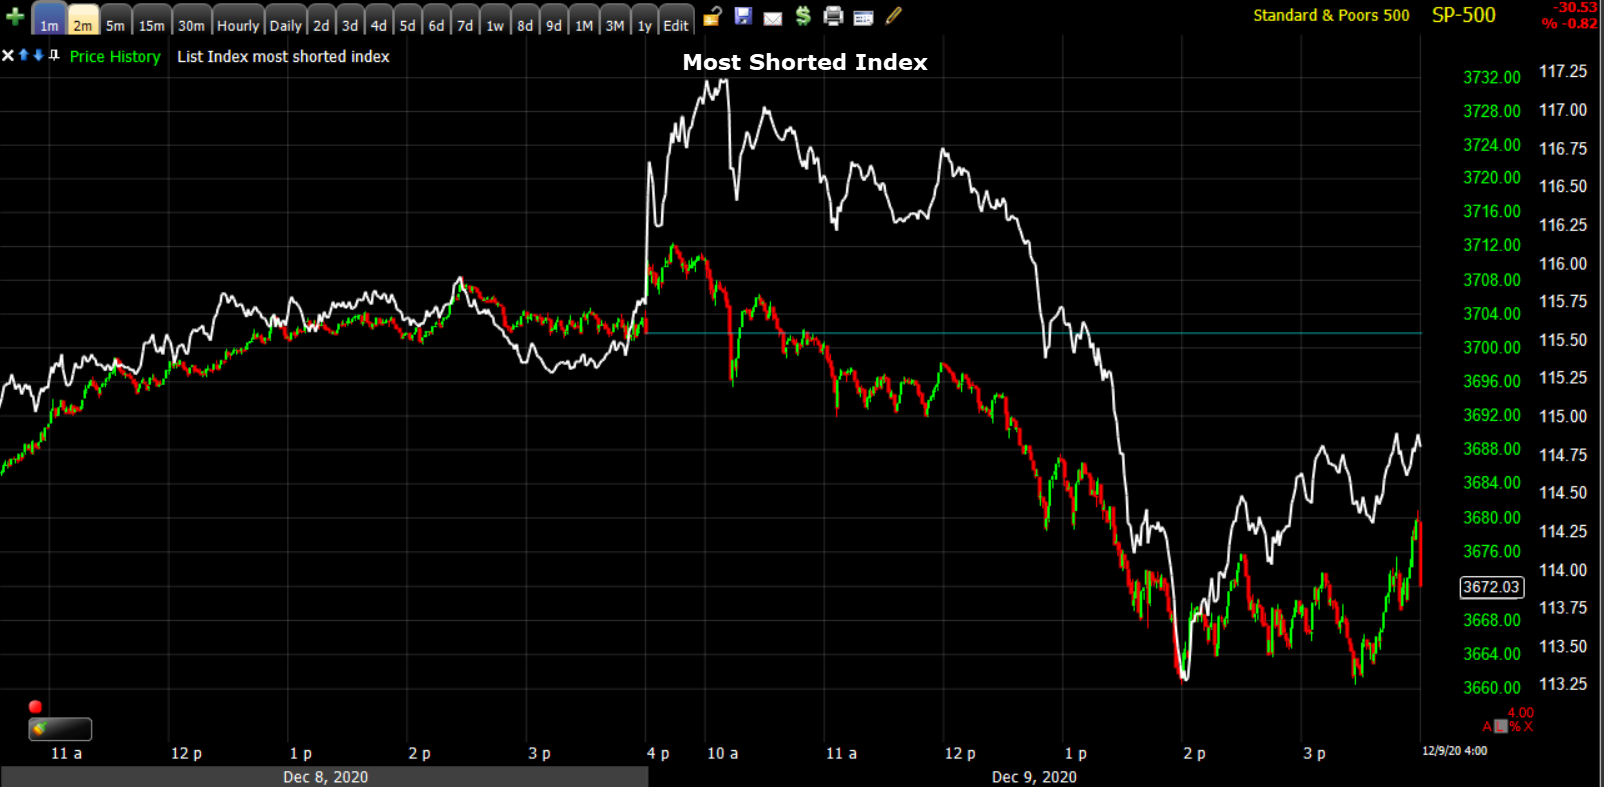
SP-500 (1m) and Most Shorted Index (white). By the close the index of most shorted stocks posted its worst day since October 30th. The Most shorted index of stocks shares very little in common with the mega-cap tech stocks, it shares more in common with the Energy sector recently. Again, it doesn’t fit the DASH narrative.
Another change in character well before this afternoon is Credit’s relative weakness yesterday.
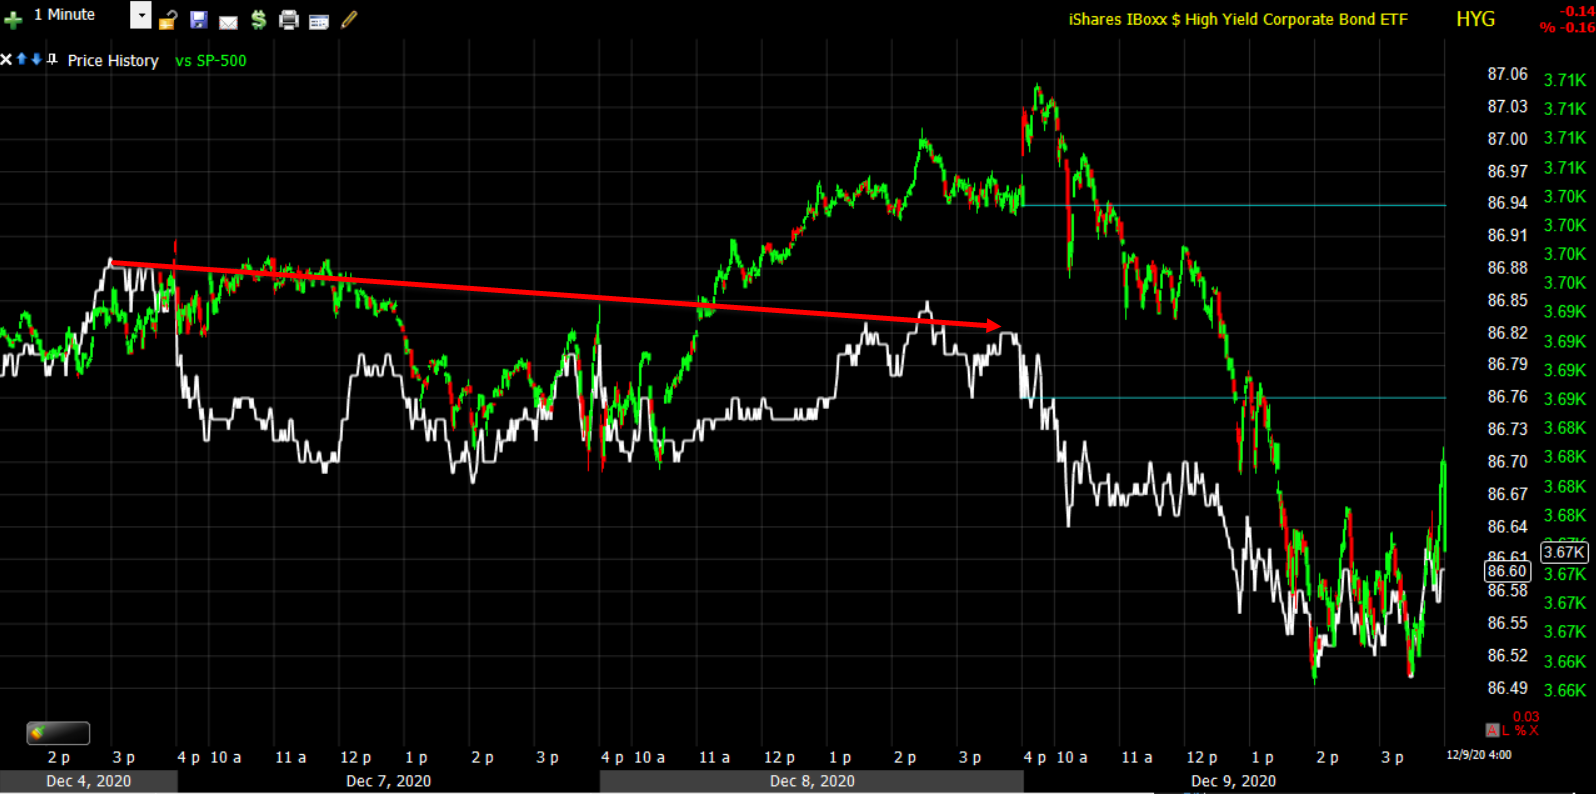 High yield credit (white) didn’t confirm the S&P (1m) yesterday and actually started lower at the open today. It’s not the kind of signal that jumps off the chart, but it does make the case that whatever was behind today’s weakness, it wasn’t just money moving from the Tech sector to DoorDash.
As for stimulus, Treasury Secretary Mnuchin offered a new $916 billion stimulus bill, but Democratic Congressional leadership didn’t like the fact that it excluded enhanced unemployment benefits and preferred to focus on the $908 billion bipartisan plan instead.
Averages
The worst selling was concentrated in Technology. As a result the NASADAQ-100 posted its worst day since Oct. 31, but note that Small Caps were the second worst performing, they were not the benficiary of NASDAQ weakness as has been the case since at least November.
S&P 500 ⇩ -0.79 %
NASDAQ ⇩ -2.15 %
DOW JONES ⇩ -0.35 %
RUSSELL 2000 ⇩ -0.82 %
The change in tone or character is evident on the daily price charts.
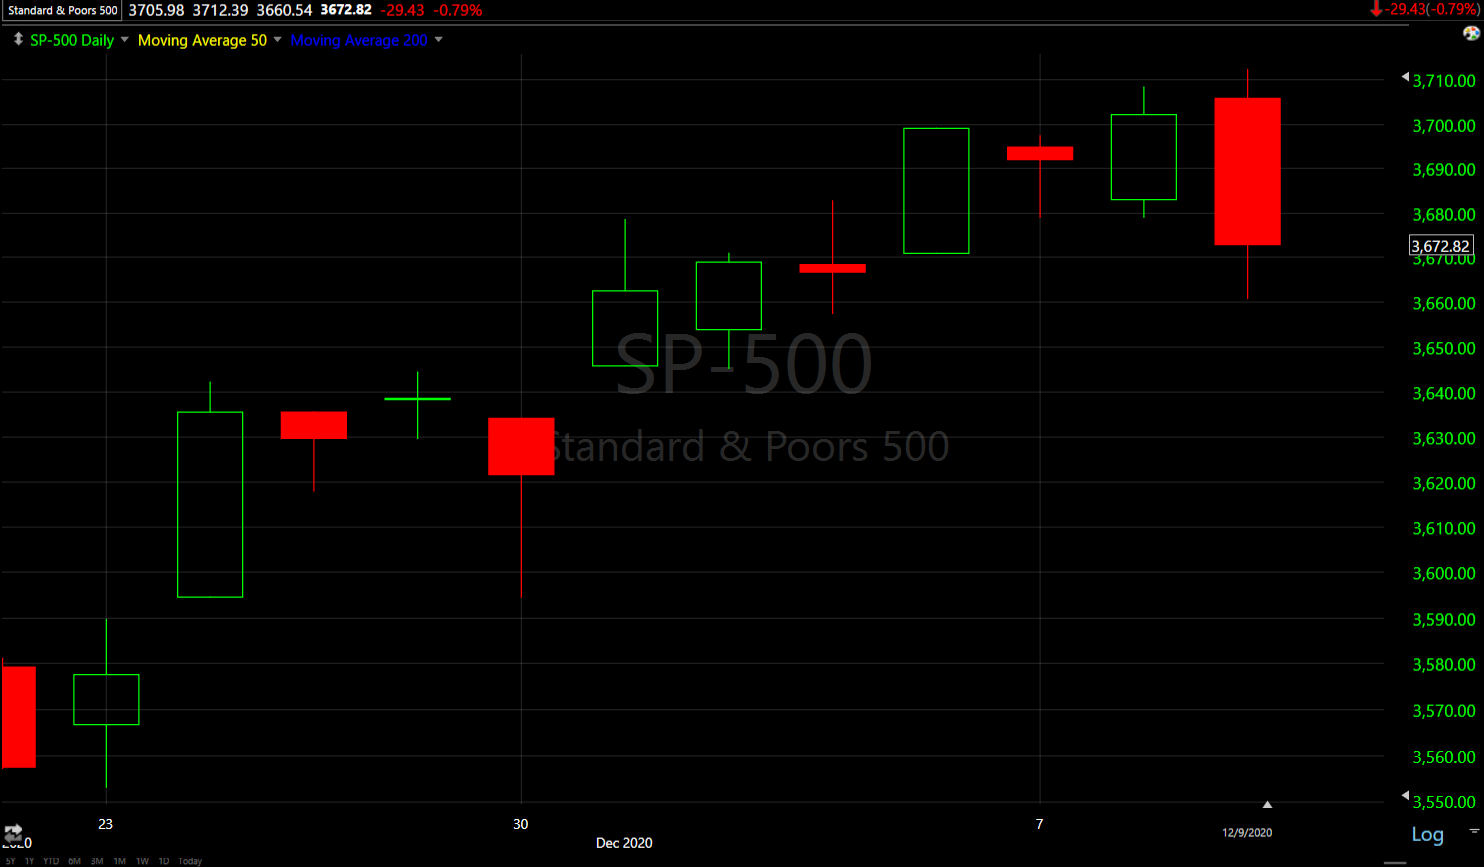 SP-500 (daily) down 2 of the last 3 days, but more notably is the bearish engulfing candle. VIX posted a bullish engulfing daily candle.
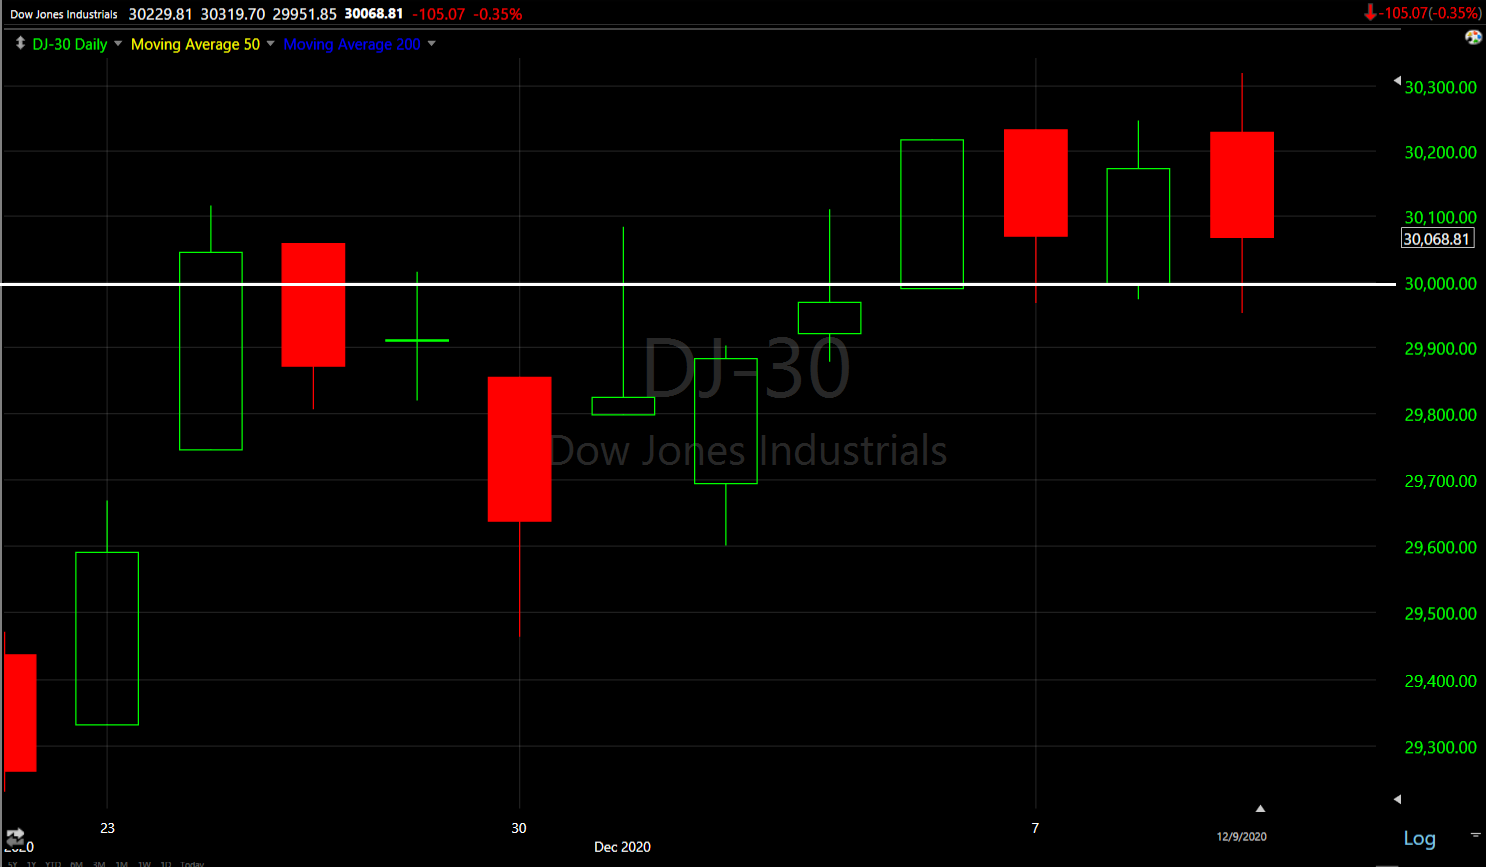 Dow (daily) shows the chop back and forth around the psychological $30k level for weeks.
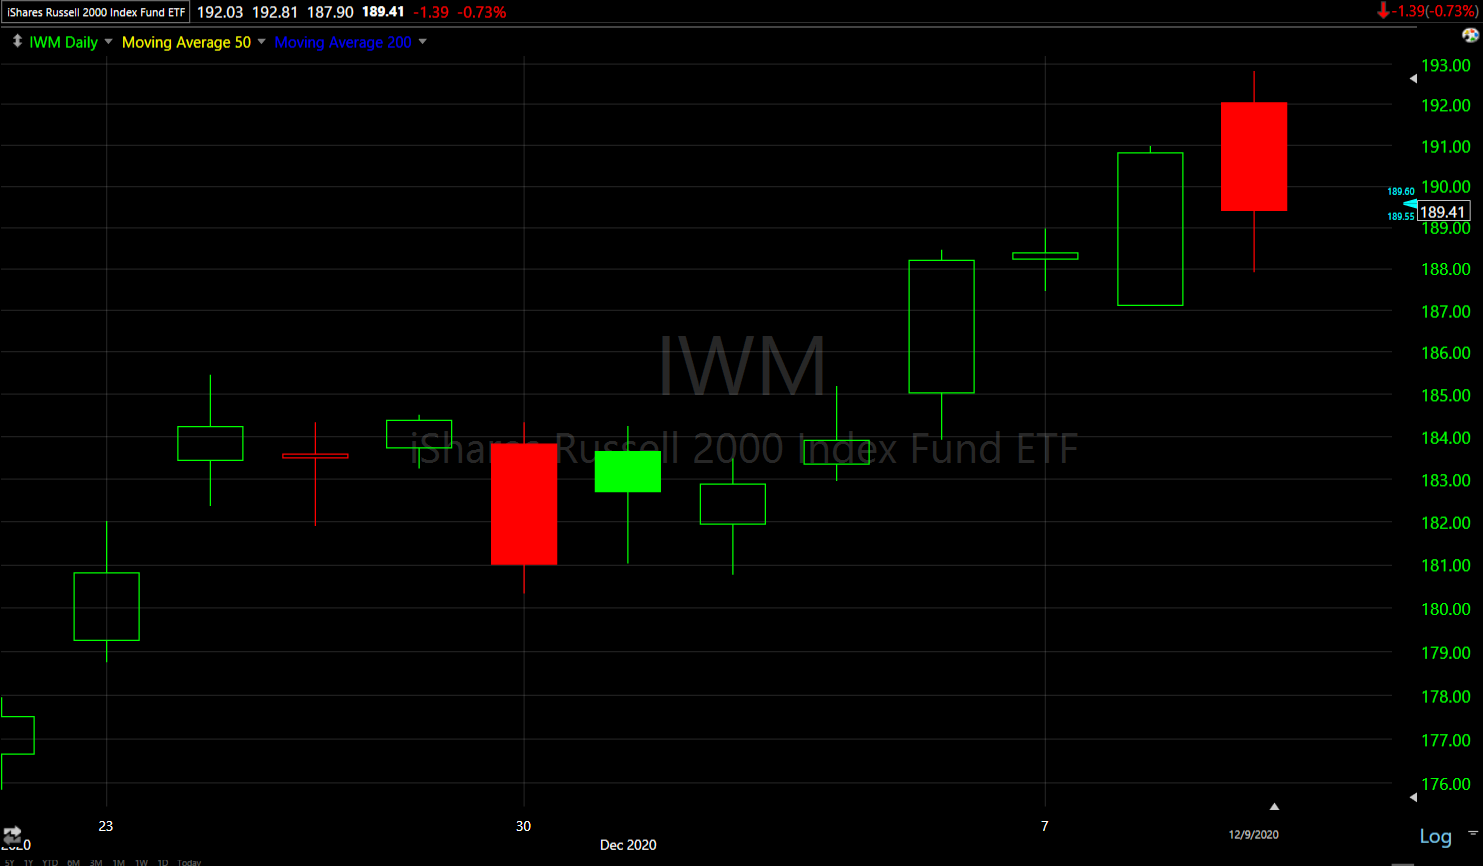 Small Caps (daily) posted a bearish Dark Cloud Cover (gap up and closing well into yesterday’ real body price range).
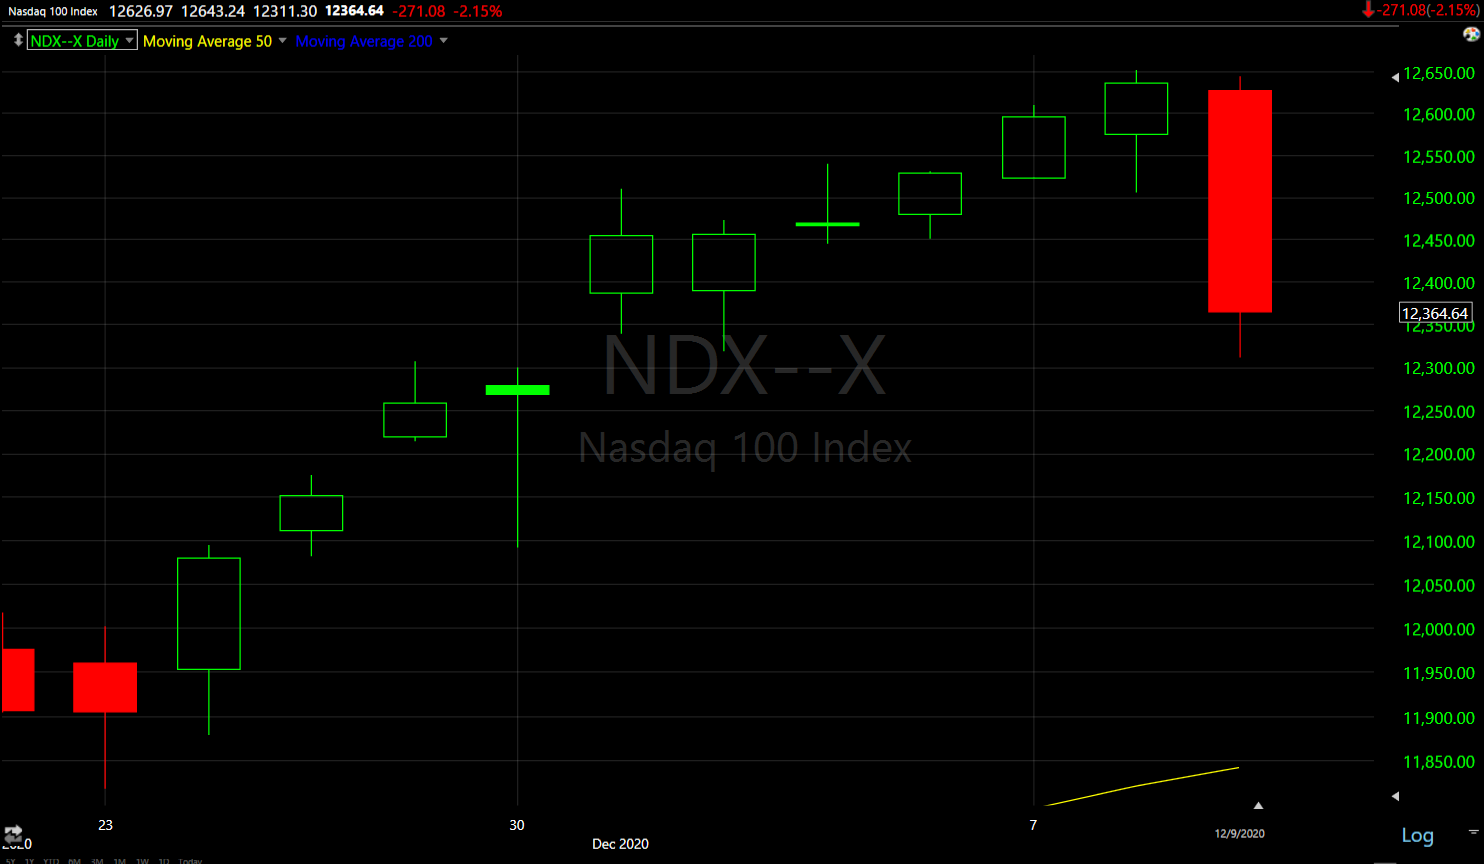 The NASDAQ-100 (daily) stands out the most after 10 consecutive green closes, today’s loss retraced 6 days worth of gains.
The averages ended the day with a bearish consolidation following the decline in prices, however those consolidations started at various local support areas.
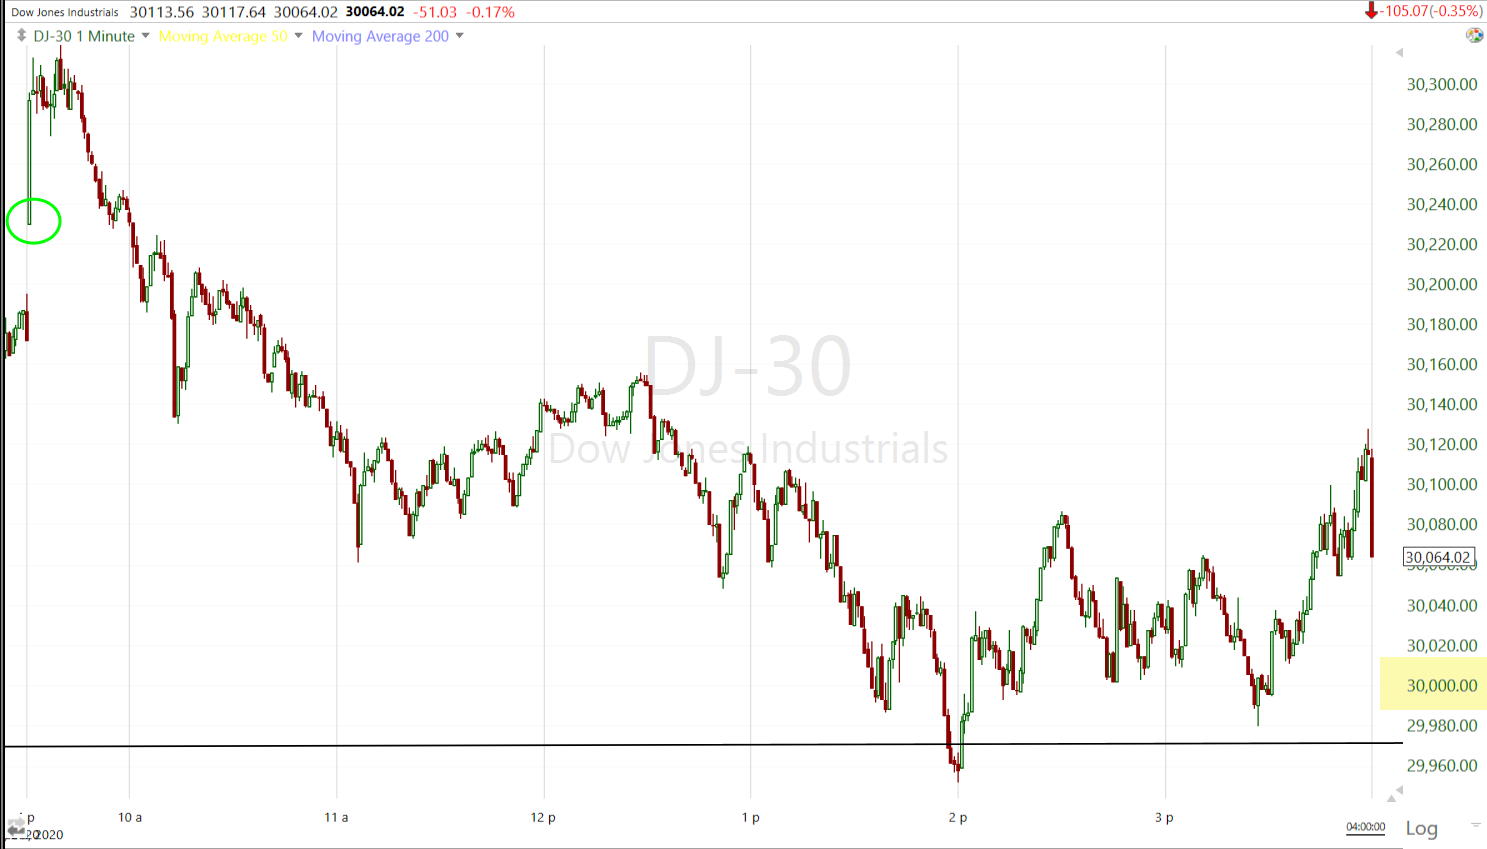 Dow (1m) opened higher and found an intraday low near the psychological $30k level.
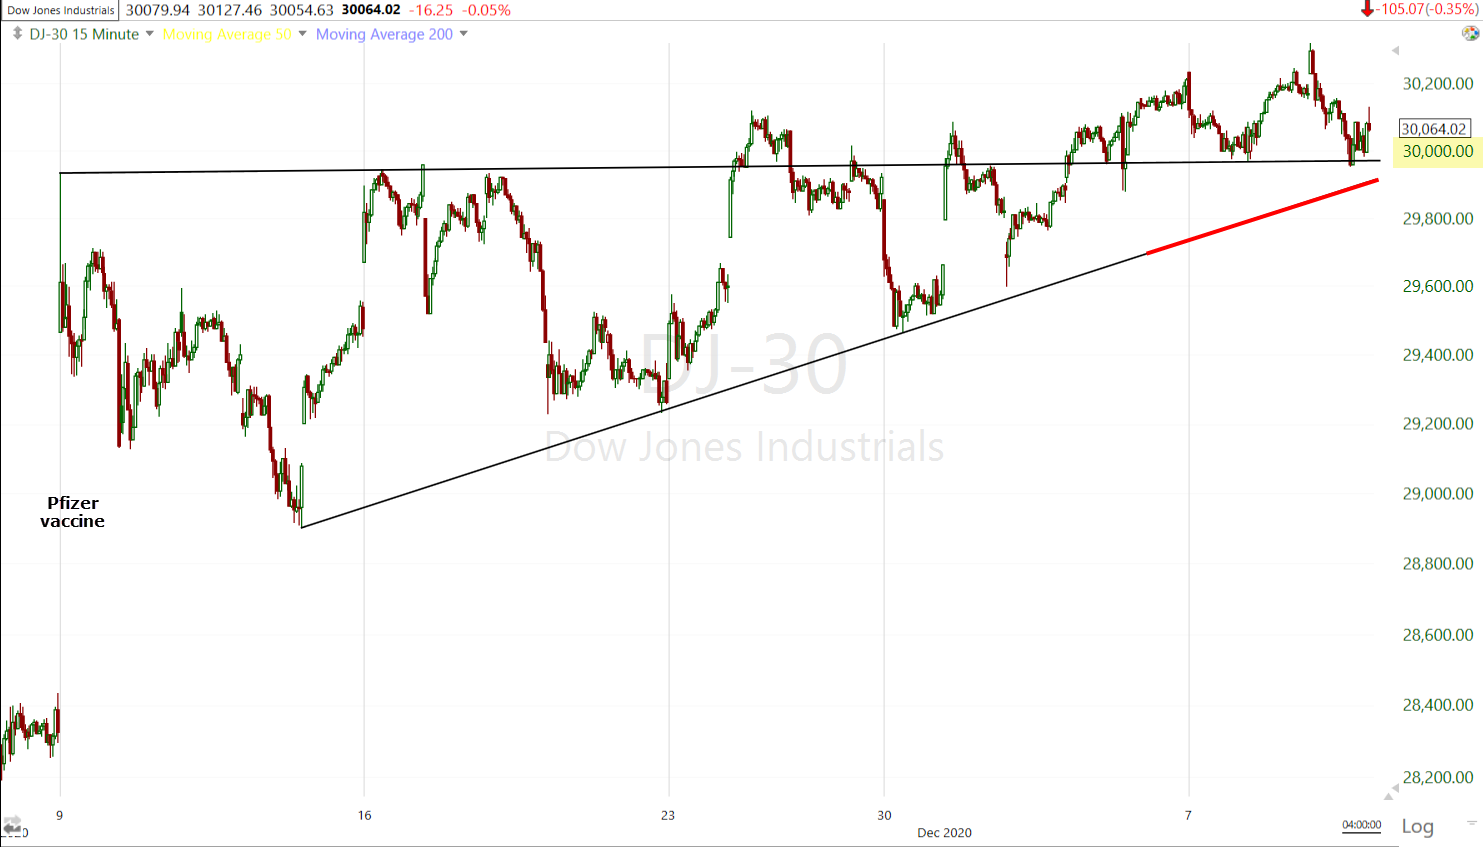 Dow (15m) there is no technical damage done as of the close, but the Dow is only about a half a percent away from a break of the lower consolidation trend line (red) around 29,900. If that occurs, the chances of a failed breakout (head fake) rise exponentially. The rule of thumb is that failed breakouts often lead to fast and sharp reversals.
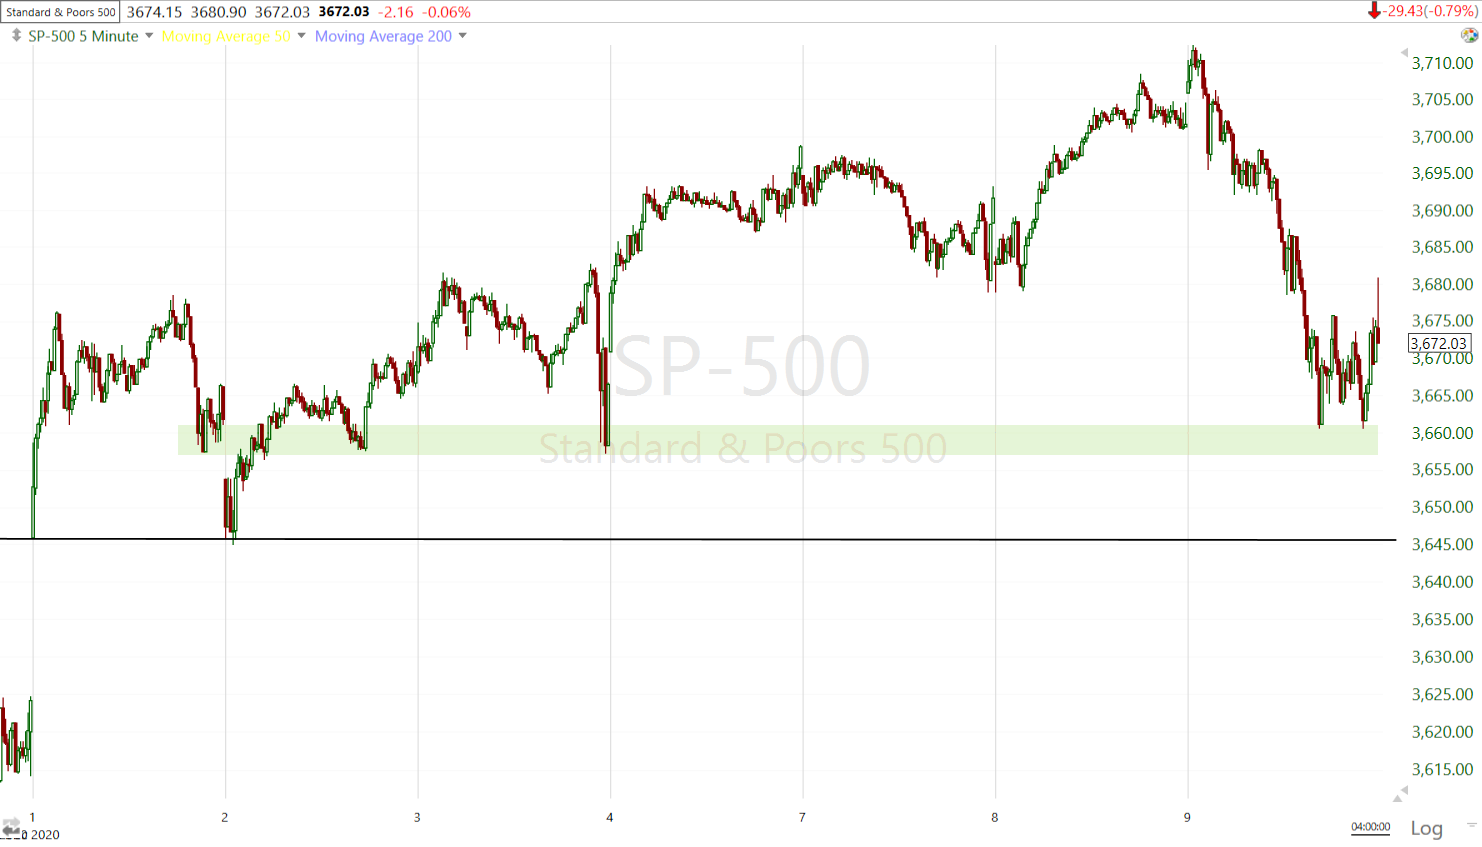 I suspected the S&P would find Local Support around the green band ($3657) area, which it did.
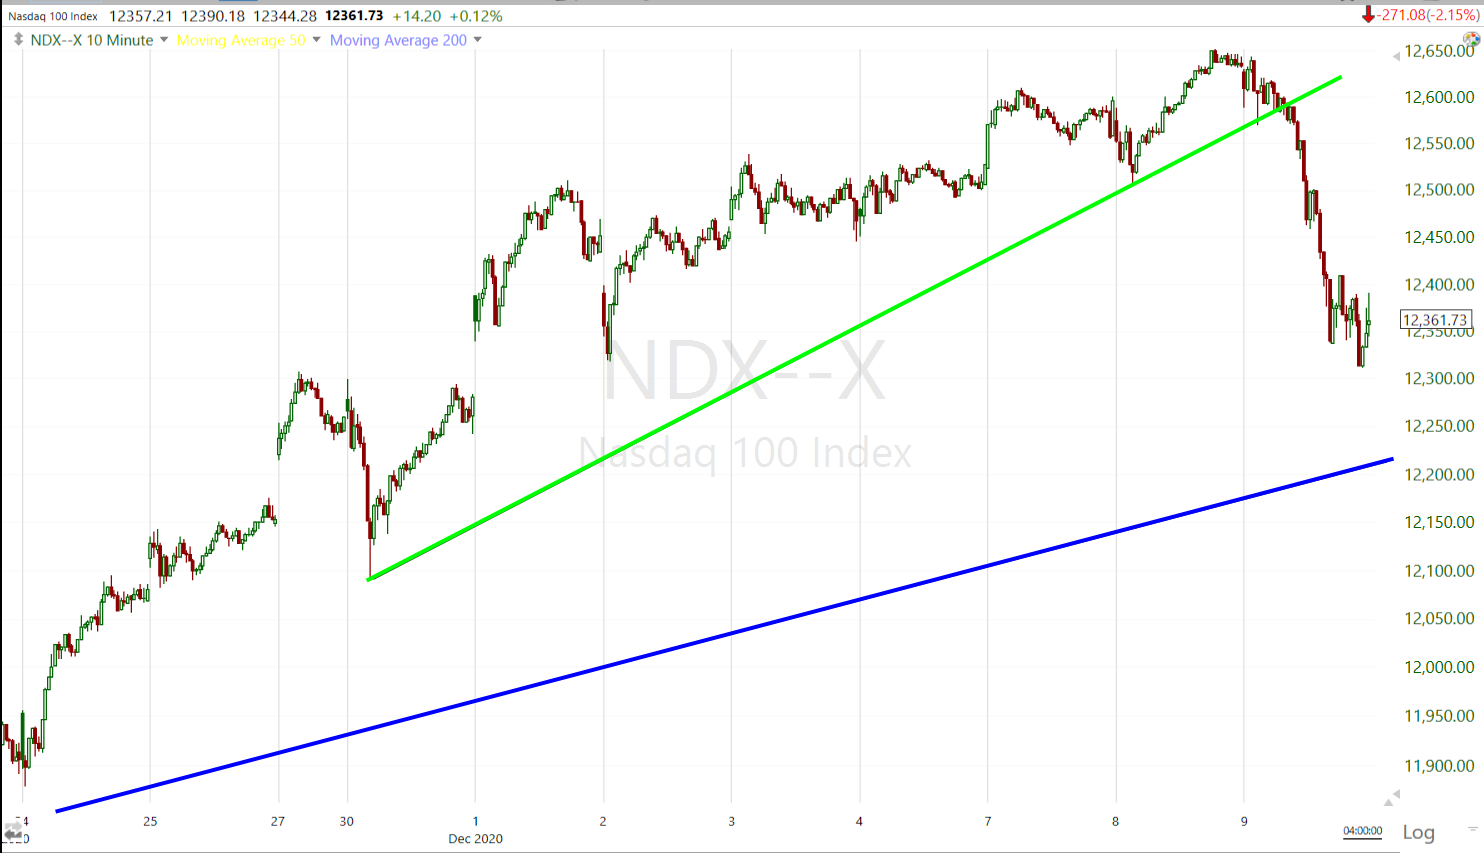 NASDAQ-100 (10m) broke below the December up trend (green). I wouldn’t be surprised to see it test the November up trend (blue) before this is over. A break below the November trend (currently around 12,200) would be a much more serious technical break.
S&P sectors
Cyclical sectors held up fairly well, while the influential Technology sector weighed on the averages the most. However, it’s worth noting that the Energy sector was one of the first notable areas of weakness earlier today, going from an early gain of +2.6% to a loss of -1%. That certainly doesn’t appear to be linked to DASH’s first day of trade.
Technology was already under selling pressure, but a massive antitrust lawsuit brought by the FTC and U.S. states against Facebook (FB -1.9%) over its business practices later in the day didn’t help. The other mega-cap/Tech stocks were down generally around -2% as well. Netflix (NFLX) lost -3.7% and closed below its 50-day sma.
Materials ⇧ 0.06 %
Energy ⇧ 0.22 %
Financials ⇩ -0.24 %
Industrial ⇧ 0.22 %
Technology ⇩ -1.92 %
Consumer Staples ⇩ -0.40 %
Utilities ⇩ -0.18 %
Health Care ⇩ -0.35 %
Consumer Discretionary ⇩ -0.10 %
Real Estate ⇩ -0.92 %
Communications ⇩ -1.19 %
With regard to today’s “Change in character” and euphoria from last night’s post,
“On a side note related to investor euphoria, Tesla (TSLA +1.3%) announced a $5.0 billion common stock “at-the-market” offering, the stock was down -3.6% intraday, but closed higher. I think this is emblematic of the animal spirits and investor euphoria.”
Tesla (TSLA) lost -7%, posting its own bearish engulfing candle on its daily chart.
Like the major averages, no serious technical damage was done in S&P sectors, but today did open the door to a more serious head fake scenario. I’ve mentioned numerous S&P sectors (many cyclical) that have been in consolidation since the November 9th Pfizer vaccine news, just as bond yields have been. We’ll look at the Tech sector because it was the most influential today.
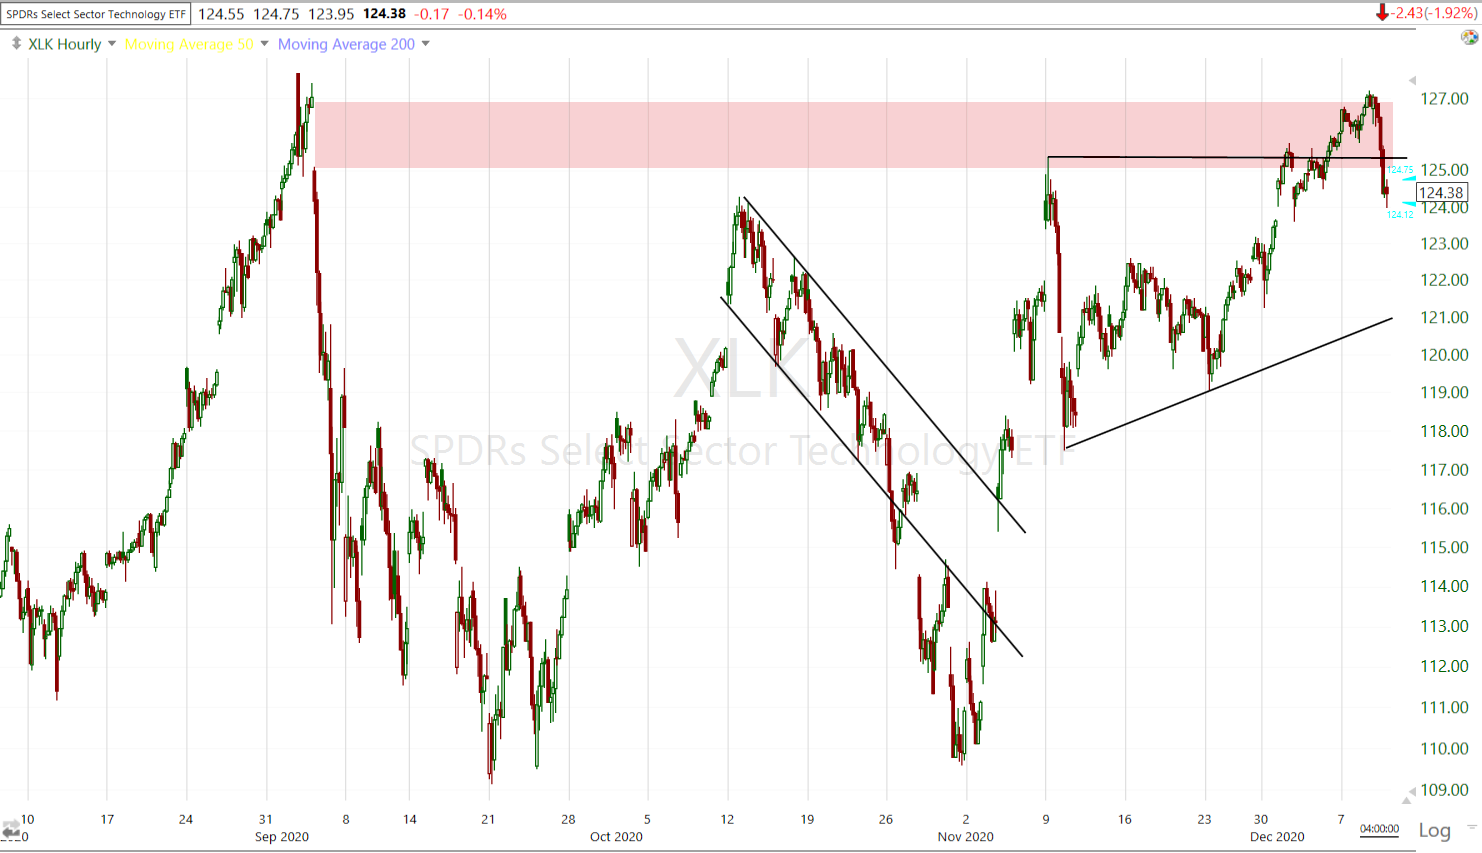
Tech sector (60m) ascending triangle (bullish) from the Pfizer vaccine news. Prices broke out above, but met resistance near the early September high that led to a 10% decline in the S&P. Price did not make a lower low, but it did not hold former resistance (top of the triangle). A break below the triangle would be a serious technical development and a failure of the breakout, or a head fake. The Dow is at the greatest risk of such a scenario, but there are other sectors that a very close as well.
Novavax (NVAX -4.1%) traded below the December 2nd pivot low. After a 70% run in a week, price needed to correct/consolidate, but I think it would have been more constructive had it held above the 12/2 low, but it certainly doesn’t rule out the potential, if not probability of a larger flag consolidation. I mentioned the scenario several days ago.
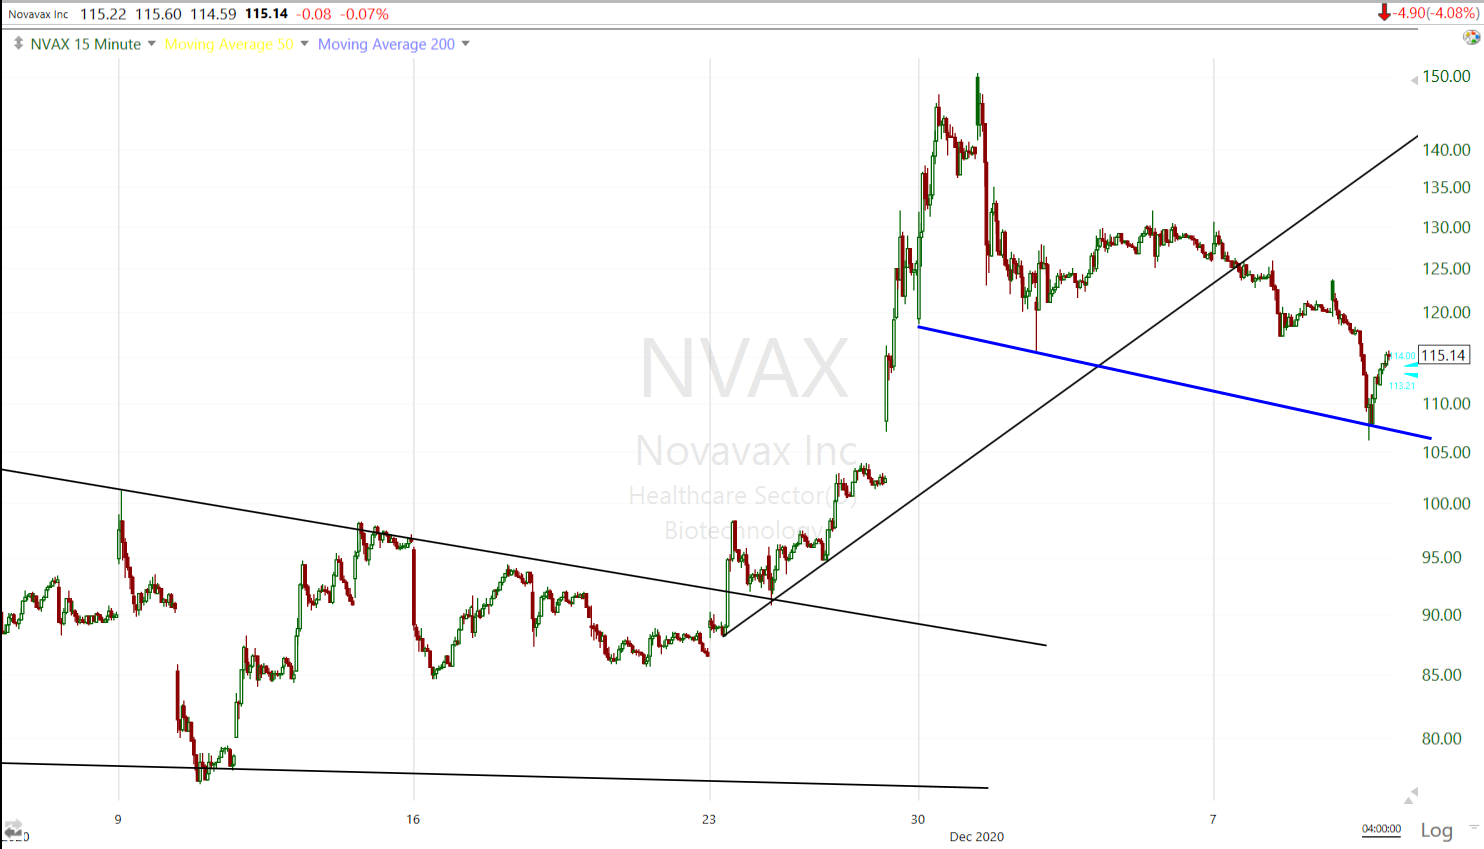 NVAX (15m) I just drew in the blue trend line today, but this is the bull flag scenario discussed a few days ago, it could also be a wedge. You can see the pivot lows I connected from 11/30, 12/2 and today. Flags tend to be pretty symmetrical so you could add a parallel upper trend line, although I’d wait for price to bounce. There is a gap down around $103 and that gap could be filled in the context of a bull flag or even a wedge, but I suspect it would take a few more days to do so. I would not want to see price violate this new (blue) trend line, that would make it very difficult to envision a bullish consolidation case.
Internals
Internals were nearly evenly split with Advancers (1546) and Decliners (1510), but on noticeably heavier volume of 1.1 bln shares.
The Dominant price/volume relationship came in at Close Down/Volume Up, which is one of the conditions for a 1-day oversold event. However, decliners need to be at least 2-to-1 over advancers and that didn’t happen.
The chart below shows the focus of selling this afternoon in Tech and specifically large-cap Tech.
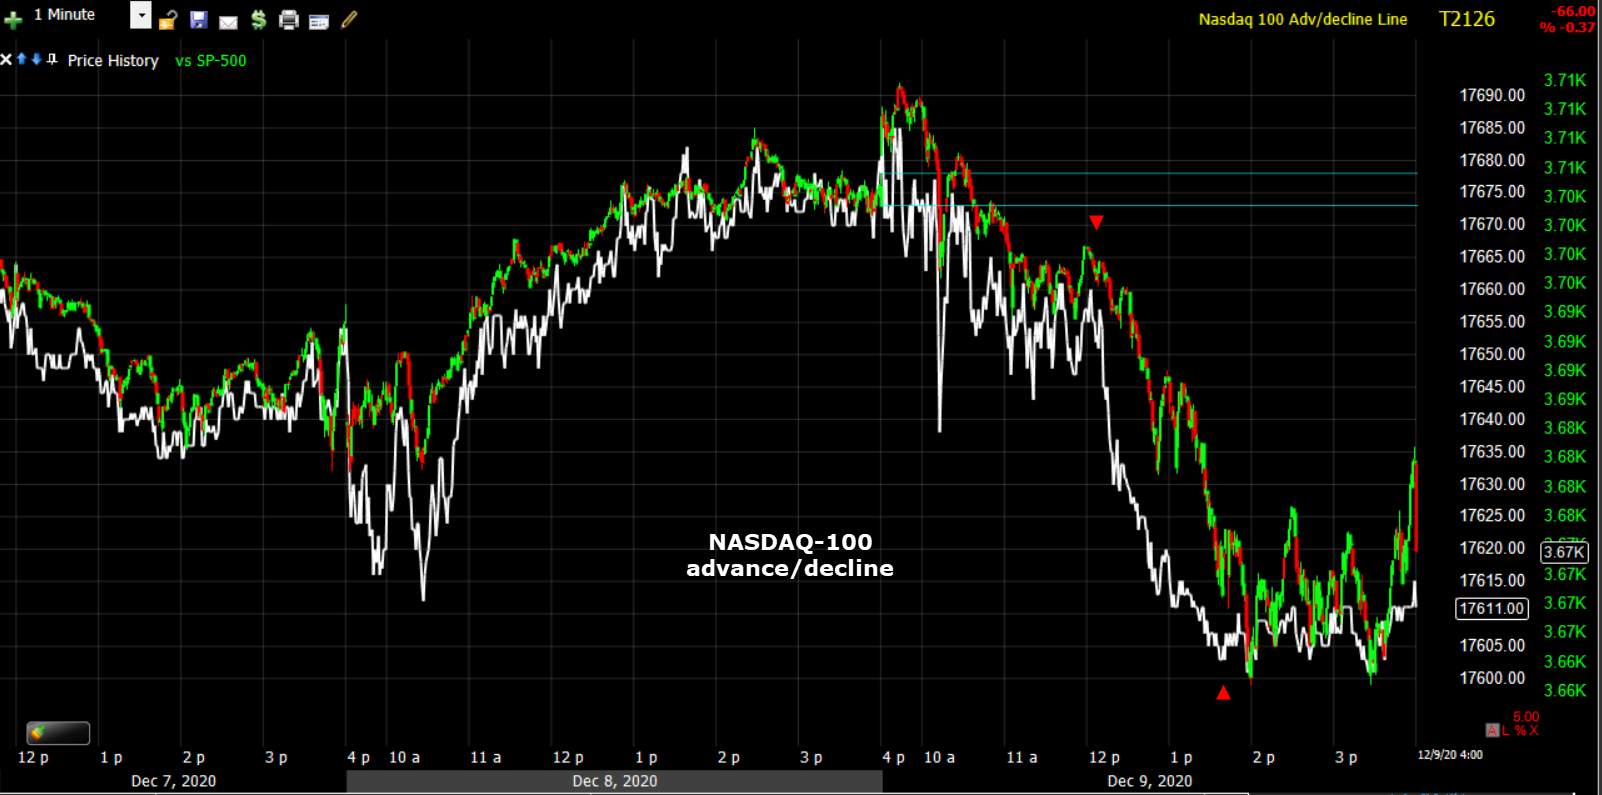 SP-500 (1m) and NASDAQ-100 advance/decline line plunging around noon.
Treasuries
The volatility in Treasuries continues and probably will until there’s some certainty with regard to stimulus, or a more pressing maco development occurs. Longer-dated Treasuries declined alongside the major indices, pushing yields higher. The 2-year yield was flat at 0.15%, and the 10-year yield increased three basis points to 0.94%.
Currencies and Commodities
The U.S. Dollar Index increased 0.1% to 91.03. Don’t let the modest increase fool you, the Dollar definitely put pressure on stocks. Before the open the Dollar Index was down -0.2% and by the time stocks hit session lows, it was up +0.2%.
Part of the Dollar’s strength intraday was a result of weakness in cable amid a stalemate in Brexit negotiations. Talks between U.K. Prime Minister Boris Johnson and European Commission President Ursula von der Leyen ended without a breakthrough on Wednesday night as large gaps remain between the two sides. They agreed to continue talks over the next few days.
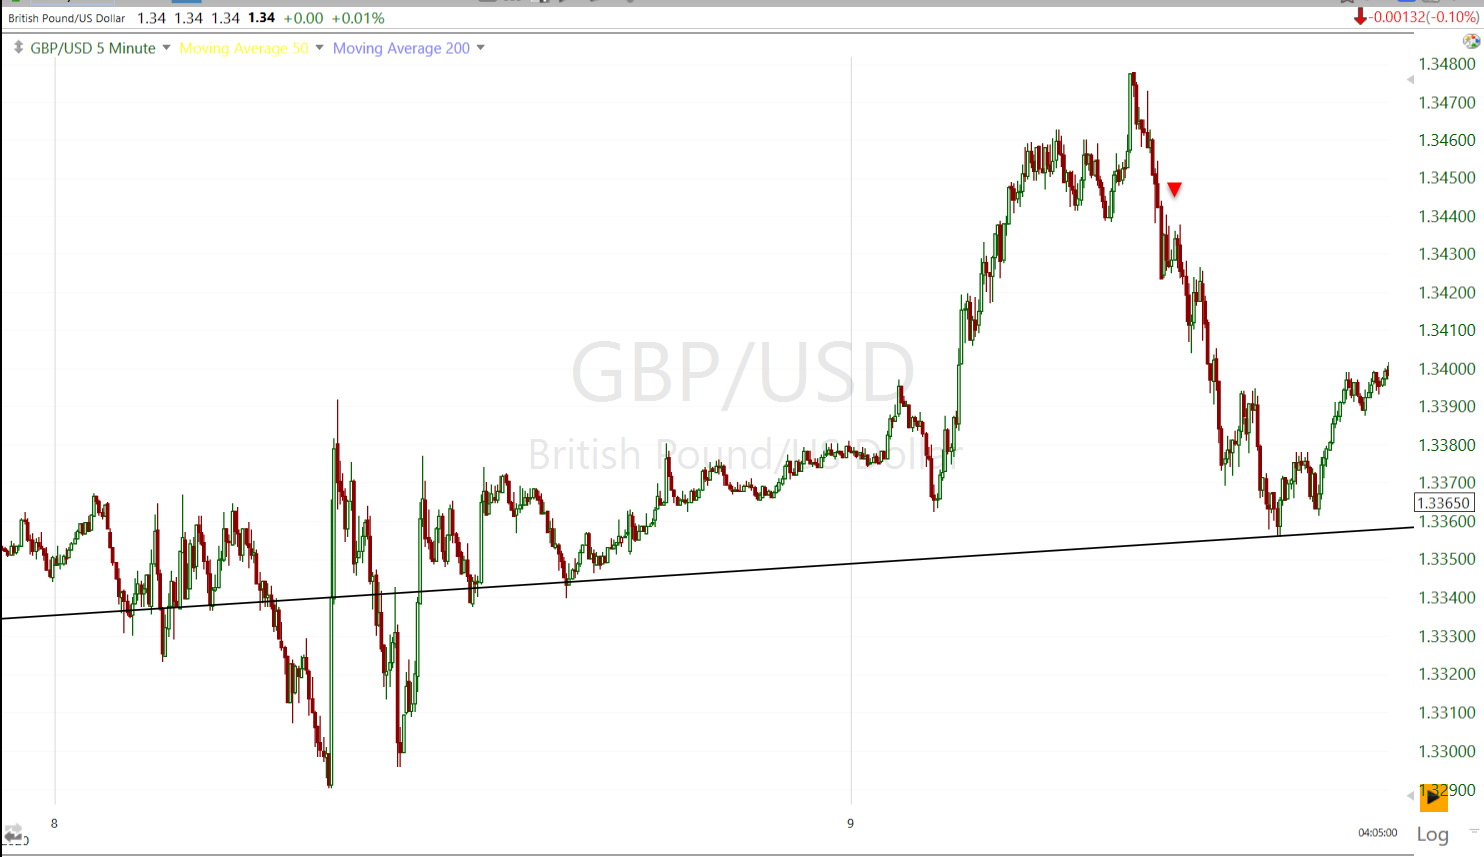 GBP/USD (5m) and the 3 week trend I’ve been monitoring. Earlier in the week when price dropped below it pressured U.S. stocks. Cable dropped from the U.S. cash open (red arrow) and the Dollar Index gained. This is a risk I think is way underappreciated by investors. Weakness in cable related to Brexit was the spark that ignited the S&P’s 10% drop from early September highs.
For perspective..
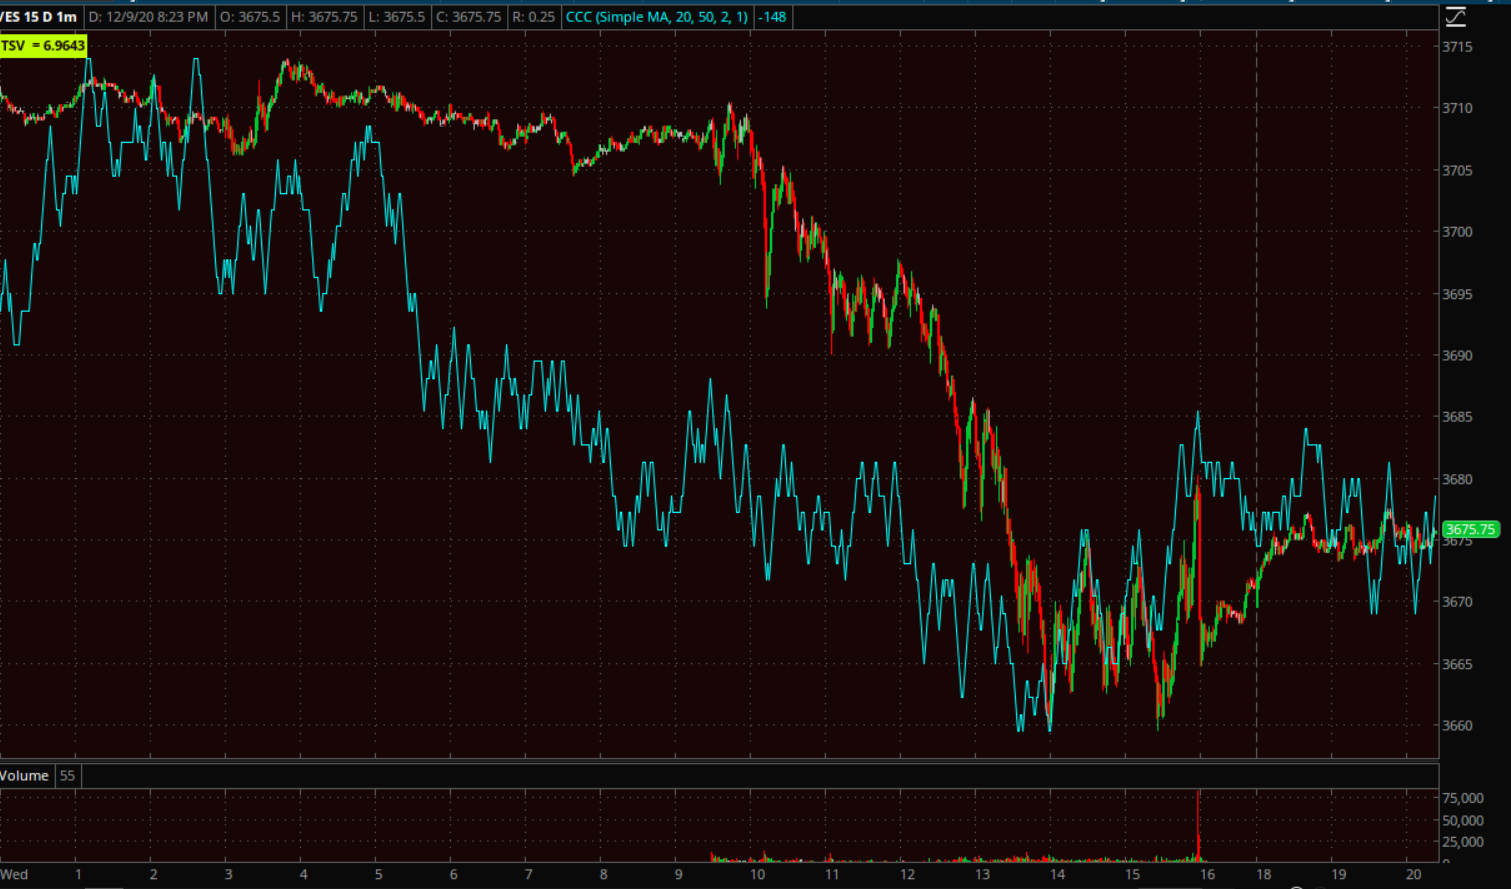
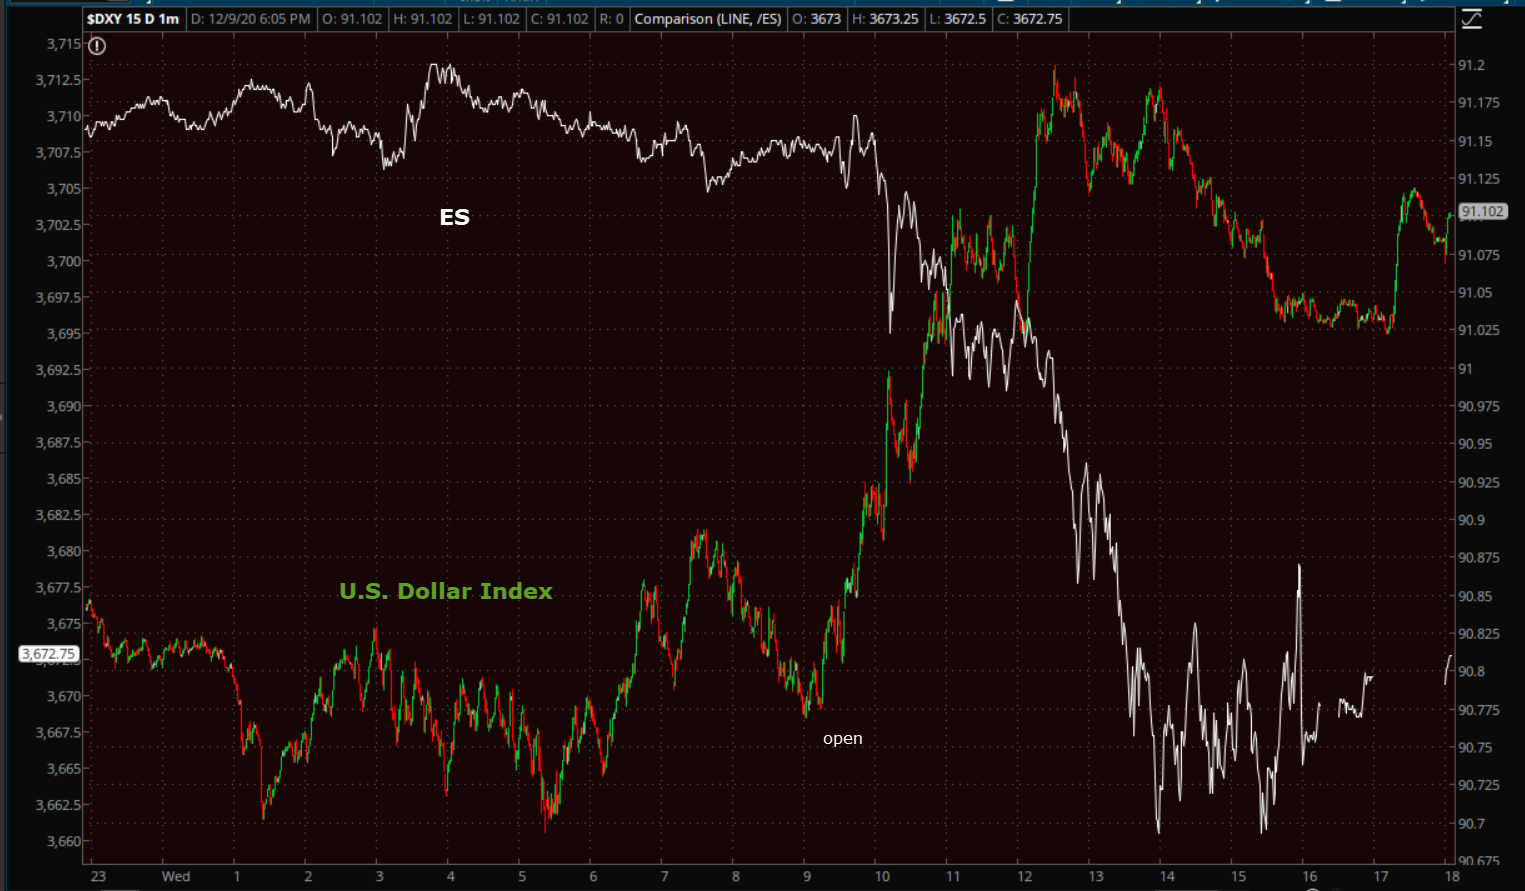 U.S. Dollar Index (1m today) rallying from the cash open while S&P futures (ES in white) fell from the cash open.
WTI crude futures only lost -0.3% to $45.50/bbl. despite the DOE inventories exploding higher unexpectedly like API last night.
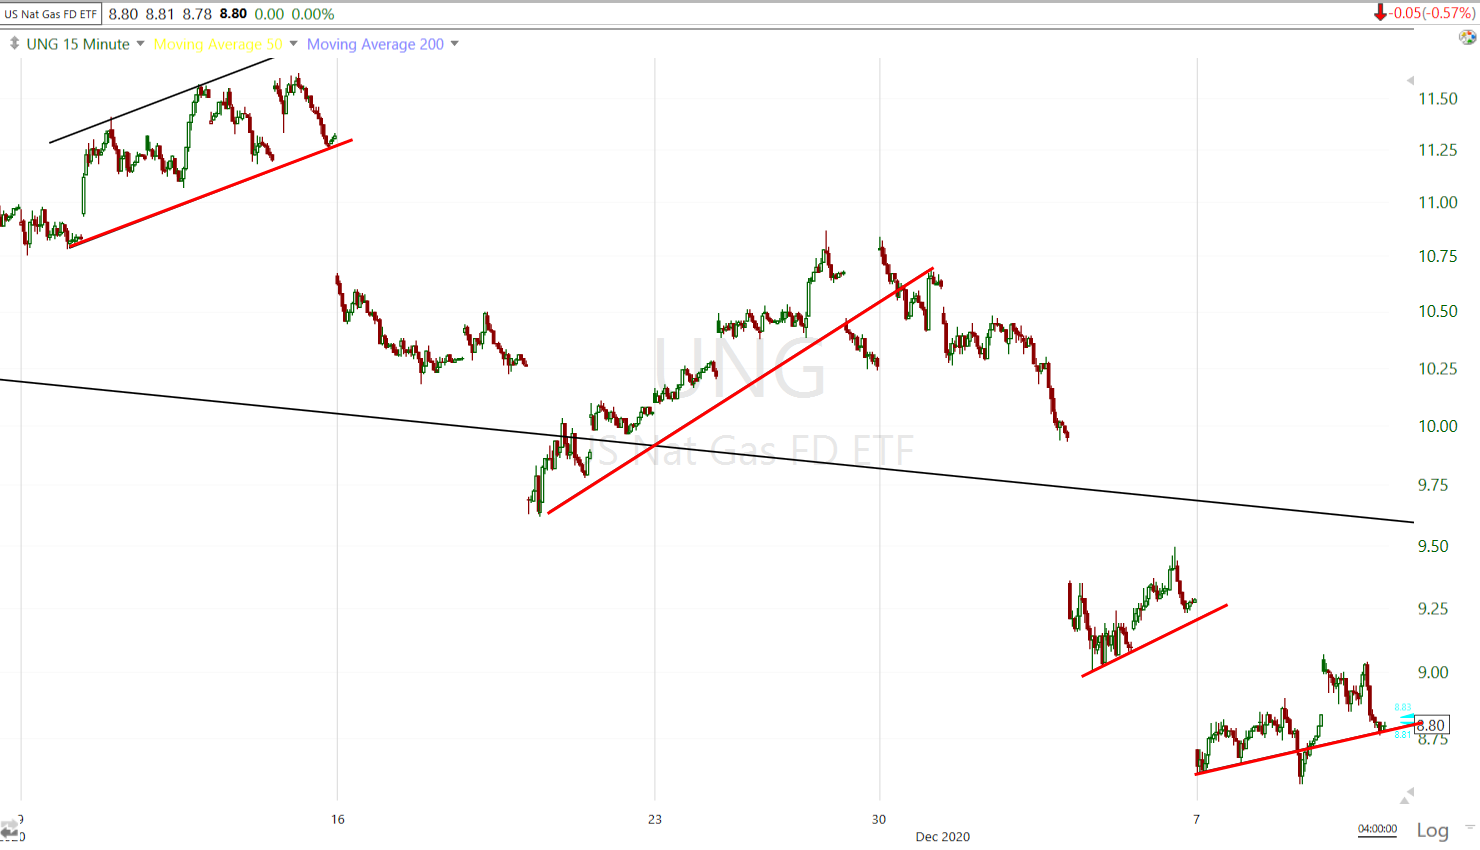
UNG/Natural Gas (15m) prices still have not stabilized after a milder start to winter, and are still trading in a small bearish consolidation.
From last night’s Daily Wrap,
“I’ve expected GLD to bounce up to test its 50-day sma from below, it’s almost there….the main focal points are the former triangle (blue) that prices broke below. That’s likely to be resistance and its right here near the 50-day”
Gold/GLD met resistance right where it was expected and Gold futures fell -1.9% to $1,838.50/oz. today.
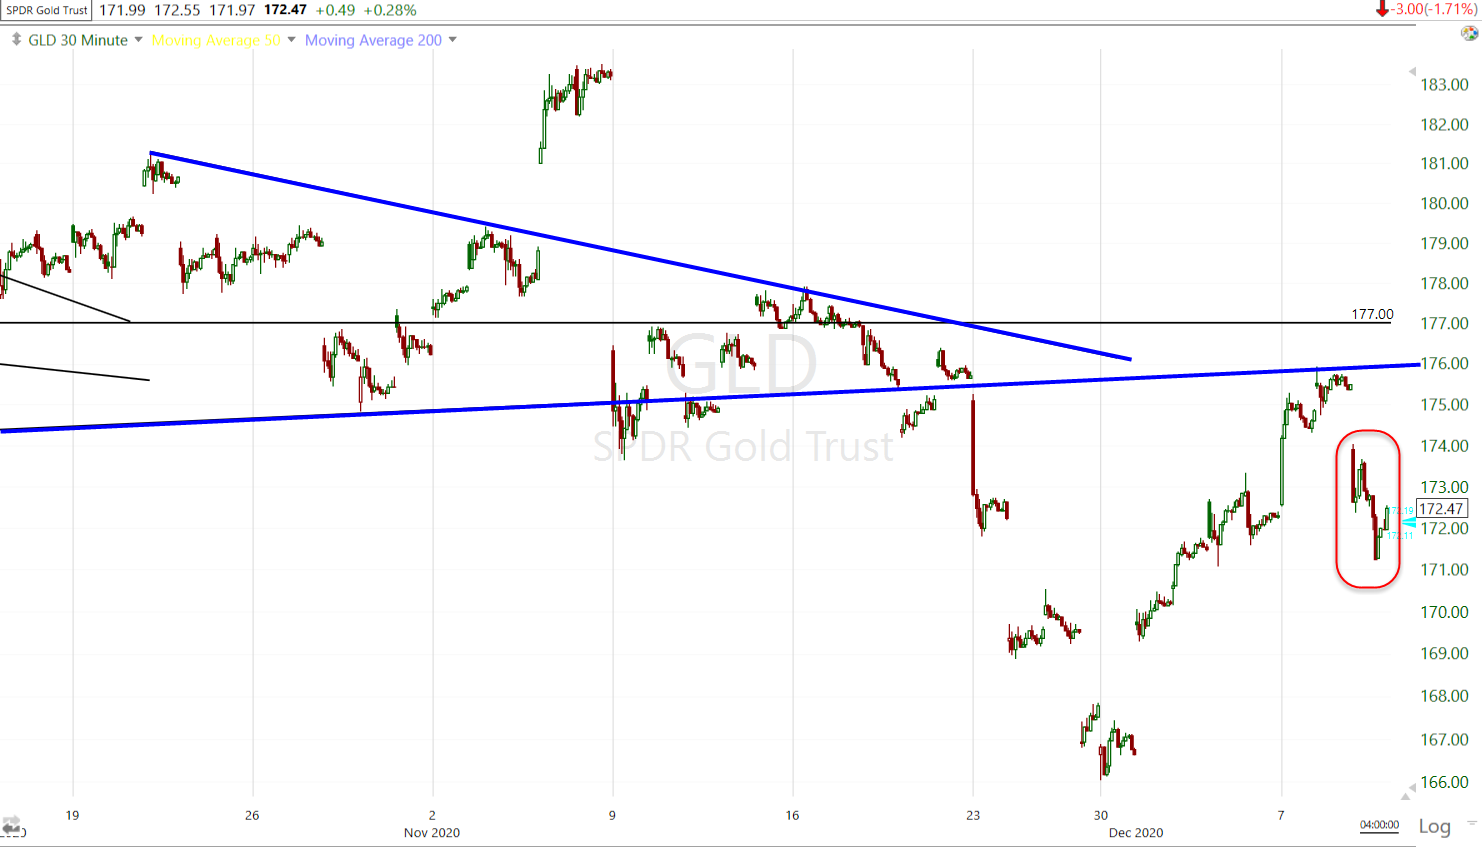 GLD (30m) resistance at the blue trend line. From here I’d like to see gold pull back, but not make a lower low (failed test like UNG). Alternatively gold doesn’t have to pull back a lot, it could consolidate bullishly from here, but that remains to be seen.
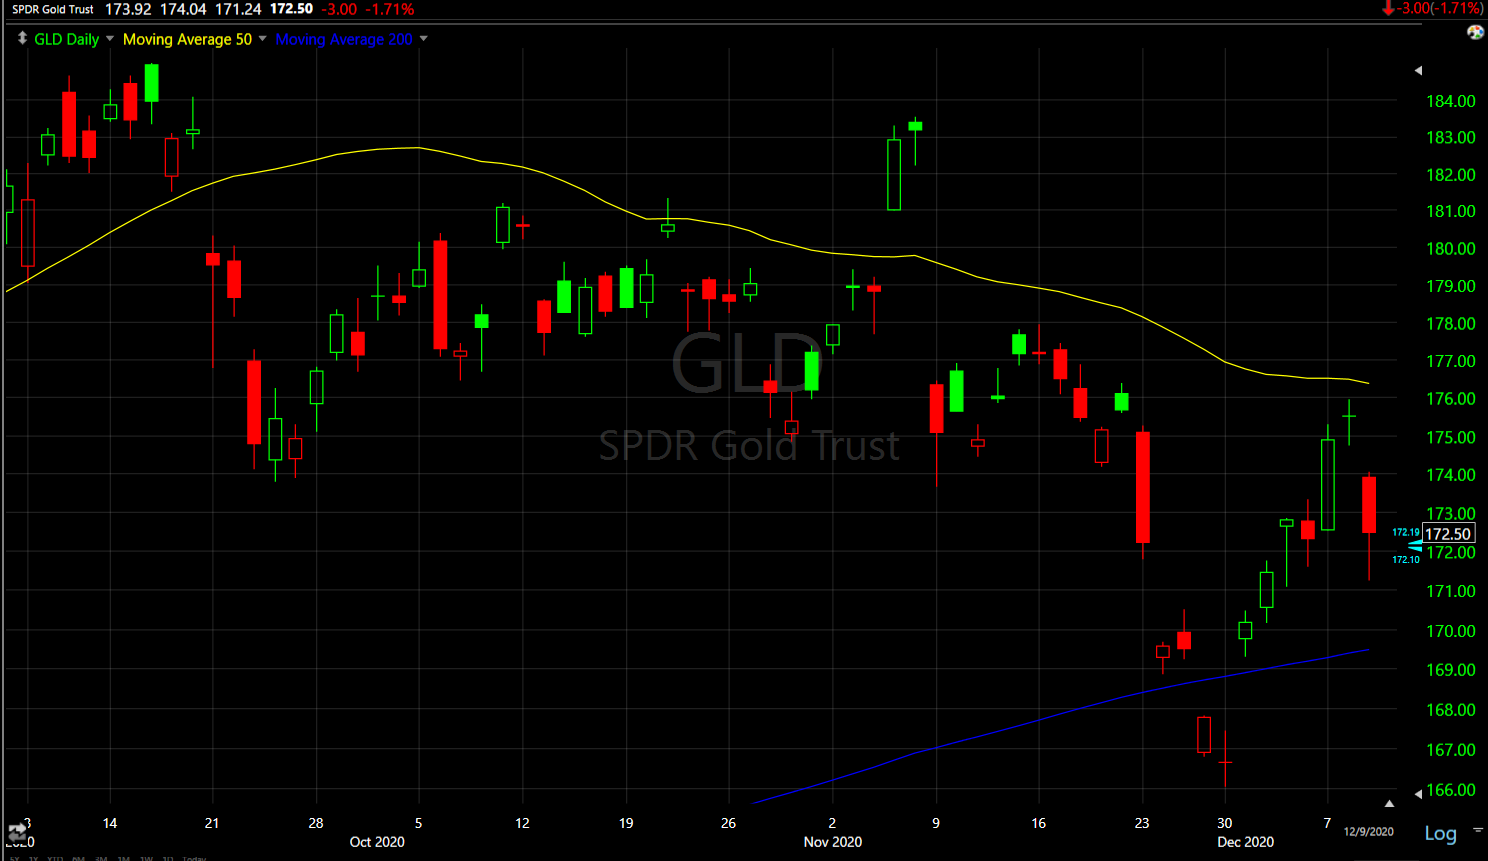 GLD (daily) ideally the pull back from the 50-day (yellow) holds the 200-day (blue) at $169.50. If GLD can do that and 3C shows buyers stepping up and/or Gold miners positively diverge or lead higher, I’ll consider getting involved with gold again on the long side. It’s been over 5 months since I was long gold and it has spent the last 4.5 months declining from the early August high. Waiting a few days or weeks for a successful test and evidence of buyers is well worth it to me.
Bitcoin is still very volatile.
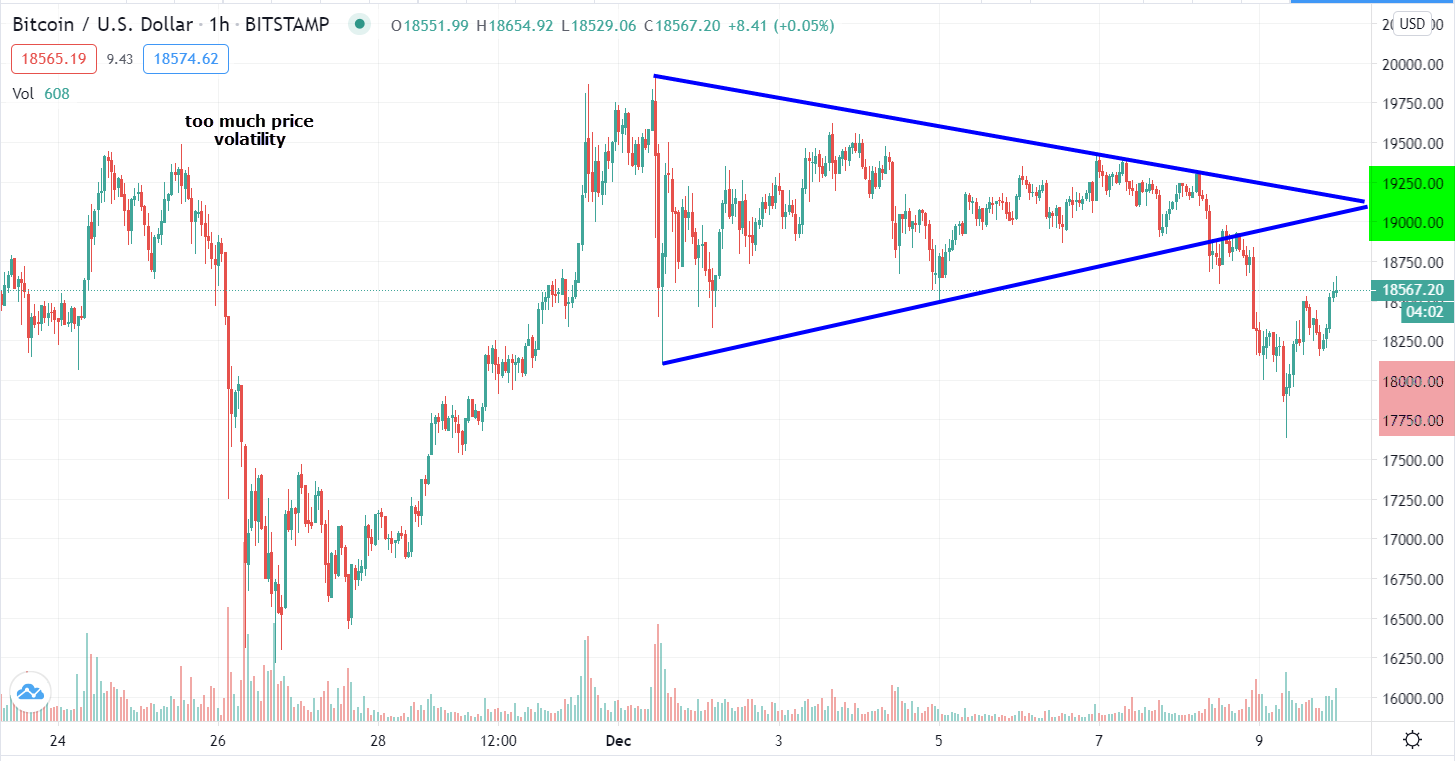 BTC/USD (60m) Bitcoin traded down around $18k and bounced. When prices get as volatile as they have recently, it usually takes some time for things to settle down, and that usually happens with a larger consolidation. I see a potential larger bullish consolidation scenario if BTC holds $18k.
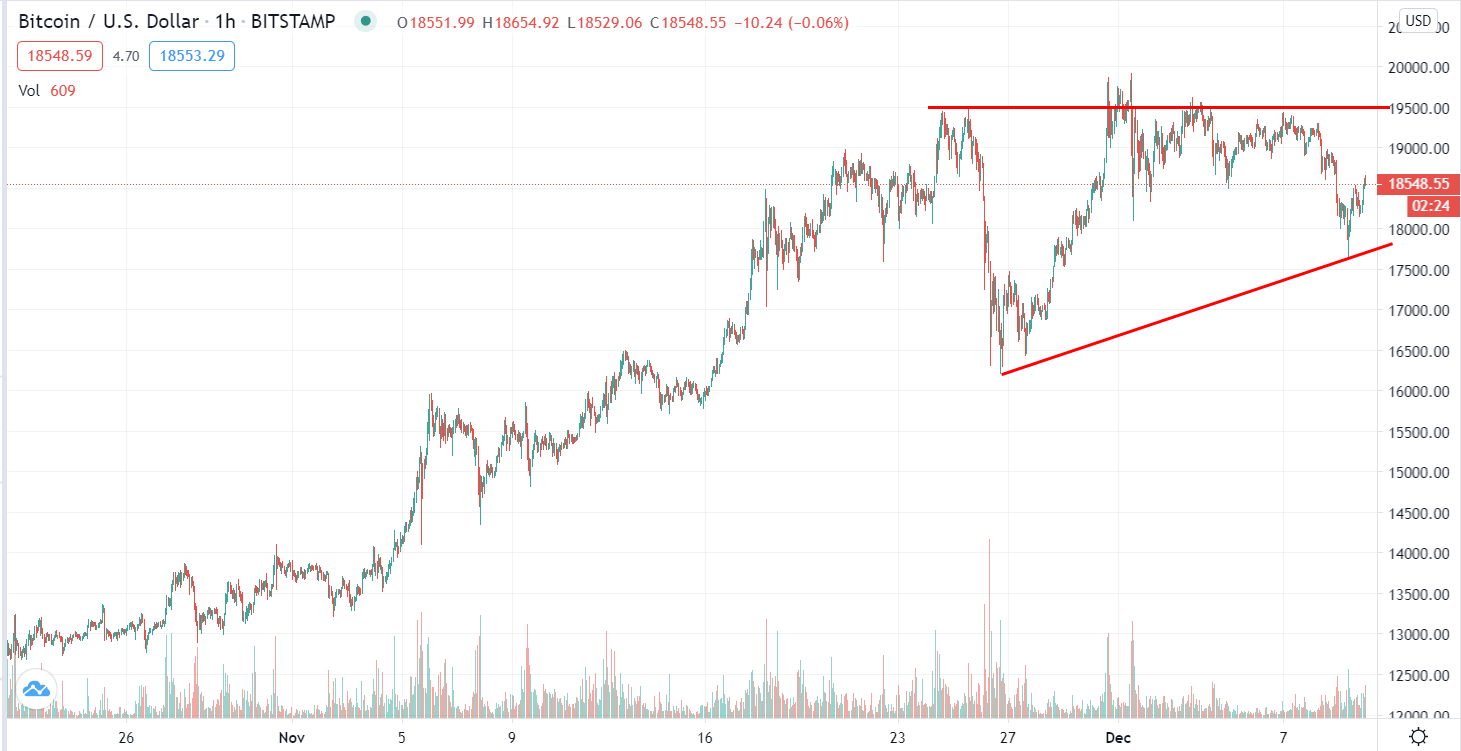 BTC/USD (60m) if it does not make a lower low (<$18k), it could turn into a large ascending triangle (bullish). At this point I think that would be the ideal scenario. If BTC trades under $18k I am likely to stop out of GBTC to protect the substantial gains. If BTC makes a lower low, there’s a much higher probability it will take even more time for a constructive consolidation to develop (as we have seen in gold for months) and I’d prefer to not sit in a sideways consolidating asset for months.
Summary
Today’s declines didn’t do much technical damage, but it was a definitive change in tone or change in character and changes in character precede changes in trends. I’m not convinced it was due to Doordash, but tomorrow Airbnb (ABNB) is scheduled to IPO so we can watch for a similar dynamic.
The fact that bond yields were not lower today suggests the selling wasn’t driven by macro catalysts such as COVID or stimulus negotiations, and that there wasn’t a reach for safe-haven assets. That’s something we’ll want to watch for. I ended last night’s post with, “It’s no time to be complacent and that’s exactly what mass sentiment indicates, complacency at extreme levels.”
I’d lean toward saying that what we saw today was a break in the hyper-speculative, euphoric fervor among investors that has pushed valuations to historic record levels, as well as pushing investor sentiment to extreme giddiness. Tesla (TSLA -6.99%) tends to be a good bellwether for observing speculative behaviour. I think yesterday’s relative price strength despite the new share offering was a sign of speculative froth, and today’s weakness (TSLA) a sign of that frothy behaviour breaking. Change in character.
A day is not a trend, so lets just stick with calling it a change in character. If safe haven assets such as bonds or the Japanese Yen start seeing stronger demand, then we’re looking at something more serious. From the way the Dollar-Yen has been trading the last 4 weeks, I’ve been expecting something more serious anyway.
Overnight
S&P futures are flat in a pretty textbook consolidation following the afternoon’s losses.
 S&P futures (1m) 3C confirmed all the way down and did not positively diverge at session lows (local support), rather prices put in a weak bounce, that’s the essence of a consolidation (bearish in this case). The edge index futures have is local support (i.e. Dow $30k) in the area.
One of the notable changes before the open this morning was VIX futures firming up.
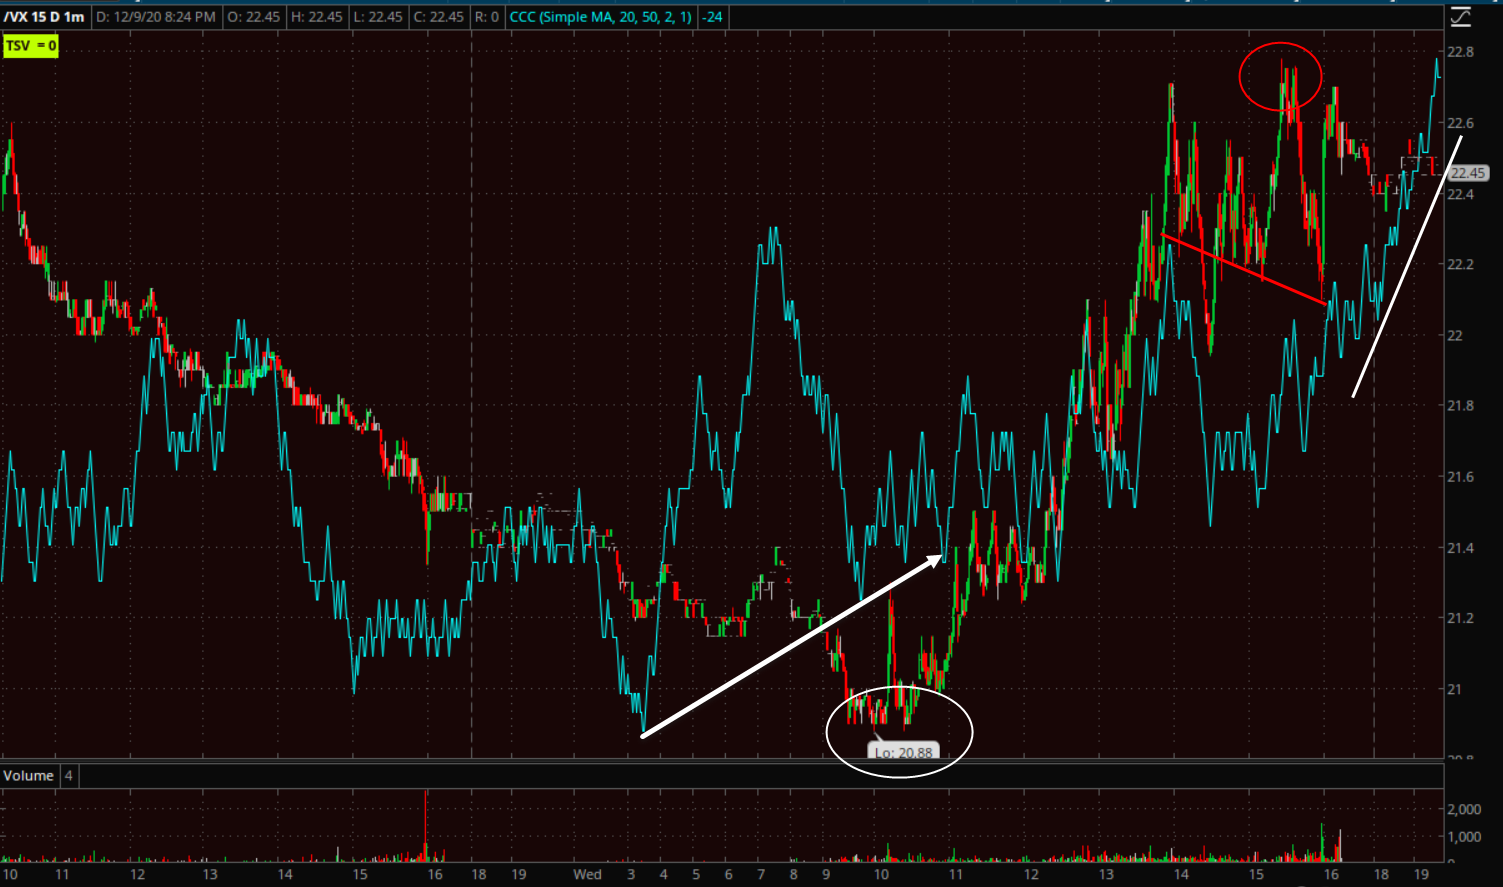 VIX futures (1m) positive divergence into overnight and pre-market lows (white arrow). 3C was slightly weak at session highs (red trend line) as the averages came down to local support, but tonight 3C is pushing higher (white trend line).
WTI crude is up +0.5%
Treasury futures are a little more forward leaning (defensive) near the day’s high.
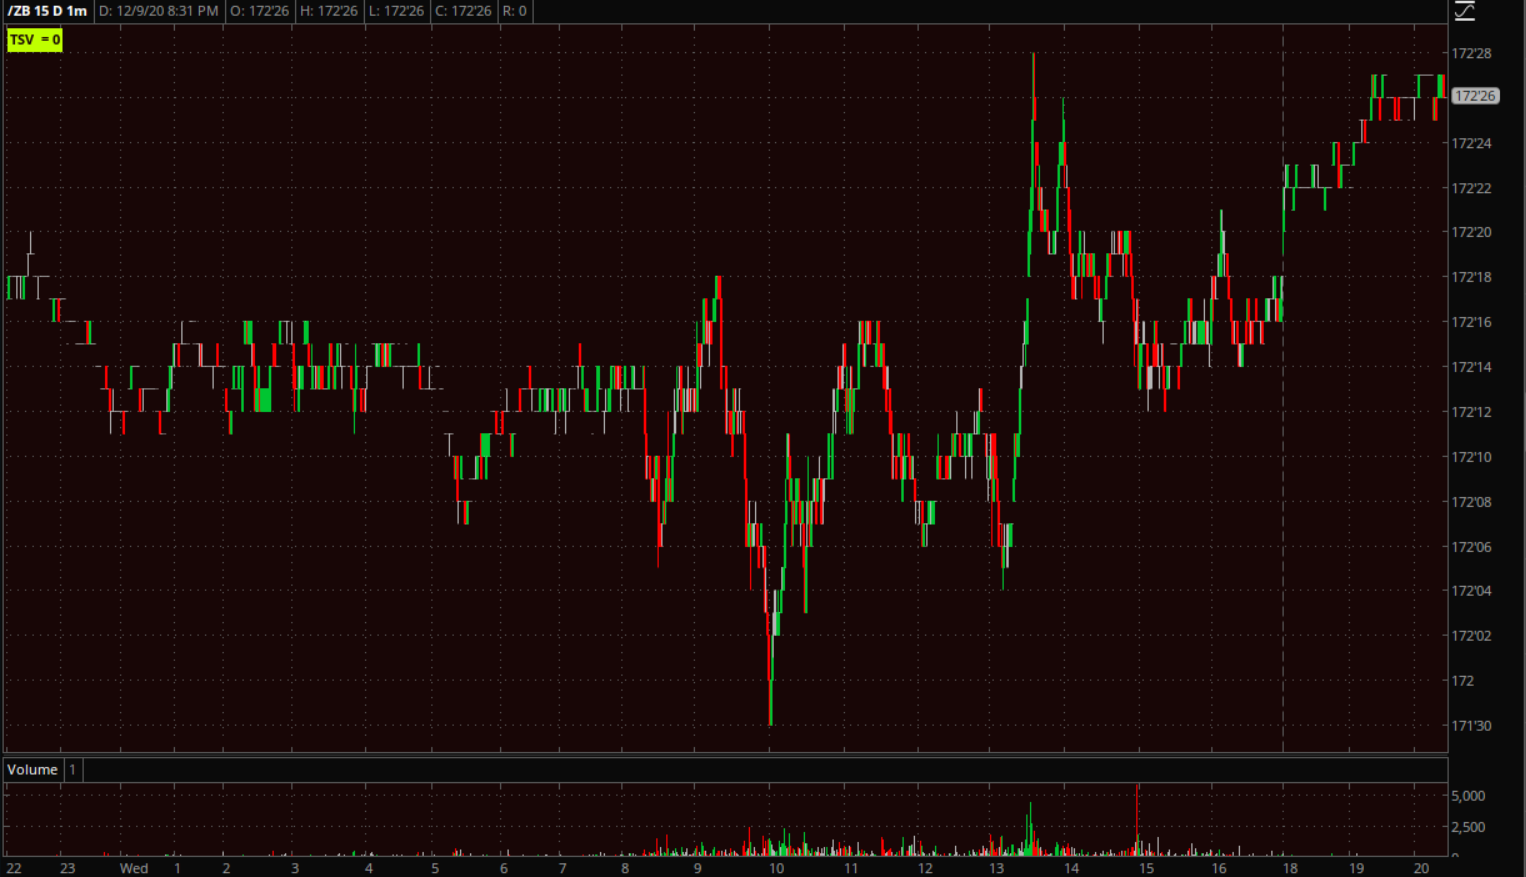 30-year UST futures (1m) -If we see bonds bid, then I’d be more concerned about equities in the near term.
The other safe-haven to watch is the Japanese Yen. The chart isn’t very interesting tonight, but USD/JPY continues trading near the low end of its flag consolidation.
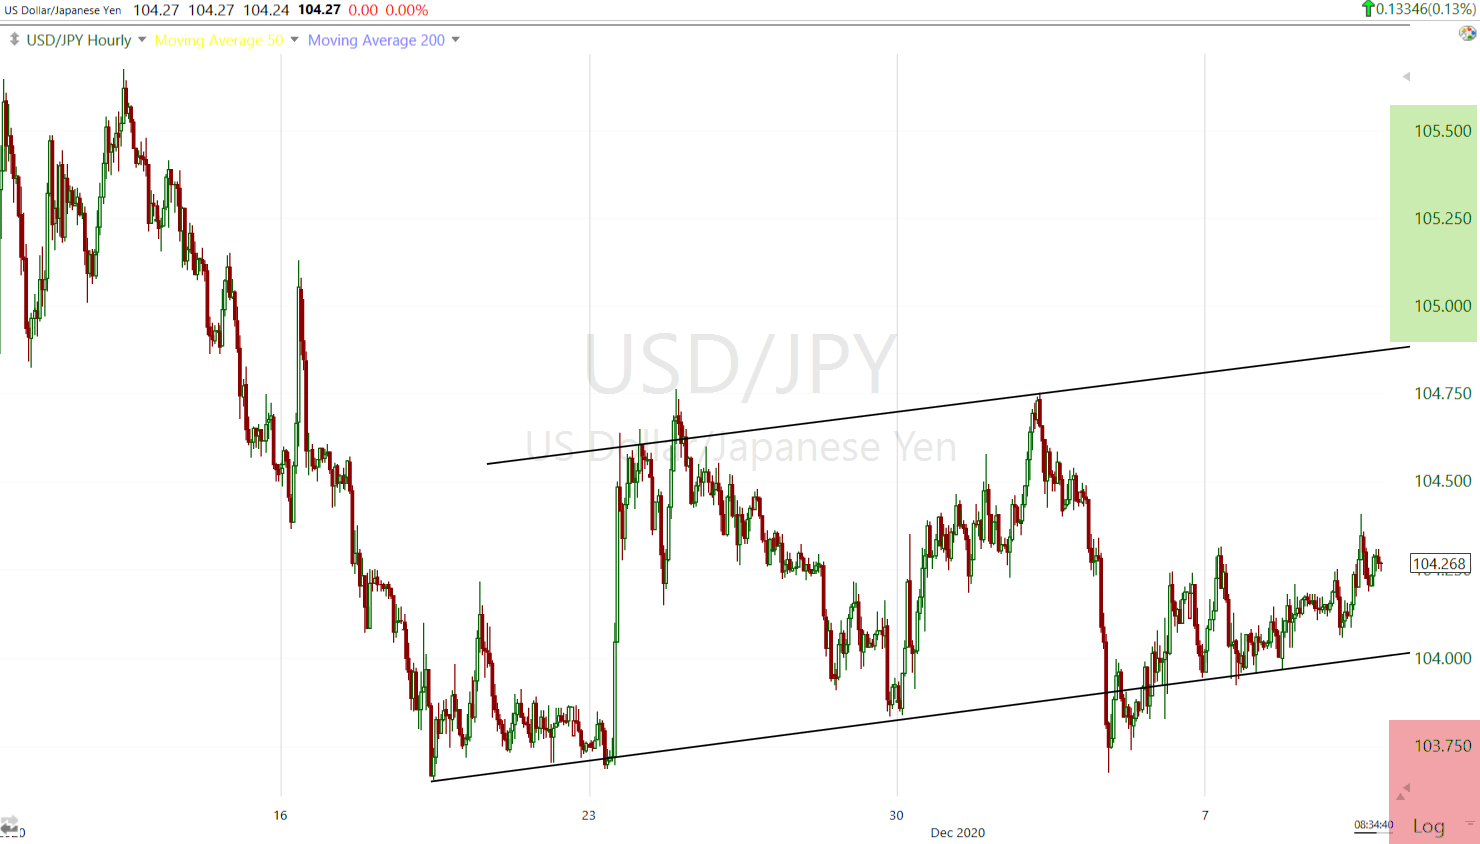
USD/JPY (60m) into or below the red zone I view as risk-off for equities, into or above the green zone is risk-on.
Tomorrow investors will receive the weekly Initial and Continuing Claims report, the Consumer Price Index for November, and the Treasury Budget for November on Thursday. The FDA meets to discuss the vaccine made by Pfizer/BioNTech on Thursday.
Later Thursday comes the European Central Bank policy decision and a press briefing from Christine Lagarde. Economists widely expect the central bank to increase and extend its pandemic bond-buying program.