Daily Stock Market Wrap for Feb 22, 2022
The holiday shortened week has already gotten off to a volatile start, but there are some signs of stability as the market finds some certainty in geopolitical tensions, which are not only high, but higher than they were this time last week. Today’s trading narrative was catalyzed by Russia’s decision to recognize the independence of Ukraine’s Donetsk and Luhansk regions and send “peacekeeping” troops to the oblasts, which ironically gave the market some certainty and lifted index futures off their overnight lows shortly after Putin’s speech.
While U.S. markets didn’t open until today due to a holiday yesterday, S&P futures show the nauseating journey down around -2.2% in the overnight session, to trade near unchanged in premarket. 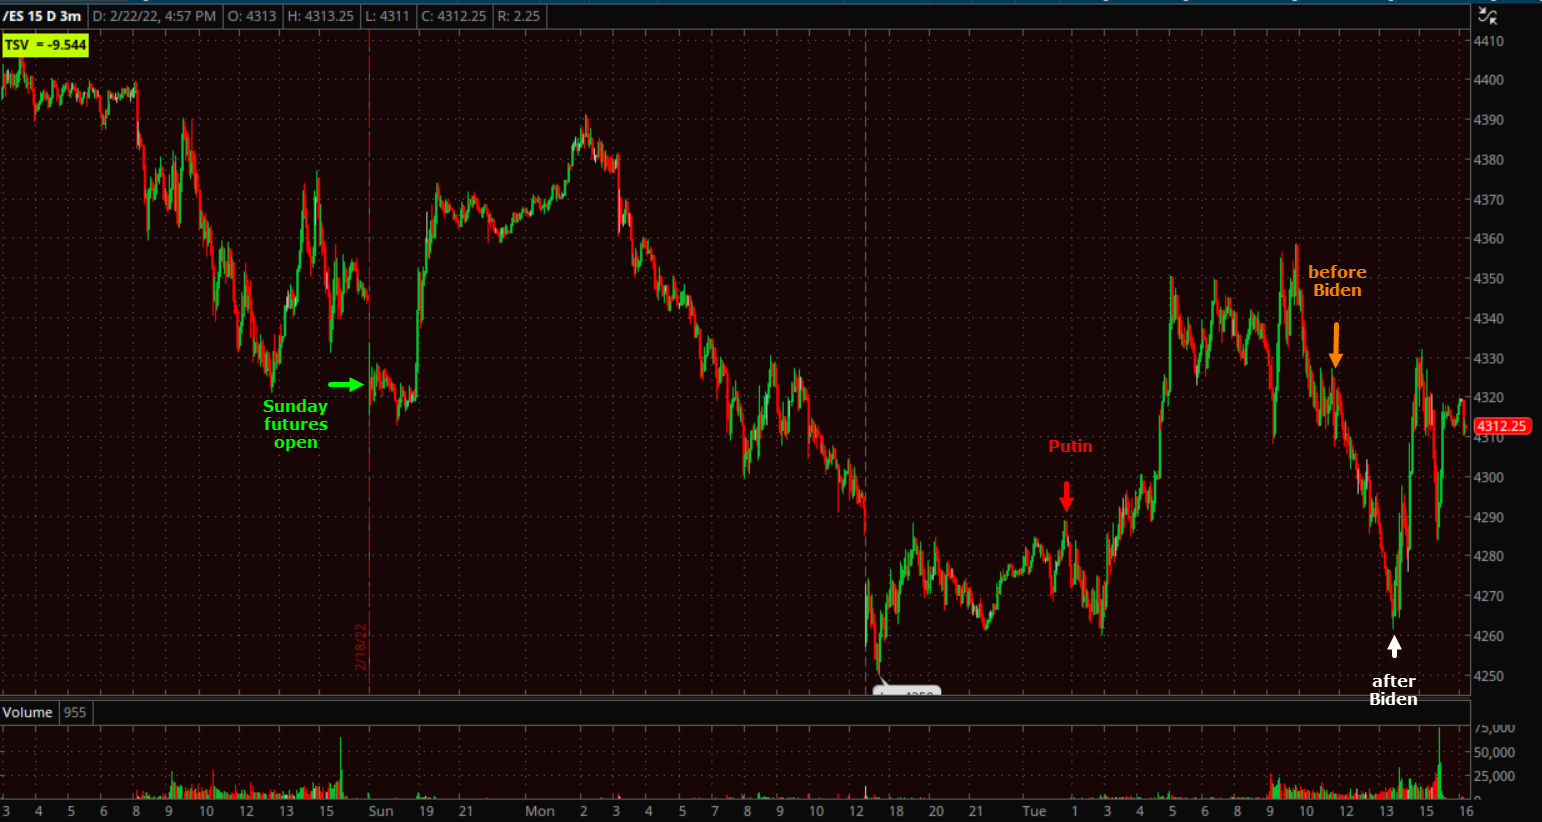 S&P futures (3m) Futures sank on Putin’s speech, but around the European open the S&P rallied and retraced nearly all of a -2.2% loss by the U.S. cash open. Then futures sank again ahead of Biden’s address and surrounding uncertainty. During and after Biden’s address the S&P 500 jumped nearly 70 points off its low in the course of an hour, but sellers came back in near the close on breaking headlines of Ukraine’s President, Zelensky, calling up reservists and Biden moving infantry, tanks, and F-35s to NATO’s eastern flank.
The U.S., UK, and EU announced initial sanctions, and Germany halted the approval process for the Nord Stream 2 pipeline from Russia.
President Biden announced new sanctions on Russia, including sanctions on sovereign debt, two large financial institutions (but not the largest Russian banks), and Russian elites and family members. President Biden threatened additional sanctions if Russia escalates the situation. No major Russian banks were targeted, Putin was not targeted for sanctions, there were no energy sanction beyond Nord Stream II, and no SWIFT payment system threats/action. Biden emphasized that the US is reacting with only “defensive moves” and saying that “we have no intention of fighting Russia.”
Averages
The intraday action was just as volatile with the S&P opening down, getting modestly green this morning, then falling almost -1.9 ahead of Biden’s press conference this afternoon. After the press conference the averages moved off the lows, but still lost at least 1%.
S&P-500 ⇩ -1.01 %
NASDAQ ⇩ -0.99 %
DOW JONES ⇩ -1.41 %
RUSSELL 2000 ⇩ -1.45 %
The S&P 500 closed -10.3% off its record closing high, as well at its lowest closing level since October 4th, but it did not trade as low as January 24th’s intraday capitulation lows.
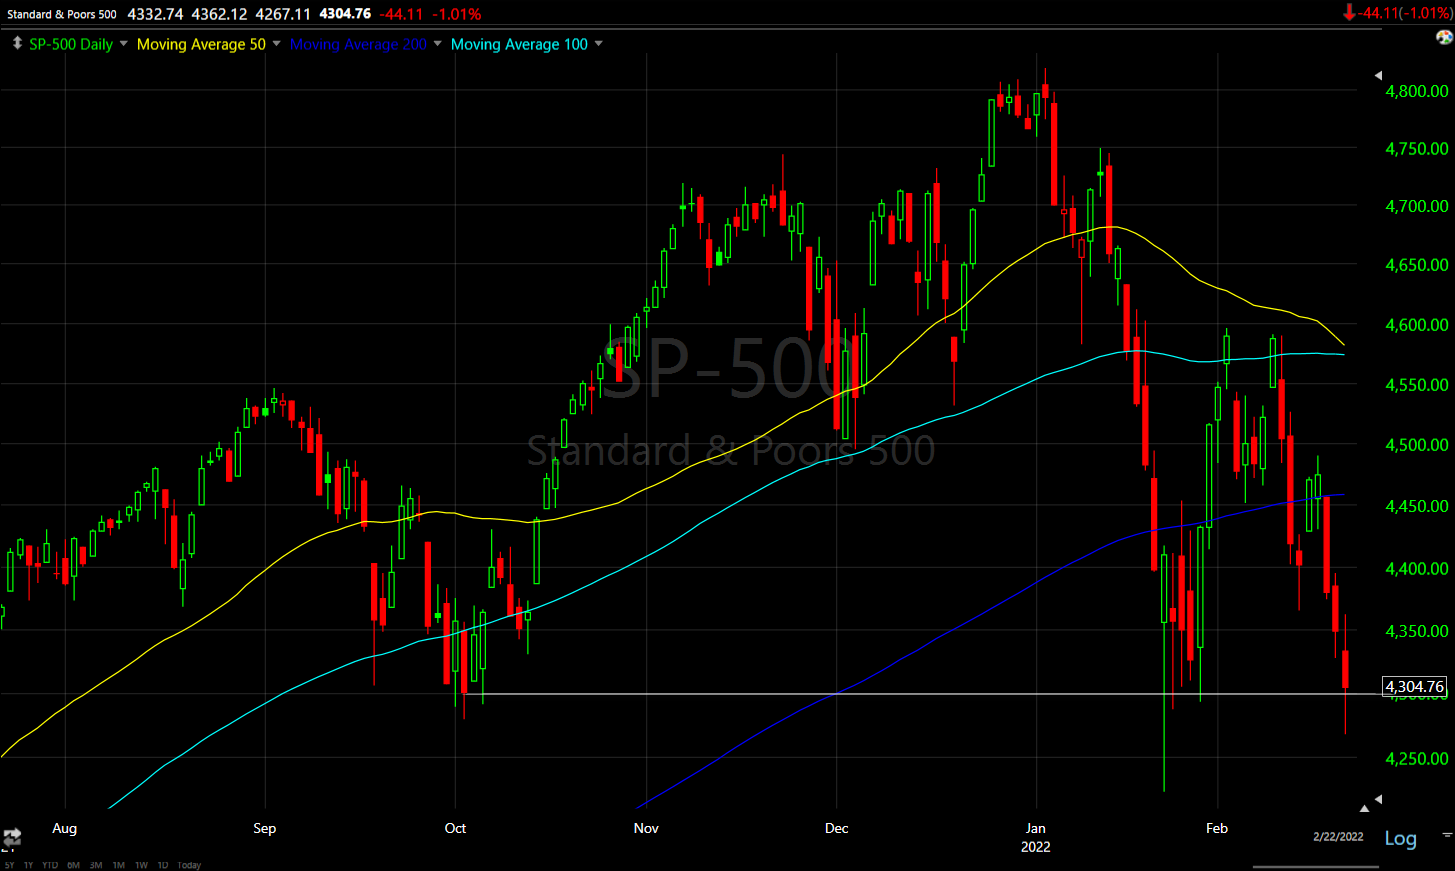 SP-500 (daily)
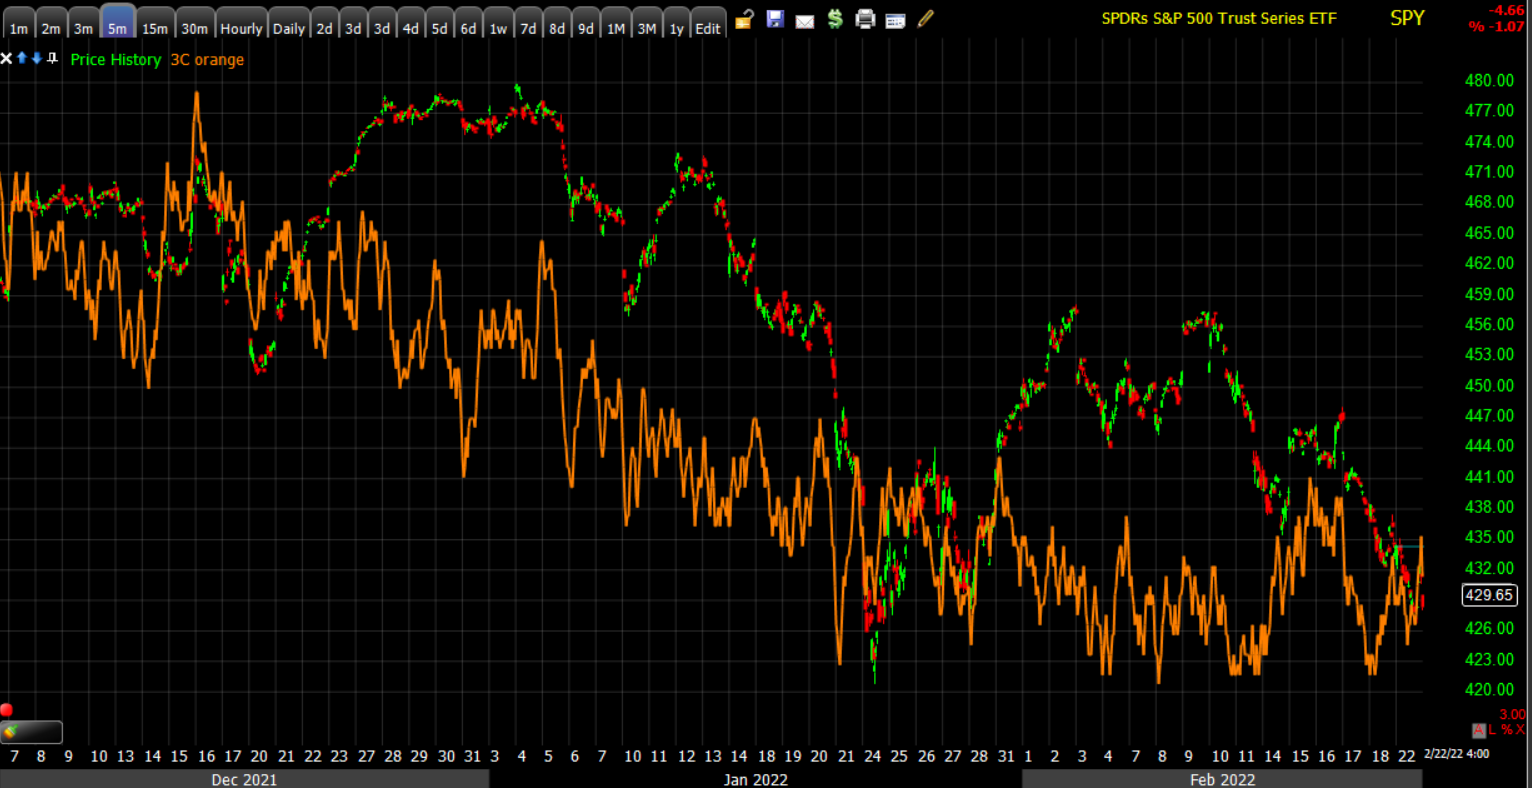
 SPY (1m) the short-term 3C chart is in line mostly with price action which reflects the market reacting instantly to headlines.
There is still a relative positive divergence from early February, but it has been lessened over the last week, just as the sub-intermediate trend 5 min chart.
 SPY (5m) 3C started to trade above its own down trend last week, but by mid-week things turned south again.
NASDAQ’s daily chart is of some interest…
 NASDAQ-100 (daily) testing the January 24th capitulation lows and holding with a small bodied Star candlestick representing a loss of recent downside momentum from the last week and potentially some support at the January capitulation lows.
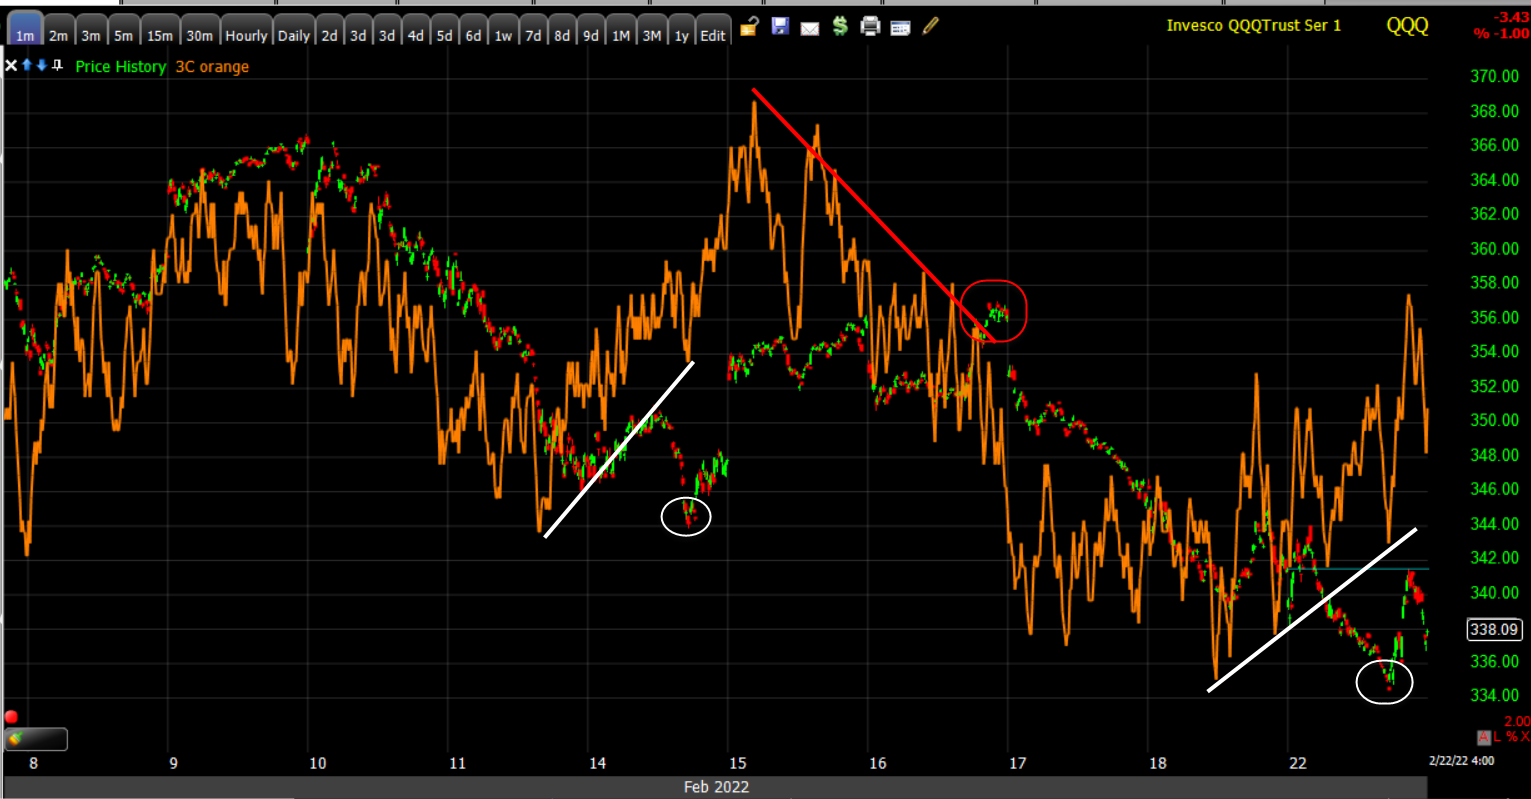
Like the other averages, QQQ’s short term 3C chart has been very volatile, coming into last week looking fairly strong, but turning down sharply mid-week. Once again there’s some improvement as price successfully tested the Jan. low.
 QQQ (1m)
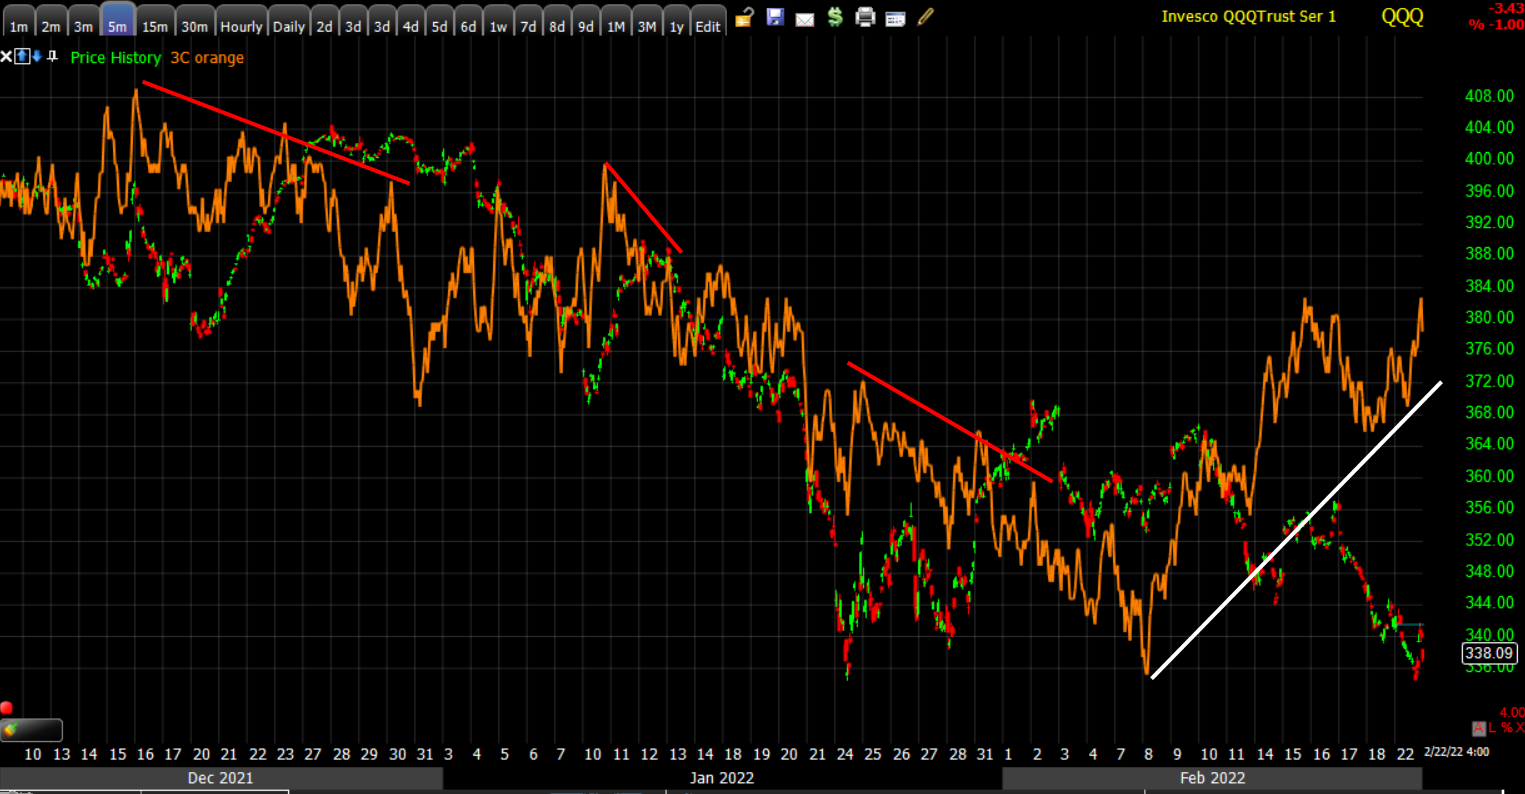
QQQ (5m) this is the first, or most substantial positive divergence for QQQ since at least early December.
The Dow/DIA’s short-term 3C chart has shown some modest positively divergent activity, whereas it came into las tweek as one of the ugliest short term 3C charts….
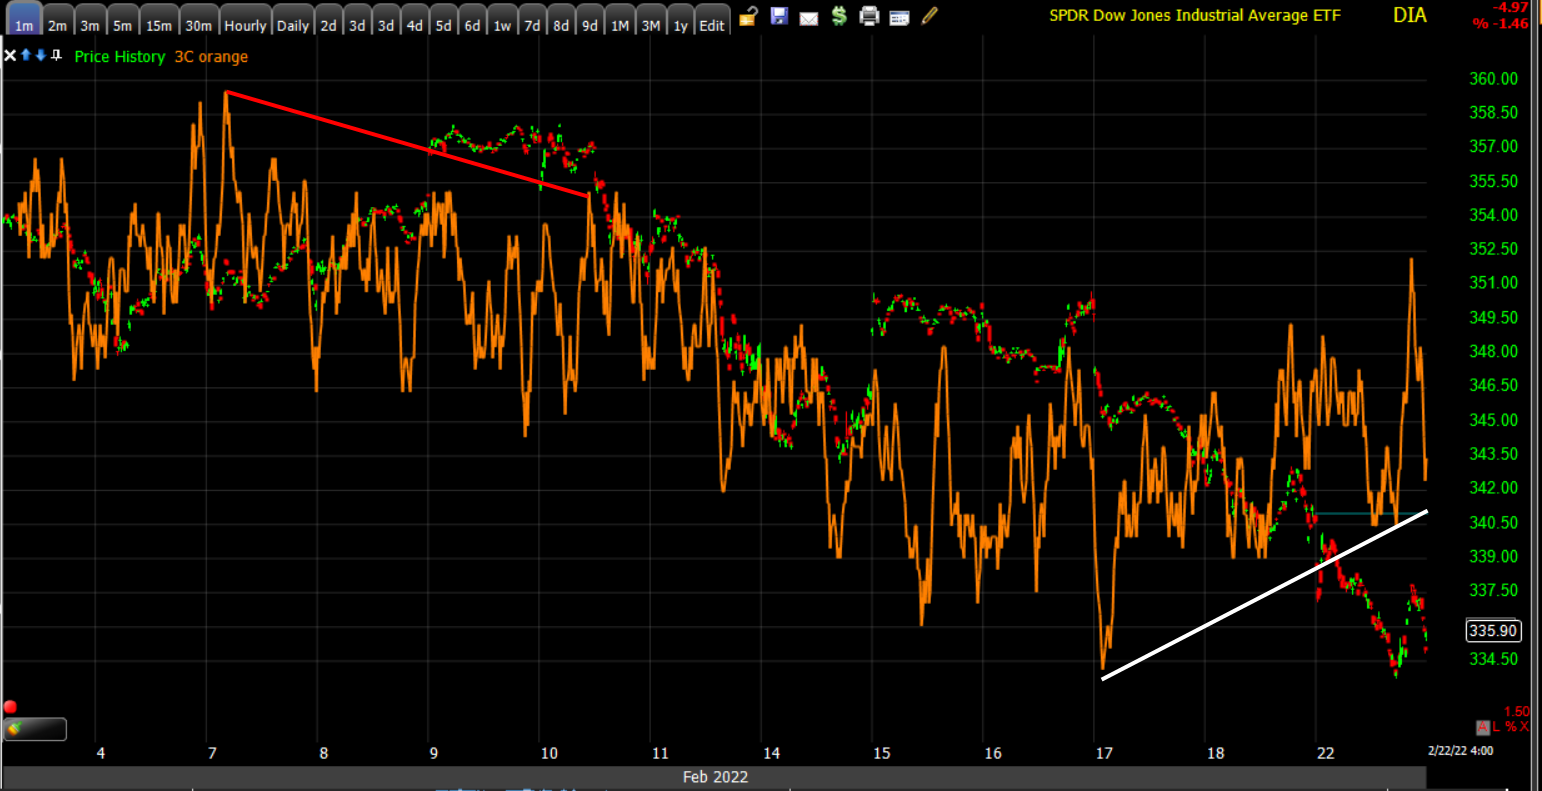 DIA (1m) – the improvement is still modest in the fact of the price trend and it has not migrated to the stronger sub-intermediate 5 min chart yet.
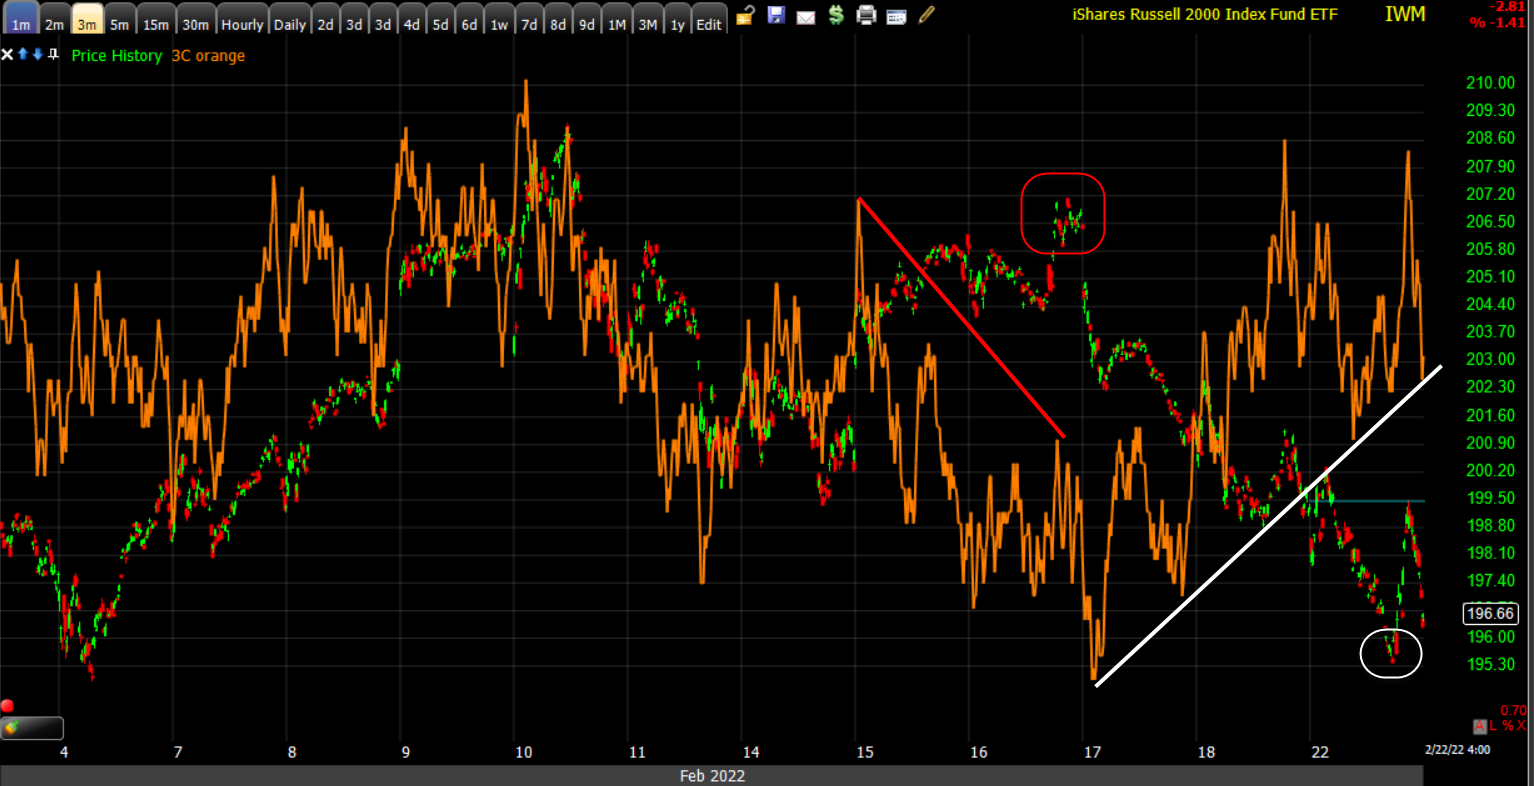 IWM’s (1m) short term chart has been just as volatile as QQQ’s with a quick negative tone shift the middle of last week, but looks the most impressive on a short-term basis here as price tests the area of early February lows (4th).
I’m not seeing much of interest in leveraged long index ETF’s on 3C charts, but as mentioned Friday, leveraged short ETFs seem to be taking profits and exiting positions.
VIX displayed some early relative strength, but faded in the afternoon ending with a +3.8% gain after being up over 12%. Volatility’s term structure dipped into backwardation today indicating traders paying a premium for more immediate downside risk protection, but this can also be a sign of an oversold market or an extreme in sentiment (fear).
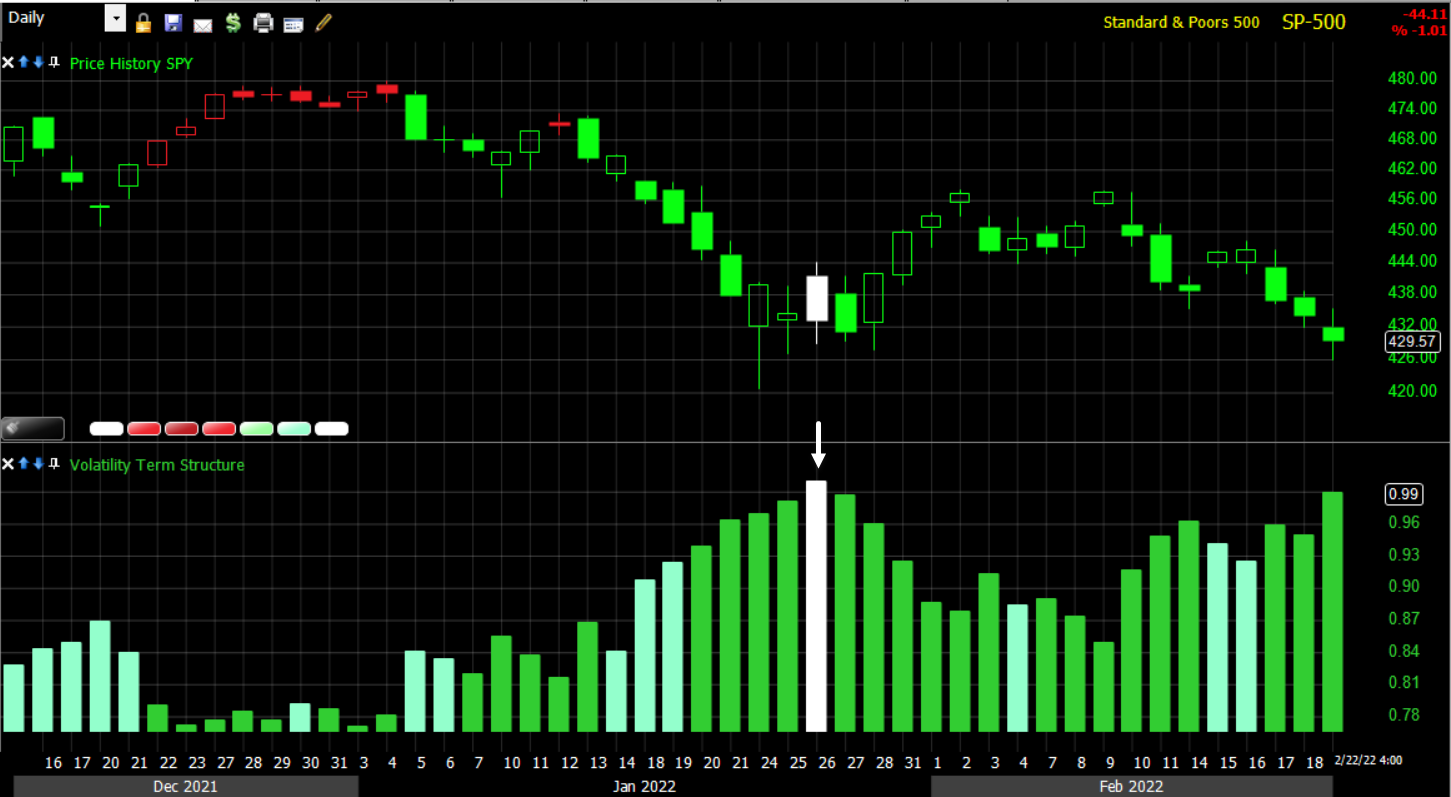 SP-500 (daily) and volatility’s term structure which went into and closed in backwardation (white) just after the January 24th seller’s capitulation low.
The Absolute Breadth Index ended just shy of 16 today, but the sub-14 print is a signal that’s valid over the next month, right into the March FOMC.
S&P sectors
All 11 S&P sectors ended the day lower with relative weakness (oddly) in Materials and Energy, but notable weakness in Consumer Discretionary, largely due a -9% decline in Home Depot (-8.9%) following its conservative FY22 sales guidance. The sectors that lost the least were defensive including Utilities, Real Estate and Health Care.
There was no strong sector bias outside of the modest relative strength of defensive sectors. Both Russell 1000 Growth and Value indices closed down the exact same (-1.33%).
Materials ⇩ -1.42 %
Energy ⇩ -1.62 %
Financials ⇩ -0.51 %
Industrial ⇩ -0.97 %
Technology ⇩ -0.92 %
Consumer Staples ⇩ -0.78 %
Utilities ⇩ -0.11 %
Health Care ⇩ -0.25 %
Consumer Discretionary ⇩ -2.92 %
Real Estate ⇩ -0.27 %
Communications ⇩ -1.02 %
Internals
NYSE Decliners (2530) outpaced Advancers by more than 3-to-1 (NASDAQ decliners just shy of 3-to-1 margin) on Volume of 1.1 bln shares.
The Dominant price/volume relationship came in at Close Down/Volume Up (necessary for 1-day oversold). Taken with all 11 sectors down and decliners more than 2-to-1 over advancers, internals are 1-day oversold.
Breadth oscillators are deeper oversold. The NYSE 13 week new high/new low ratio dove deeper into oversold territory with a low in the 3’s and a close in the 7’s (Jan 24th it was below 1 at extreme oversold).
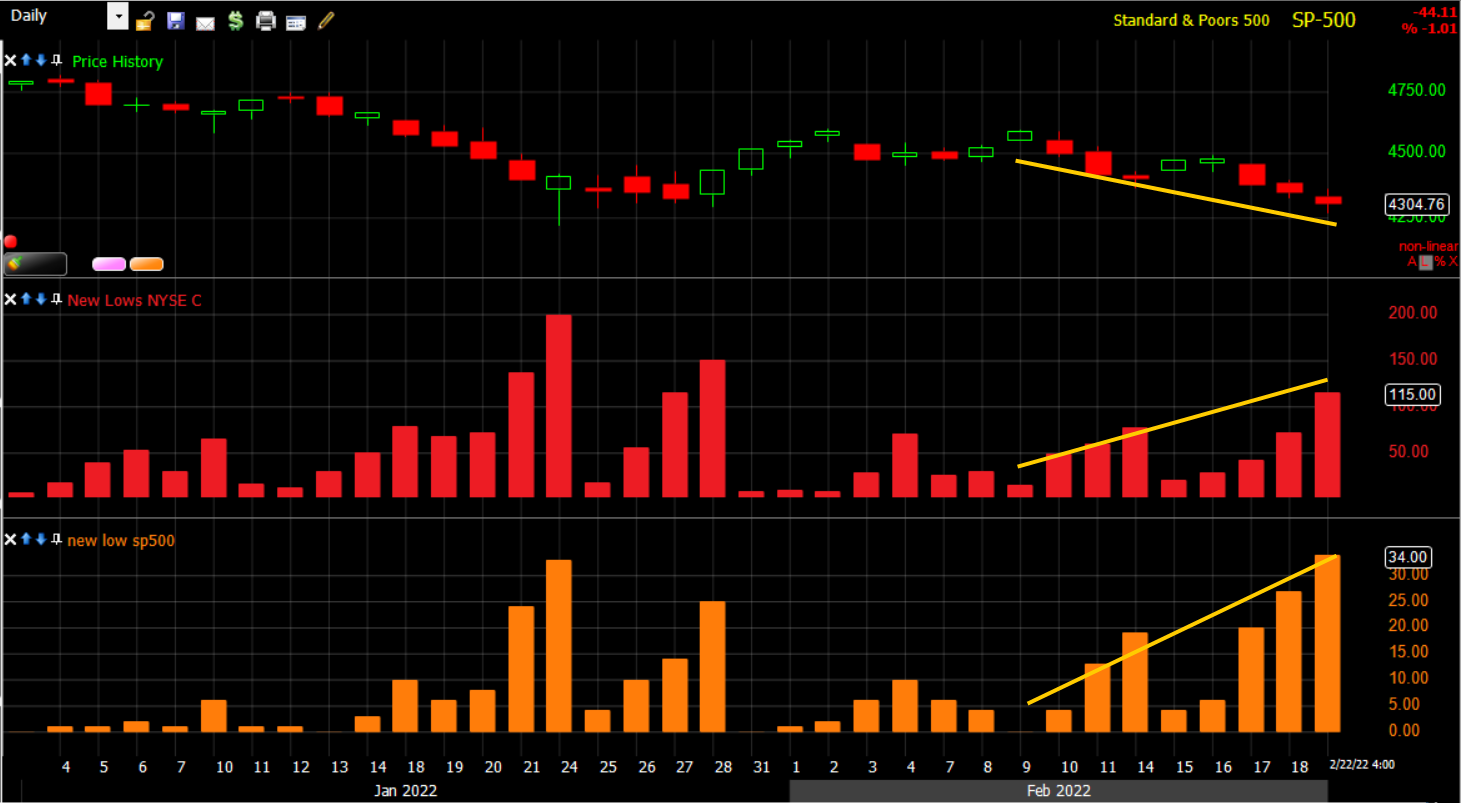 SP-500 and NYSE (red) and S&P-500 (orange) new 52 week lows increasing as should normally be expected.
Treasuries
Concerns about the Fed’s tightening path are re-emerging into the mix, evidenced by the 2-year yield trading higher by eight basis points to 1.55%, which signals at least six rate hikes. On a related note, Fed Governor Bowman (FOMC voter) said she supports a March rate hike in addition to further rate increases in the coming months if the economy evolves as she expects.
Accordingly, the market, which had been bringing down rate hike expectations since Russia/Ukraine tensions grabbed the spotlight, priced in an even more hawkish Fed today with December odds of 7 hikes back up at around 40%. March is now pricing in a 40% chance of a 50 bps hike (from 20% Friday).

Yet the 10-year Treasury, which has been one of the geopolitical safe-haven assets, actually increased two basis points to 1.93% as safe-haven hedges were unwound following Putin’s speech, not because tensions were alleviated or diminished, but because the market had a clearer understanding or more certainty (the old market adage, “When the missiles fly, it’s time to buy”).
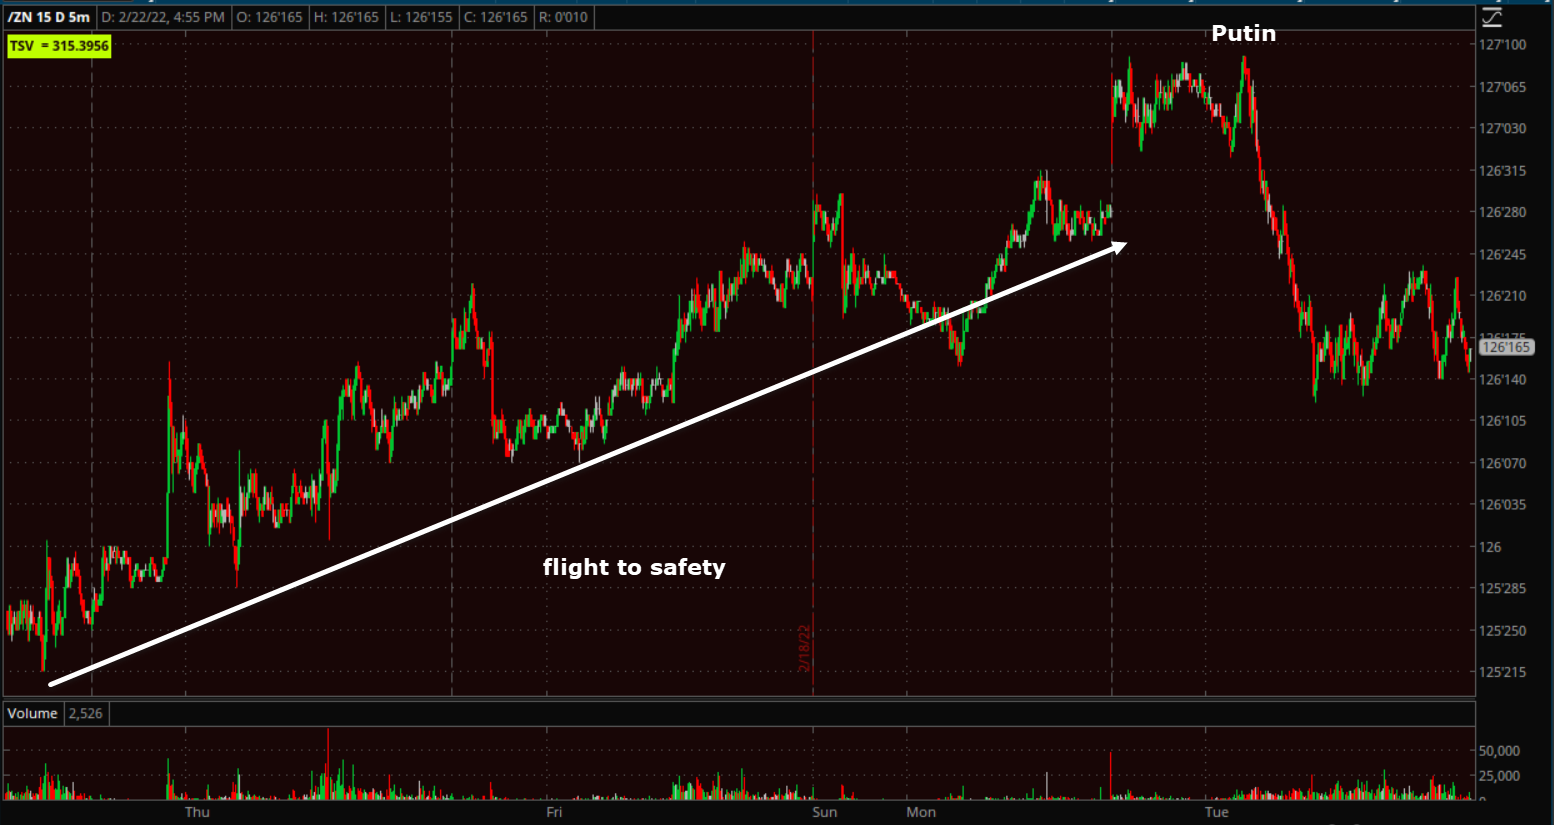
 10-year Treasury futures (1m) see the peak of safe-haven buying related to Russia/Ukraine overnight just as Putin spoke, then saw unwinding of the safe-haven trade from there on out with just a modest bump higher before the uncertainty of Biden’s address, then came down again after hearing what Biden had to say.
Some more context…
 10-year Treasury futures (5m)
Y Credit continues to show modest relative strength vs.the S&P, but unlike last week, today is was not due to lower yields.
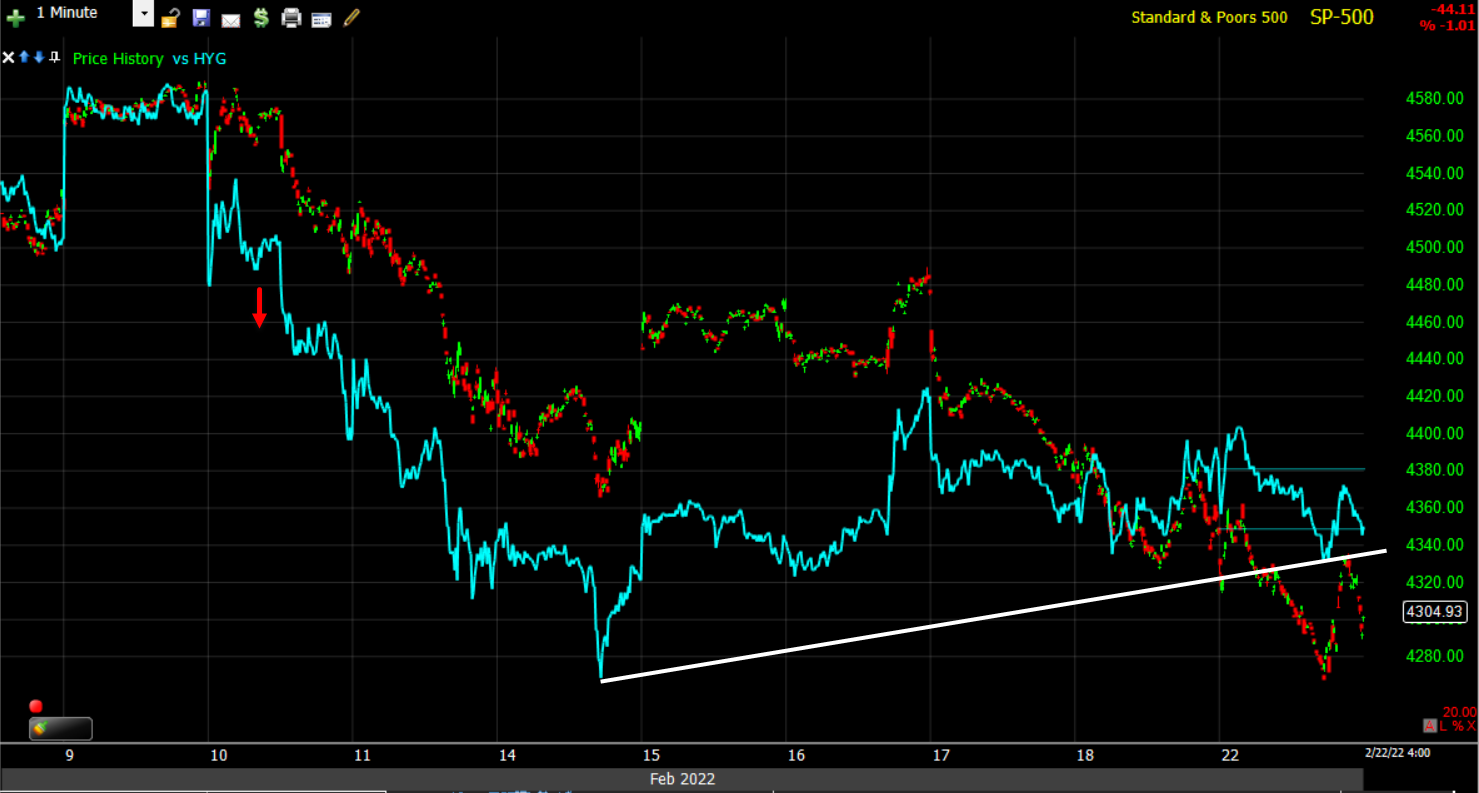 SP-500 (1m) and HYG. Still HYG’s price action is that of a bearish flag.
Currencies and Commodities
The U.S. Dollar Index was little changed at 96.07.
Like other safe-haven assets, the Japanese Yen (futures) traded higher to start the week, then faded as safe-haven hedges were less in demand or being unwound to some degree.
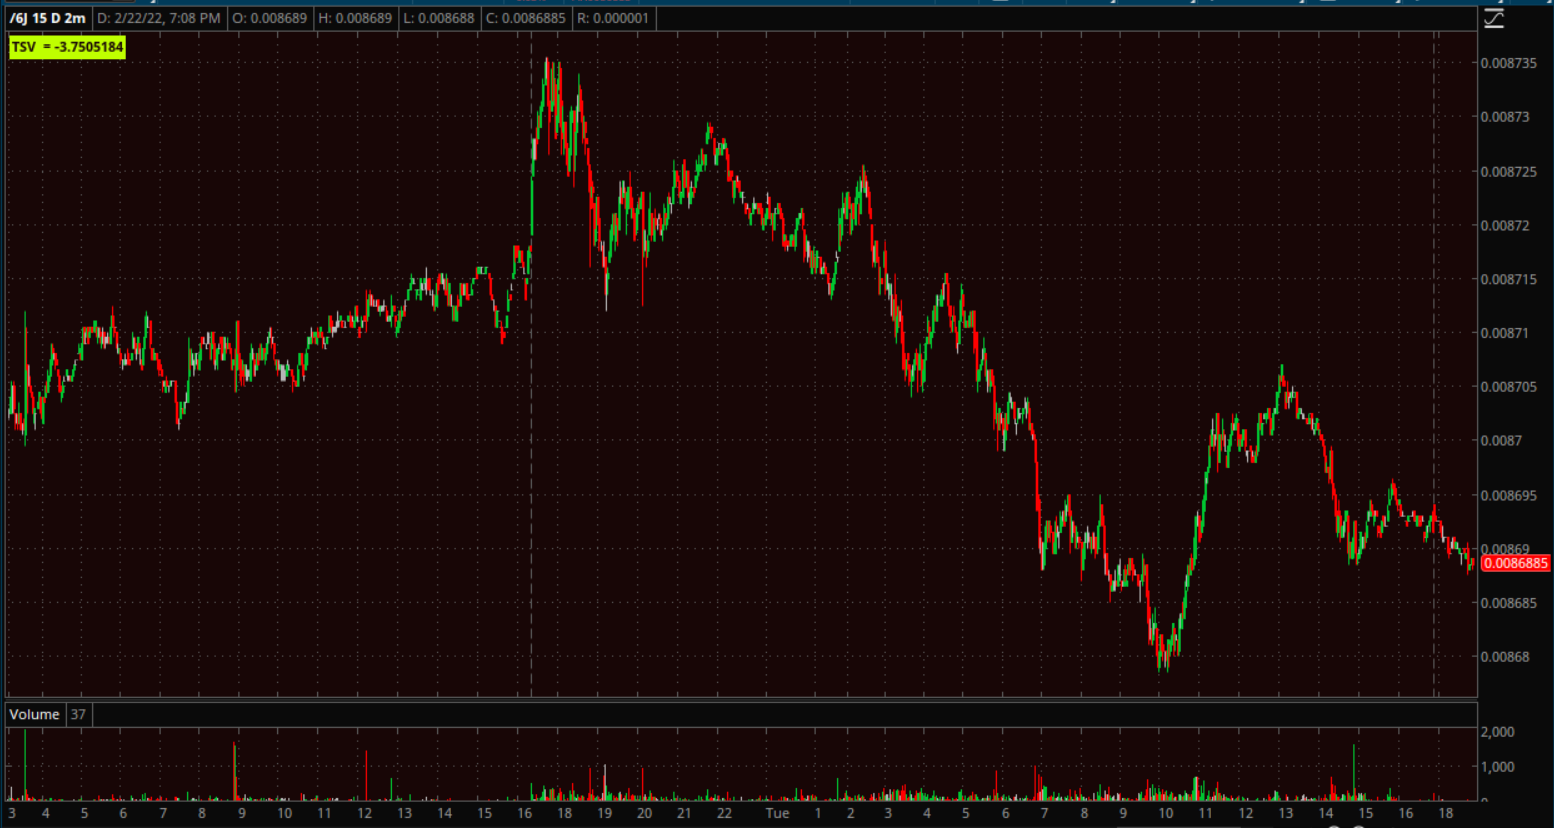 Yen futures (2m) – there was a little uptick ahead of the uncertainty of Biden’s address, and then prices faded after.
The Russian ruble has been falling vs. the Dollar for the last 3 weeks. The Russian ruble spiked upon Biden’s address as it was seen the actions taken were seen as pretty much inconsequential.

In addition, Russia’s MOEX Index was up +5.9% in late trading after Biden spoke. MOEX is down around 30% from its highs, the biggest drawdown since 2014 and Russia’s annexation of Crimea from Ukraine.
AUD/USD is still above its H&S neckline and slightly supportive as a market signal.
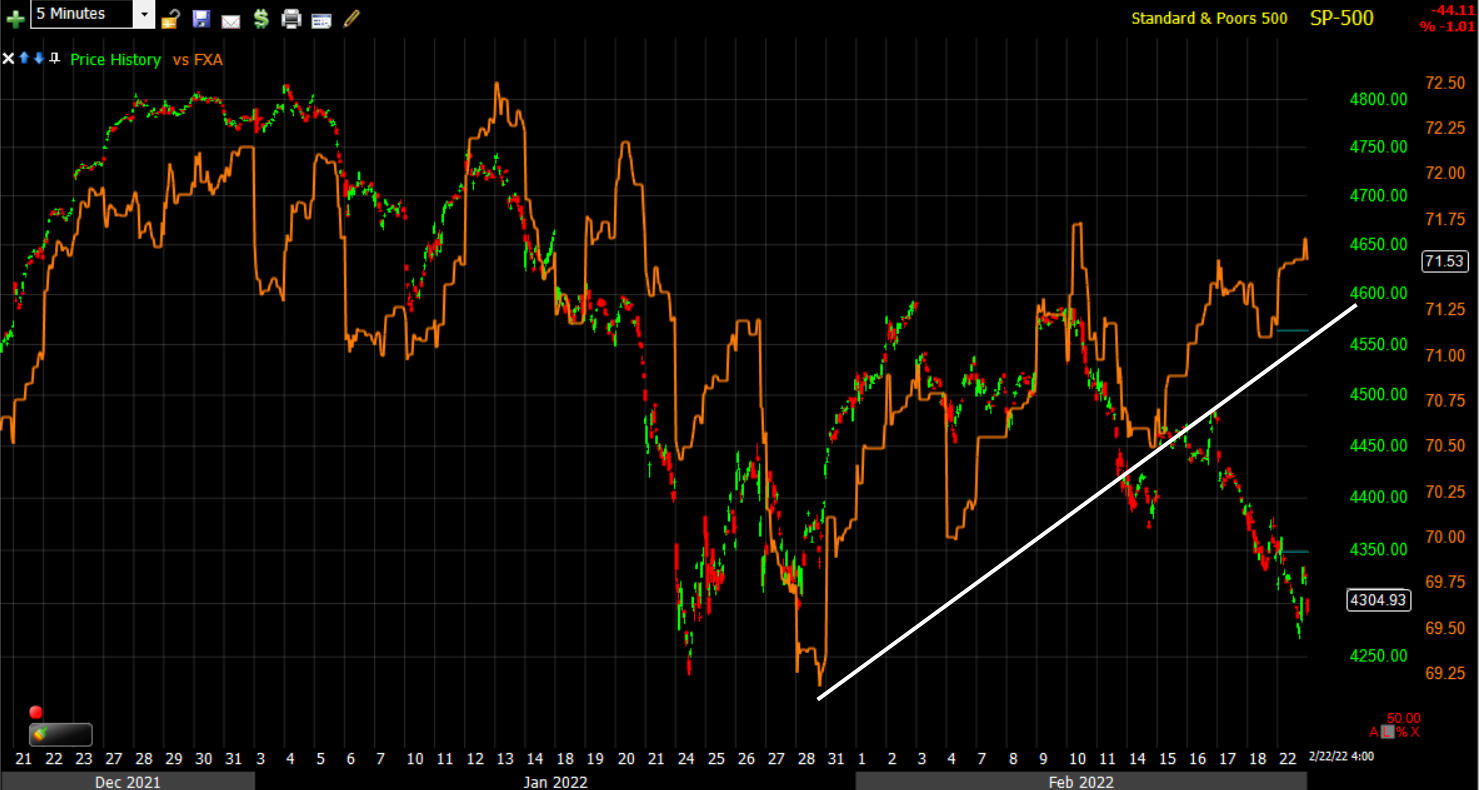
SP-500 (5m) and proxy for the Australian Dollar (orange).
WTI crude futures ended up +1.2% above $92 per barrel ($92.27), but off the best overnight levels, flirting with $95 per barrel.
Like many other asset classes, crude did the opposite of what you might have expected last week with geopolitical developments. Initially oil pushed higher on Putin’s speech and war premium priced in, but then faded after Putin’s speech and the rest of the day (as did treasuries and other safe havens, while stocks came off the worst levels of the week).
 WTI Crude (1m)
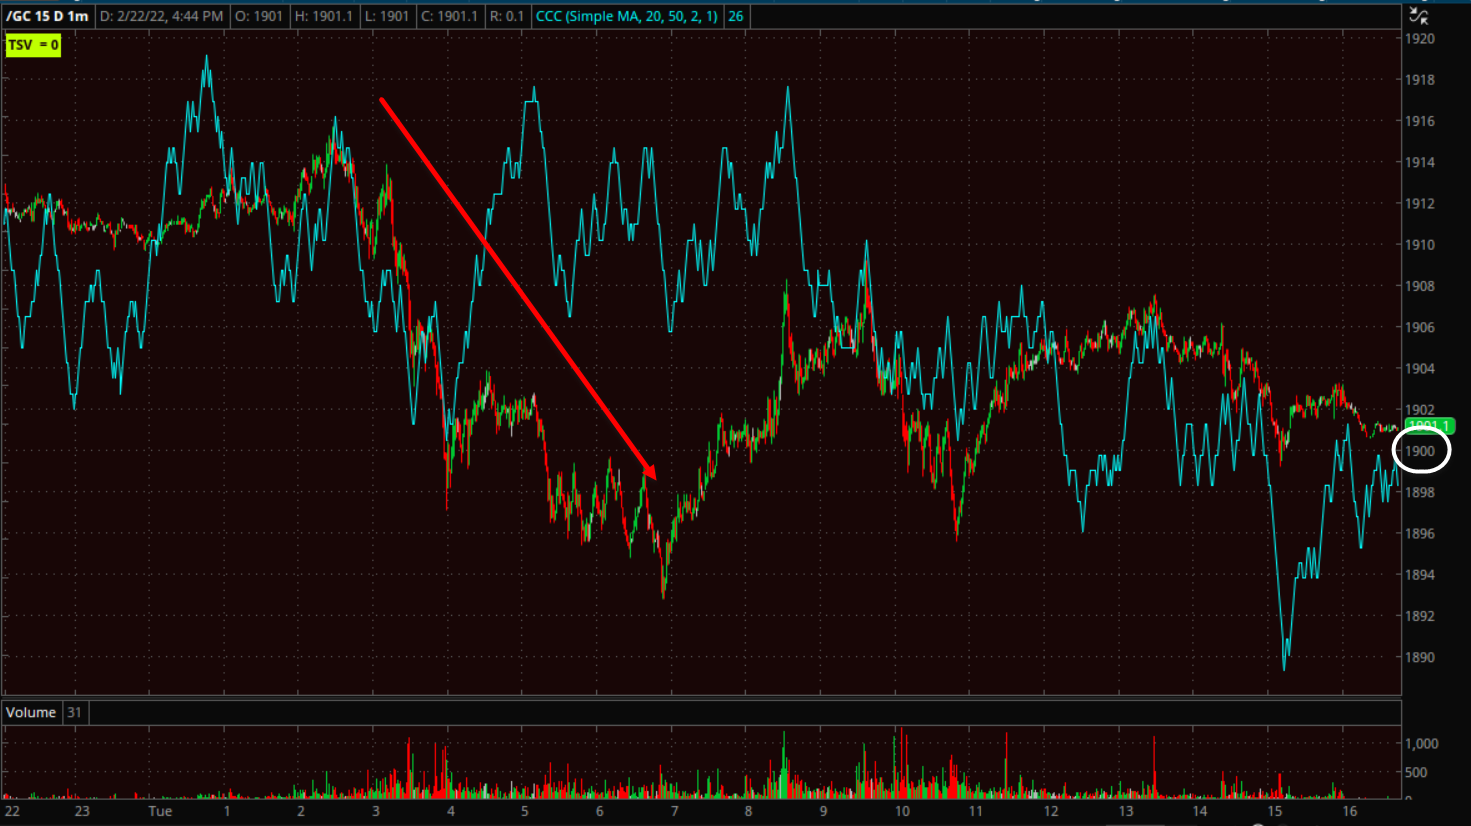
Gold futures settled higher by +0.4% to $1,907.40/oz, slipping off earlier highs with other safe-haven assets overnight.
 Gold futures (1m)
Gold is doing exactly as expected and consolidating around $1900 after meeting the upside target last week.
 Gold futures (30m) and 3C still looks much better than it has in months and I’m more optimistic about gold than I have been in more than a year.
Bitcoin has been a decent proxy for risk sentiment. It plunged over the weekend with chaotic geopolitical events and news, but like many risk assets, rebounded overnight and gained just over 2% today.
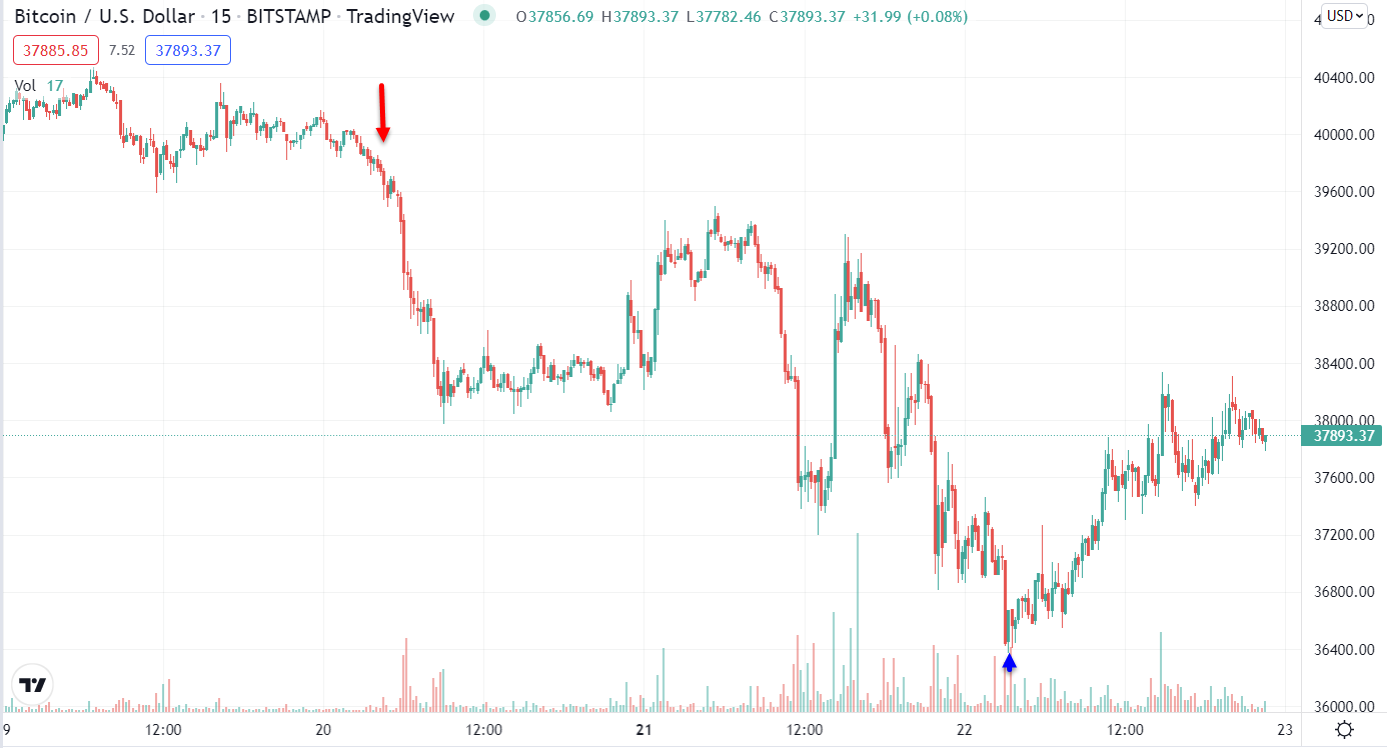 BTC/USD (15m) dropping over the weekend, and rebounding (blue arrow)
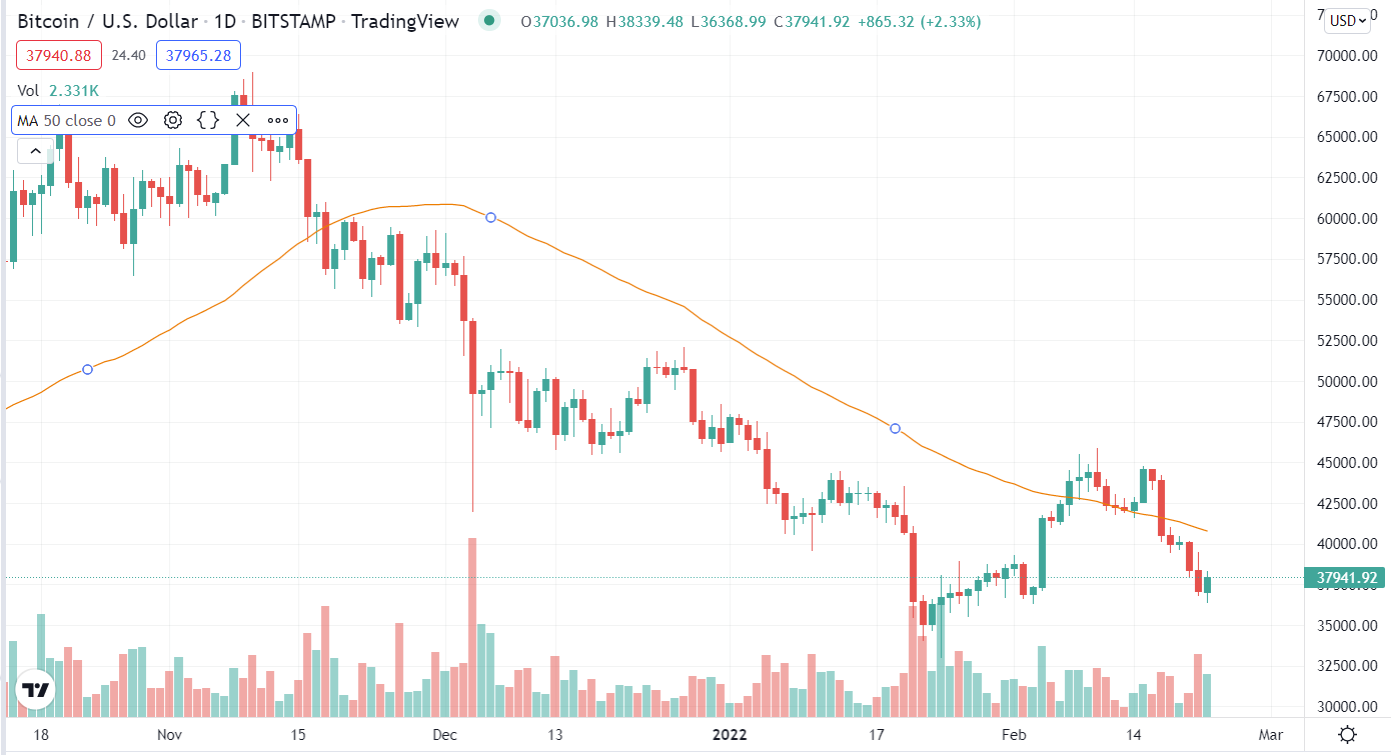 BTC/USD (daily) but it’s still below the 50-day sma.
Summary
A lot has happened since Friday and if you just read the headlines you might reasonably expect stocks to be down sharply and safe havens like gold, treasuries and the Japanese Yen to be strongly bid. Instead we got our first glimpse of the market adage, “When the missiles fly, it’s time to buy”, which relates to uncertainty being resolved (good, bad or indifferent). It’s still a tense, actually tenser set of circumstances, but most safe-havens acted accordingly to this concept to some degree today, while stocks still struggle.
As mentioned in the Afternoon Update, I see some potential on the long side for a relief rally, but I don’t see the kind of probabilities that would cause me to add to the reasonably sized long S&P exposure I’ve had. If I didn’t have any, I might have considered adding some today. However, as I have been warning the last week or so, I think there’s a narrow window for a relief rally before the market starts to refocus its attention on the Fed and the mid-March FOMC and we can already see signs of that today in rising rate hike odds and higher 2-year yields. Overall I still think this is going to be a tough and rough year for stocks as the Fed tightens policy and the trade that’s most interesting to me is to sell/short into price strength so a relief rally would be welcomed by me.
So far 2022 has been exceptionally weak, but the warning signs had been piling up for months and months, in fact pretty much since Q2 of 2021.
Overnight
S&P futures are up +0.55% near the afternoon highs following Biden’s press conference. NASDAQ-100 futures are up +0.75% and Russell 2000 futures are up +0.8%. None of the 3C charts are really jumping out at me, although VIX futures’ is looking weaker since Biden’s press conference.
WTI Crude futures are down -0.2%. Gold futures are down -0.35% hovering at $1901. bitcoin futures are up +0.7%.
Treasury futures are close to unchanged.
Looking ahead, investors will receive the weekly MBA Mortgage Applications Index on Wednesday.