Daily Stock Market Wrap for Tuesday November 10th, 2020
A major divergence in market performance between value and growth/momentum continues for the second day. Small Caps (+1.85%) outperformed about as much as NASDAQ (-1.75%) underperformed, and S&P which is more diverse, is caught between the two. The rotation between style factors, sectors and stocks is a result of Pfizer’s vaccine announcement Monday.
The rotation to value/cyclicals is not new, but the dispersion between the two has increased since the summer with each episode more and more extreme.
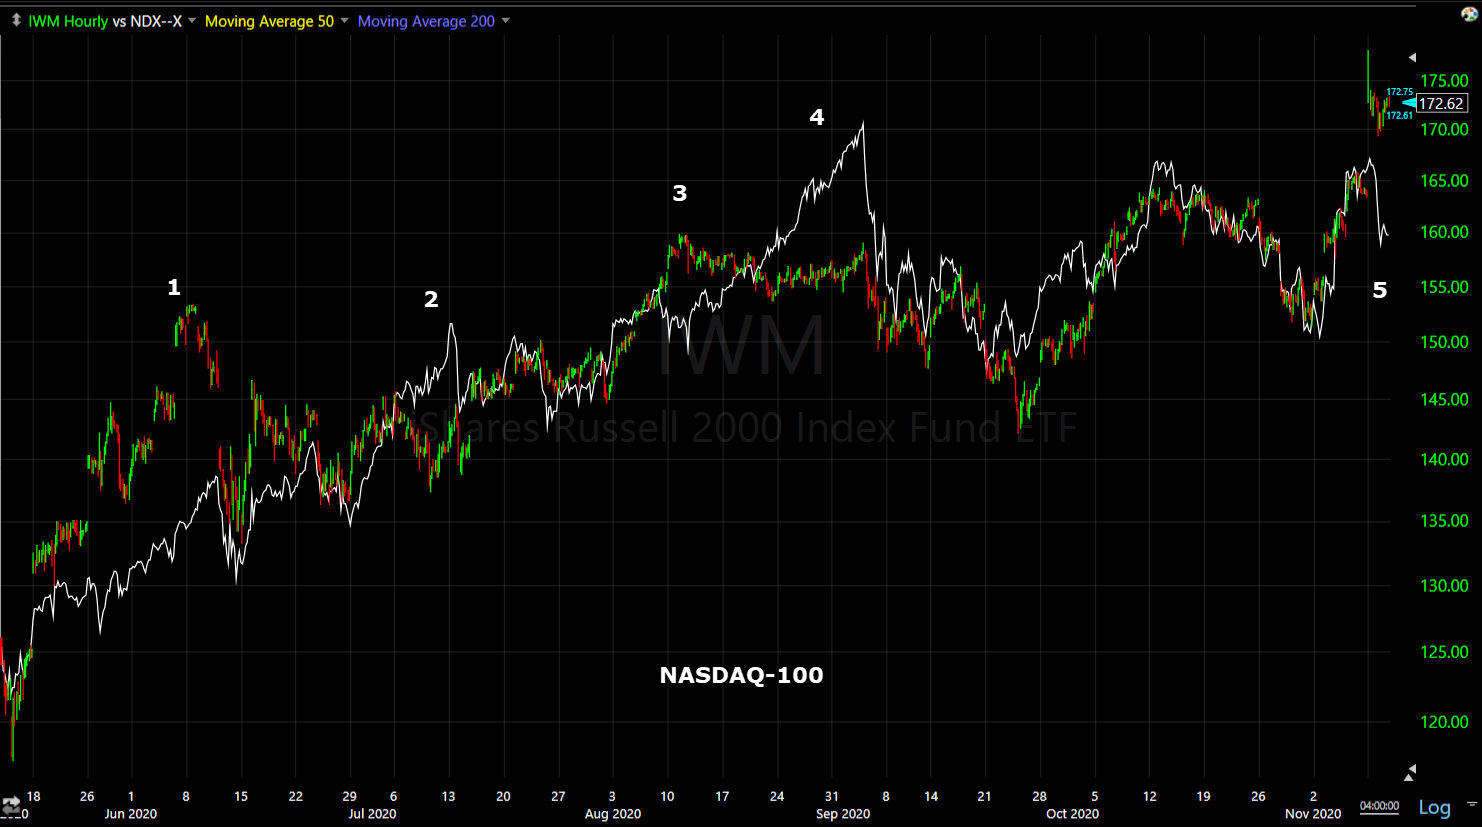 Small Caps (green/red candlesticks 60m) and NASDAQ-100 (white).
- The second week of May to early June Small Caps outperformed NASDAQ amid the first serious rotation attempt this year, but it ended in early June after Payrolls. However, notice that while Small Caps outperform, both averages are moving up.
- After the failed rotation Traders/Investors went back to what they knew worked for the last decade and bid up mega-caps relative to small caps.
- Value/Cyclicals/Small Caps make another attempt to rotate in early August, although this was short lived.
- Once again, after the failed rotation investors went back to the secular growth mega-caps. This is one of the first bad dispersion episodes. Notice at this point Small Caps aren’t really rallying , they’re trading sideways as mega-caps soar.
- This week after the vaccine announcement the dispersion is extreme as small Caps soar higher and tech-heavy NASDAQ falls.
We just saw the biggest 2-day outperformance of Small Cap Russell 2000 over NASDAQ-100 in nearly 2 decades (since March of 2001).
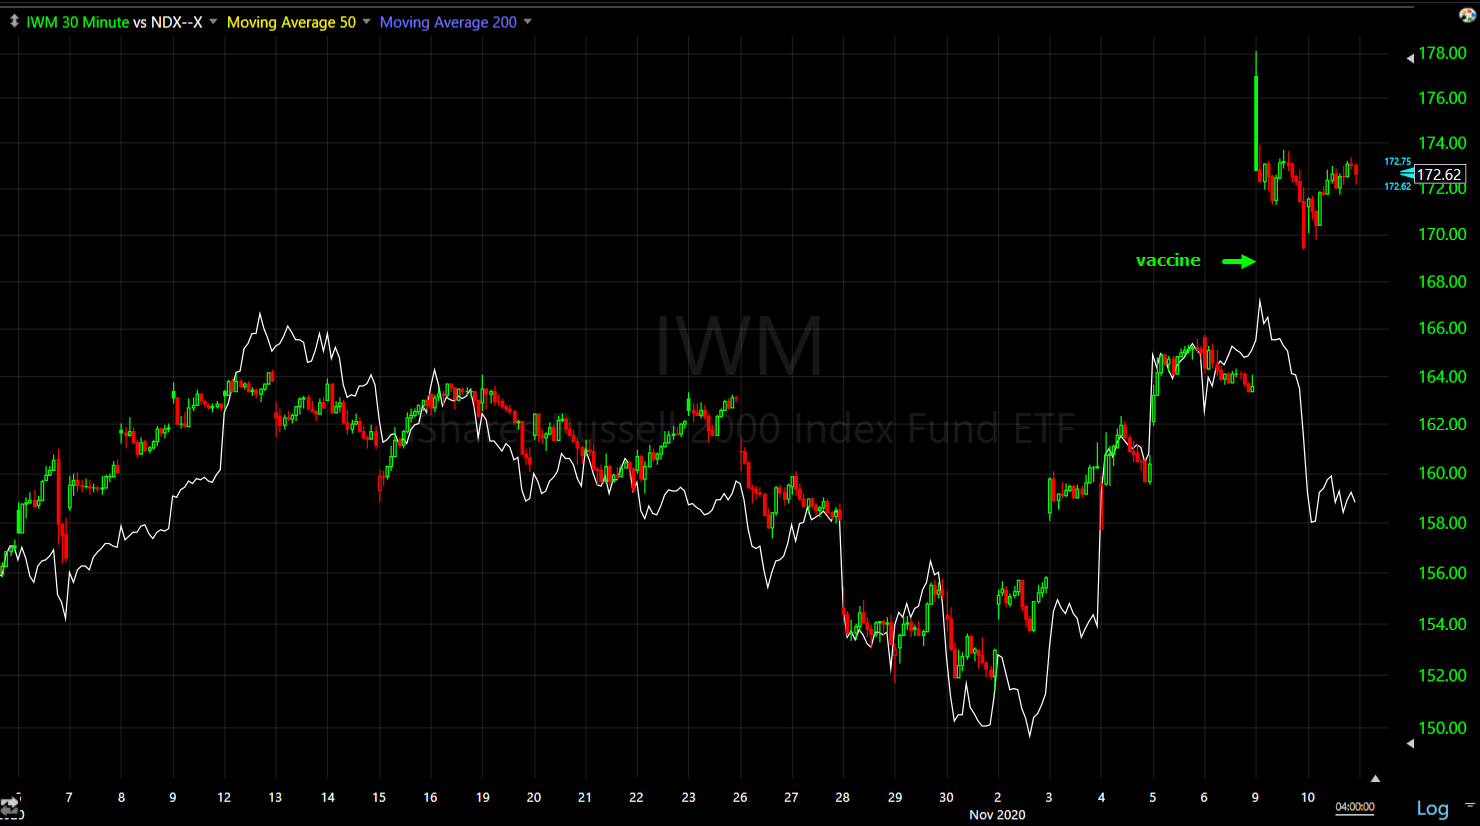 Small Caps and NASDAQ (30m) fall ahead of the election, and rally together after the election, but as of Monday’s vaccine announcement, traders/investors are dumping mega-caps, growth and momentum style factors to buy cyclical/value and as a result small caps outperform.
We’ve also just seen the biggest 2-day outperformance of value over growth ever recorded. Today Value (+3.7%) outperformed Momentum (-3%) again.
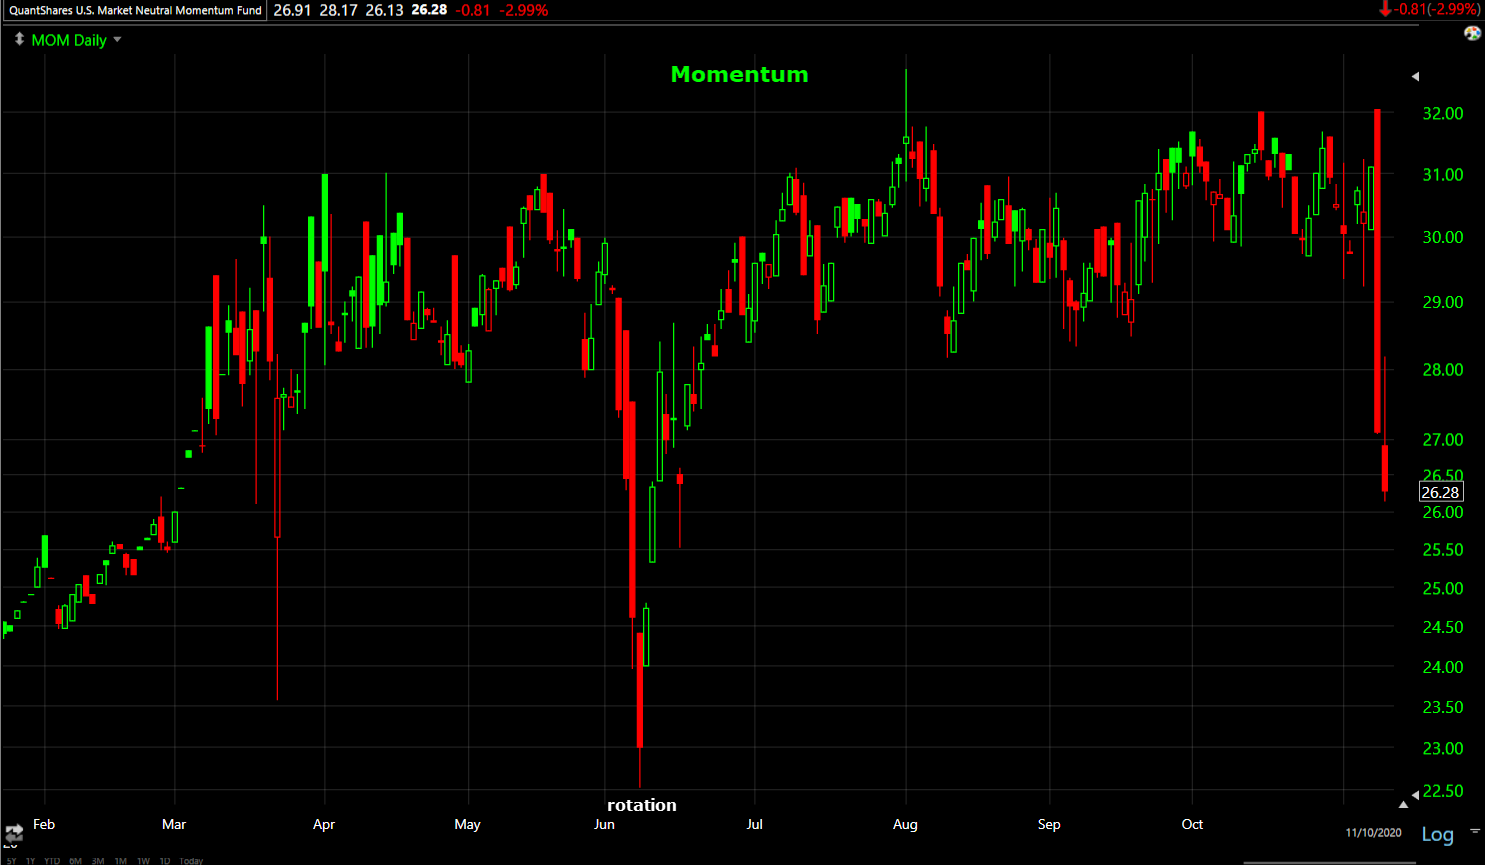 Momentum style factor (daily) notice the last really sharp dumping of momentum stocks was late May/early June, the failed rotation.
Averages
The dispersion is evident in the major averages again with Small Caps gaining just about the same as what NASDAQ lost in percentage terms. This dispersion or bifurcation isn’t unheard of, but it’s highly unusual and by some metrics, record setting. It’s not a difference in relative performance, but an all-or nothing dynamic that I find unusual and a little unsettling.
The 2-day decline in NASDAQ is the largest since September. At the time NDX tagged the 50-day on the first leg down, spent a week consolidating above, and made a second leg below the 50-day for a near 14% decline (the unwind of August’s melt-up).
The Dow has been outperforming along with small caps, despite the fact it does have exposure to mega-caps like Apple (AAPL -0.3%) and Microsoft (MSFT -3.4%). One offsetting factor was Boeing (BA +5.2%), which is one of the larger value stocks that outperformed amid news that it could receive FAA approval for the 737 MAX by Nov. 18.
S&P 500 ⇩ -0.14 %
NASDAQ ⇩ -1.74 %
DOW JONES ⇧ 0.90 %
RUSSELL 2000 ⇧ 1.88 %
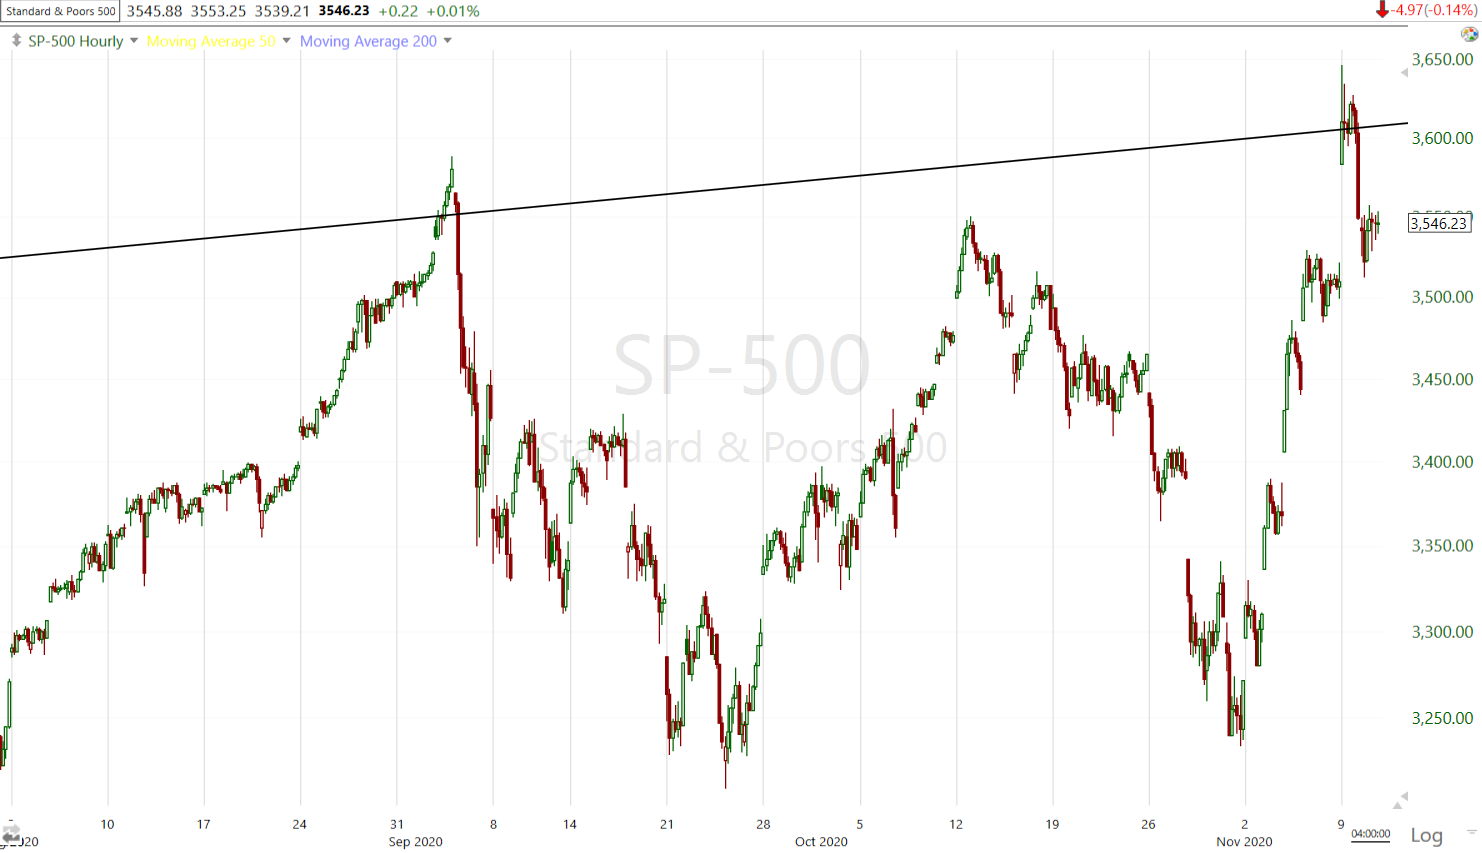
Two things were evident in price action early this morning. One was that S&P futures were starting to trace out a bearish flag-like consolidation, which later became evident in the cash session on SP-500’s price chart…
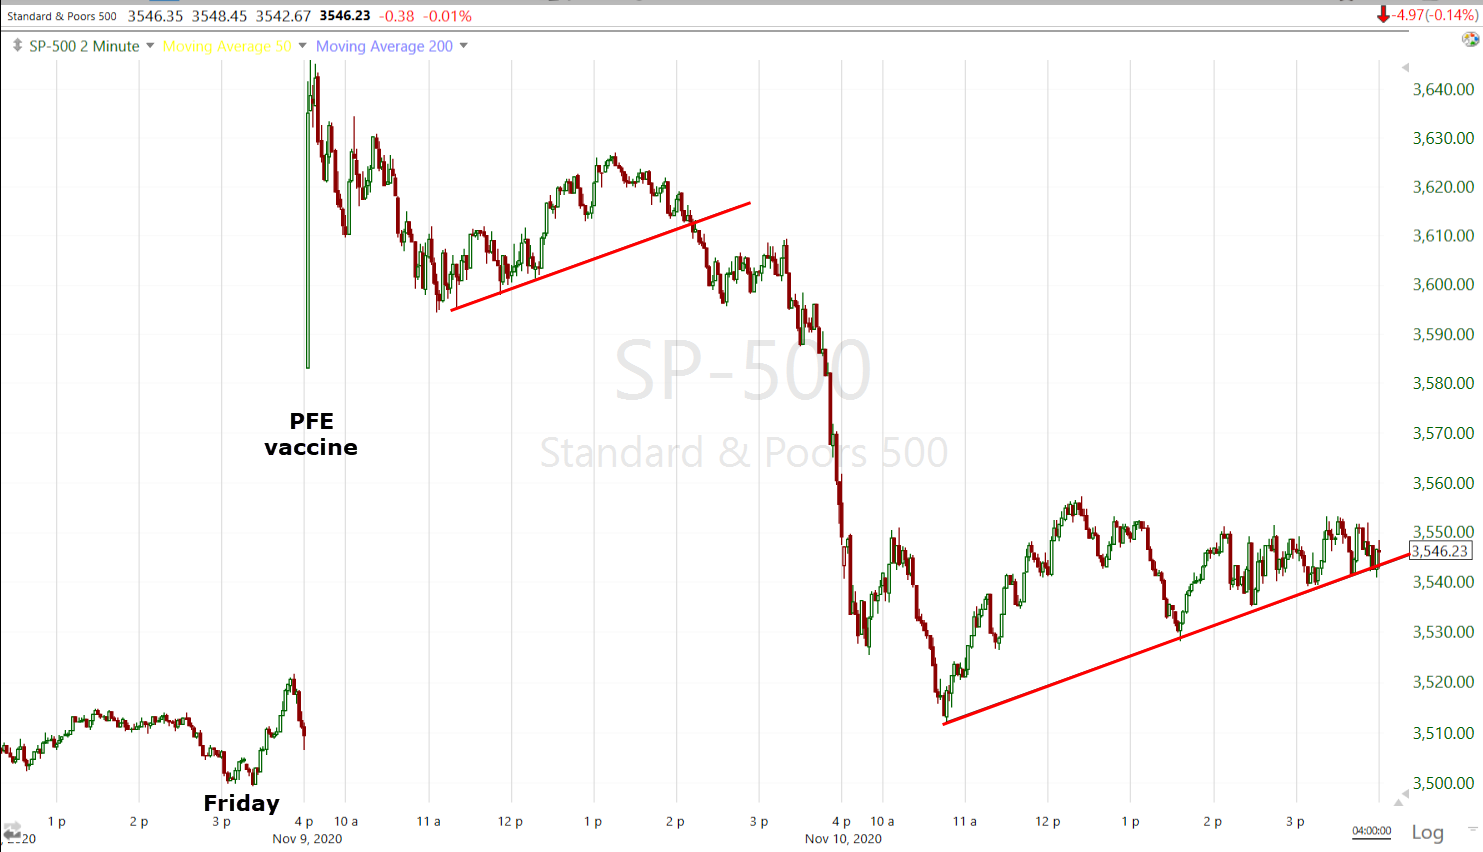
SP-500 (2m) yesterday I warned (SPX $3600 Area) about a small bearish consolidation or “line in the sand” that “happens to intersect with the long term S&P BRT trend line.” and SPX 3600, noting it looked like an important near term level. Once it broke, S&P closed at the low of the day. By early this morning S&P retraced all of yesterday’s vaccine-news gains, and traded in a bearish consolidation the rest of the day as S&P futures portrayed earlier.
And second, NASDAQ was seeing downside follow through from a horrendously ugly bearish engulfing candle from Monday. My opinion in the early update was that the NASDAQ would test down to its 50-day, which it did just before 11 a.m. ET.
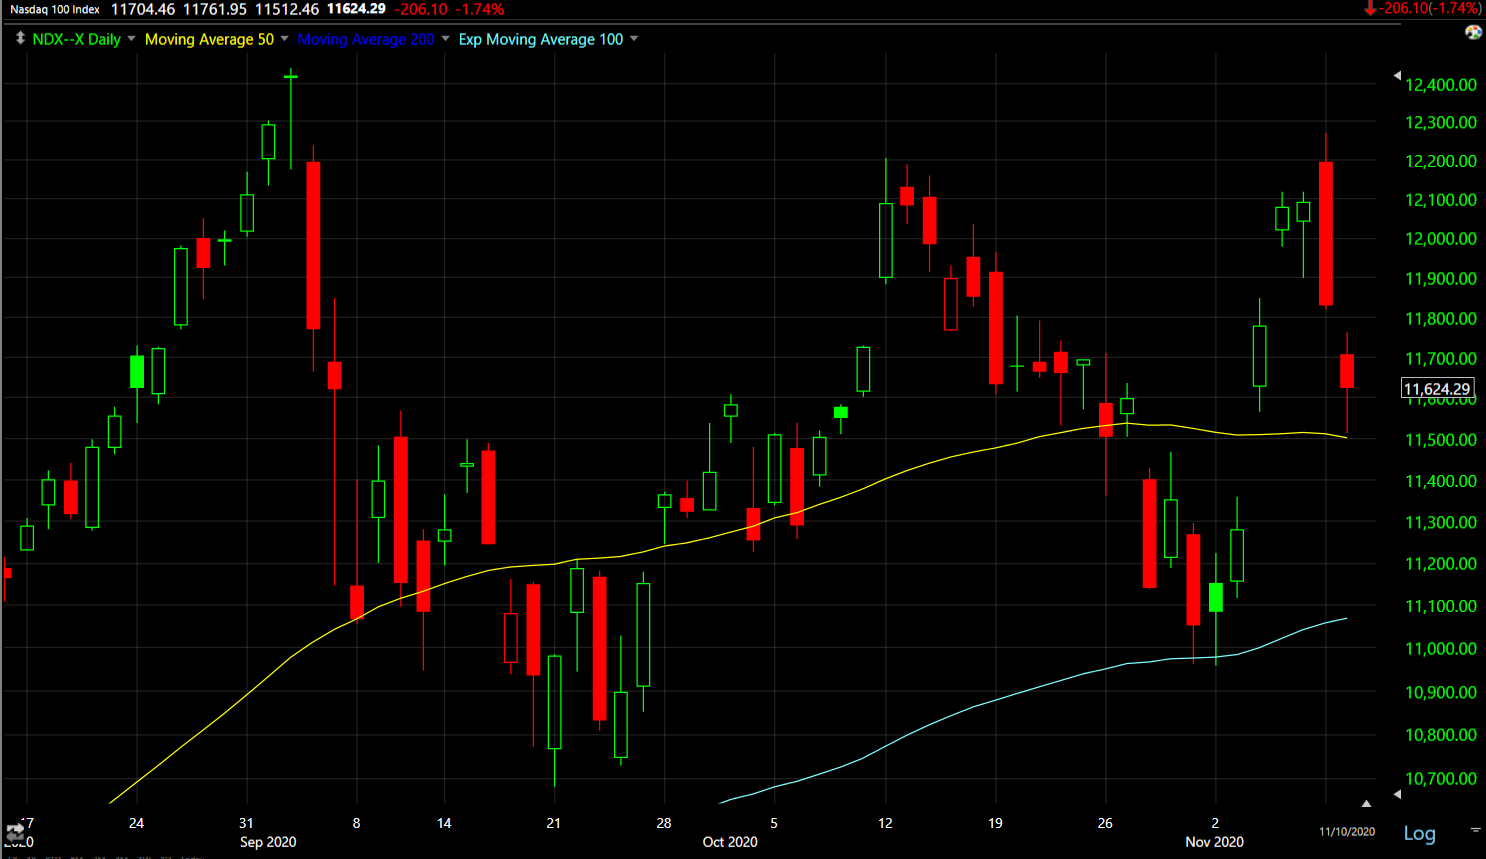 NASDAQ-100 (daily) bearish engulfing candle yesterday and downside follow through today with technical support at the 50-day.
Since it was Technology, Communications, Consumer Discretionary and Mega-caps leading the way lower and pressuring the S&P…
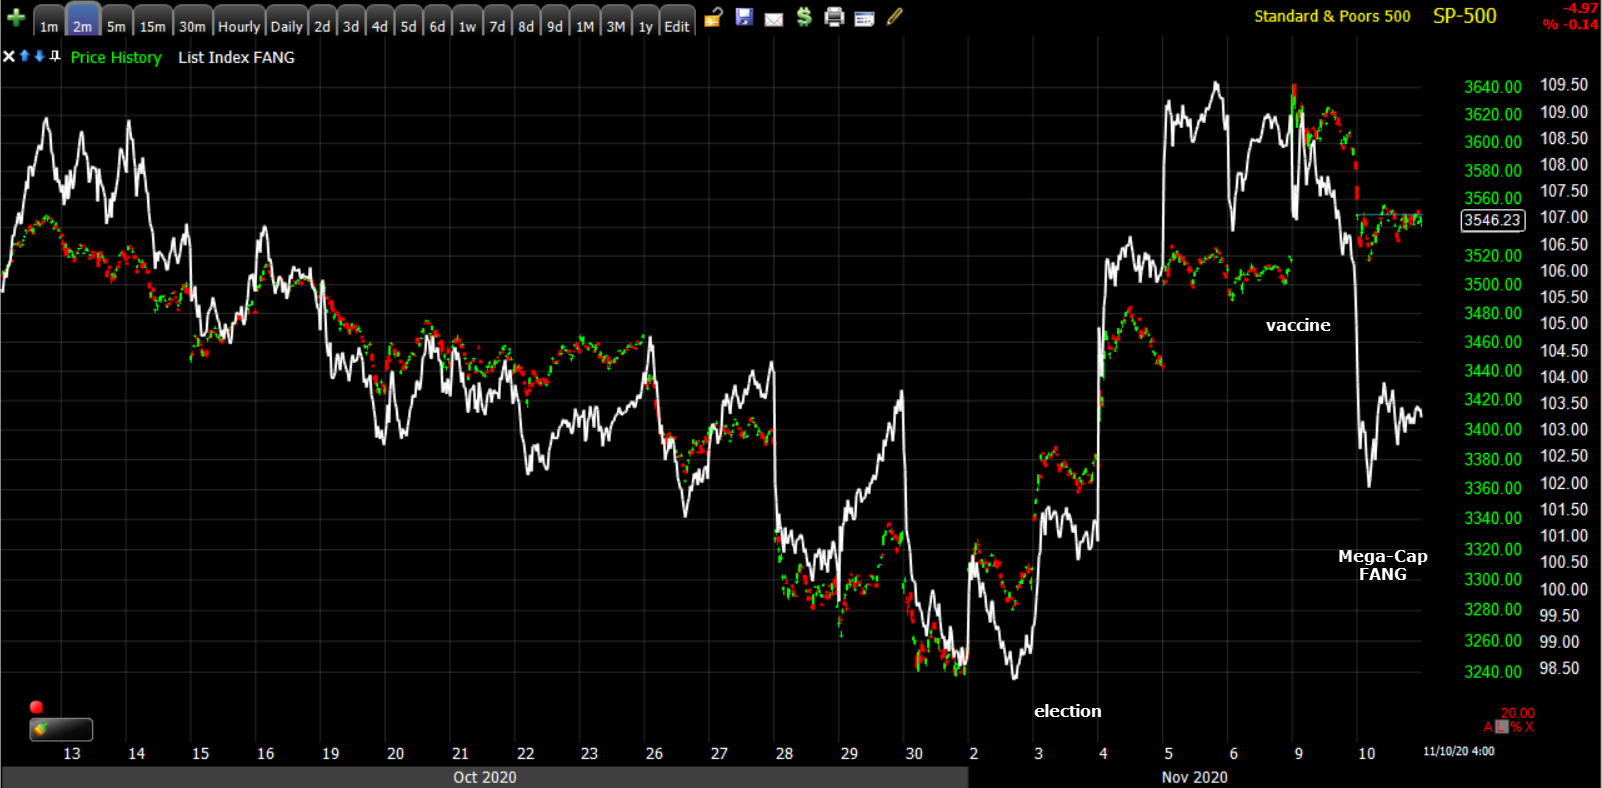
SP-500 (2m) and the influential mega-caps (FAANGM stocks) leading the S&P lower.
The NASDAQ’s technical support at the 50-day prevented the S&P from breaking down from its bearish flag (which it did briefly) and falling another -2.5 to -2.75%.
As a reminder, S&P’s decline from yesterday’s highs was also at the Broadening formation or Broadening Top trend line like the August/early September melt-up.
SP-500 (0m) Broadening Top upper trend line.
While Small Caps put in an impressive +1.9% gain, they didn’t make any head way due to how aggressive yesterday’s cash session decline from opening highs, to closing lows was.
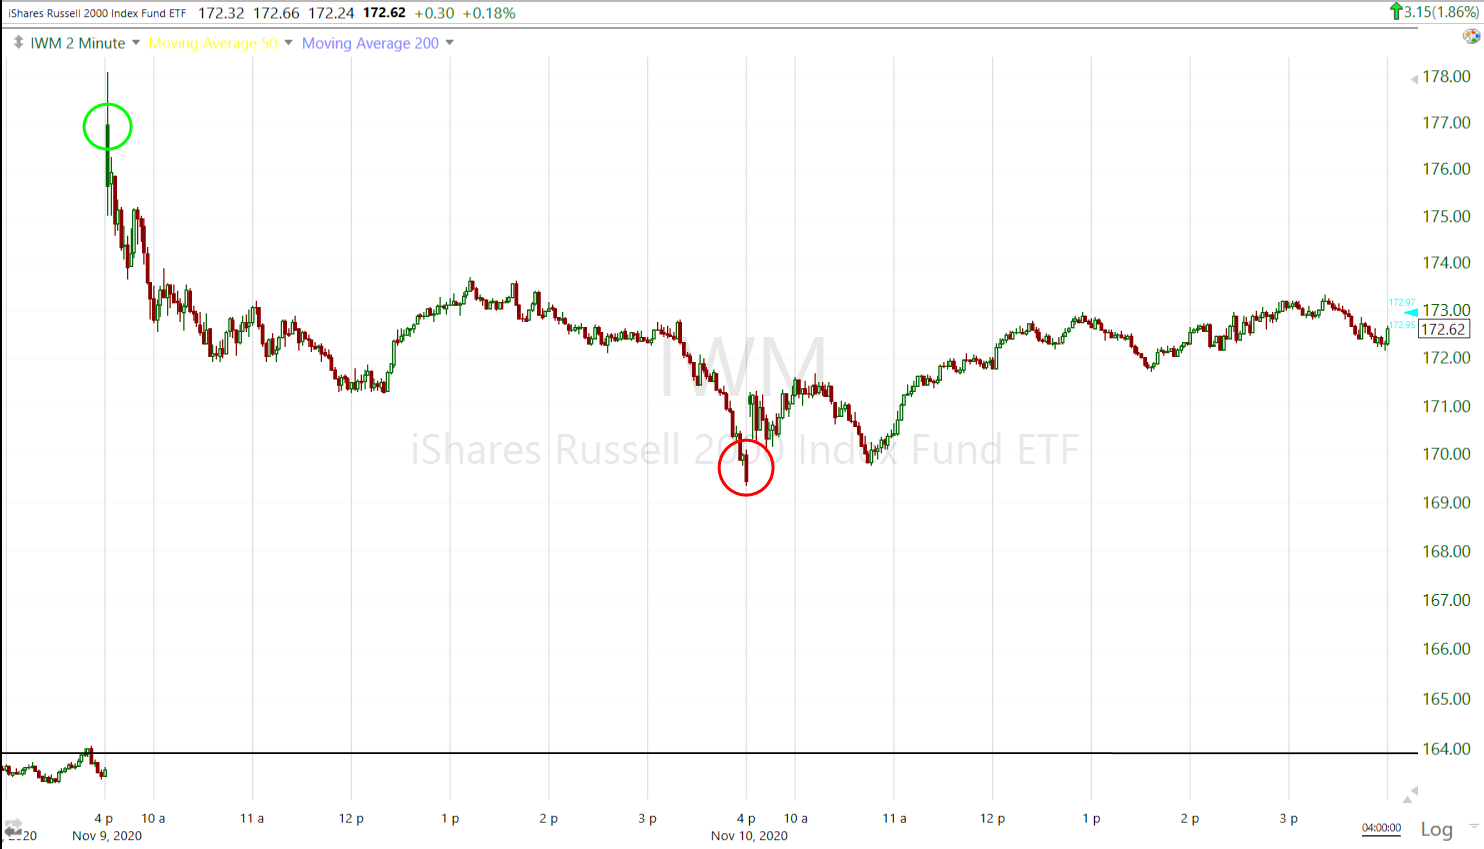 IWM (2m) yesterday’s open in green and close in red. While posting a gain today, price was more or less flat an inside yesterday’s wide-ranging bearish-closing candle.
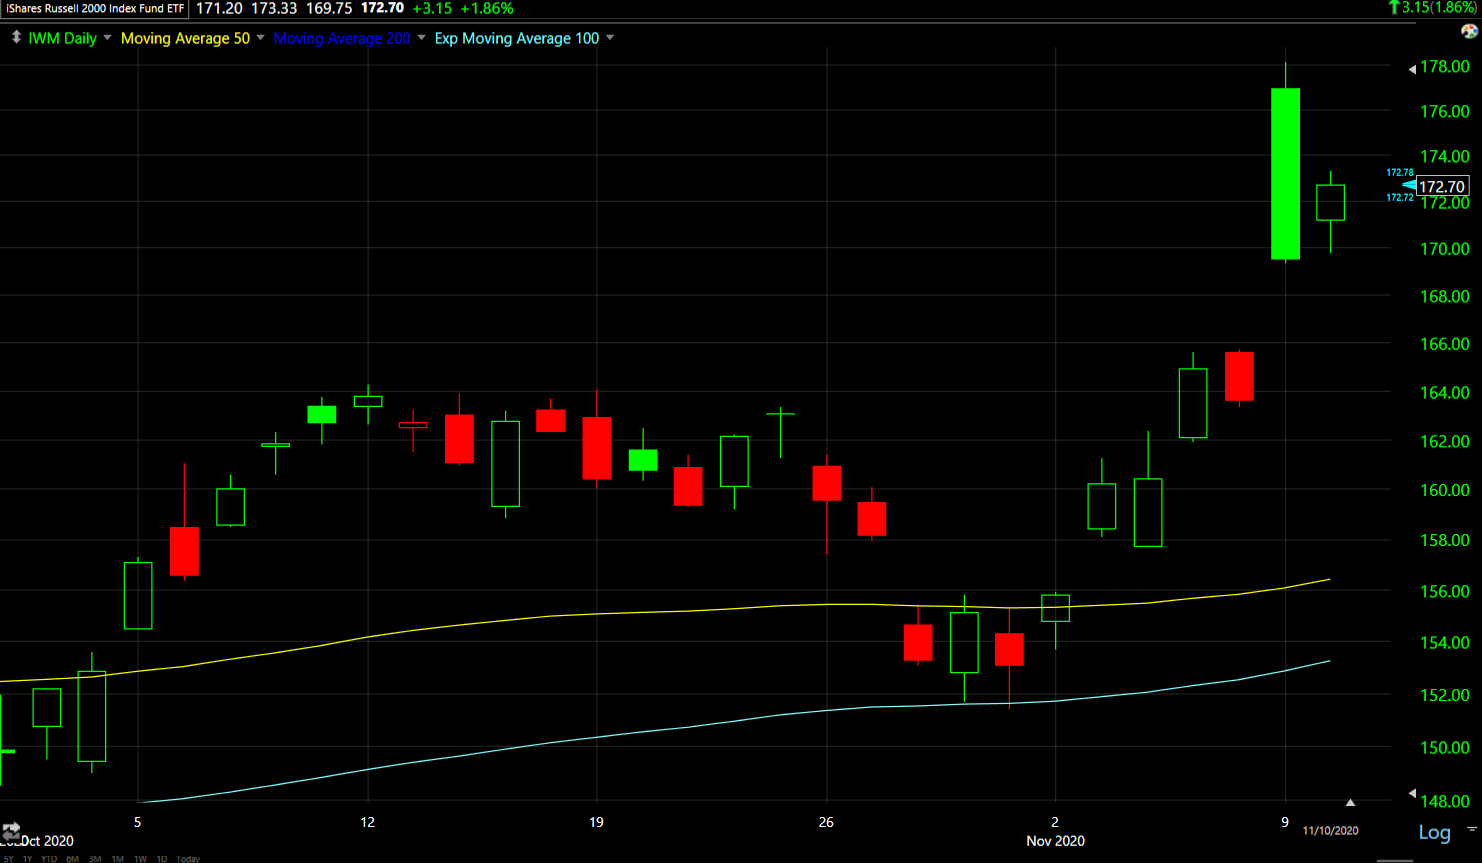 IWM (daily) posting an inside day or loss of momentum. Although inside days have a higher probability of being the start of a reversal, I noted this morning that I’d give Small Caps the benefit of any doubt and assume price action to be a consolidation with a bullish bias (unlike S&P and NASDAQ).
The Dow is essentially the same as IWM above, ending with an inside day and given the benefit of any doubt.
One of my favorite edges is confirming divergences. For instance a positive divergence in SPY, QQQ, DIA and IWM means very high probabilities of a move higher. Add to that a negative divergence in VXX and the probabilities are even better. Or vice-versa. One of the challenges an oddities of the present market is that the averages are so different in performance – NASDAQ down -1.75% while Small Caps are up +1.85% the same day, that’s very unusual. As such, the 3C charts are a bit of a mixed bag.
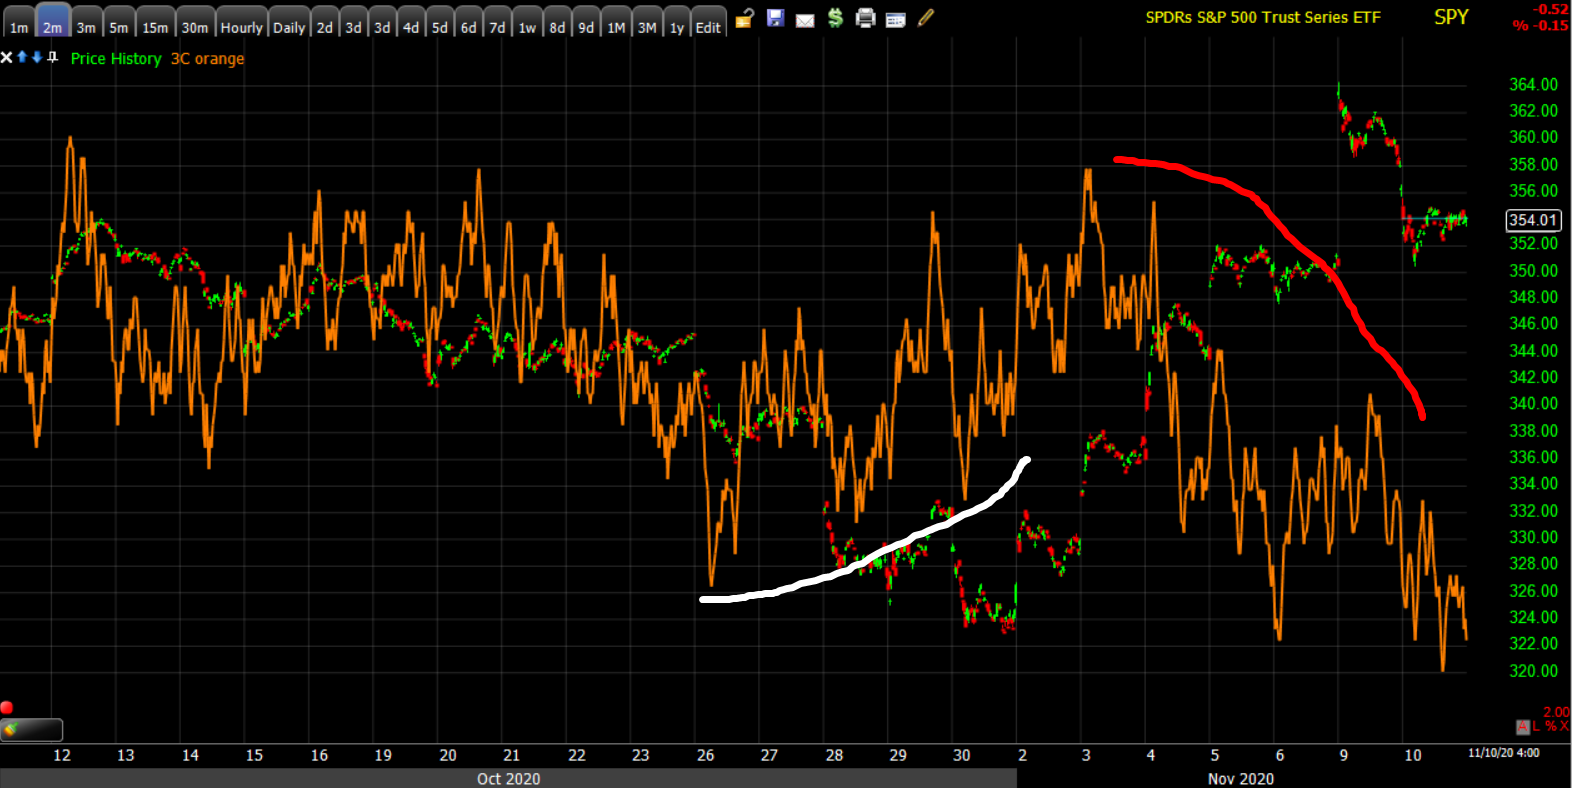 SPY (2m) positive divergence at October lows (and led higher by USDJPY) in white, and negative divergence last week into Monday’s high.
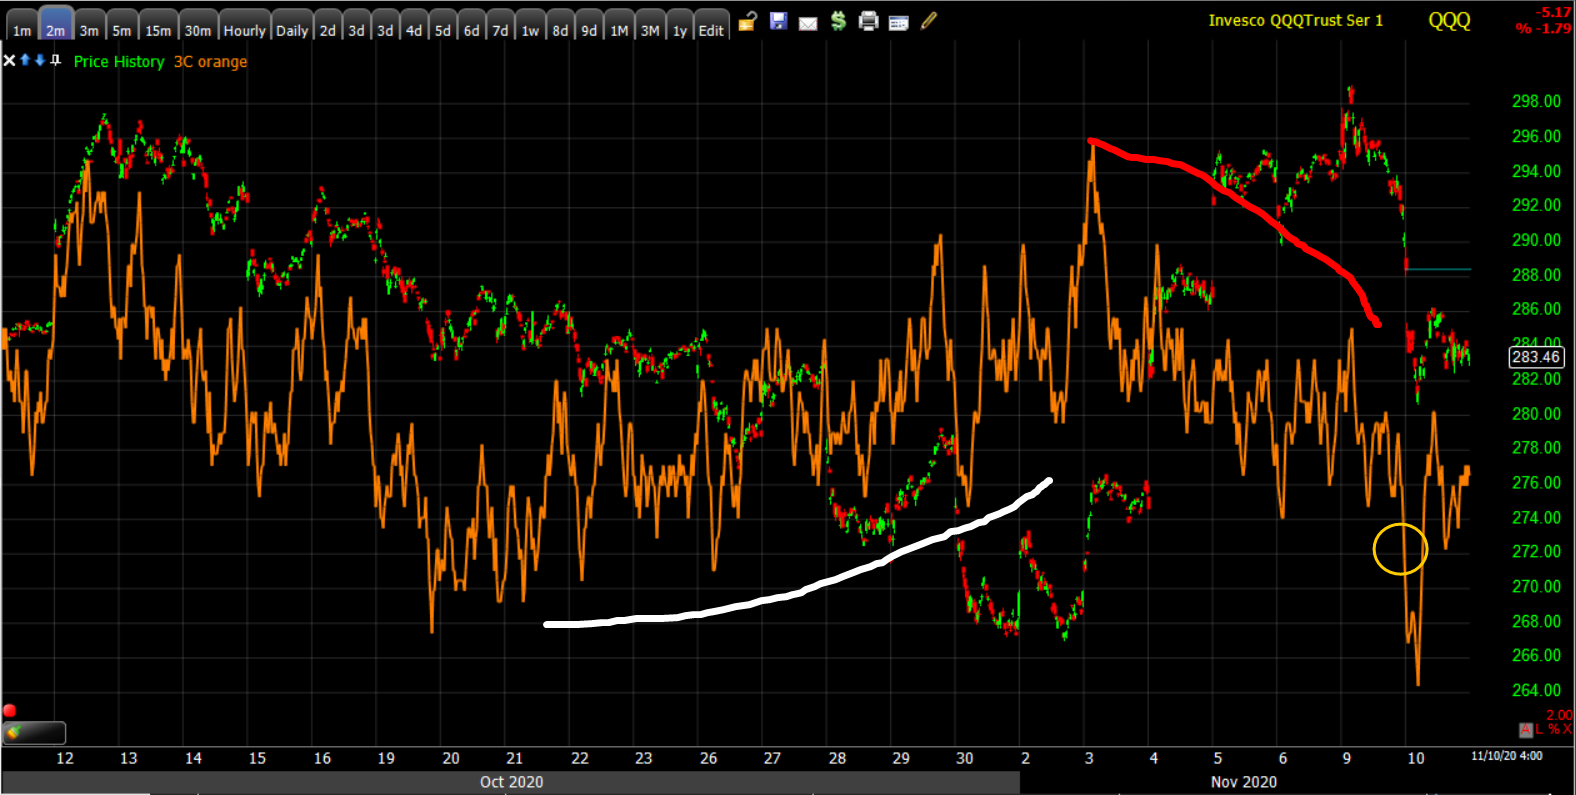 QQQ (2m) positive divergence (white) into October’s low and lack of confirmation into last week’s rally, but a clear negative divergence at Monday’s high (red) with 3C leading lower yesterday afternoon (yellow), price followed this morning. If NASDAQ tests its 50 day again we may see buyers step up and a positive divergence in 3C worth trading for a bounce. I’m not excited about shorting NASDAQ with the 50-day right here, but if it bounces or even trends up more in a bearish flag and 3C leads lower, I could add QQQ short.
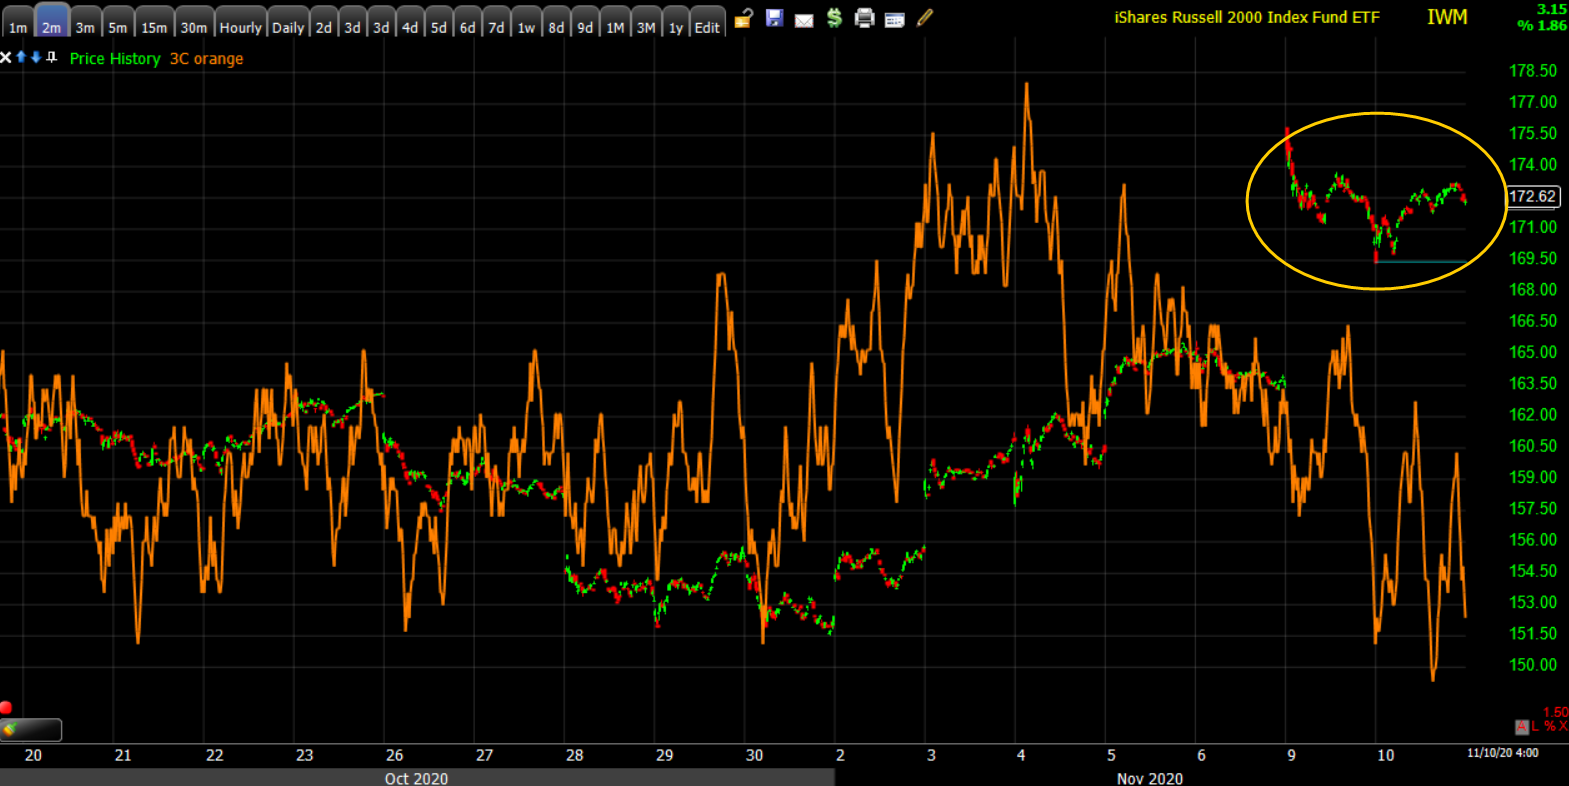 IWM (2m) early yesterday I said there was no 3C confirmation into the massive +8% opening gap and IWM fell nearly 5% by the close. I still don’t see signs of buyers stepping in in a meaningful way in the cash market. I’m giving IWM the benefit of the doubt and assuming this to be a consolidation phase, but if there’s not some improvement in 3C soon, I’ll shift my view more bearishly.
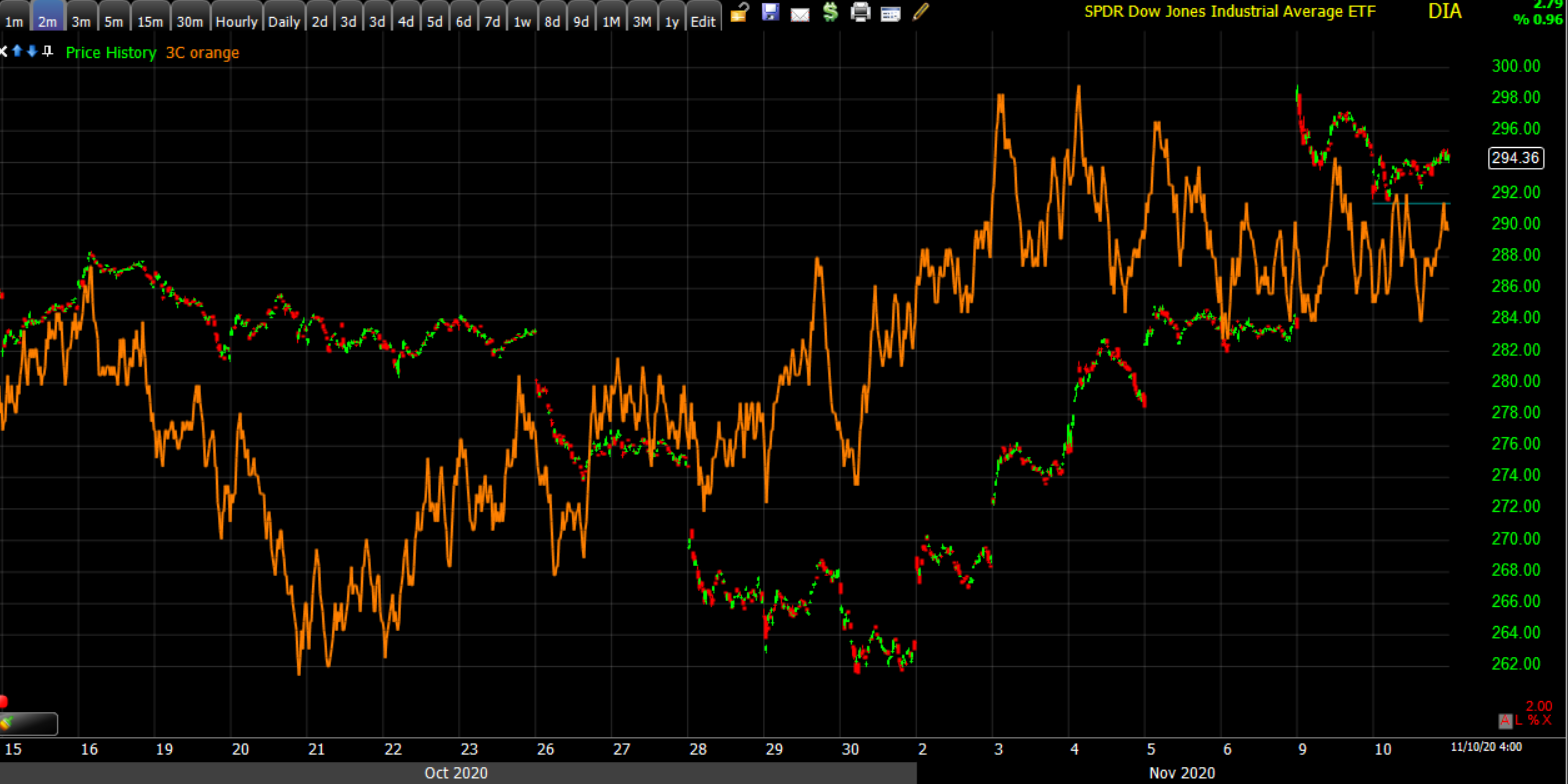 DIA (2m) on the other hand has strong confirmation and looks solid here.
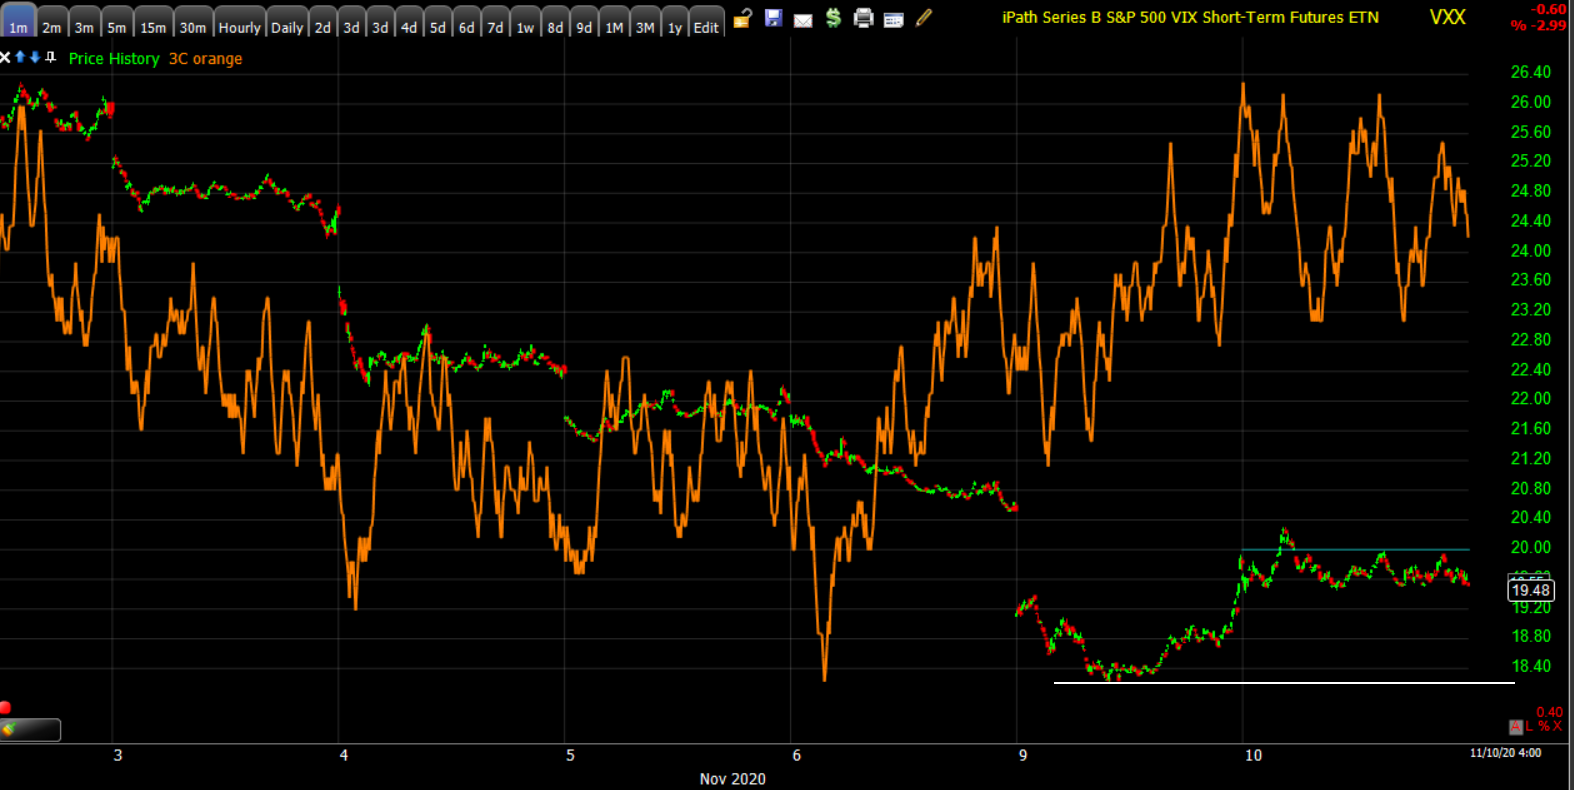 VXX (1m) despite VXX’s 11% fall yesterday morning, the positive divergence was clear and VXX retraced the majority of the decline by early this morning. I’d be more interested in a long trade if prices pulled back and tested toward $18.25-$18.50 and 3C continued higher. The risk-reward would be more favorable and the confirmation of additional buying support would boost probabilities.
S&P sectors
Most sectors closed higher, you can probably guess which three closed lower based on NASDAQ’s weakness. Once again value cyclicals like Energy were bid up, but so were value stocks in other sectors that tend to be more defensive like Consumer Staples.
The Momentum style factor, which dominates today’s three red sectors, was under pressure again and that manifested in mega-cap weakness and their related sectors. Many of the mega-cap FAANGM stocks are similar to NASDAQ in that they are close to potential technical support levels (i.e.- 50 or 100-day moving averages).
Materials ⇧ 1.18 %
Energy ⇧ 3.24 %
Financials ⇧ 0.52 %
Industrial ⇧ 1.76 %
Technology ⇩ -1.86 %
Consumer Staples ⇧ 1.97 %
Utilities ⇧ 1.44 %
Health Care ⇧ 0.29 %
Consumer Discretionary ⇩ -0.35 %
Real Estate ⇧ 0.55 %
Communications ⇩ -0.32 %
Eli Lilly (LLY +3.0%) provided investors another reason to feel better about the coronavirus after it received emergency use authorization for its antibody treatment. Speaking of Health Care, I’ve been watching the sector’s chart for awhile.
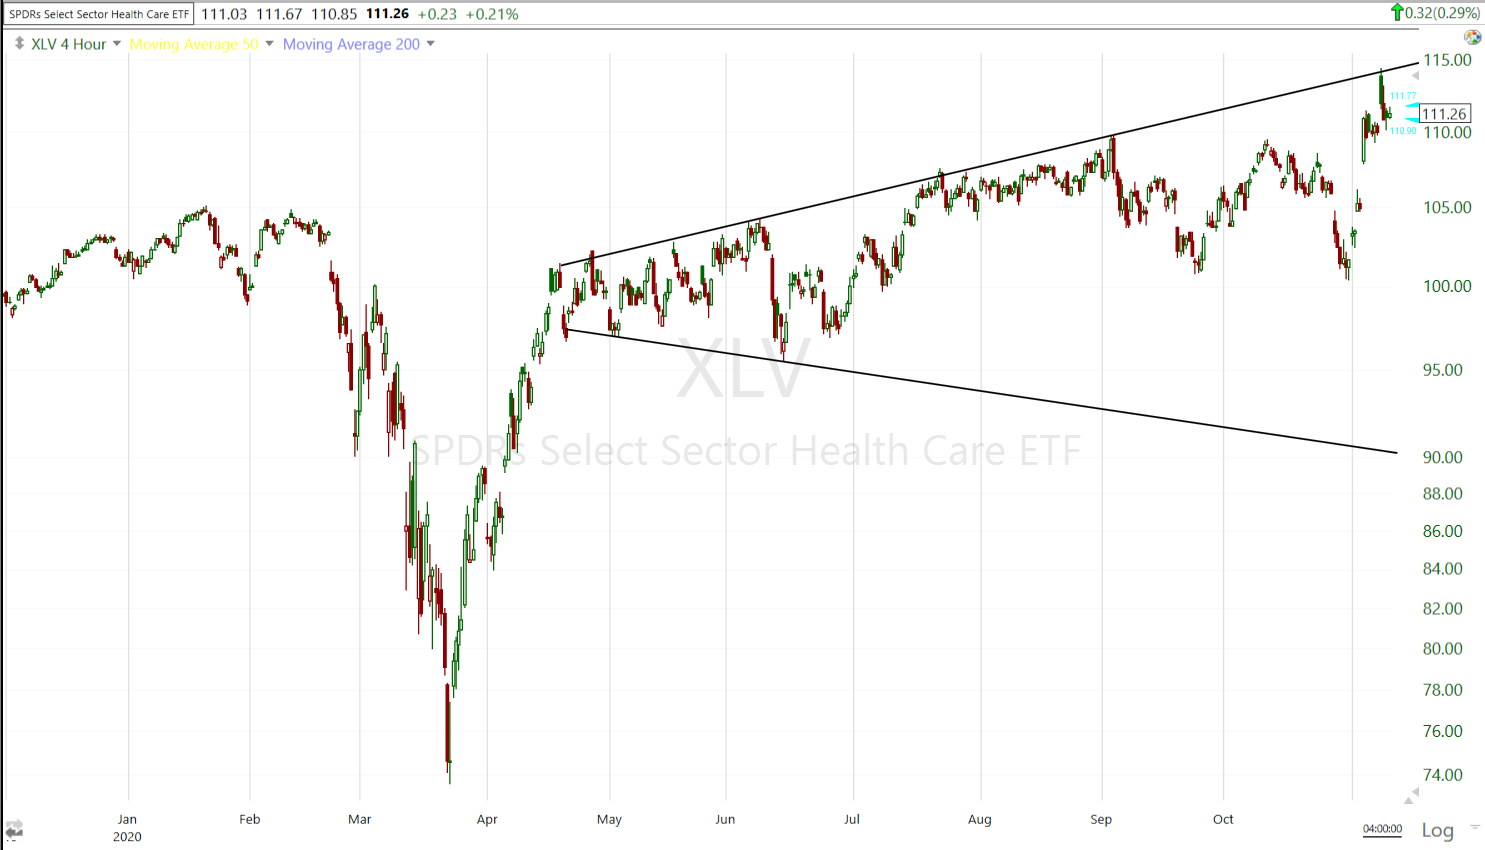 Health Care sector (4 hour) it looked like another broadening formation/top this summer, and still may be, although there hasn’t been a recent pivot to the lower trend line. Still, prices keep finding resistance at the upper trend line.
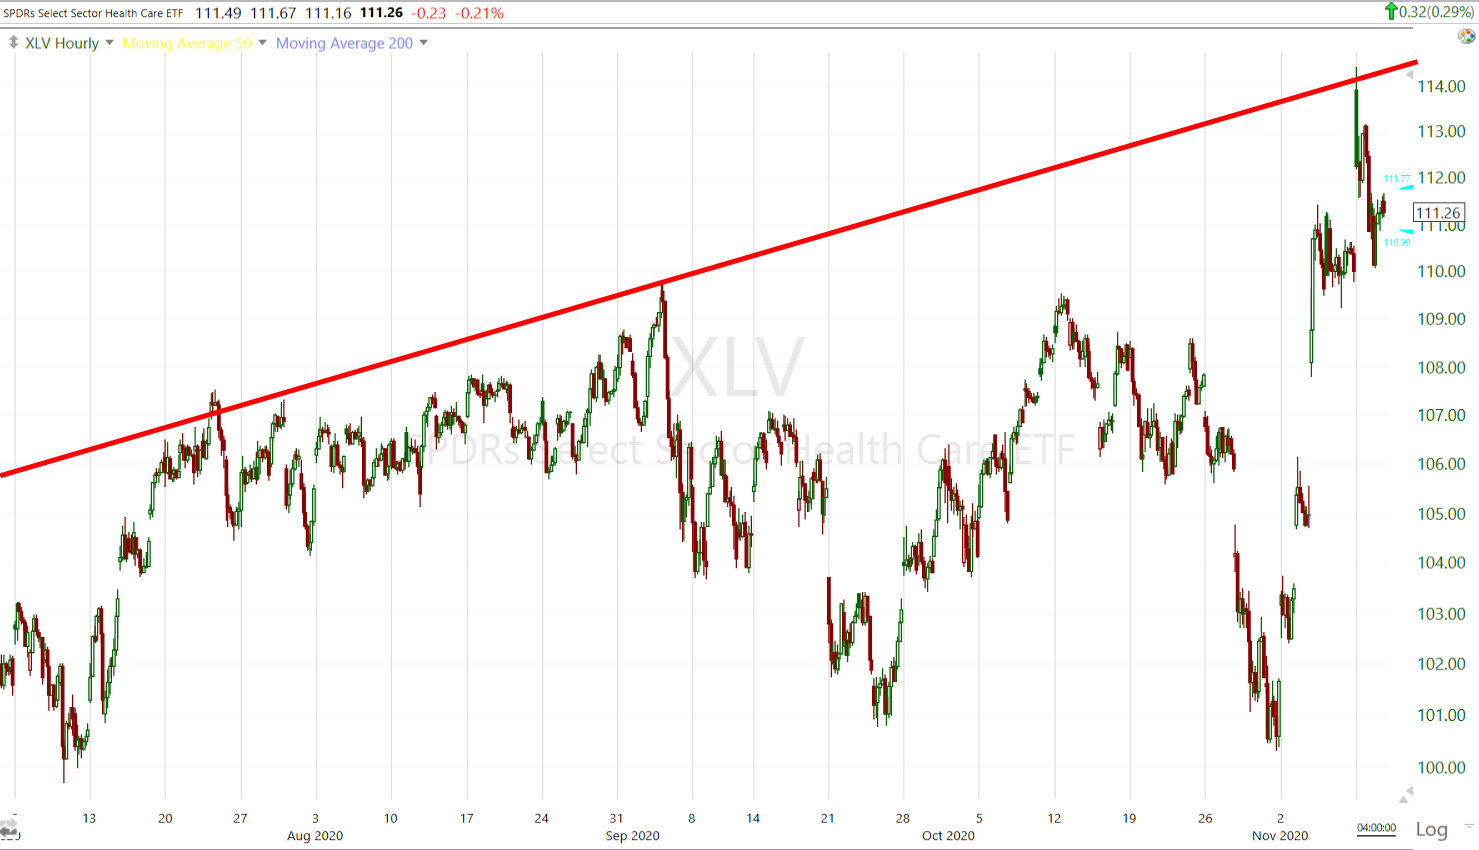 Health Care sector (60m)
Like Small Caps, most of the sectors that closed higher today just traded sideways, like Industrials which I pointed out earlier.
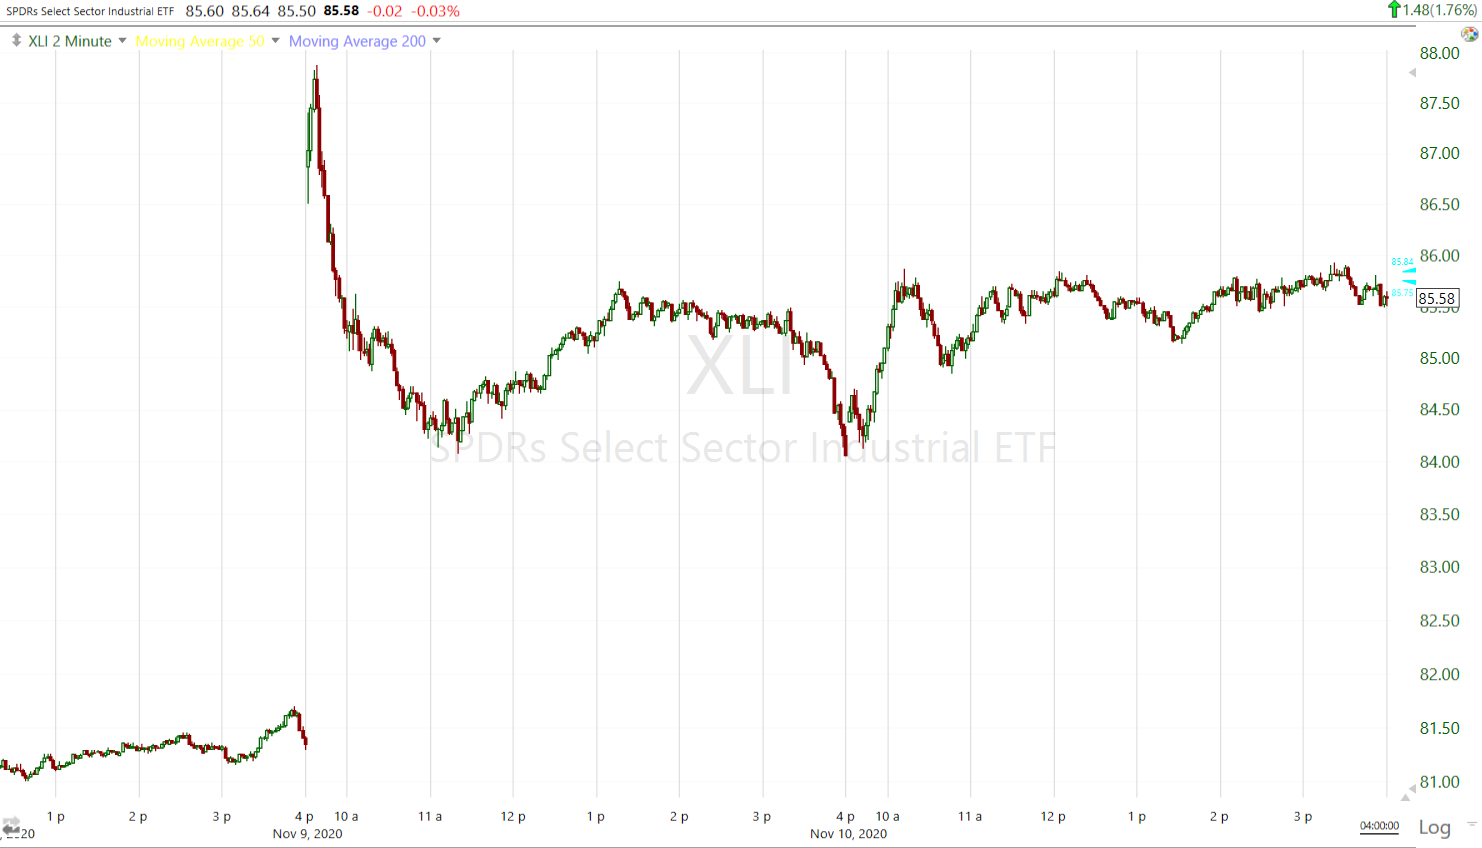 Industrial sector (2m)
This isn’t good or bad in my view as it’s not a clear or obvious bullish or bearish pattern, just a pause. For that reason I view these sectors as still constructive. The three exceptions are as you might guess…
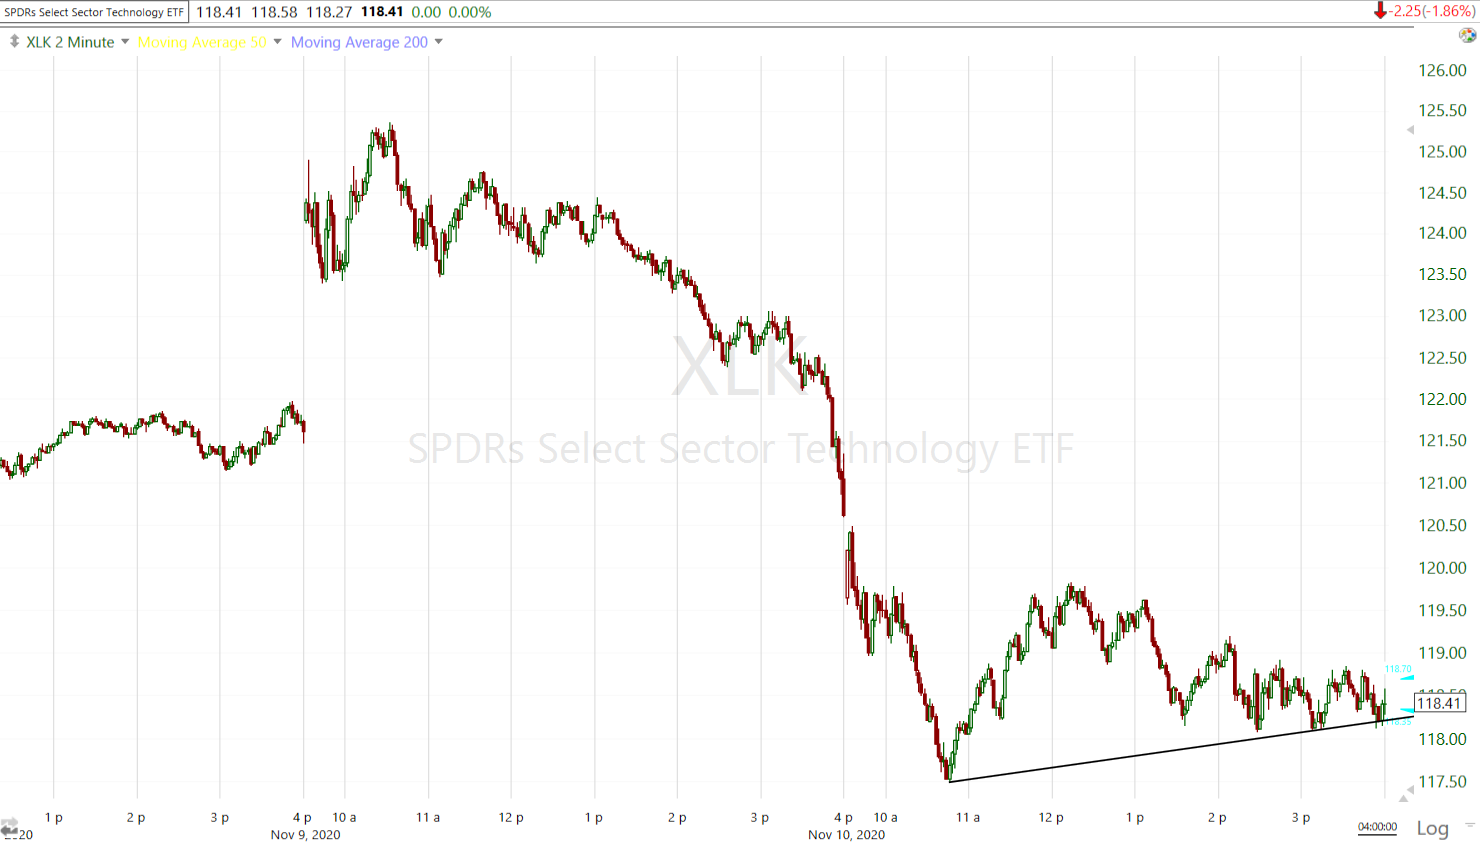 Technology Sector (2m) not only retracing all of Monday’s gains, but all of Thursday’s and Friday’s as well. The sector fell more than 6% from Monday’s morning high. This is a clear bearish consolidation.
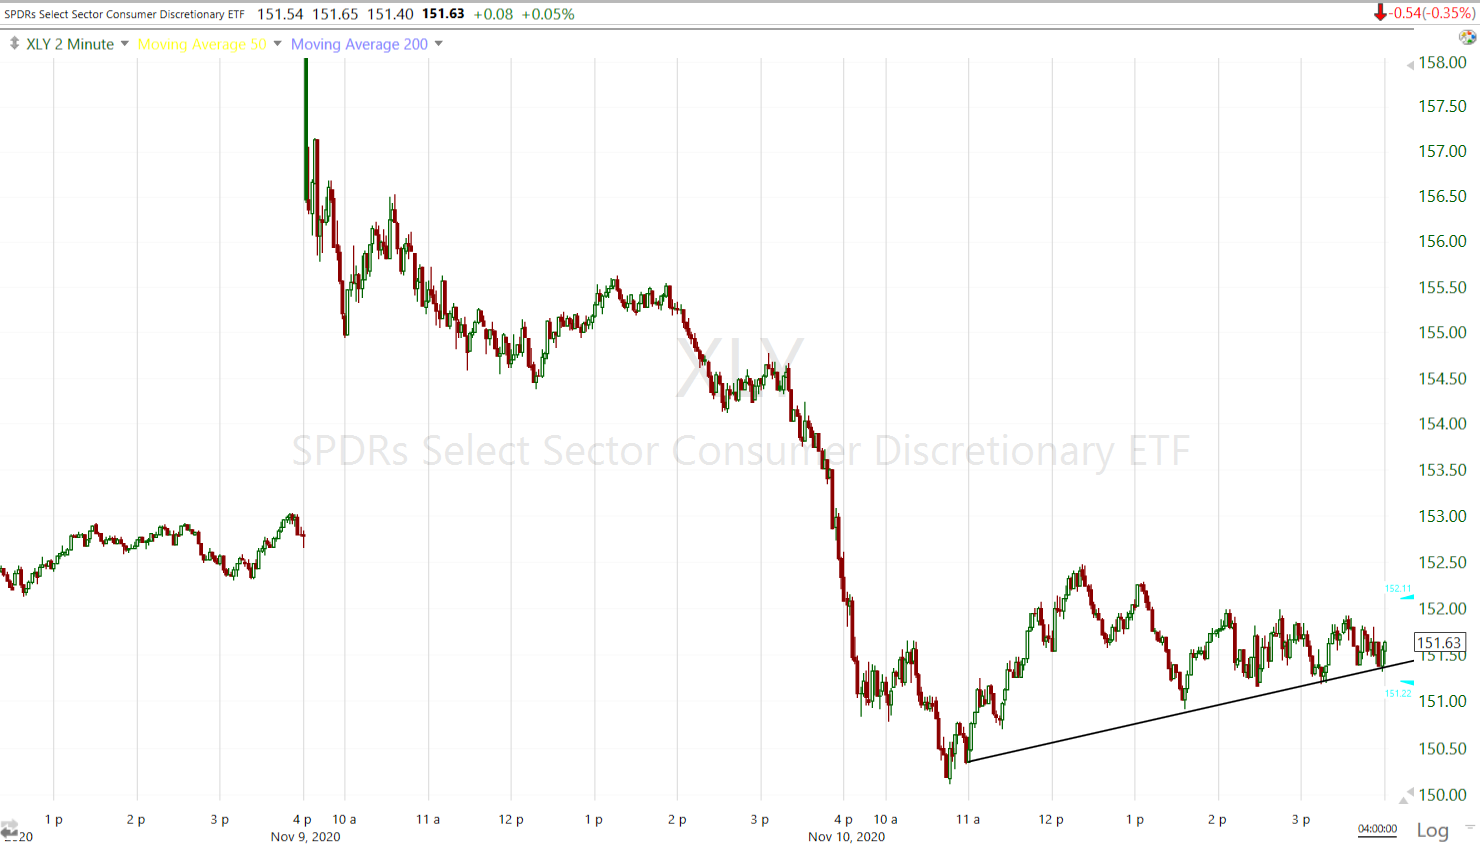 The Consumer Discretionary sector (2m) has the same bearish consolidation
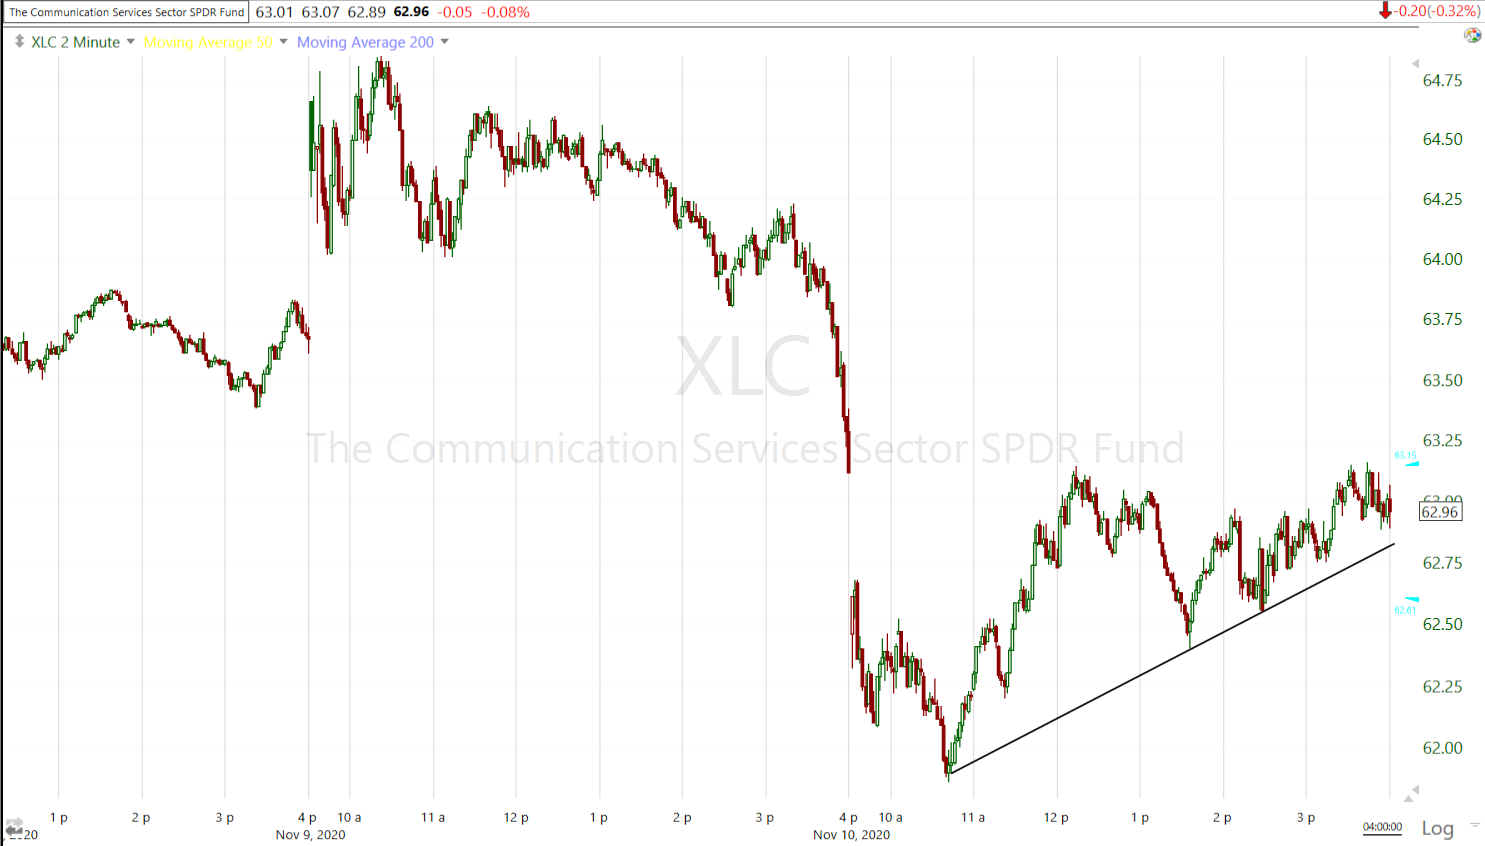 As does the Communication sector (2m)
The problem for the benchmark index is that these are influential sectors. Technology is the most heavily weighted and influential sector. We’ve seen that for years on the way up, but that edge cuts both ways and this is exactly why S&P has much more bearish near term price action today.
Internals
Internals were positive with small cap leadership. NYSE Advancers (1995) outpaced Decliners (1011), but less than a 2-to-1 margin. Volume was lower today at 1.1 bln shares, but above the 50-day average of 982.1 mln.
The Dominant price/volume relationship wasn’t consistent through all the averages’, which isn’t surprising as Small Caps and NASDAQ were virtually the mirror opposite of each other. However, the dominant theme across the market is Close Up/Volume Down, which is the weakest relationship, the polar opposite of yesterday’s Close Up/Volume Up.
The price/volume relationship is well within 1-day overbought territory. Eight of 11 sectors closing higher is right on the cusp of 1-day overbought. Advancers should be at least 2-to-1 over decliners to round out a solid 1-day overbought condition. Internals lean toward 1-day overbought, but I wouldn’t expect it to be a major factor in tomorrow’s trade.
Treasuries
U.S. Treasuries finished near their flat lines in a quiet session, leaving longer-dated yields at recent highs. The 2-year yield was flat at 0.18%, and the 10-year yield was flat at 0.96%.
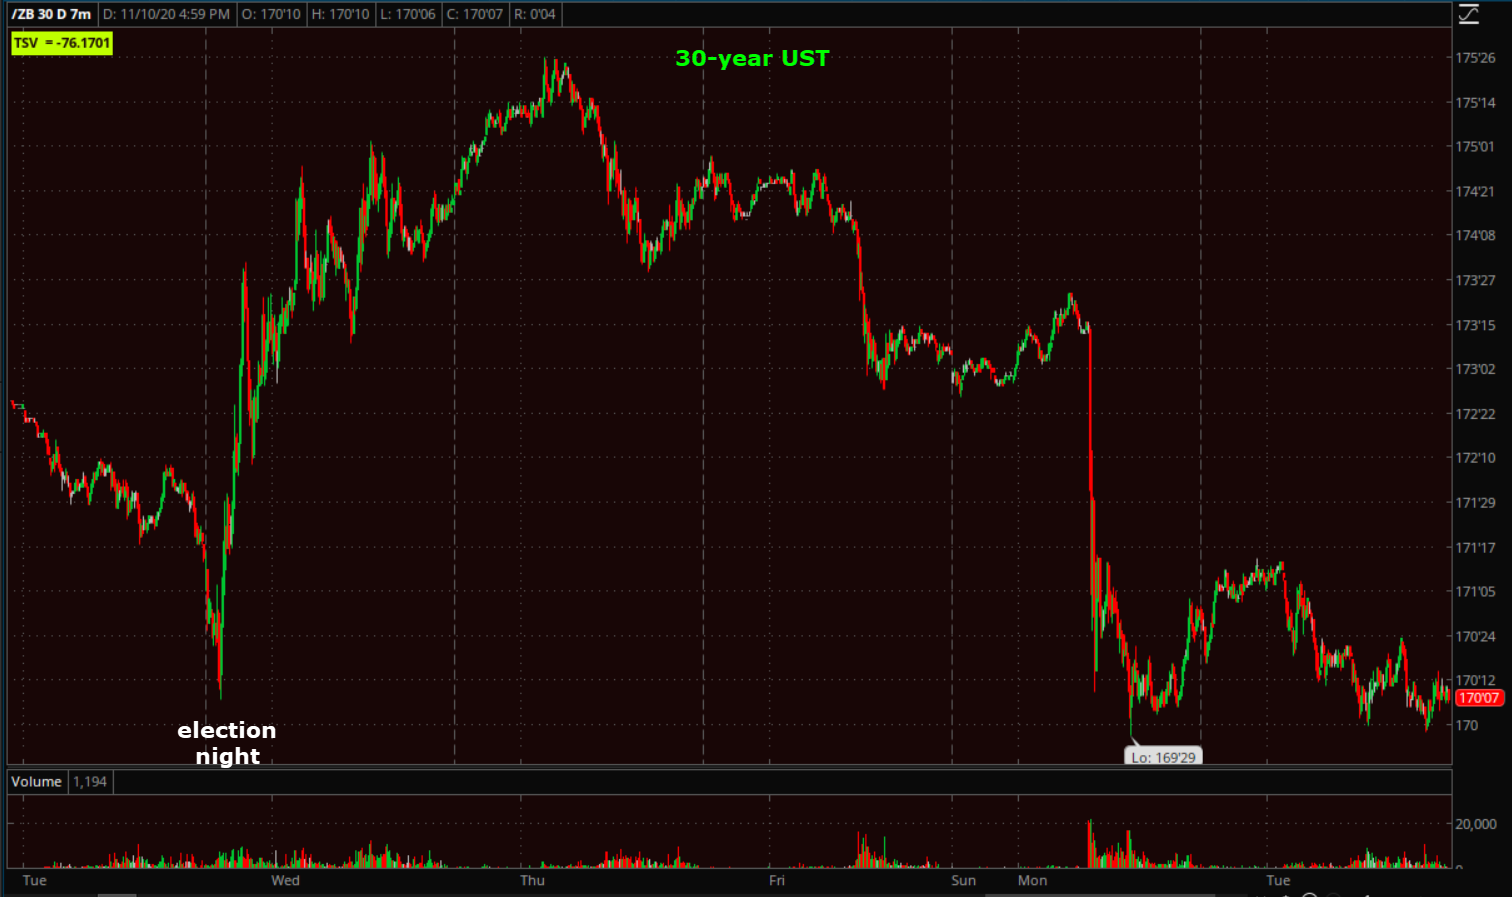 30-year U.S. Treasury futures (7m) found support for a second day near election night lows.
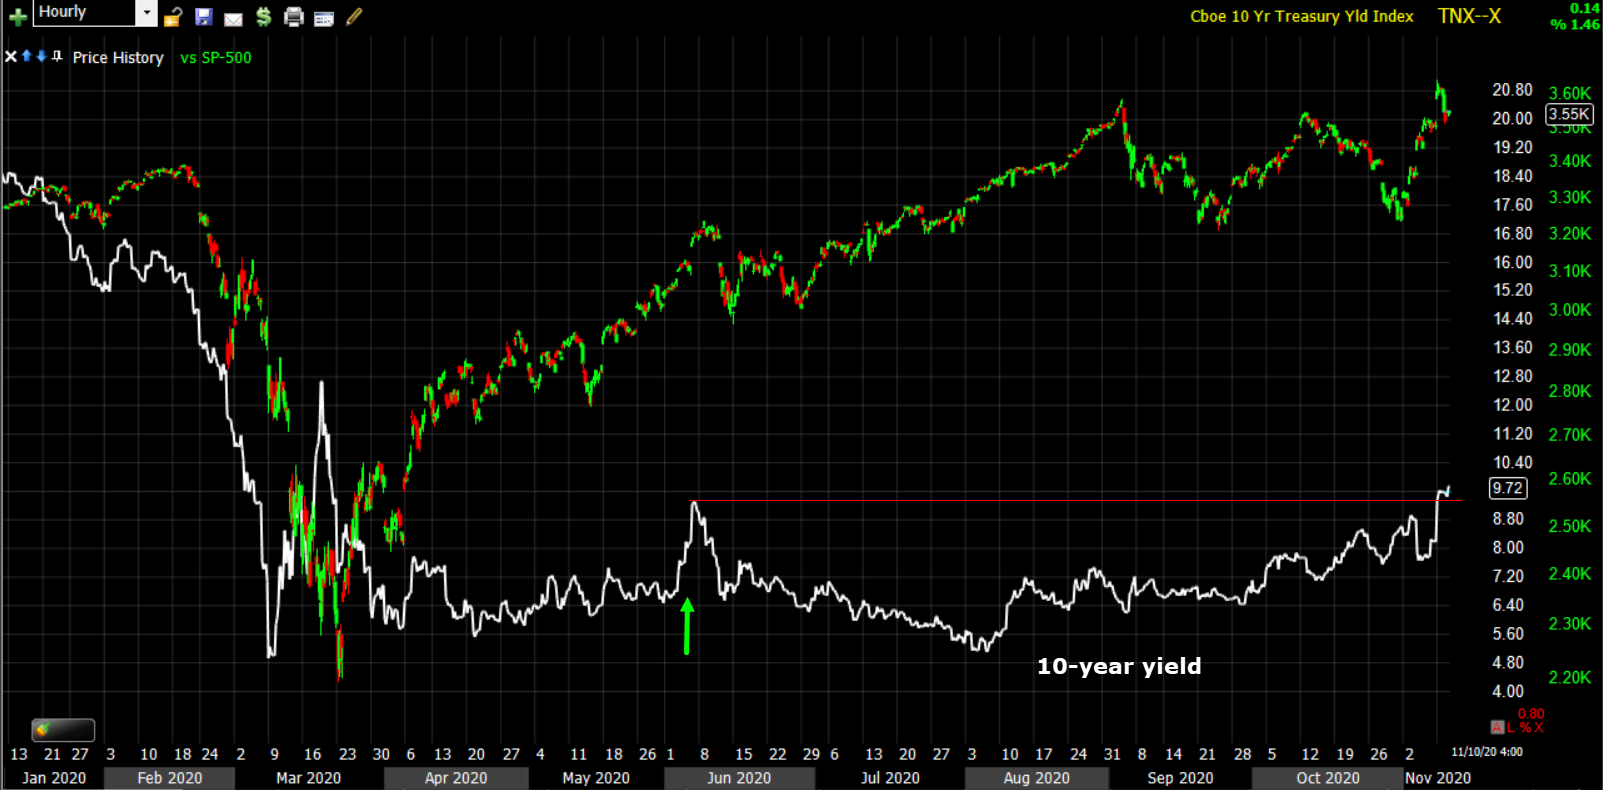 SP-500 (60m) and 10-year yield – the latter is just above levels seen at the last value/cyclical rotation in June, which by the way was very impressive at the time and it failed shortly after. That’s not to say that this rotation will fail, just to note that investors have been chomping at the bit for this trade to work, they’re excited about it and rush into it headlong only to be smacked down. I would think that a vaccine is about as good of a reason/catalyst as I can think of for the rotation to stick.
On a side note, the higher rates move at the long end, the more they pressure extremely richly valued stocks which may be part of the reason why momentum names have come under pressure, in addition to rotation by investors. As mentioned last night, higher yields also tighten financial conditions and assuming all things are equal and the Fed continues printing $120 bn a month, financial conditions would actually tighten the more yields rise. The Fed could offset them by increasing asset purchases, but as their balance sheets shows, for some reason they have not been increasing purchases. My gut feeling has been that the Fed is on strike of sorts, laying responsibility for stimulus at the feet of Congress and the administration. There’s also the very real possibility that the Fed simply can’t monetize any more debt (I mean purchase assets, because monetizing the debt is illegal for the Fed… wink, wink) without Congress spending more.
This is another reason the value stocks with beaten down price multiples are more attractive to investors presently.
Currencies and Commodities
The U.S. Dollar Index increased 0.1% to 92.81, which is largely sideways like the averages which is not coincidental.
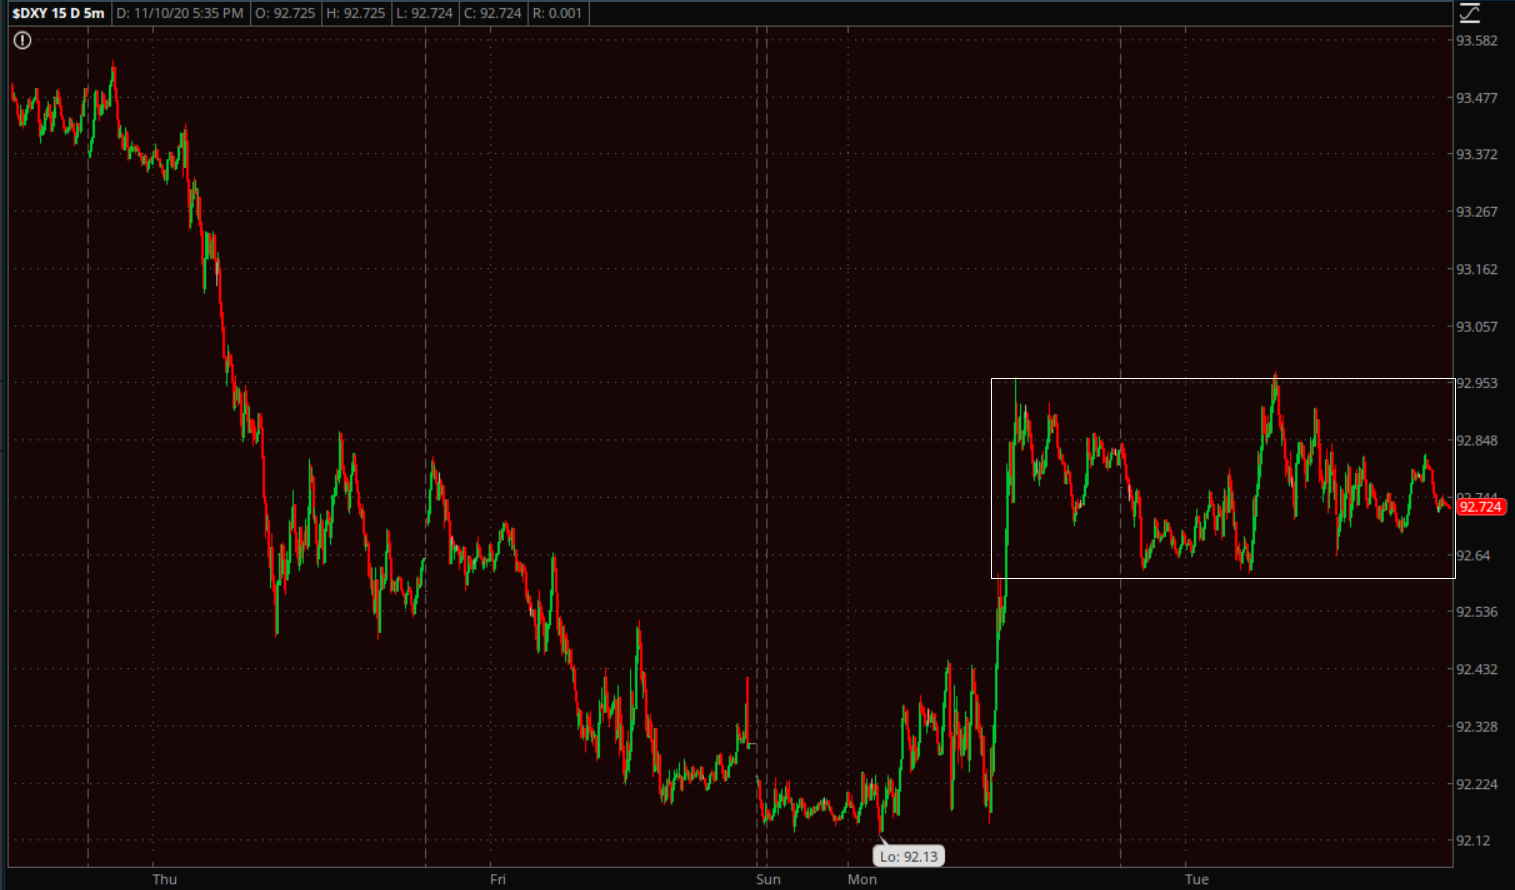 U.S. Dollar Index (5m) consolidating yesterday’s gain.
WTI crude futures gained +2.6% to $41.37/bbl.
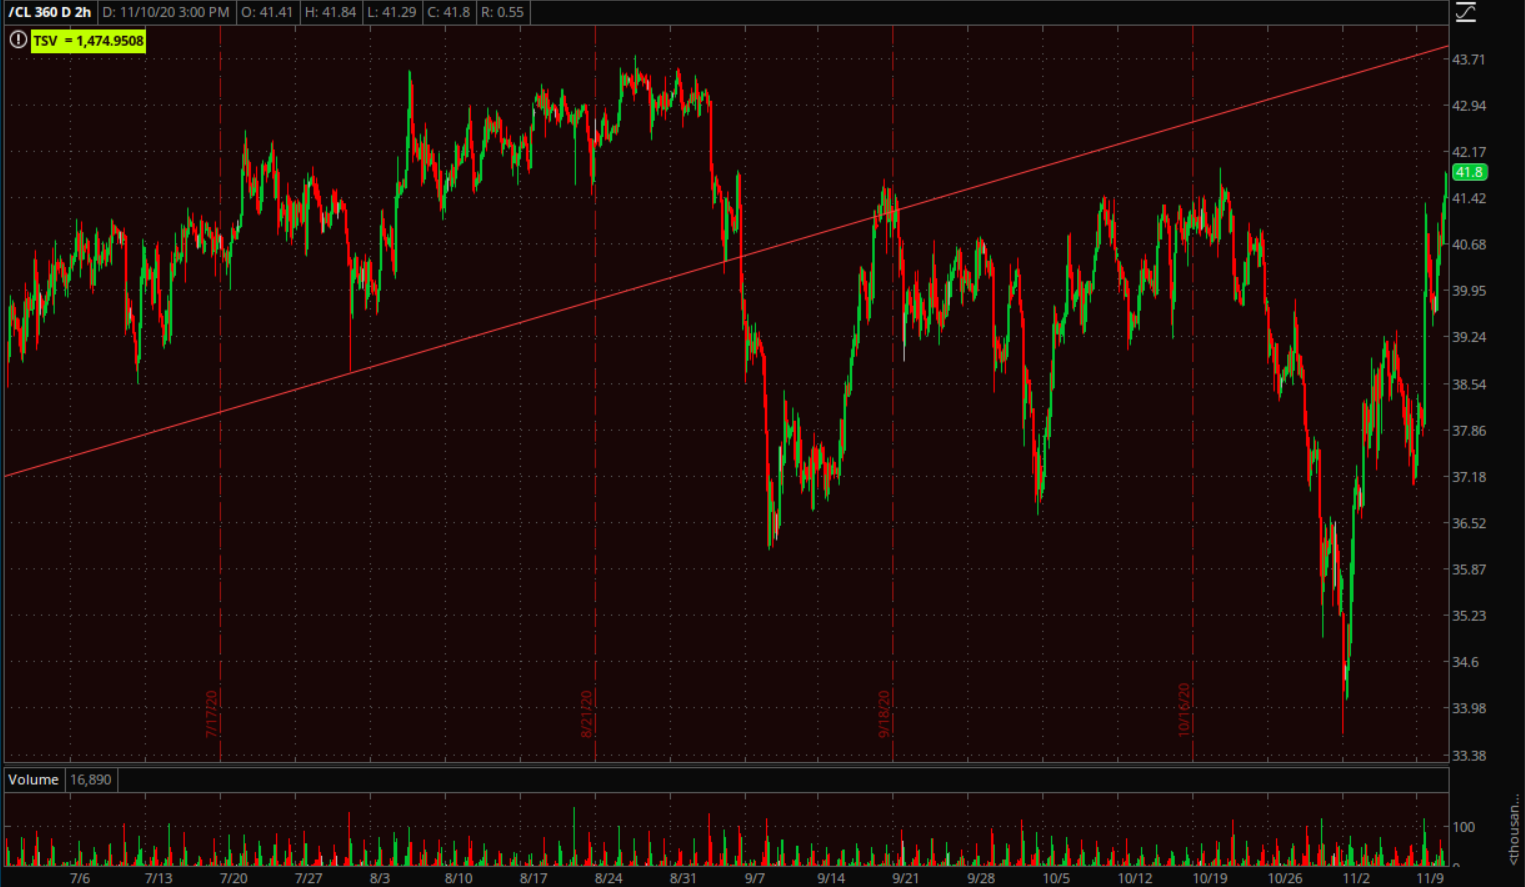 WTI Crude (2h) near the top of the recent lateral range, next the diagonal trend line near $43.75 would be a likely zone of resistance.
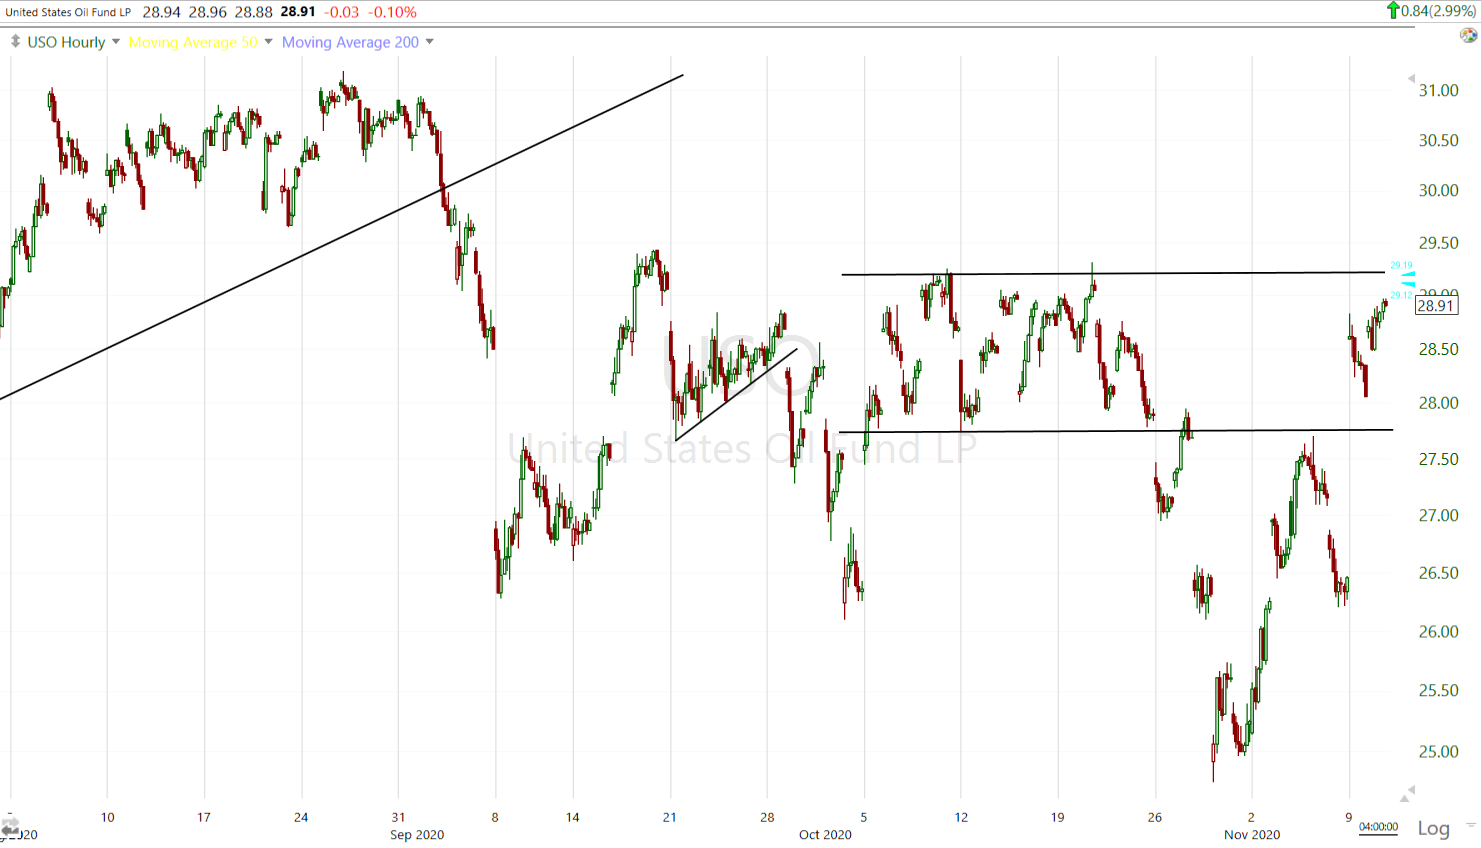 USO (60m) the top of the lateral zone is coming up around $29.25
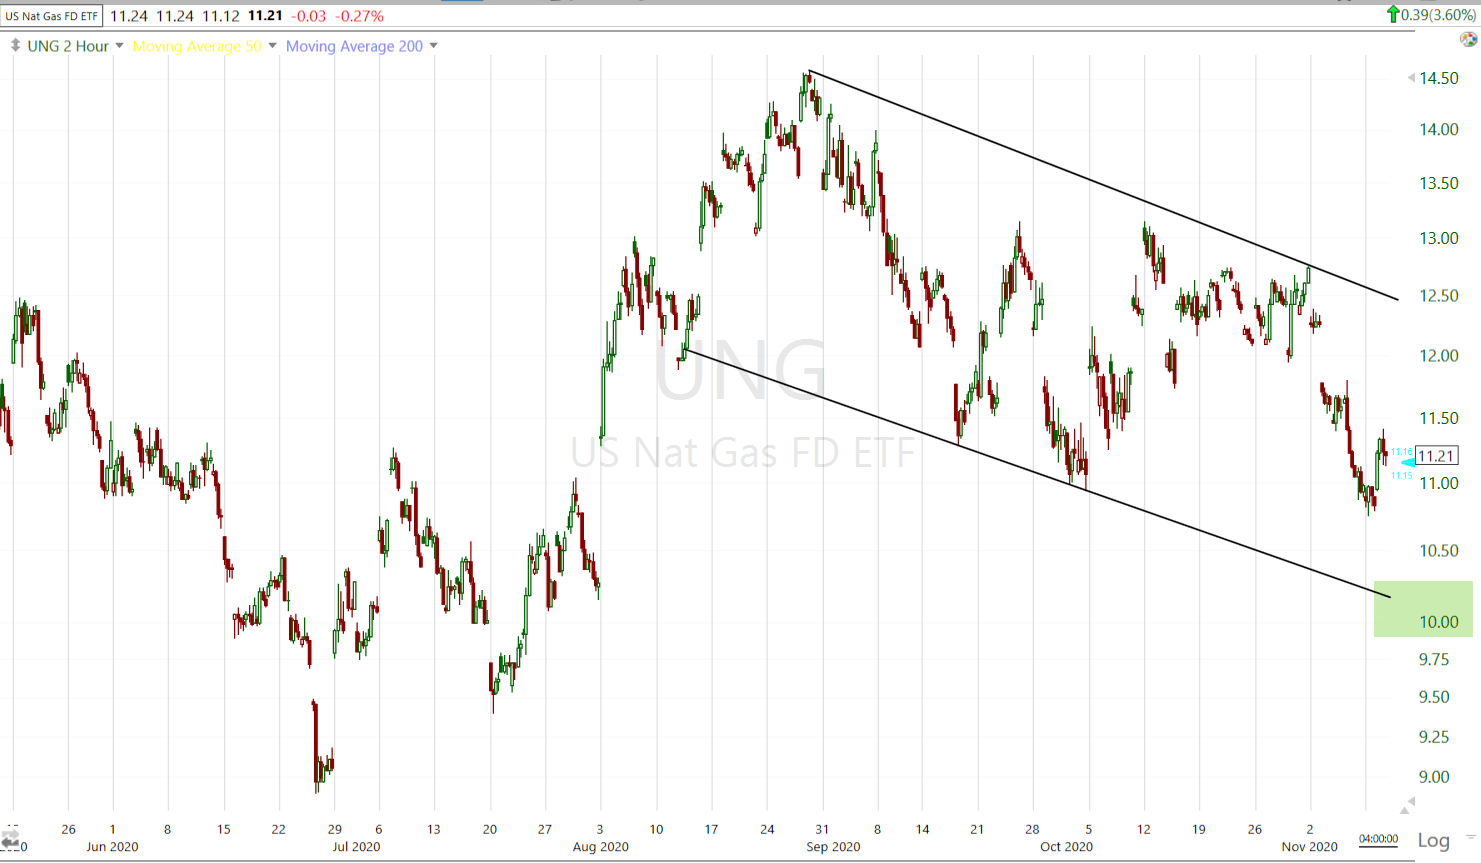
UNG (2 hour) what I’m looking for is UNG to pull back to the lower trend line of this large bull flag, probably toward $10-$10.25, which also fills the early August gap. The more price pulls back, the more profit potential for the long trade. A pull back and successful test to the lower trend line further confirms the bull flag, increases the probability of an accurate upside target, and allows for a much lower risk entry (with more profit potential). If it sets up as I am hoping and I think is reasonable to expect, I believe it will have about 75% of upside for the UNG ETF alone, without any leverage like a leveraged ETF, options or futures.
Gold futures gained +1.2% to $1,876.40/oz, rebounding after their worst daily percentage declines in more than seven years.
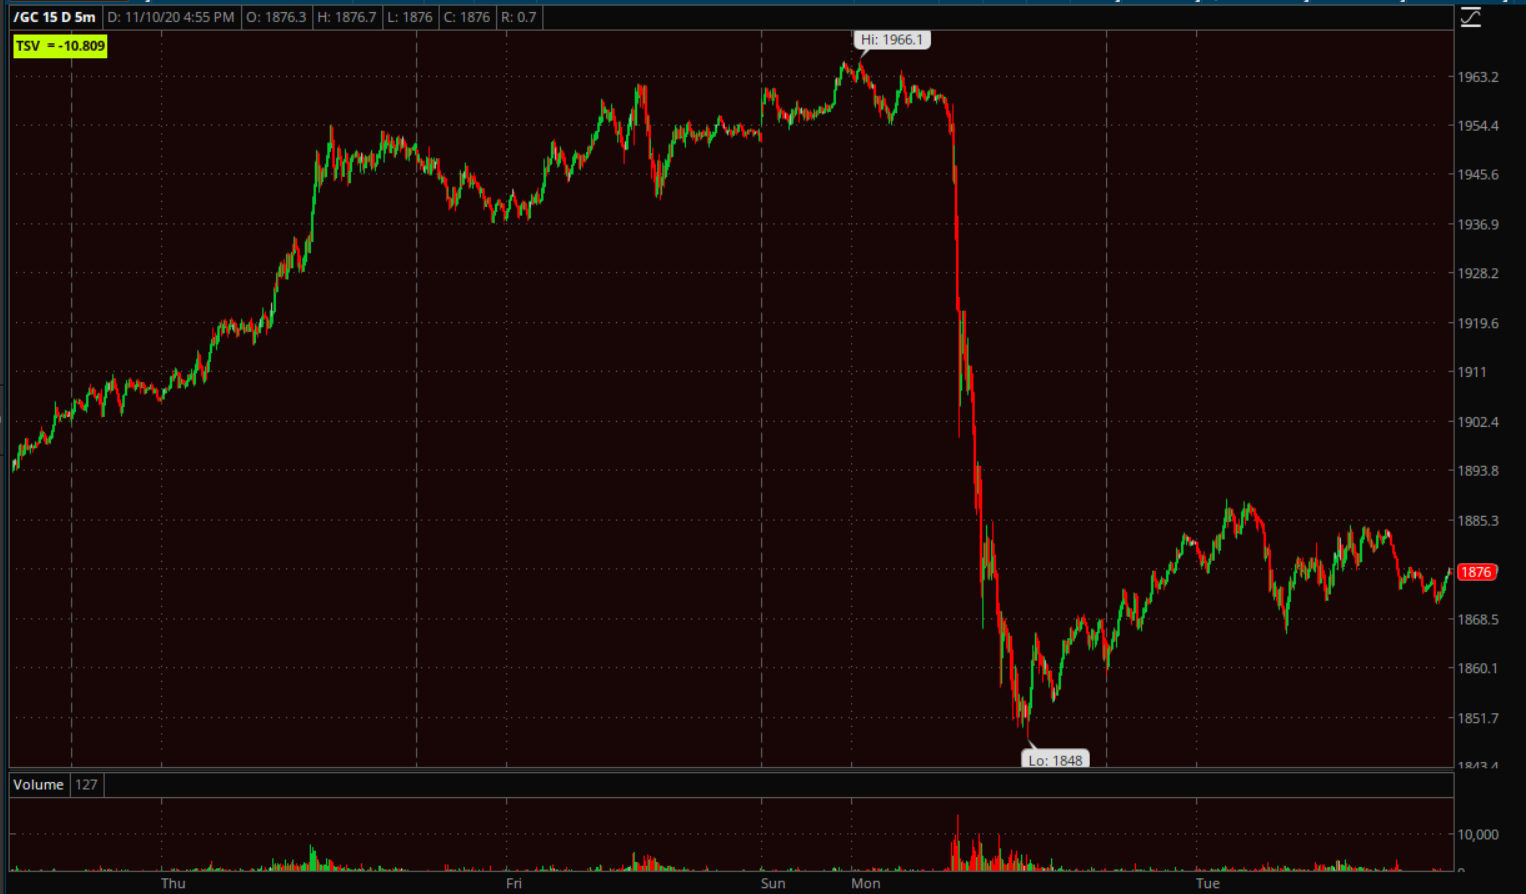 Gold futures (5m) today’s gain is really nothing more than a consolidation with a bearish bias due to the extremely impulsive decline preceding it. Normally I’d say this looks pretty bearish and even be considering a quick short trade, but Gold does have a fairly formidable looking zone of support just below around $1850 from September.
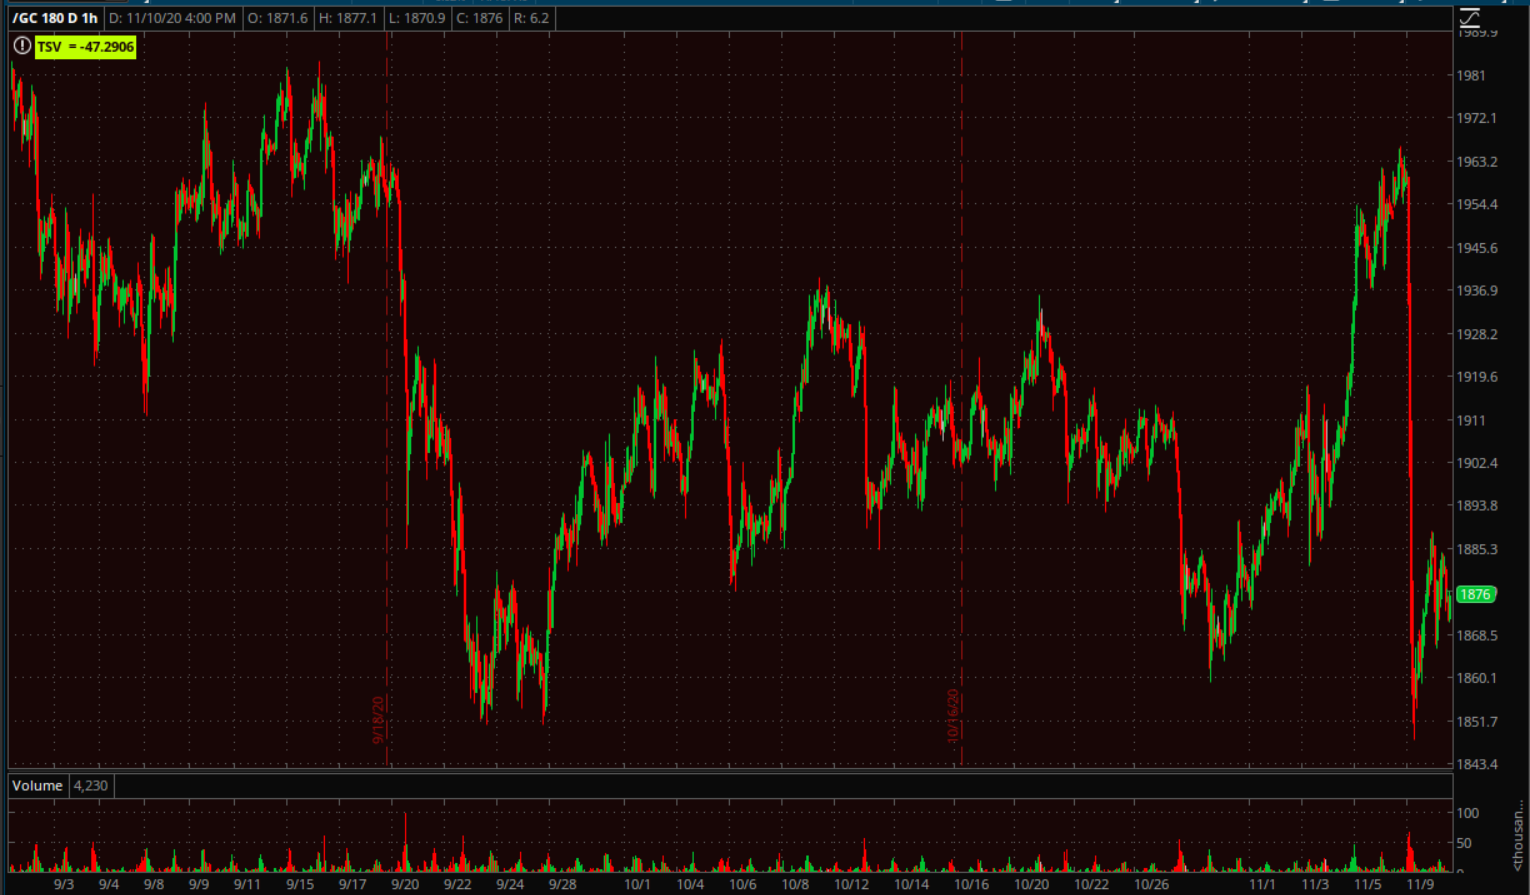 Gold futures (60m) here you can see the one around $1850 tested twice in September and just about where gold found a low yesterday.
To start to transition to a more bullish stance in the very near term, I’d prefer to see gold pull back and test down toward that $1850 area. I would much prefer that than gold continuing to rebound higher without the test. The test would allow for a long entry for those interested with a reasonable stop a little below $1848, which makes the risk side of the risk-reward proposition more appealing. If there has been a lesson from gold over the last 3 months, it has been to be patient and let price prove itself.
As for Bitcoin…
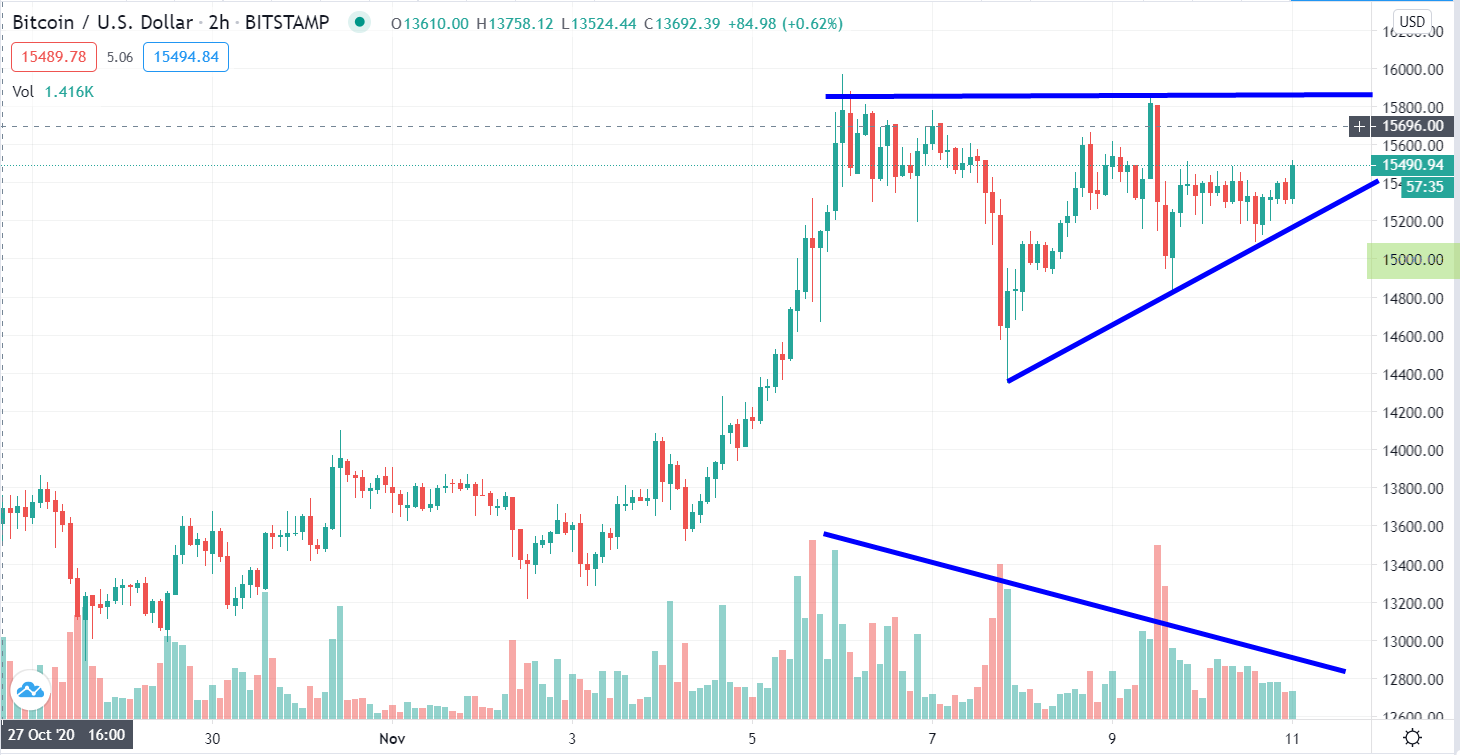 BTC/USD (2 hour) this is a little bit of speculation on my part, but the consolidation taking shape exactly where expected, appears to be a bullish ascending triangle. The upper trend line represents resistance or supply, the upward slanting lower tend line represents buyers getting more confident/aggressive on each dip or pull back. Yesterday’s early volume was high, but the general trend appears to be diminishing volume which would further confirm the consolidation. BTC could drop below $15k and still be constructive (albeit less so near term), but $15k has proven itself an important psychological support level, big whole numbers often are.
BTC has been rallying in legs of approximately +20% before the next consolidation, so I’d expect a breakout above $15,970 to start the next +20% leg up.
Summary
The market remains guided by expectations that the economy and corporate earnings will improve in 2021 due to the medical progress being made to neutralize the coronavirus. Investors are so committed to the idea of a cyclical rotation and economic recovery that rotation attempts are impressive. I can’t find any fault with the idea that a COIVD vaccine is the spark that lights this rotation on fire. The moves in value factors (higher) and Momentum (lower) are historic. On a side note, while Small Cap Russell 2000 has been the poster child or benficiary of these rotation attempts, Russell 2000 itself is not value, in fact it’s more richly valued than any of the other major averages.
Still, a day or even a couple of weeks in these instances is not a trend. I’m not sure what could go wrong with the vaccine narrative, other than the question, “How much has already been priced in?” and I imagine the answer is different depending on an individual specific stock, or the broader market. On the other side, the U.S. reported a record 142,907 new coronavirus infections on Monday and appears poised to reach the most hospitalizations yet later this week. A public vaccination campaign could begin by spring, Health and Human Services Secretary Alex Azar said. That’s a ways off.
The other very real question is what does a vaccine mean for stimulus. Let’s be honest, trillions upon trillions of dollars in Fed and government stimulus is the only thing that lifted stocks since March. While the market may have been frustrated with stimulus negotiations, I don’t think it ever once has considered stimulus may be much smaller than expected. Just weeks ago the narrative was, “Well we might not get stimulus before the election, but it will be so much bigger and retroactive after a blue wave sweep”.
Just today…
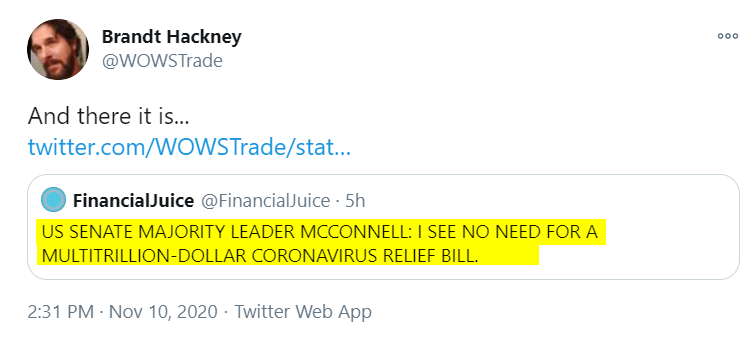
That’s to say nothing of the Fed.
Then the market is going to have to price in what a Biden administration looks like, and can realistically get done. The U.S. Senate appears as if it will remain in Republican control, but there are a couple of races in Georgia that won’t be decided until January.
I wouldn’t fight the cyclical rotation, and I might even do some buying of pull backs, but not chasing. Given the history of these rotations, not just recently, but the last decade, I would be open and aware of possibilities that it doesn’t stick. The price action in mega-caps looks like we should expect more selling, but with technical support nearby I’ll wait for bounce or flag to develop more. The 3C signals for my SPY short are there, I have no reason to exit the trade which I envisioned to last a few weeks. I’m very happy with the way Bitcoin/GBTC is progressing, and believe me, I was not a fan of crypto during the 2017 mania. It has been price action over the last 6 months that got me interested.
Overnight
S&P futures are +0.1% and doing the same thing they’ve been doing since very early Tuesday morning.
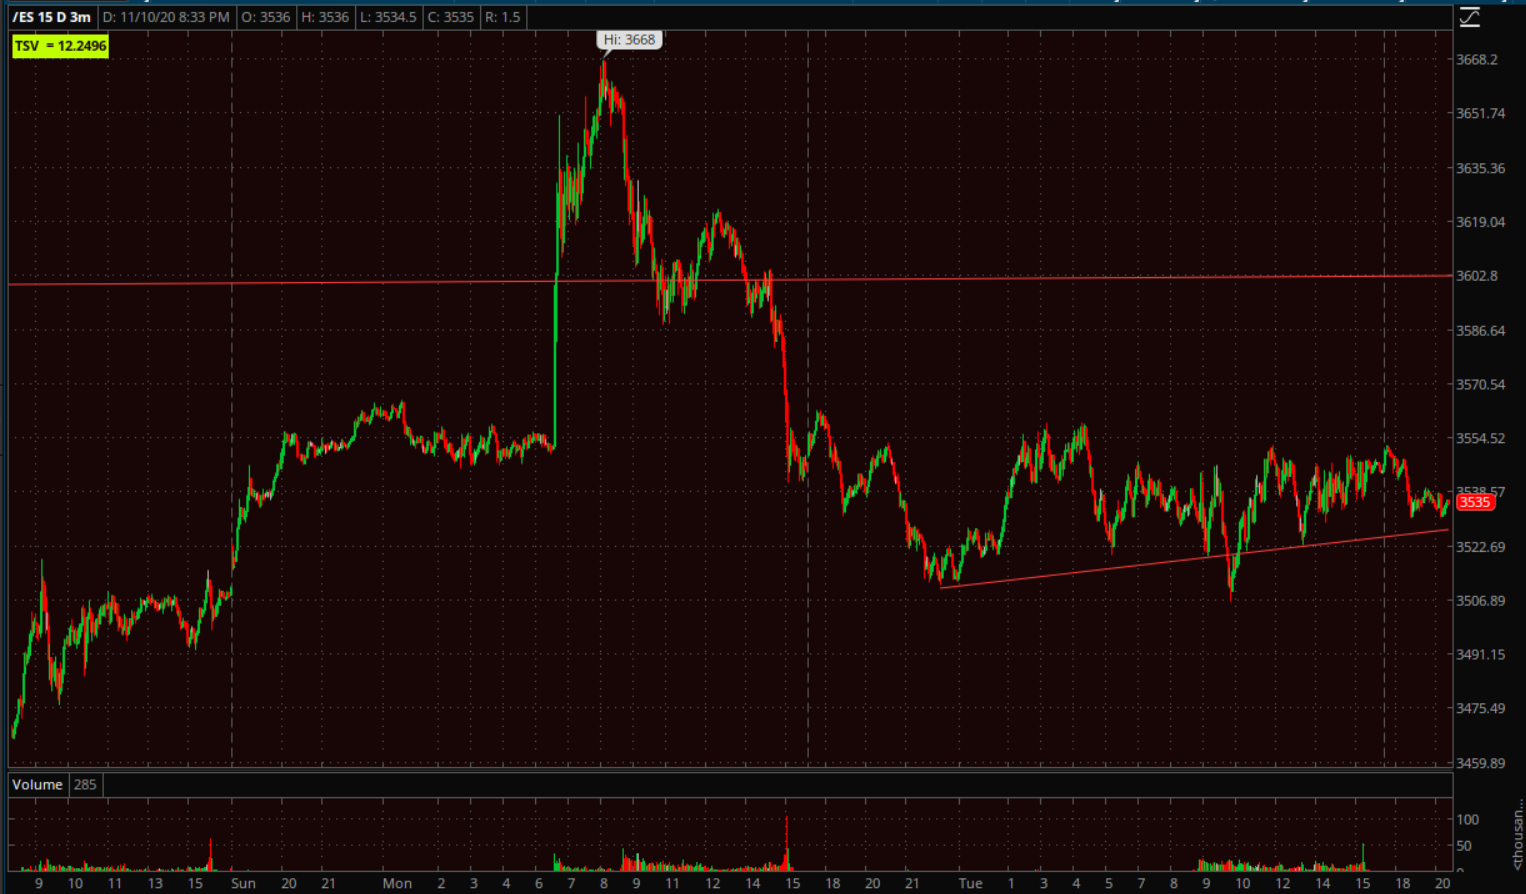
S&P futures (3m) consolidating with a bearish bias, under the broadening top trend line. I expect a high probability of prices ping-ponging between the consolidation trend and the BRT trend. If prices do test up to the BRT trend line, I may use that to add SPY short exposure that I trimmed back yesterday.
NASDAQ futures were -0.1%, as of this capture, but now +0.45% with a change on 3C since the cash close.
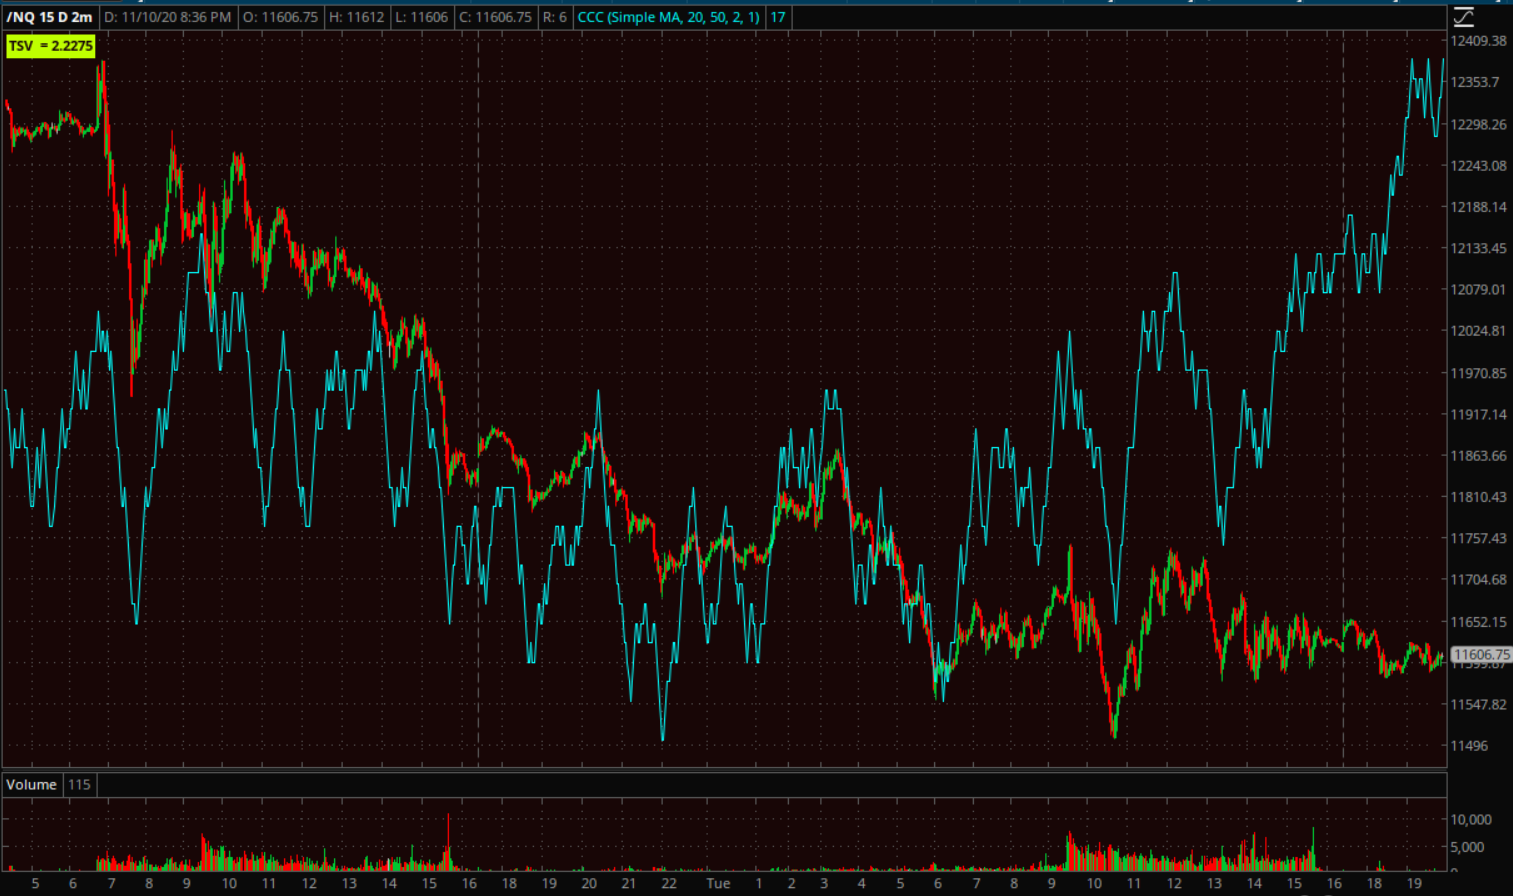
NASDAQ 100 futures (2m) 3C positively diverging from price. This is likely technical buyers with the 50-day just below. Technical buying here isn’t unexpected. To put it in some context…
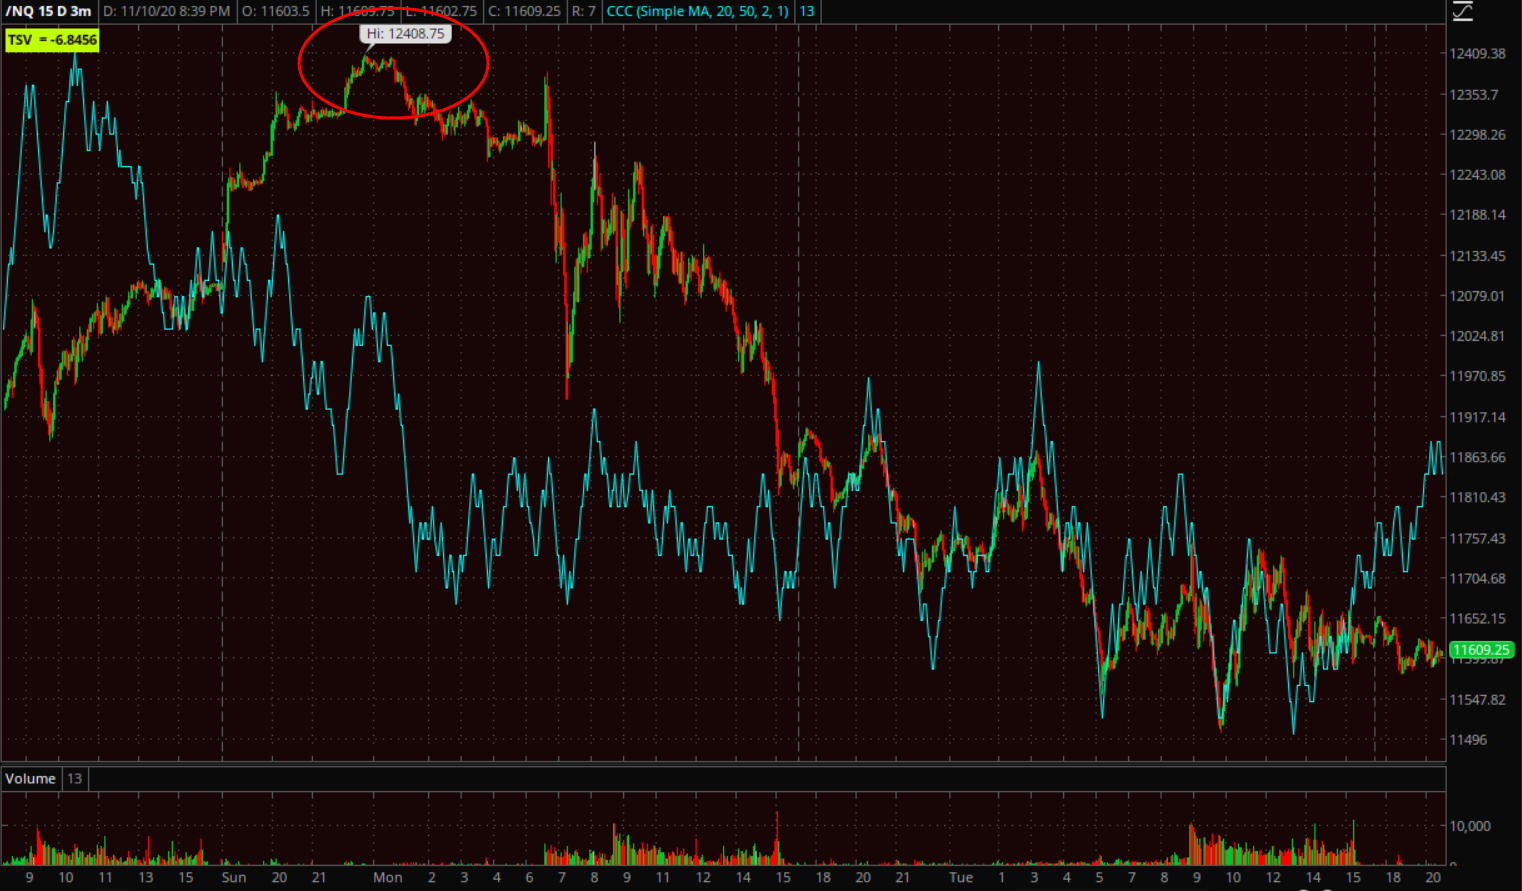 NASDAQ futures (3m). Recall that NASDAQ led the way higher Sunday night after media declared Joe Biden, “President Elect”, but NASDAQ was slammed lower before the open Monday on the vaccine news as Russell 2000 soared +7% limit up in minutes. The point is, notice the negative 3C divergence into Sunday night’s highs. And the positive divergence on the 2 min chart above is to the far right in some context.
VIX futures are pretty quiet on 3C charts tonight.
The Dollar Index is down -0.1%, that should help index futures overnight. WTI crude futures are up +0.9%.
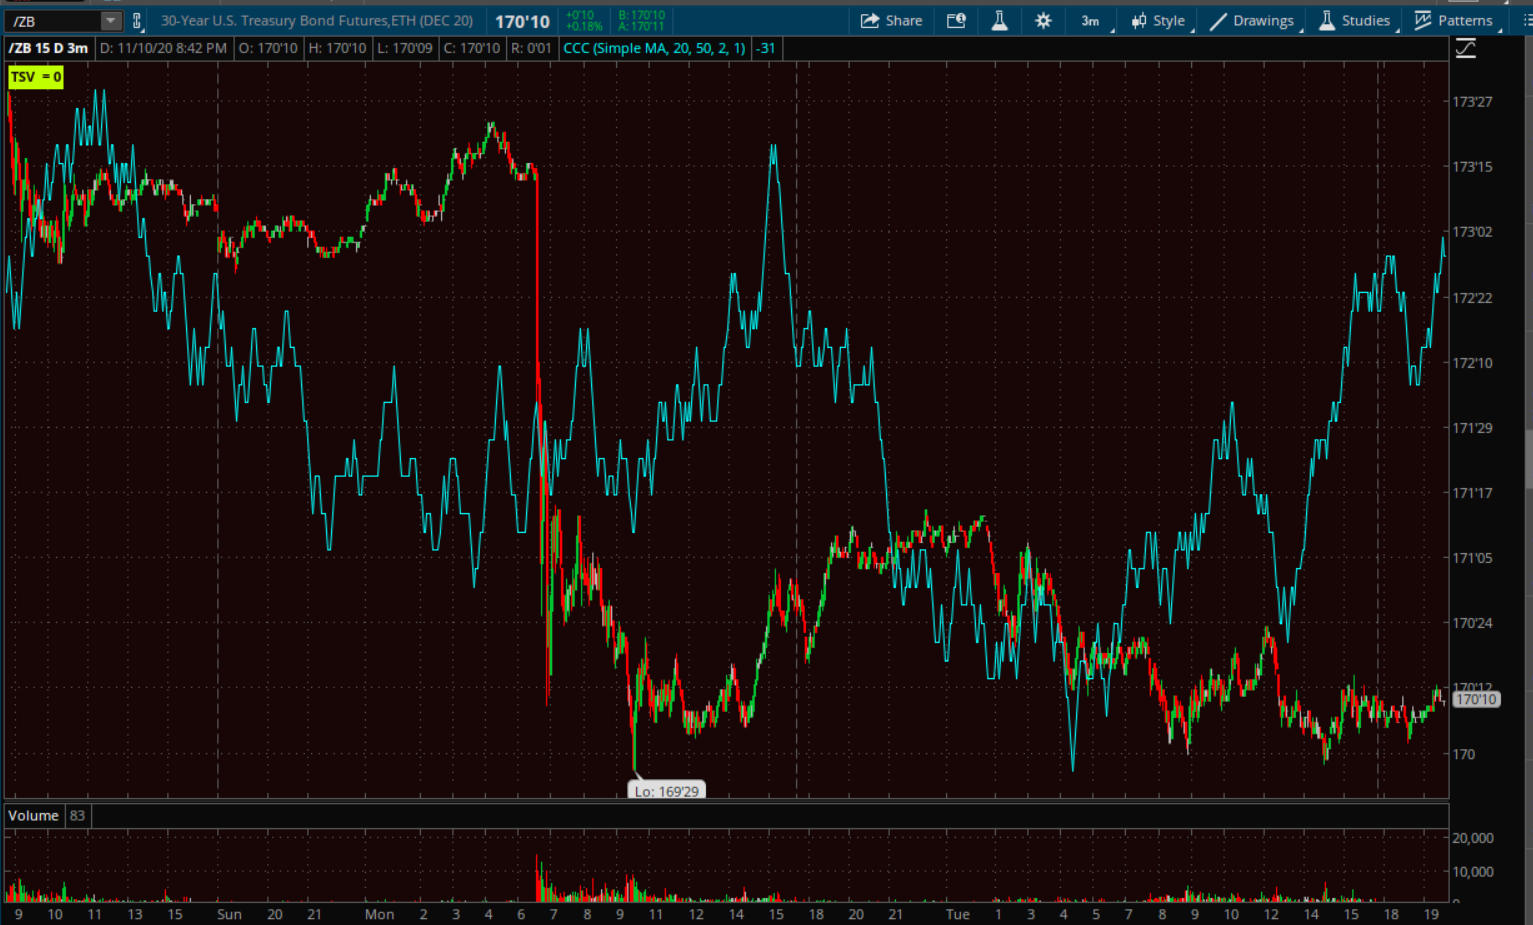 30-year Treasury futures (3m) 3C positively diverging at the test of election night lows. If the chart strengthens, it could have a pretty dramatic impact short term on the reflation stocks that have soared this week (on top of last week’s gains) banks or small caps for example. At this point I’d just call this evidence of some buyers at support but a change here could make for really interesting trade fading some of the extensive gains in cyclicals/value. On a side note, take a look at the first couple of charts of this post. When the value rotation fails (or appears that way), traders run right back to what they know… the mega-caps, which makes the NQ 3C signal tonight of interest.
There’s a little upside movement in the safe-haven yen tonight, but not enough to be of interest yet. In the very short term USD/JPY above $105.50 is bullish for risk sentiment/stocks, and below $105 is more bearish for risk sentiment. It’s actually a neat, clean little consolidation between the two levels so we may see some movement there sooner than later.
The MBA mortgage Applications Index is out on Wednesday.
- European Central Bank President Christine Lagarde, Bank of England Governor Andrew Bailey and Federal Reserve Chairman Jerome Powell are among the speakers Thursday at an online ECB Forum entitled “Central Banks in a Shifting World.”
- U.S. CPI data for October is due on Thursday.
- Finance ministers and central bankers from the Group of 20 hold an extraordinary meeting Friday to discuss bolder action to help poor nations struggling to repay their debts.