Daily Stock Market Wrap
The market today summarized in a few words… Treading water. Perhaps due to the Fed policy decision and the Consumer Price Index for November due out tomorrow. And this on a day with quite a few trade related headlines starting before the open.
According to The Wall Street Journal, a tariff delay would come as negotiators work to ensure China commits to purchasing more U.S. farm goods. A follow-up report from the South China Morning Post indicated that the delay is likely, but NEC Director Kudlow responded that the tariffs are still on the table. Mr. Kudlow could not confirm if the tariffs will be delayed.
This unresolved trade front was contrasted with House Speaker Pelosi announcing that a USMCA deal has been reached. Of course, the market has always been more concerned about a U.S.-China trade deal than a USMCA deal, so the latter didn’t provide much enthusiasm in the market.
Senate leader Mitch McConnell said that the Senate would not take up USMCA until after they took up impeachment. Impeachment talk remains a non-factor.
Averages
S&P 500 ⇩ -0.11%
NASDAQ ⇩ -0.10 %
DOW JONES ⇩ -0.10 %
RUSSELL 2000 ⇧ 0.13 %
Not much happened on the daily charts.
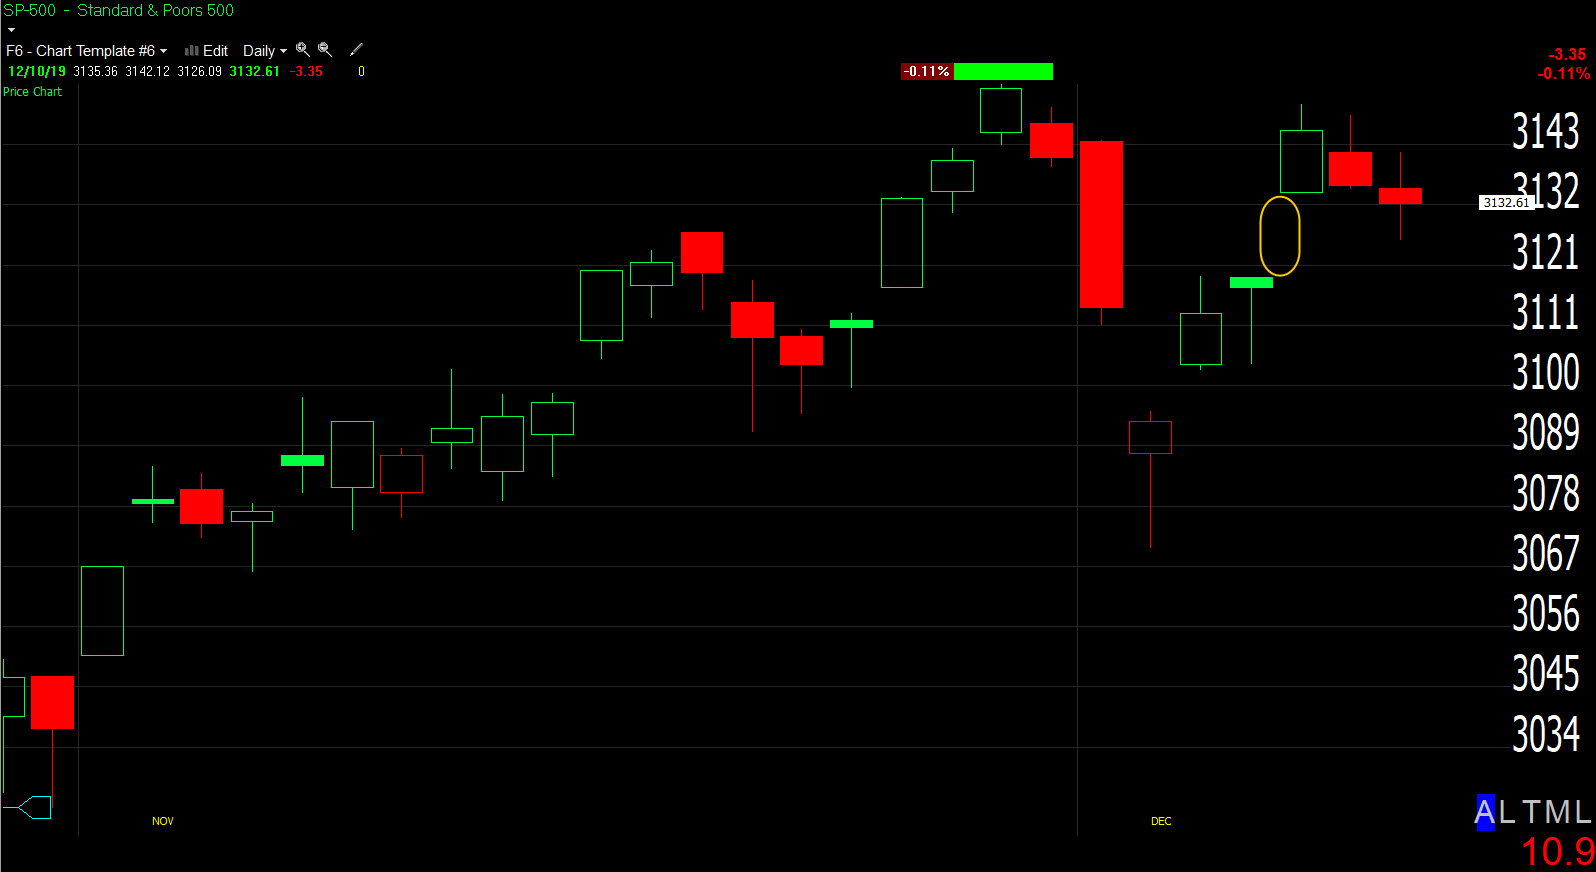 SP-500 (daily) Friday’s gap in yellow is still open.
Small Caps’ price action looks almost identical to the July high. S&P looks similar to July as well.
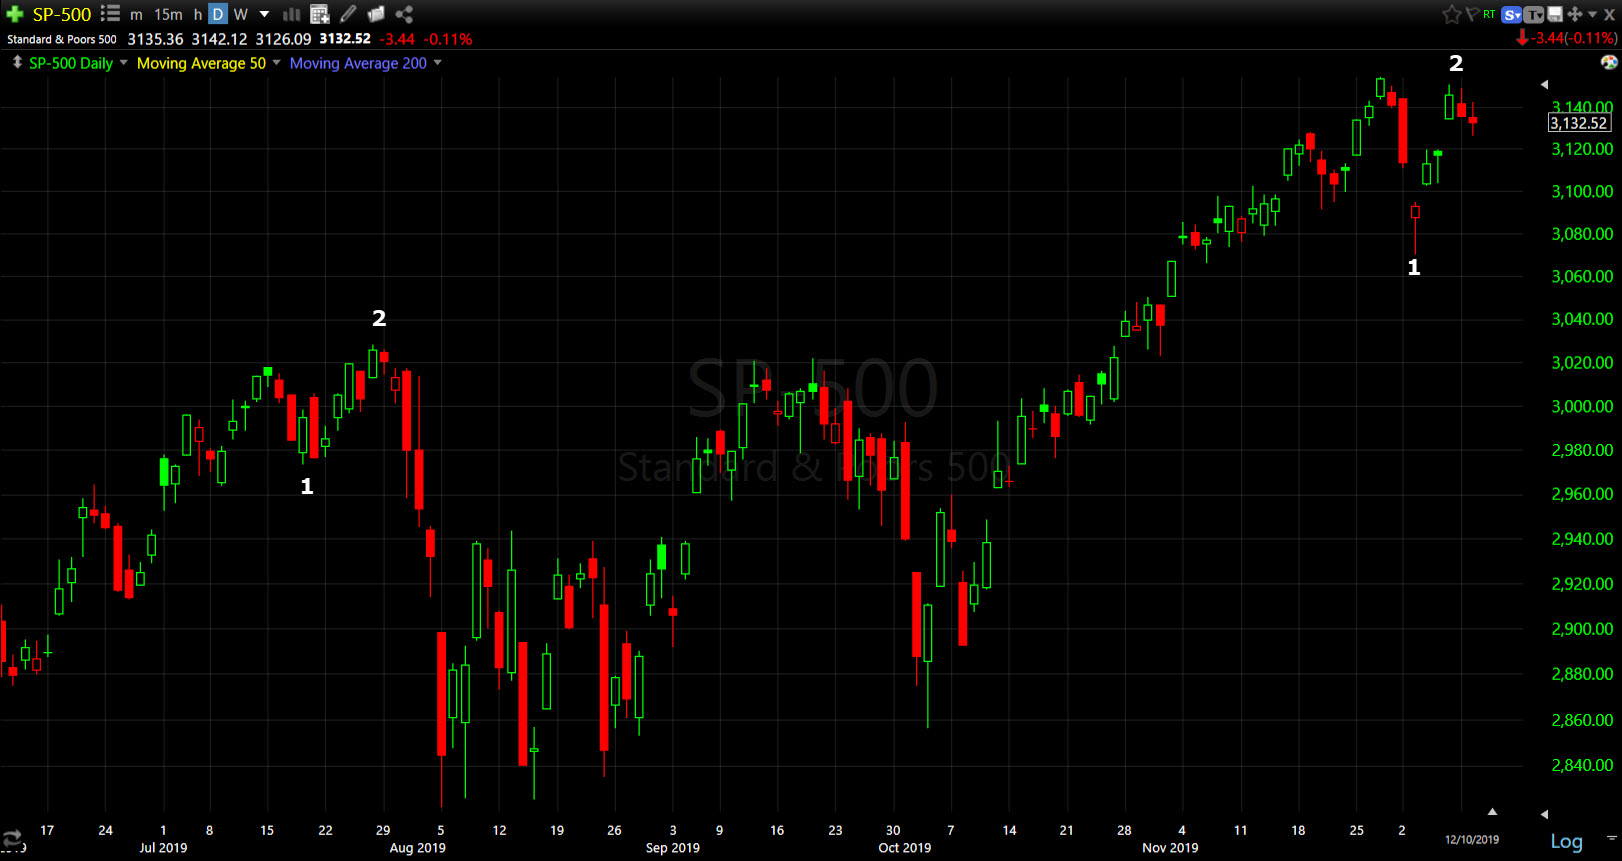
SP-500 (daily) the similarity is that in both cases the primary rally trend was broken (1), then price corrected (2) in similar fashion. The July high was also just before the FOMC meeting 3 days later.
Intraday some trends were broken, but not definitively.
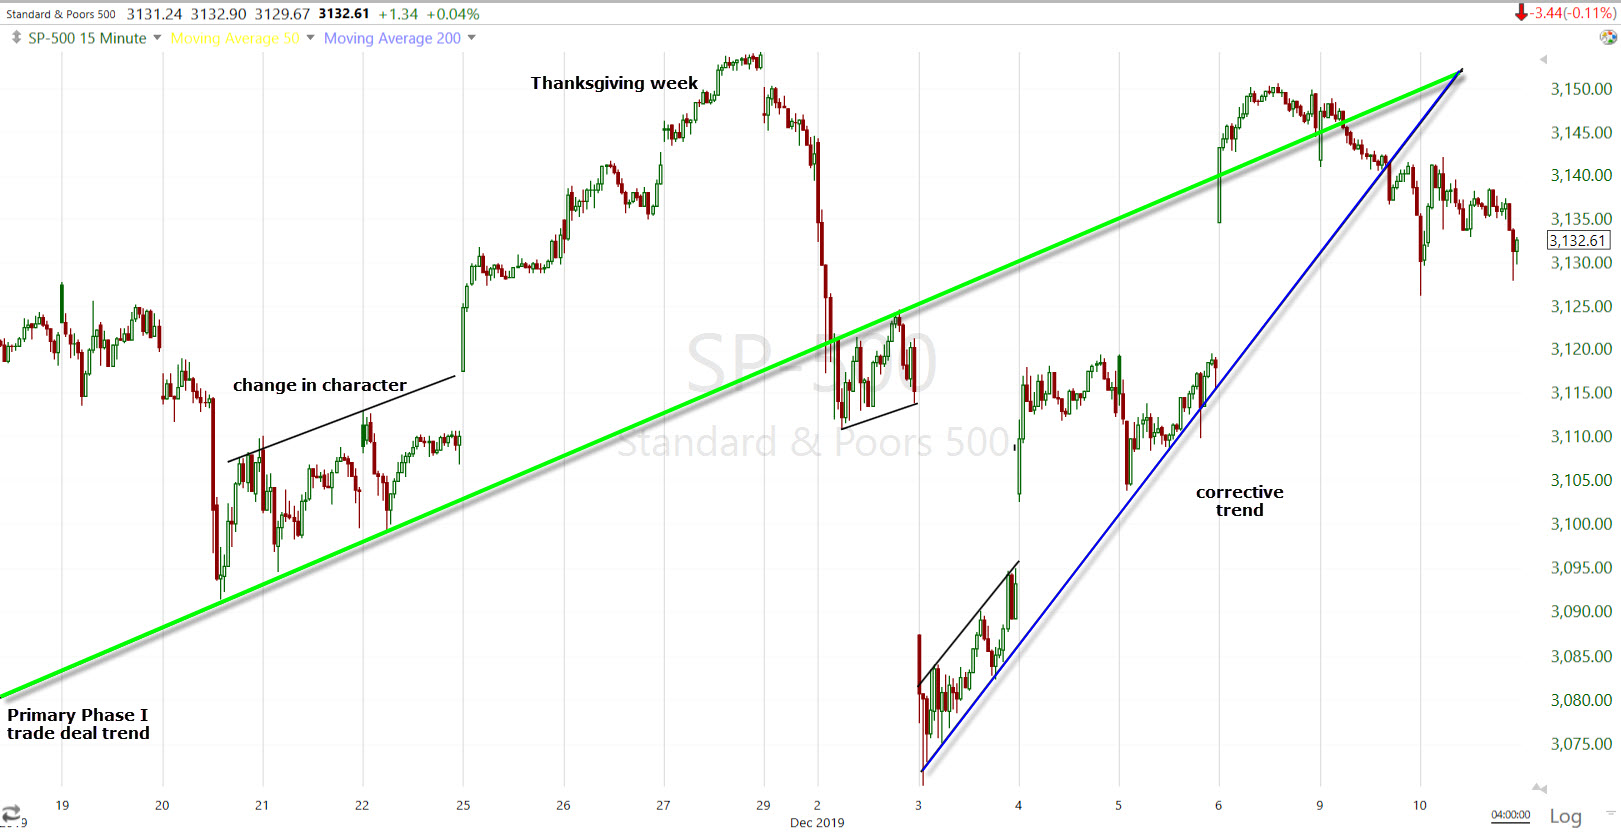 SP-500 (15m) closed above the primary trend (green) last Friday, after breaking it Monday and Tuesday. S&P slipped below both the primary and corrective trend (blue). A couple of S&P sectors broke the corrective trend more clearly today, but not impulsively.
From this morning’s Early Update,
“The major averages begin the day extending yesterday’s losses with the S&P moving toward yesterday’s yuan-implied target of $3030
The sellers were still apparent after the open, taking the S&P down in another incremental -0.2% measured move decline. Said another way, dialing back risk exposure in deliberate, small steps to reduce exposure without upsetting the broader market”
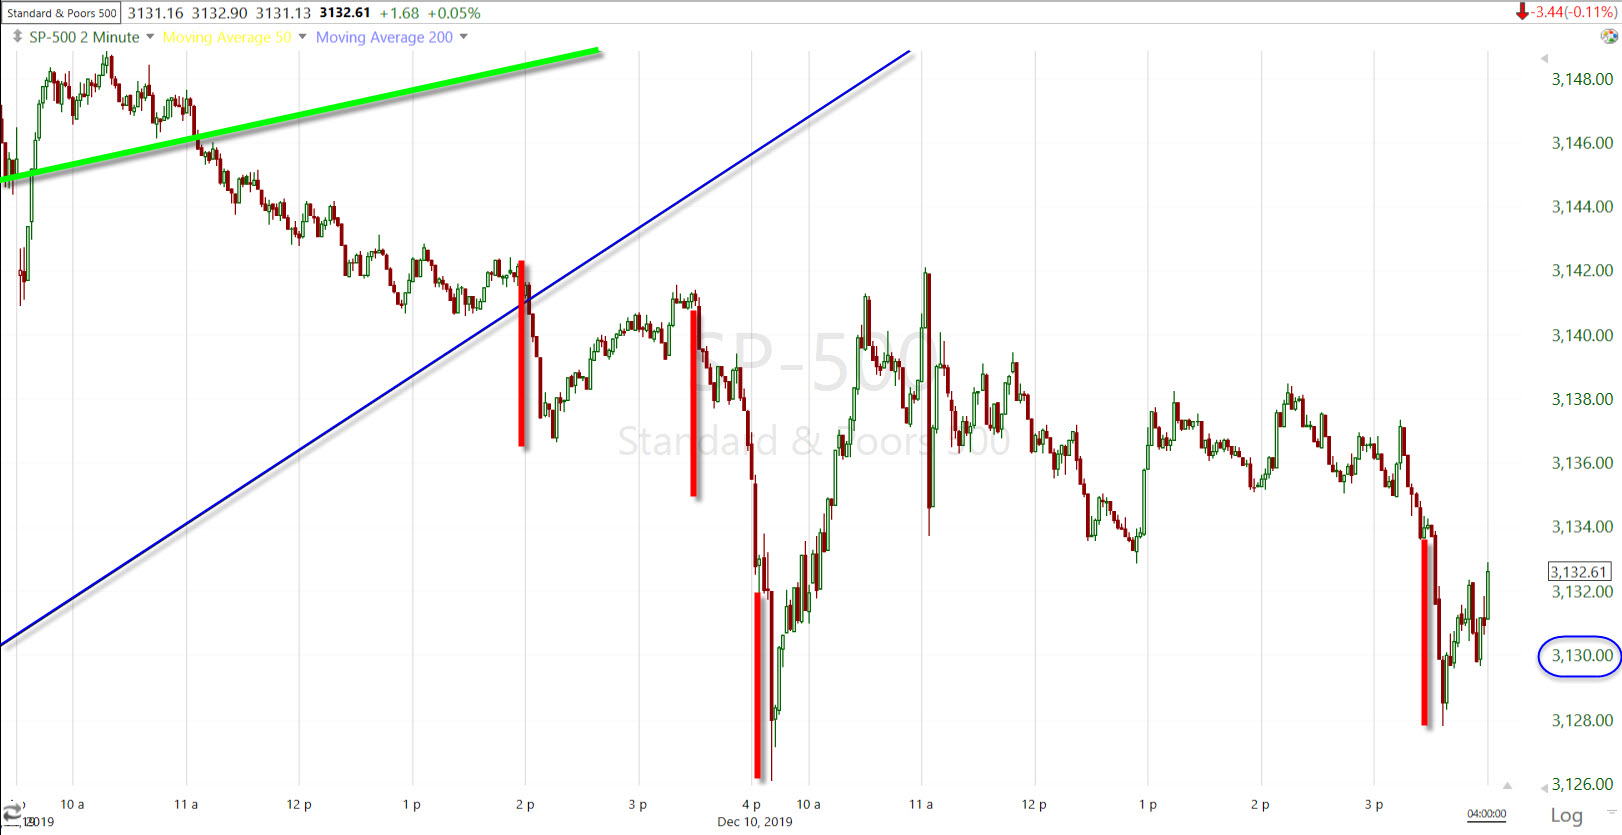 SP-500 (2m this week) the primary trend is green, the corrective in blue. After the open prices stepped down in a similar fashion to yesterday’s small -0.2% measured moves, and once again into the close. The S&P pulled back to what the Chinese yuan reflected Monday.
From Monday’s Daily Wrap
“The Chinese yuan, at least in the very near-term from Friday, reflects a level more like $3130 for the S&P”.
Despite several trade headlines that probably would have sent the S&P 1% higher 3 weeks ago, the averages barely reacted. It seems that the stock market may be following in the bond and currency market’s more skeptical footsteps. The Chinese yuan reacted to a couple of headlines today, but just barely.
Volatility
Considering the more than 16% gain Monday, volatility looked softer on 3C chart this morning, but only lost -1.13%. VVIX remains elevated (101) above 100.
This afternoon as yield curves flattened and 3C signals in index futures deteriorated into the close, VXX posted positive signals and has been overall positive for well over a week.
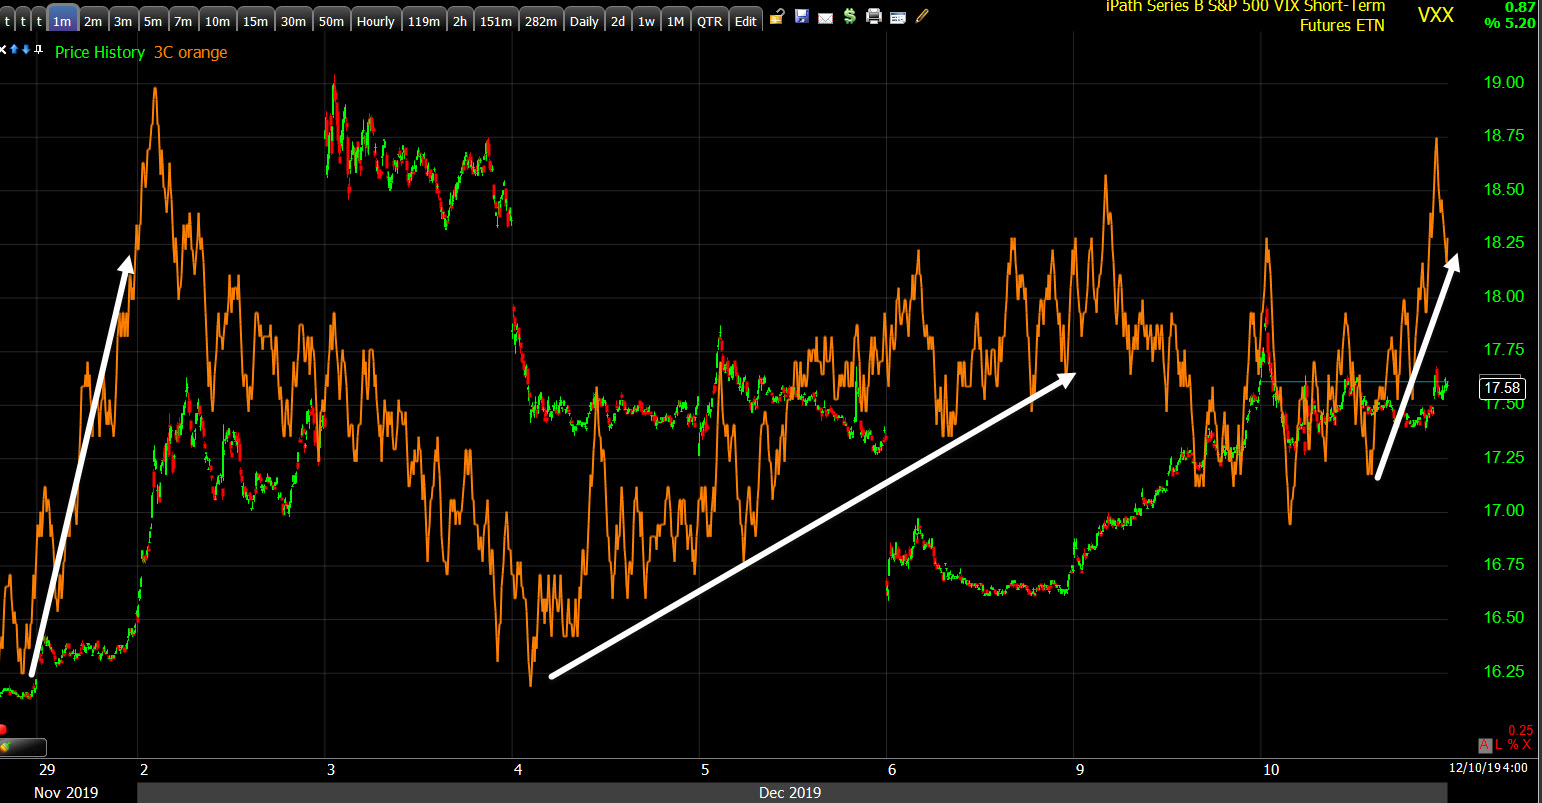
VXX (1m) strong positive divergence on Black Friday (11/29), followed by an explosive move higher, and positively divergent 3C signals last week, and toward today’s close.
The moves Monday in volatility were highly unusual and clearly reflect nervousness and aggressive hedging of downside equity risk. There is further evidence of this aggressive hedging in the elevated CBOE SKEW Index, indicating that market participants are buying protection against extreme outlier or equity downside tail risk (two or more standard deviations below the mean – i.e.- stock market crash or black swan event).
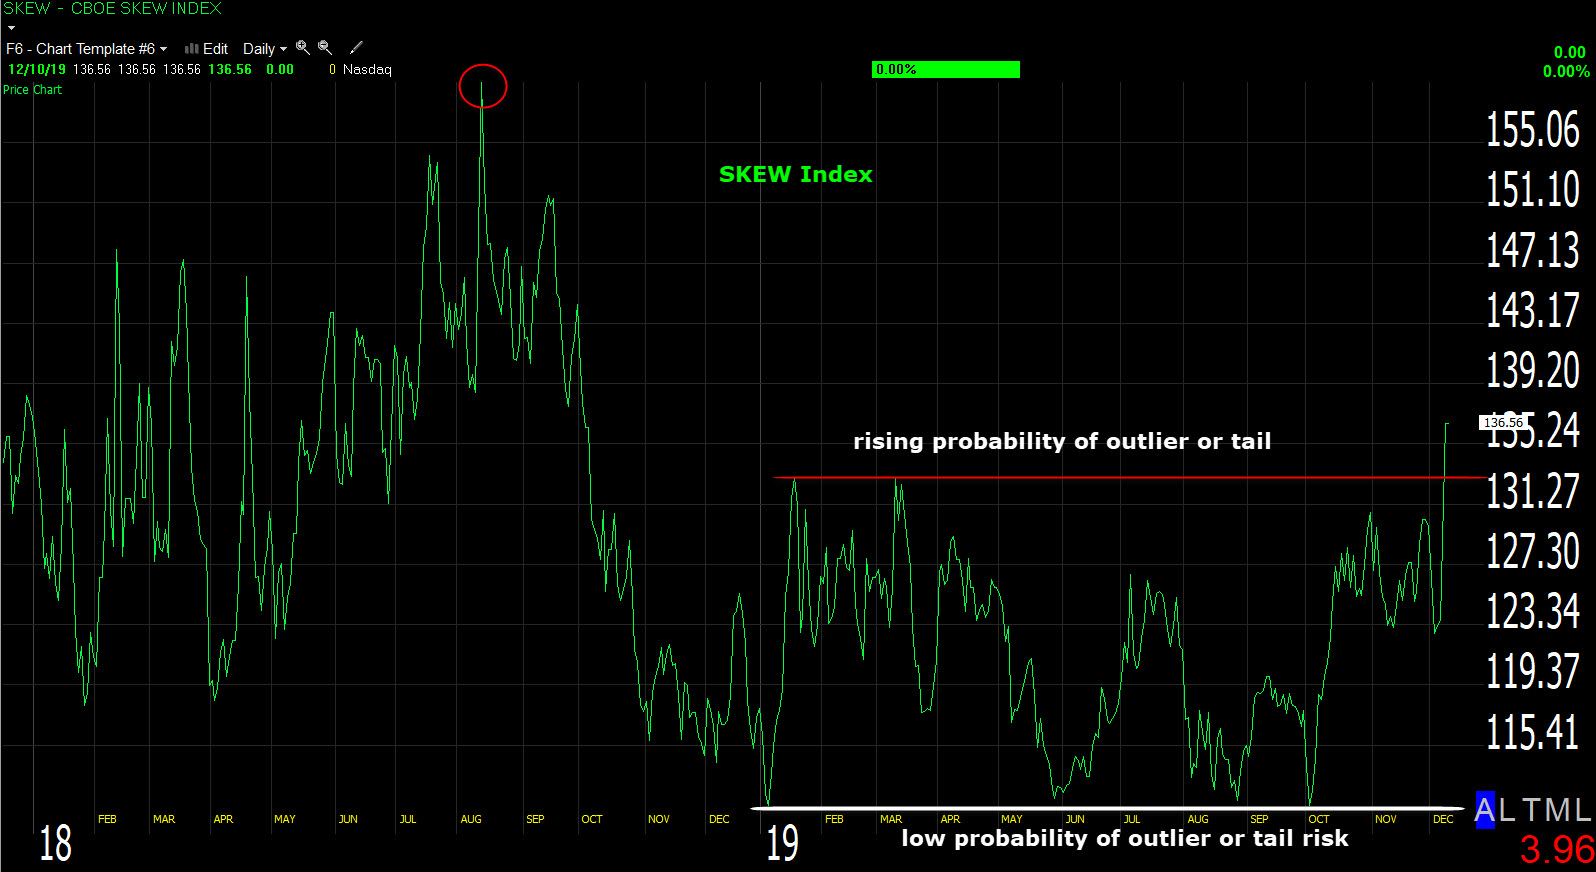
CBOE SKEW Index (daily) SKEW has been fairly low most of the year. It runs between 100 and 150, 100 indicating normal distribution or low probability of outlier tail risks of more than 2 standard deviations below the mean. The highest print in SKEW’s history was August 13th 2018 at $159.03. Some of you may remember that. This highly unusual print was about 6 weeks before the 20% market sell-off in 2018.
The higher the SKEW, the higher the perceived probability of a black swan event. Over the last 5 days SKEW has jumped from $122 to $136, indicating aggressive hedging of perceived outlier or black-swan type of risk in the equity market.
S&P sectors
S&P sectors reflected the same indecisive tone as the averages today… treading water. Most S&P 500 sectors wavered near their unchanged marks throughout the session. The Real Estate and Materials sectors showed weakness with relatively larger declines, while the Energy and Health Care sectors finished higher, but none showed meaningful relative strength.
Materials ⇩ -0.60 %
Energy ⇧ 0.20 %
Financials ⇧ 0.03 %
Industrial ⇩ -0.12 %
Technology ⇧ 0.08 %
Consumer Staples ⇩ -0.32 %
Utilities ⇩ -0.02 %
Health Care ⇧ 0.22 %
Consumer Discretionary ⇩ -0.17 %
Real Estate ⇩ -0.70 %
Communications ⇩ -0.34 %
Since not much has happened since the weekend video, as you might imagine, the technical outlook of price action is unchanged. Here are some sector charts for general context.
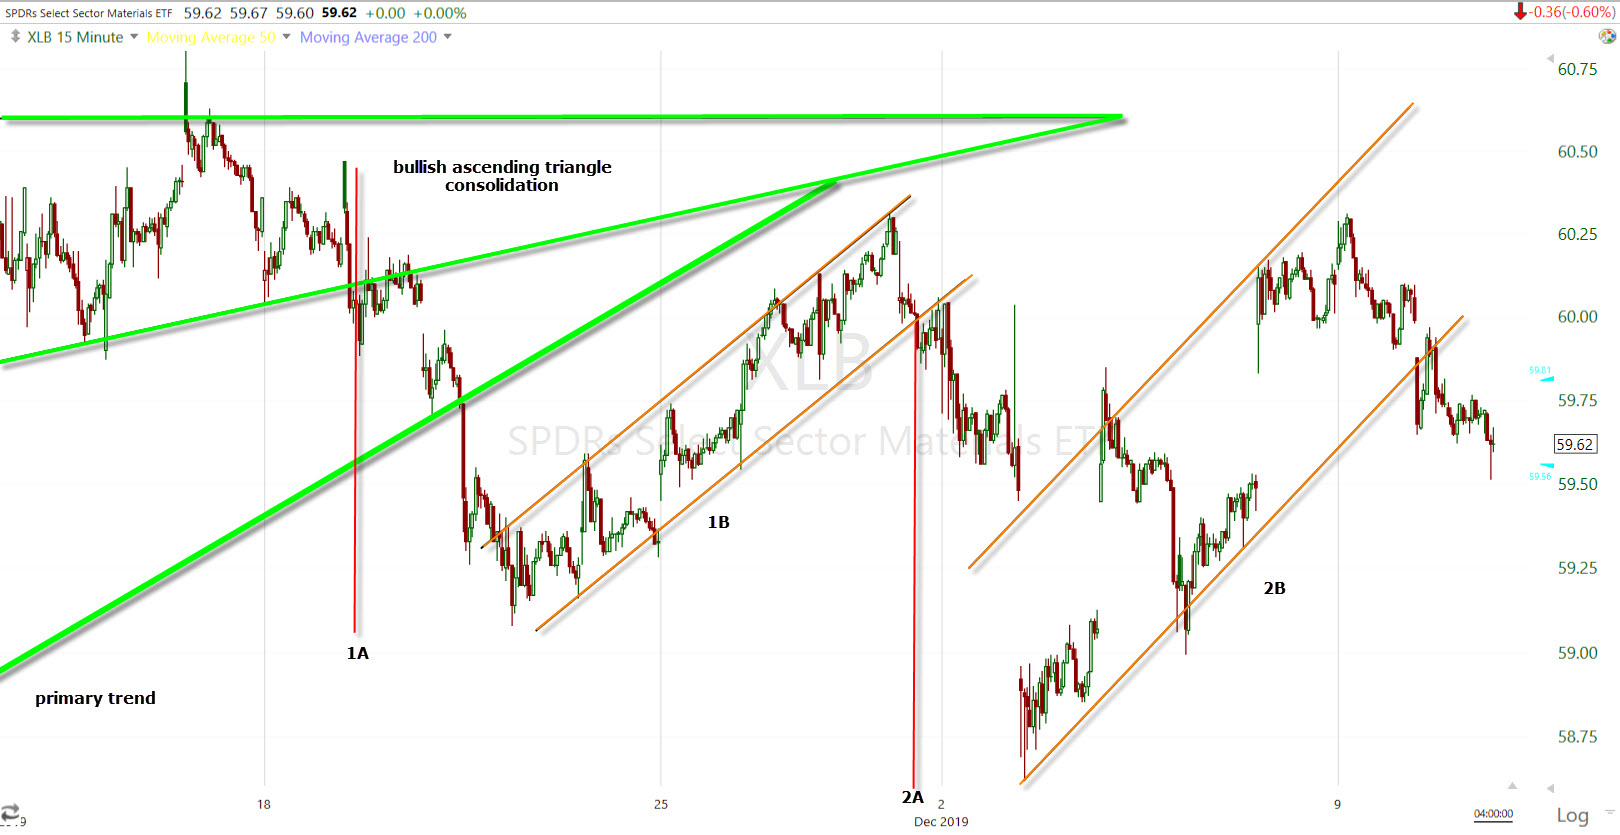 Materials (15m) I marked the flag-like consolidations in orange as they are not perfect bear flags, but are similar and are preceded by equal legs down at 1A and 2A making them bearish consolidations. Materials slipped under the consolidation trend from last Tuesday’s low.
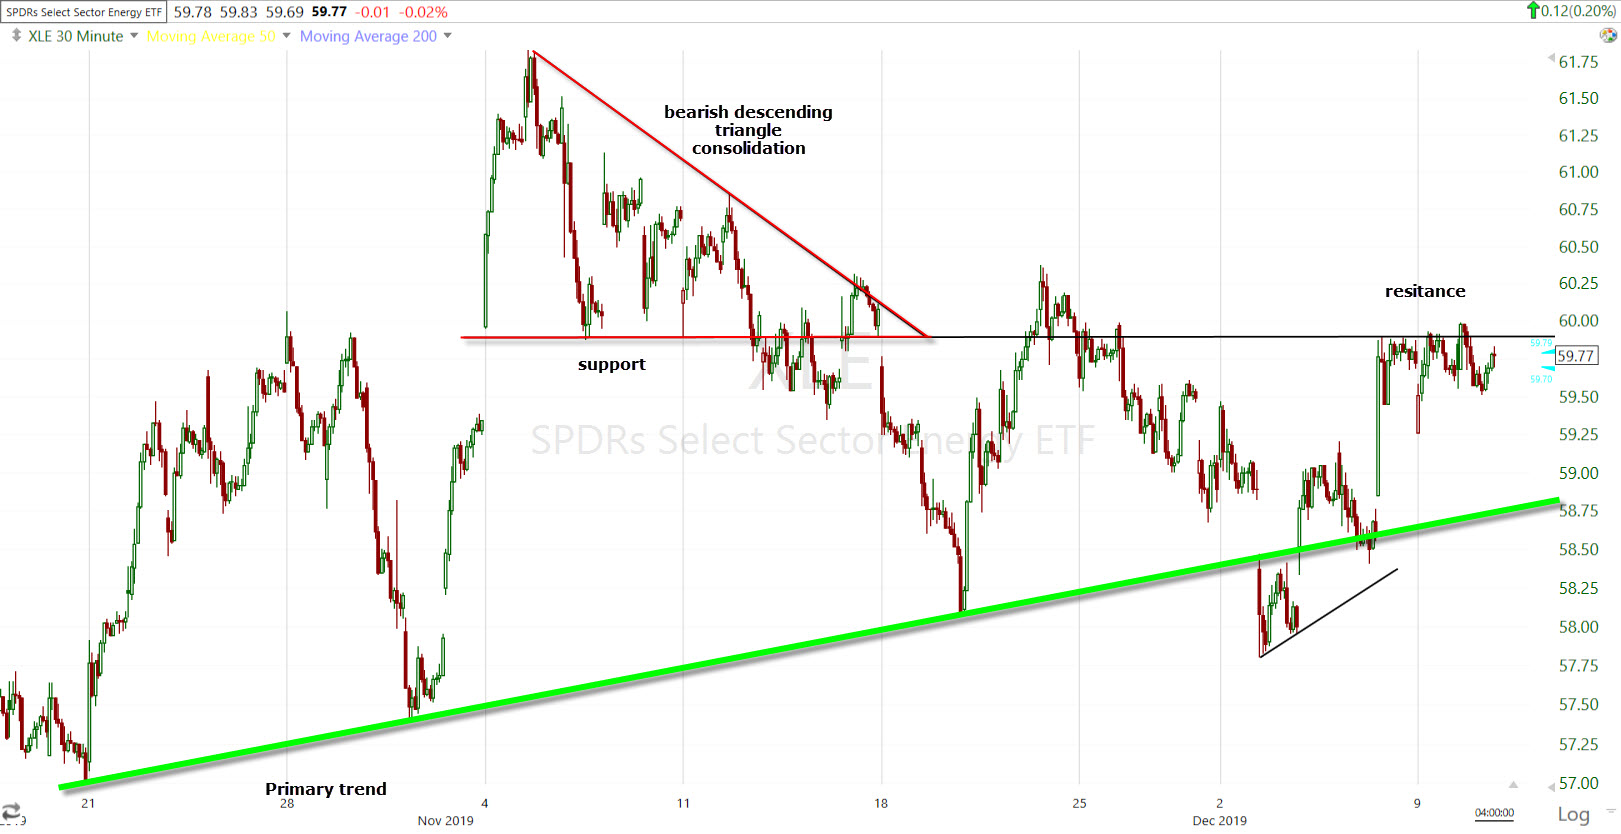 Energy (15m) has held the primary up trend, but is finding resistance at former support from a bearish descending triangle that was given the benefit of the doubt as the preceding trend was up. See Crude oil’s (USO) broadening formation below.
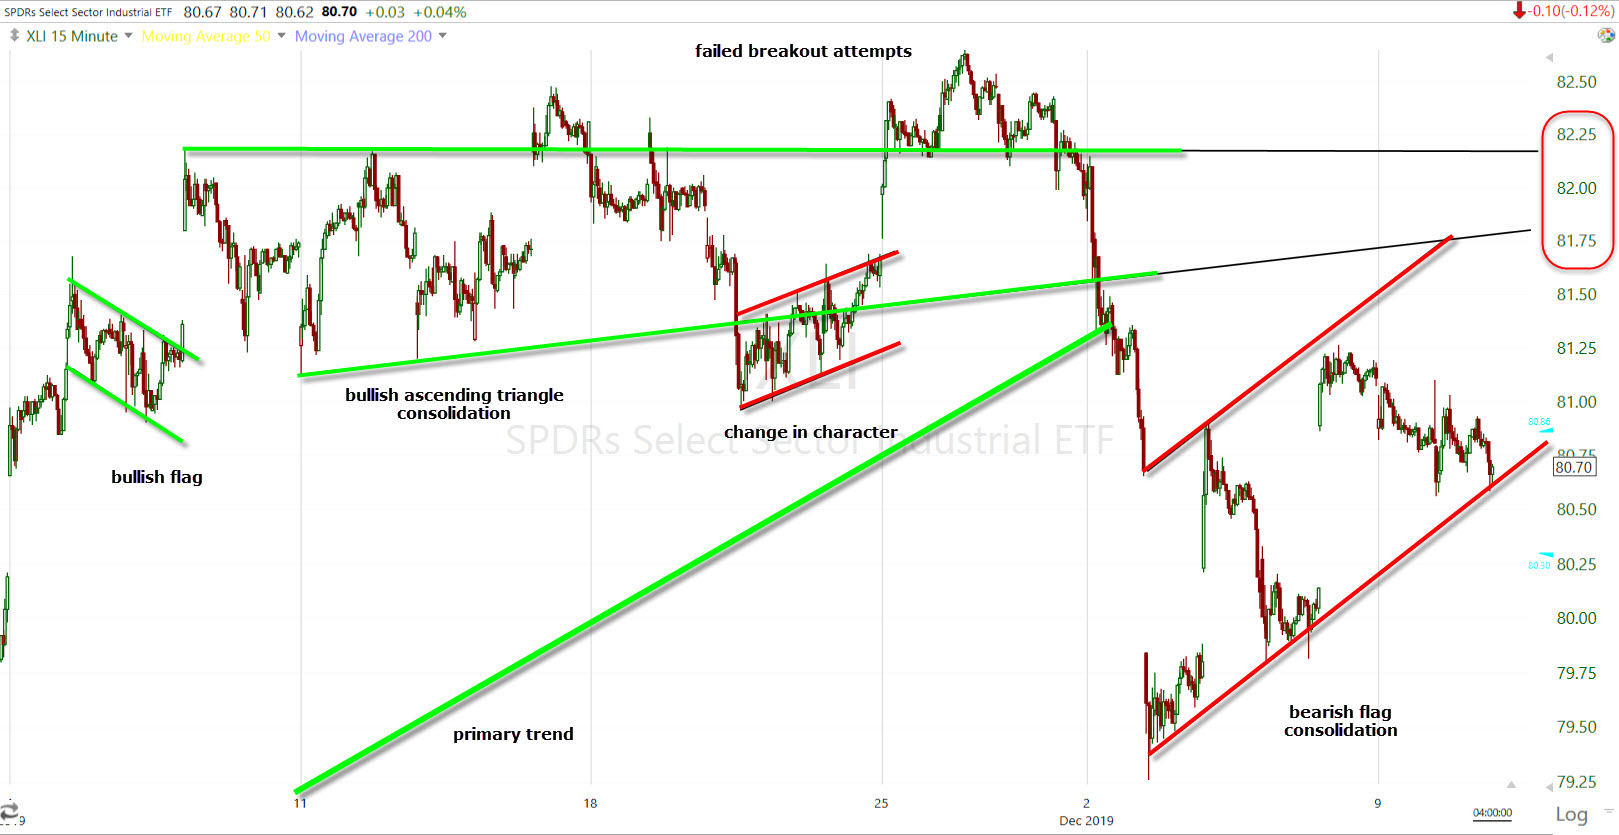 Industrials (15m) from bullish price action, to a transitional change in character, a decline last week and clear bear flag correction/consolidation since. The $81.75 to $82.25 area will likely provide resistance. Unlike Materials above, Industrials did not break under the bear flag and remains in consolidation.
![]() Dow Transports (30m) from a bullish flag to a decline, a test of former support and a second decline last week. Trannies have traded in a bearish flag like the Industrial sector with 10,950 to 11,000 likely resistance. Compared to the Dow Industrials, Dow Transports have shown relative weakness since November 8th, a date that pop up over and over again. This was around the time that a Chinese trade headline was mistranslated. The market rallied on the mistranslation that the U.S. and China agreed to remove all tariffs, while the bond and currency market negatively diverged from the S&P. The actual translation was China said that the U.S. would have to remove all tariffs for a phase 1 trade deal.
Dow Transports (30m) from a bullish flag to a decline, a test of former support and a second decline last week. Trannies have traded in a bearish flag like the Industrial sector with 10,950 to 11,000 likely resistance. Compared to the Dow Industrials, Dow Transports have shown relative weakness since November 8th, a date that pop up over and over again. This was around the time that a Chinese trade headline was mistranslated. The market rallied on the mistranslation that the U.S. and China agreed to remove all tariffs, while the bond and currency market negatively diverged from the S&P. The actual translation was China said that the U.S. would have to remove all tariffs for a phase 1 trade deal.
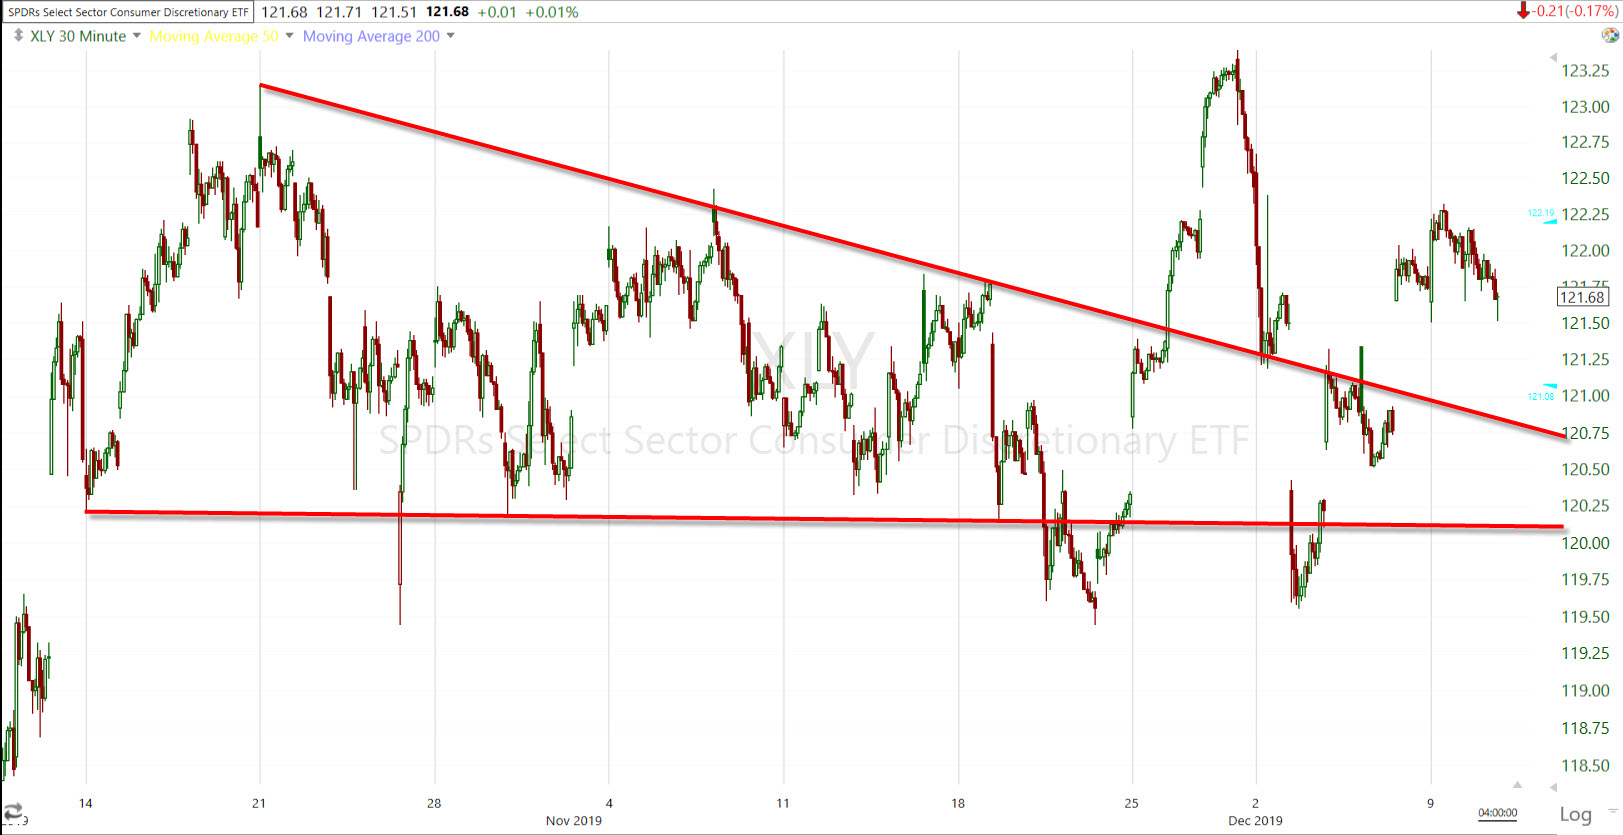 Consumer Discretionary (30m) has been a laggard through the entire rally. It has no primary up trend for the phase 1 deal because it has traded in a bearish descending triangle through out, failing to make new highs or even higher highs with the market averages. The price volatility around the consolidation is a near mirror of small caps.
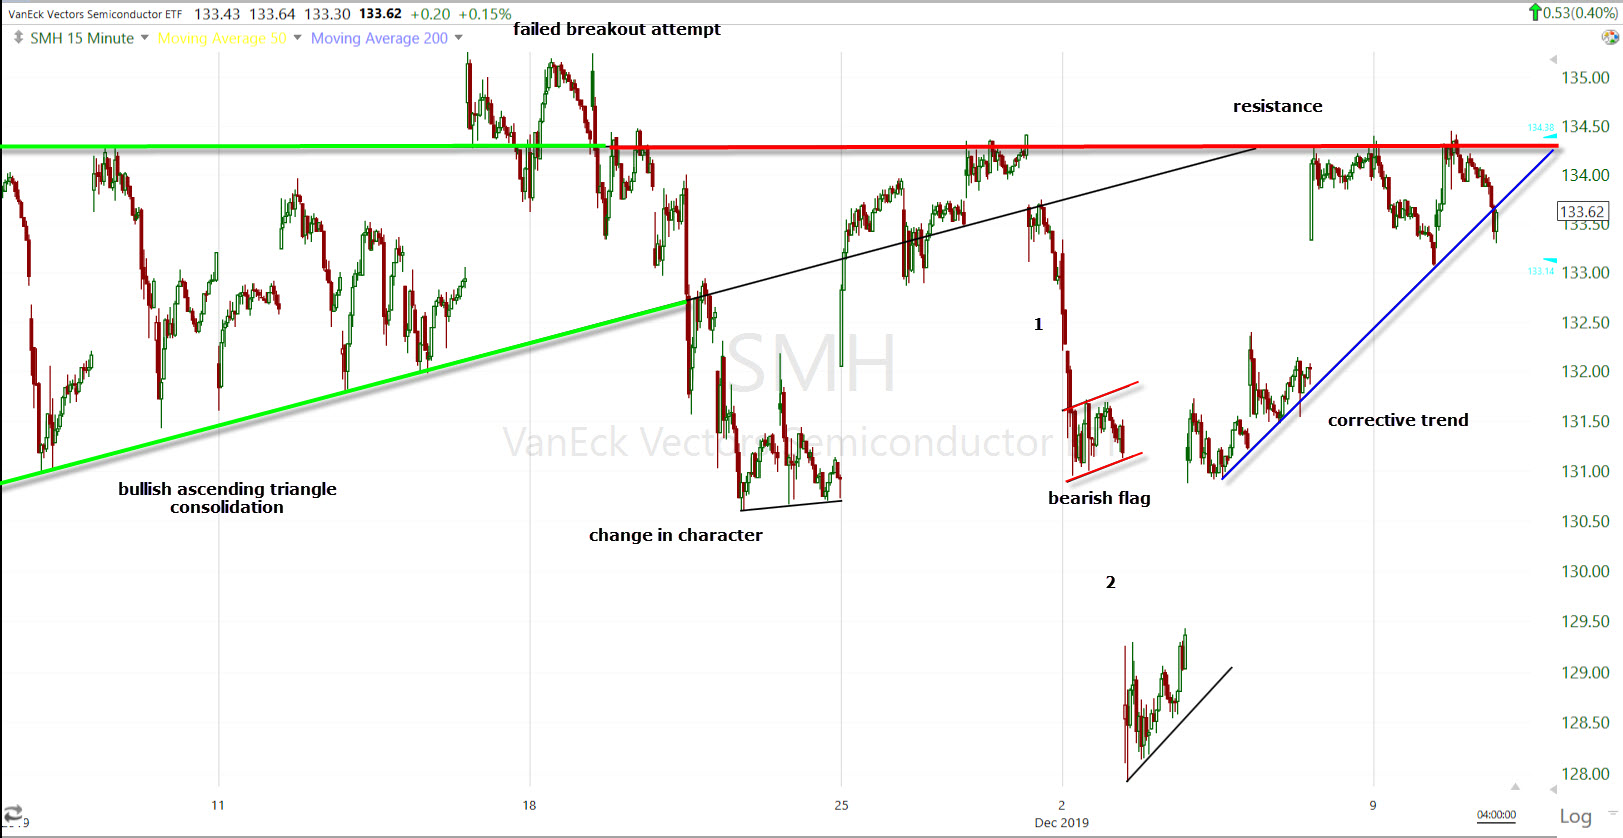 Semiconductors (15m) went from a bullish consolidation to a transitional change in charterer to a 2-leg decline with a bear flag last week, and a corrective bounce since. The sector has met resistance here four times since the start of November.
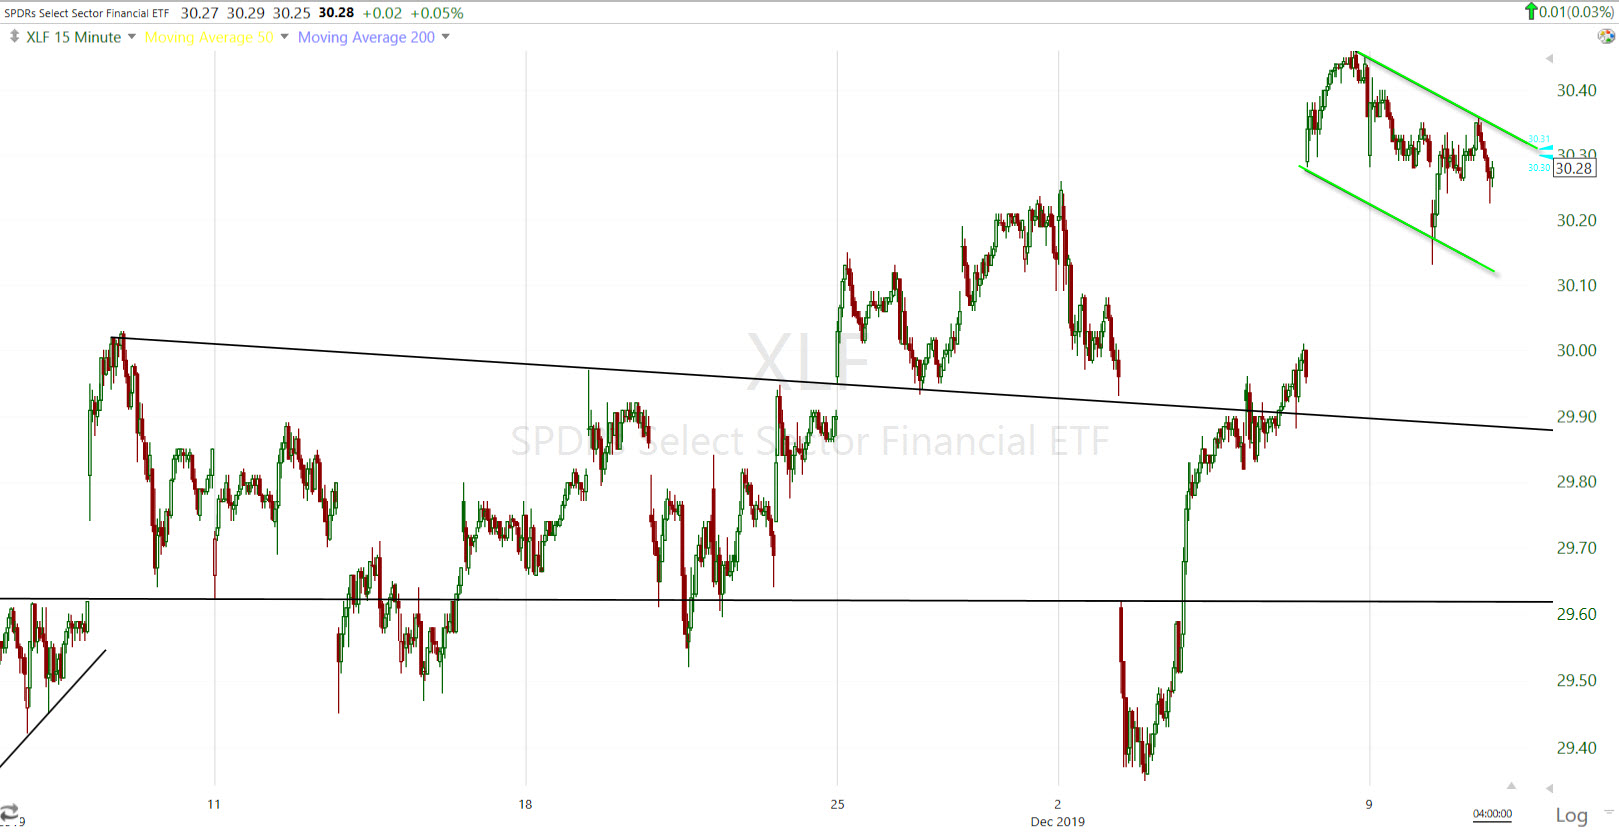 Financials (15m) are the only cyclical sector with a potentially bullish flag. If the flag continues to develop the next couple of days and cleans up, it could have a measured move of +3% higher on a breakout. I’m not sure it’s a bull flag yet, but recent price action looks like it.
On a relevant note, yield curve have flattened this week. In fact this was the one of the only market signals of interest this afternoon. Changes in the shape of the yield curve tend to lead financials by a few days. The curve flattening is a headwind for the Financial sector, as well as for the broader market. It tends to effect Regional Banks more. The FOMC tomorrow could certainly have an influence.
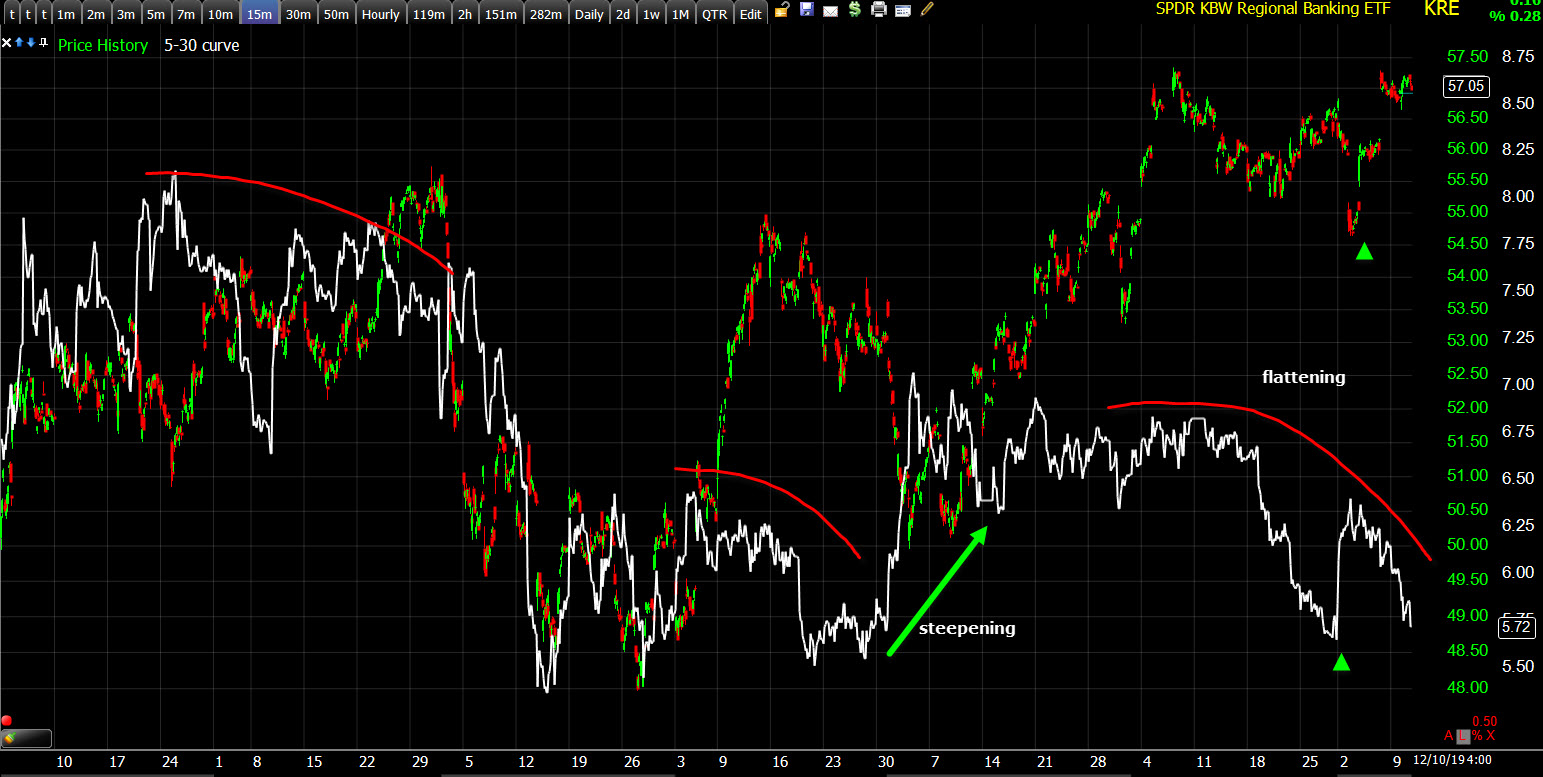 Regional Banks (KRE) and the 5-30 yield spread in white (15m). Note the sharp steepening leading into the phase I trade deal rally. The flattening trend is one of the red flags I have mentioned in recent weeks. Also note there was a quick burst of steepening Friday on the strong Payrolls print, with the bounce in financials that has since started to consolidate in what may be a bullish flag. However, like Treasury yields and currencies, the yield curve has retraced the Payrolls steepening and flattened notably into the close this afternoon.
The defensive Utilities continue a month-long consolidation as cyclical sectors showed negative changes in character.
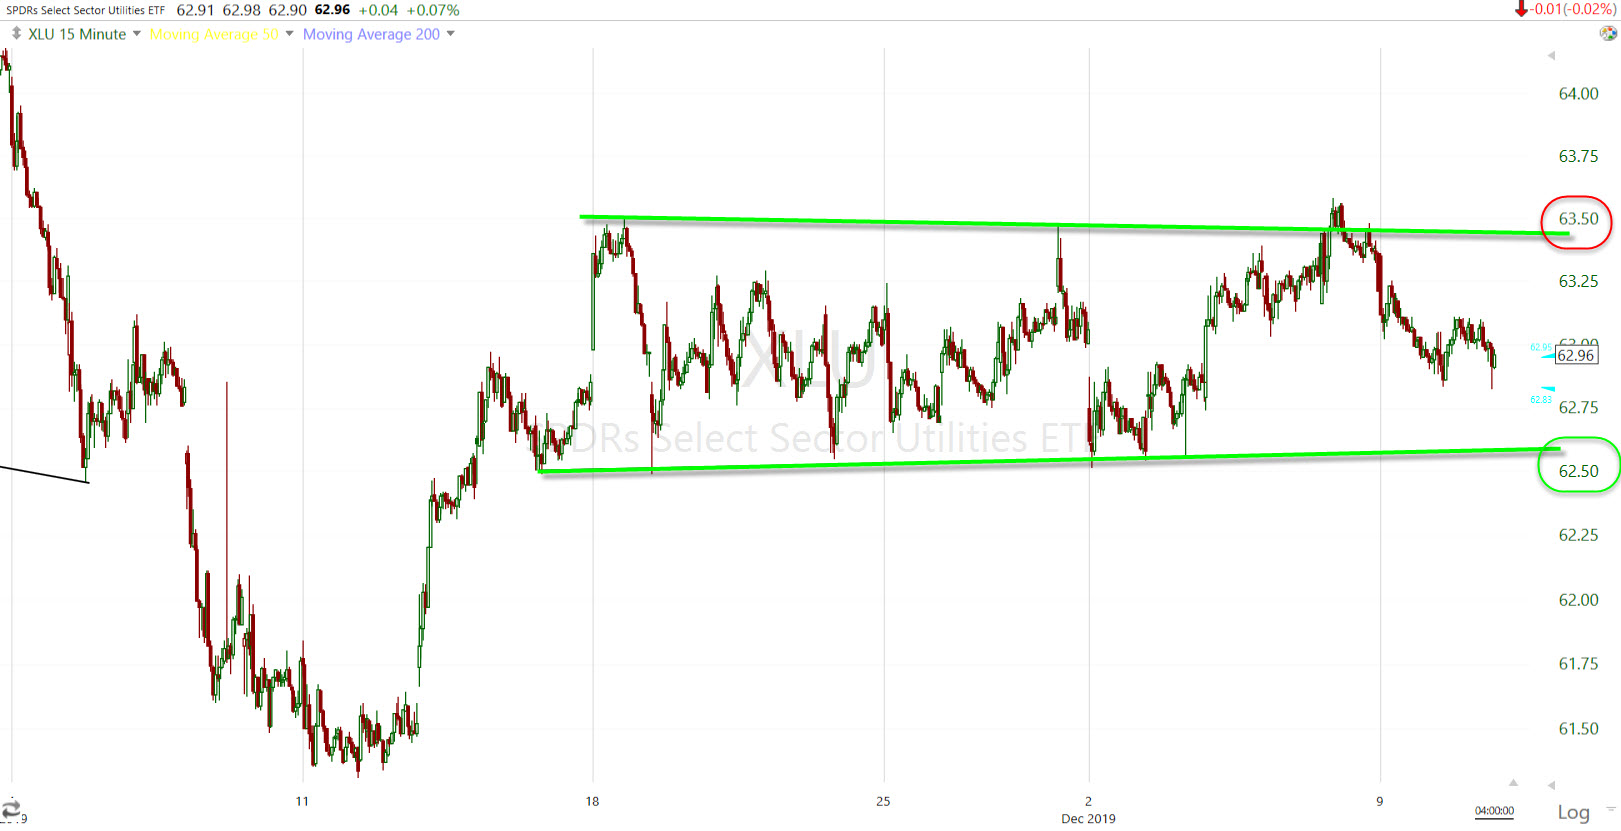
Utilities (15m) a shallow bullish ascending triangle consolidation.
Otherwise the most constructive price action is to be found in the defensive bond proxy sector, Consumer Staples.
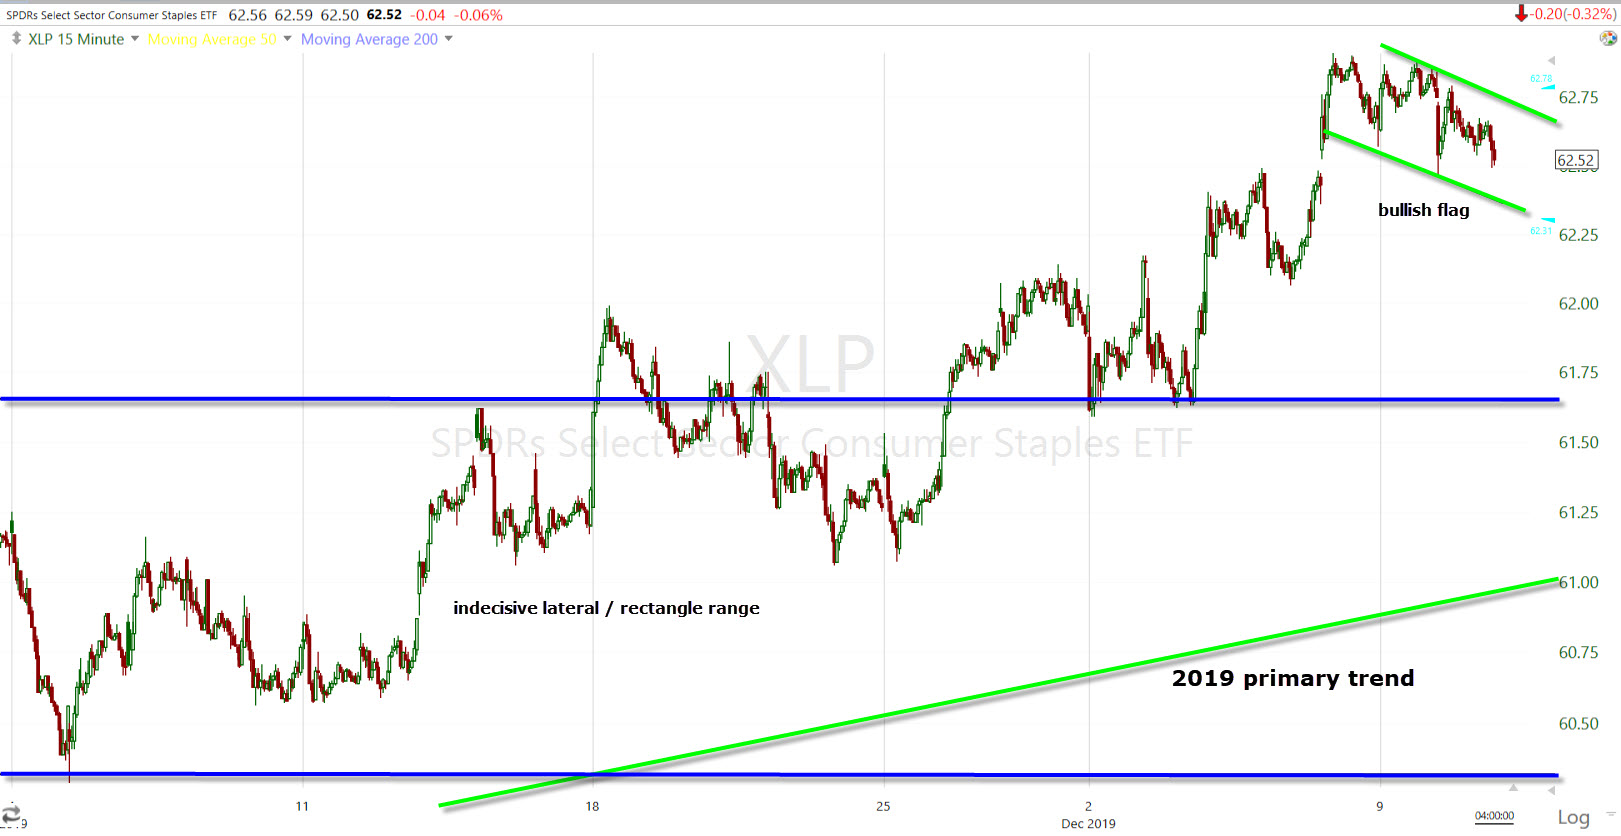
Consumer Staples (15m) note that the primary up trend is a true primary uptrend, not just a 2 month trend, but 2019. The sector is one of the few making higher highs and higher lows, this as cyclical sectors started showing weaker price action. This also appears to be a bullish flag consolidation. The sector’s price trend make a stronger case for a bullish flag than Financials.
Internals
Internals reflect the same drudgery with a near flat day – Advancers 1471 and Decliners 1406 on lighter Volume of 780.0 mln shares. The 50-day average is 815 mln.
There was nothing even remotely close to a Dominant price/volume relationship today.
Treasuries
U.S. Treasuries finished the session mixed. The 2-year yield increased three basis points to 1.65%, and the 10-year yield was unchanged at 1.83% resulting in yield curve flattening, particularly noticeable into the bond market and then the equity market close as noted this afternoon. Treasuries continue to track the Chinese yuan pretty closely, obviously focused on trade talks, but far less optimistic than stocks have been for a month now.
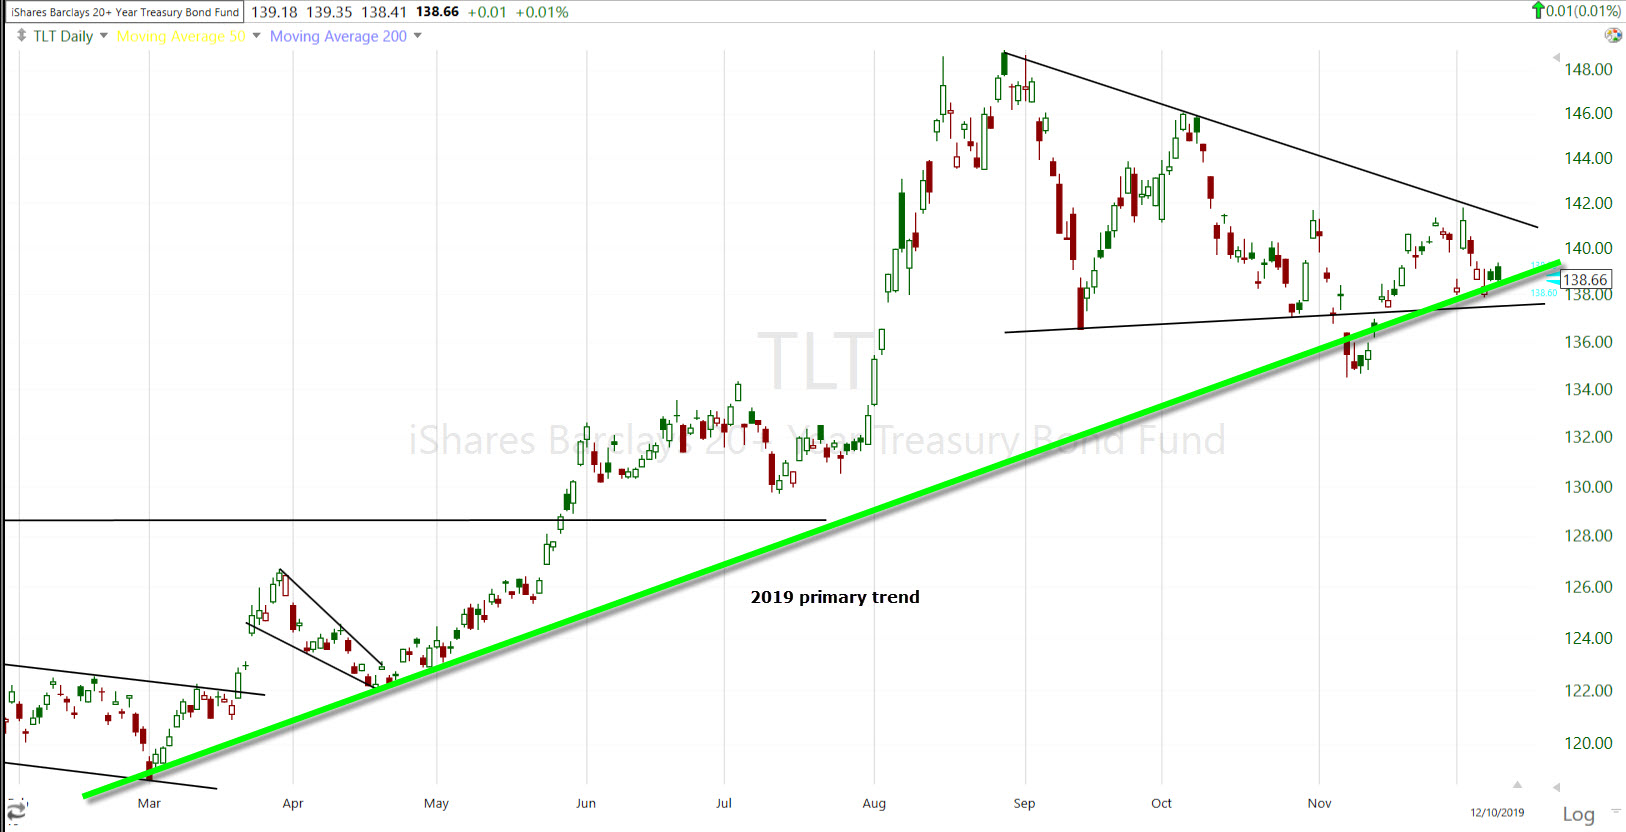
TLT (daily) holding its 2019 primary up trend and consolidating, much like gold as the two have had a high correlation.
Currencies and Commodities
The U.S. Dollar Index declined -0.2% to 97.45.
WTI crude increased +0.4% to $59.21/bbl. almost sparking some gains in the market this afternoon, but then crude ran into resistance at its broadening range.
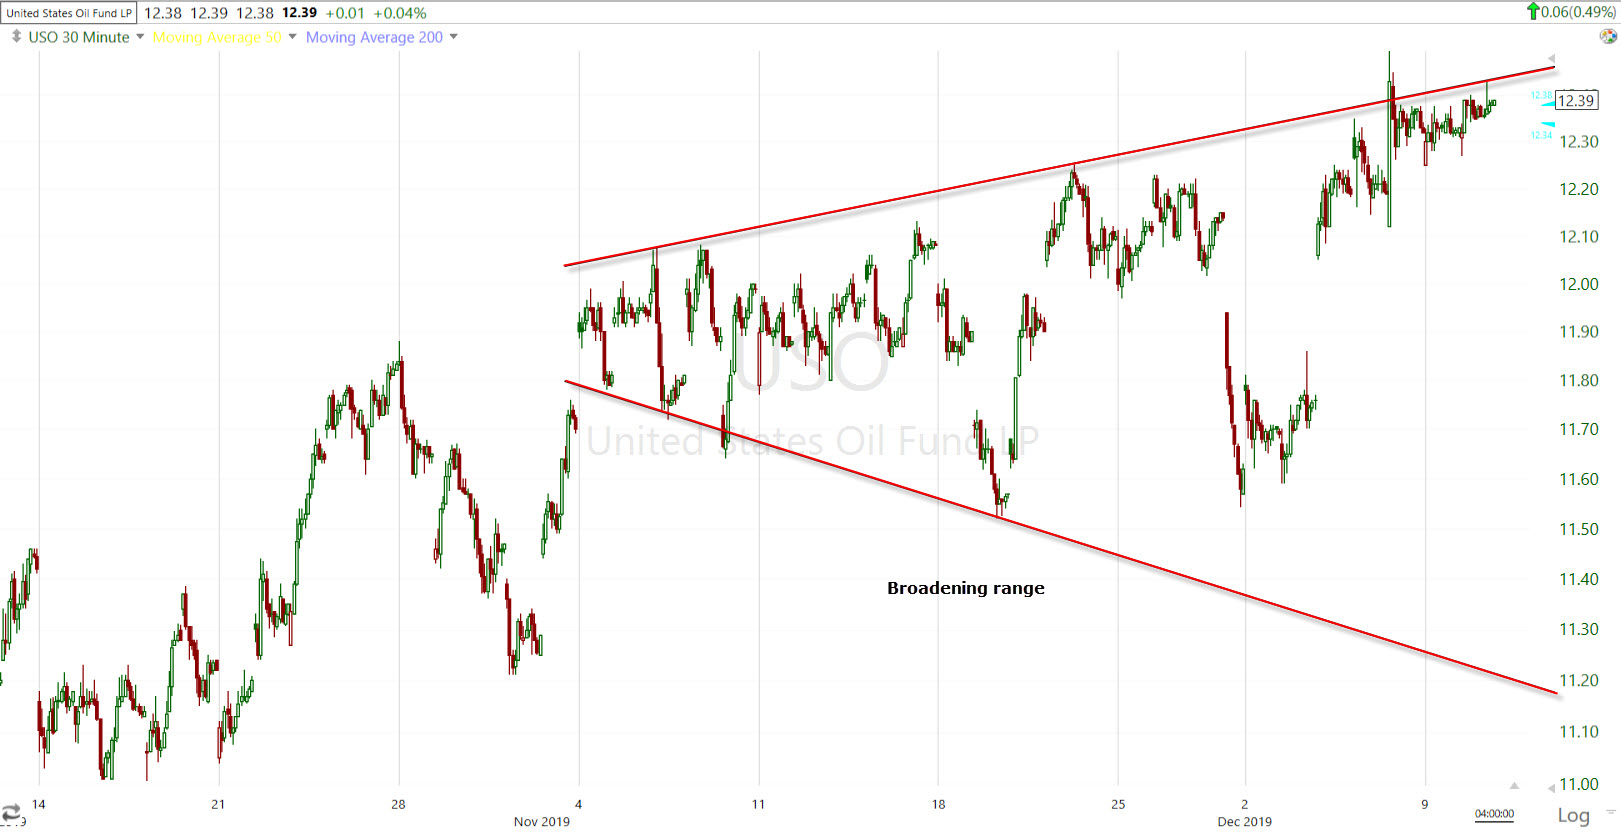
USO (30m) broadening range’s upper trend line acting as resistance, which is spilling over to the Energy sector which is also meeting resistance (See above).
Summary
As I opened with, the averages treaded water today, presumably ahead of the FOMC tomorrow. This kind of drift is typical, usually it has a slight upward bias into the Fed as volatility typically comes under systematic selling pressure about 24 hours in advance. There was not much to get excited about in today’s session. It is noteworthy that the market couldn’t spark a rally on the WSJ report that the U.S. would suspend December 15th tariffs. Later in the day Larry Kudlow, stock market pumper extraordinaire, could or would not confirm the suspension of tariffs. Remember that if the talks go sideways, the October tariffs were also suspended and could come back into focus. I don’t see anyone considering that possibility.
The Chinese yuan barely moved on the WSJ report, nor did treasuries, so stocks probably did the right thing in doing nothing, but that’s something new as the yuan and treasuries (and credit, and the yield curve) have all had a negative outlook on trade talks recently while stocks have rallied to new highs. The yield curve flattening into the close was one of the few noteworthy developments which may be related to the bond market seeing higher economic risks, or the FOMC tomorrow. Of course what’s happening in volatility and now SKEW, is a bit of an attention-getter.
For years I’ve warned to beware of Fed and FOMC-related knee jerk reactions. There are a lot of reasons from market liquidity nearly evaporating seconds before the policy announcement and then bursting after, like a kinked hose. Or just simple algo knee jerking on complex headlines and follow-on information that they can’t possibly understand. The market takes everything in and initial knee jerks are often not reliable. Sometimes there’s a counter reaction in hours, sometimes days, the last meeting the knee jerks didn’t settle for more than week.
Volatility tends to come under heavy selling pressure about 24 hours in advance of the FOMC. My opinion is that the New York Fed’s open markets desk purposefully sells volatility to calm markets and minimize any potential strong negative reactions in stocks. It is conceivable that voting FOMC members could take market reaction into account when it comes to controversial decisions, and the NY Fed tries to minimize this, or simply doesn’t want the negative press of a market sell off due to a Fed decision – it happened in December of 2018, and July of 2019. They’re main unspoken policy directive has been to keep markets levitating for well over a decade to keep confidence high. Some would call it conspiracy theory, but many things like gold and silver manipulation were once seen as conspiracy theory, now they’re fact, and there’s evidence in the Fed’s own meeting transcripts that they’ve been short volatility.
VIX futures looked softer on 3C charts from this morning, but that’s to be expected after a 1-day 16% gain. I haven’t seen evidence of selling of vol. in the cash market. The sell-side pressure on volatility tends to subside after the policy announcement (2 p.m. ET) and press conference (2:30 ET), now that the Fed is live at every meeting. The Dollar, gold, VIX, Treasuries and Financials tend to be the most volatile areas on Fed days. Just keep in mind that what you first see may not be how things settle.
The probabilities for a rate cut are virtually non-existent.
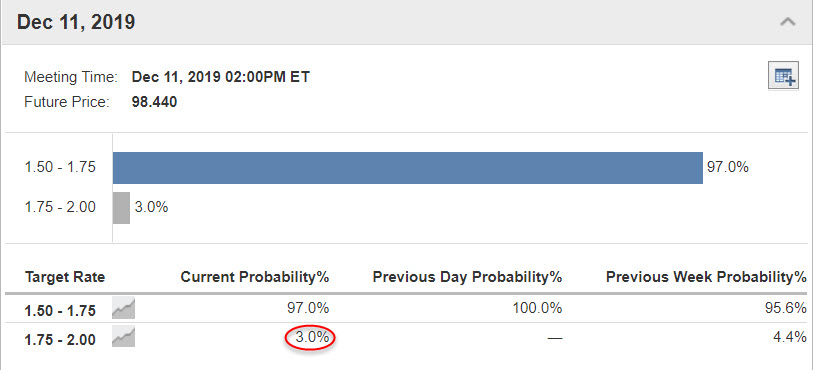
The Fed will release its summary of economic projections tomorrow and some think they may make some announcement of action relating to year end repo market liquidity. ZeroHedge had an interesting article today, citing Zoltan Pozsar, who is probably the one of the most knowledgeable individuals when it comes to repo markets. Remember the blowout in repo rates in September, spiking to 10%? That led to the Fed’s overnight and term repos that haven’t been used since the financial crisis, and the launch of “Not QE 4”.The only difference between QE4 and what Powell calls “Not QE 4” is that the Fed is buying Treasury bills instead of notes or bonds, and thus is not targeting duration. Some believe that may change, that it may have to change. Zoltan sees the potential for significant turbulence into year end. This may be a topic that comes up tomorrow.
Overnight
S&P futures are down -0.1%. 3C charts are weaker.
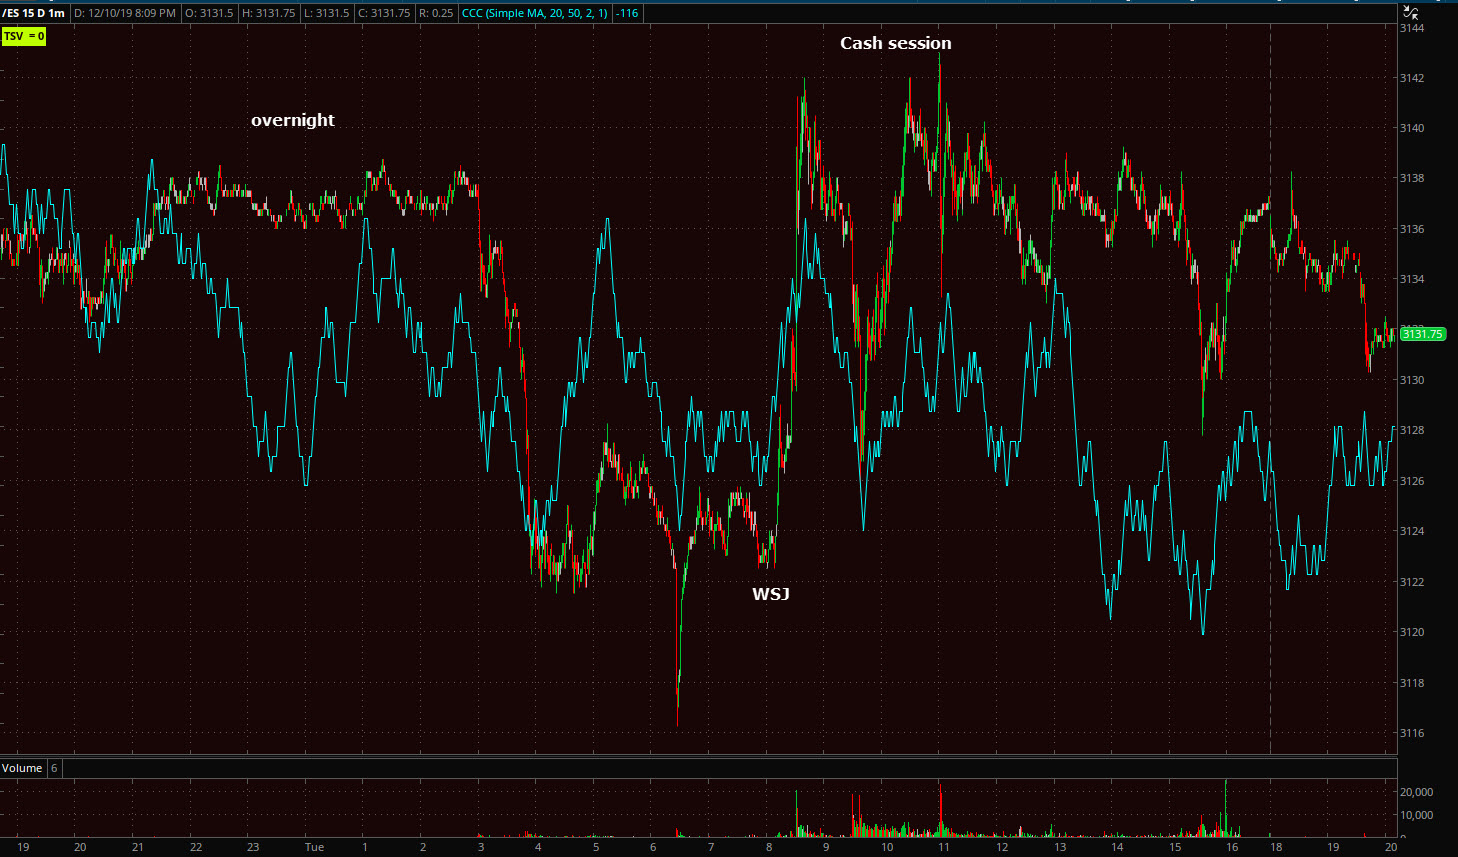 ES/S&P futures (1m) 3C gently slipped lower this afternoon. Remember this is a very narrow price range and it’s not the kind of signal that jumps off the chart, it shows a lack of conviction.
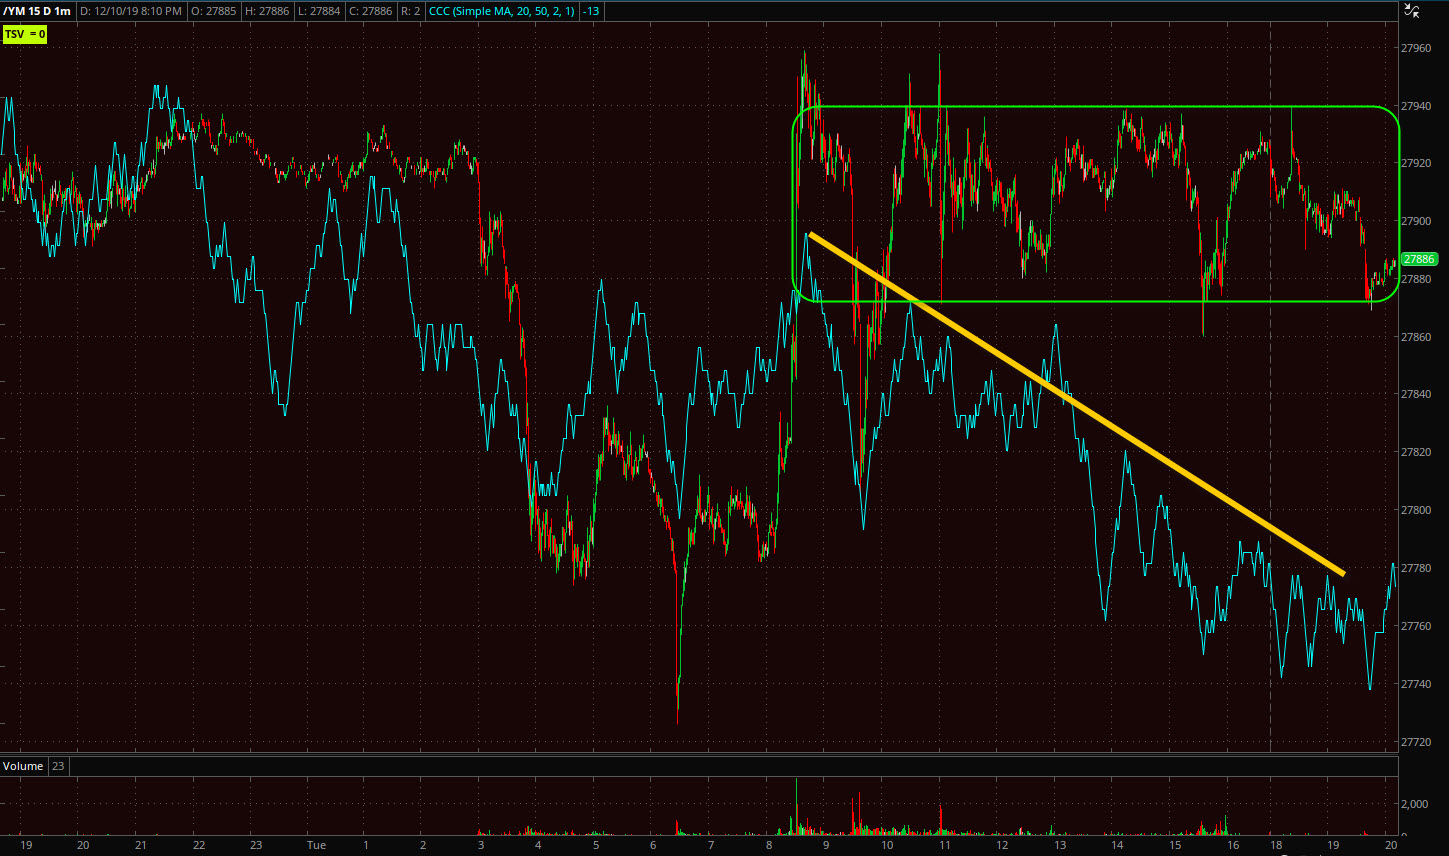 Dow futures (1m) show it more clearly. Russell 2000 futures are in line with price.
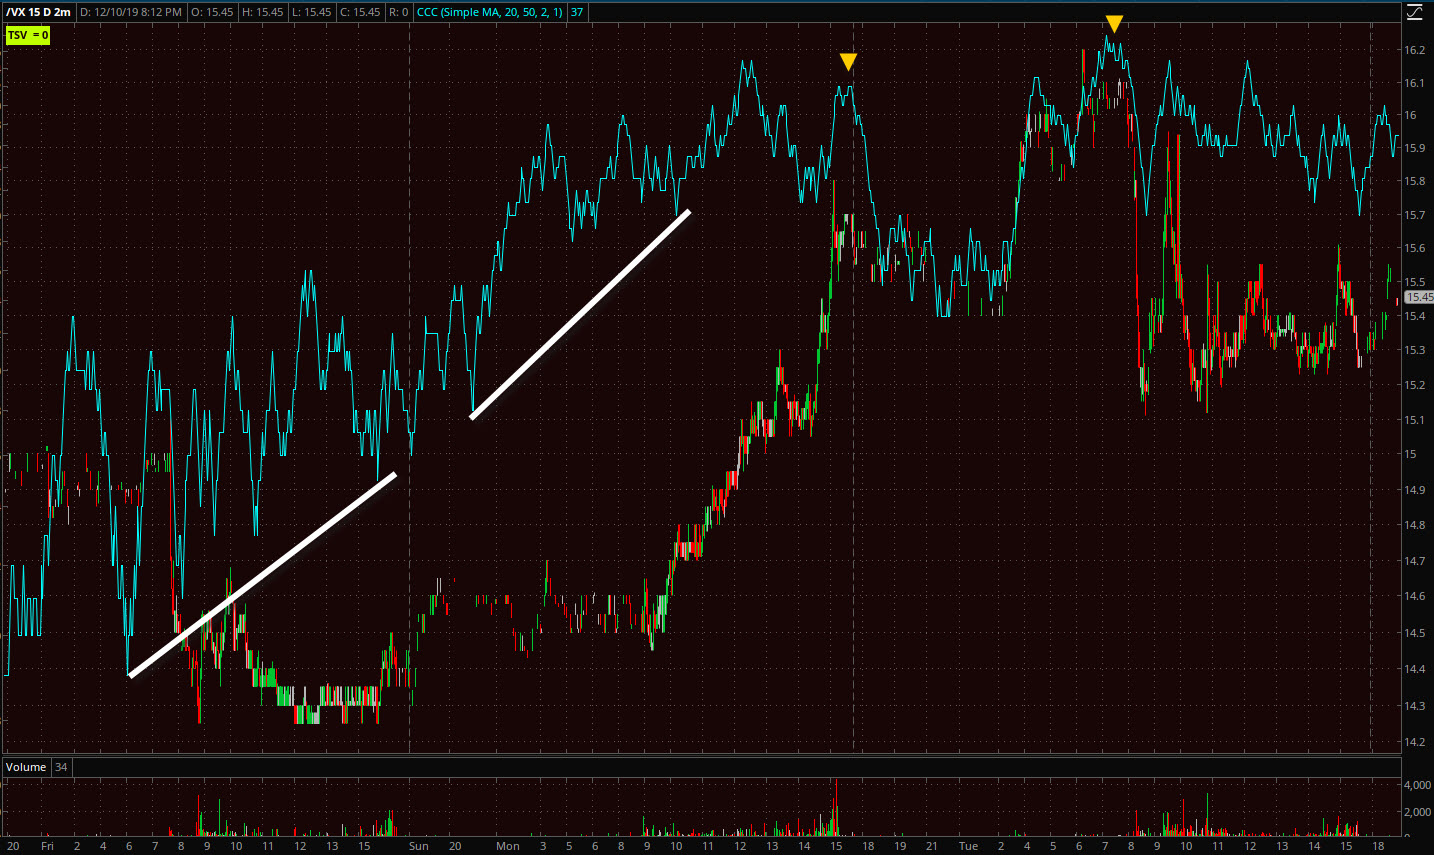
VIX futures (2m) ended last Friday with a positive divergence and VIX spiking 16% Monday. There was some softness on 1 min charts Monday night and in the overnight session (yellow arrows), but hasn’t made much of a dent overall.
Crude futures are down -0.5% after a larger than expected crude build (API inventories).
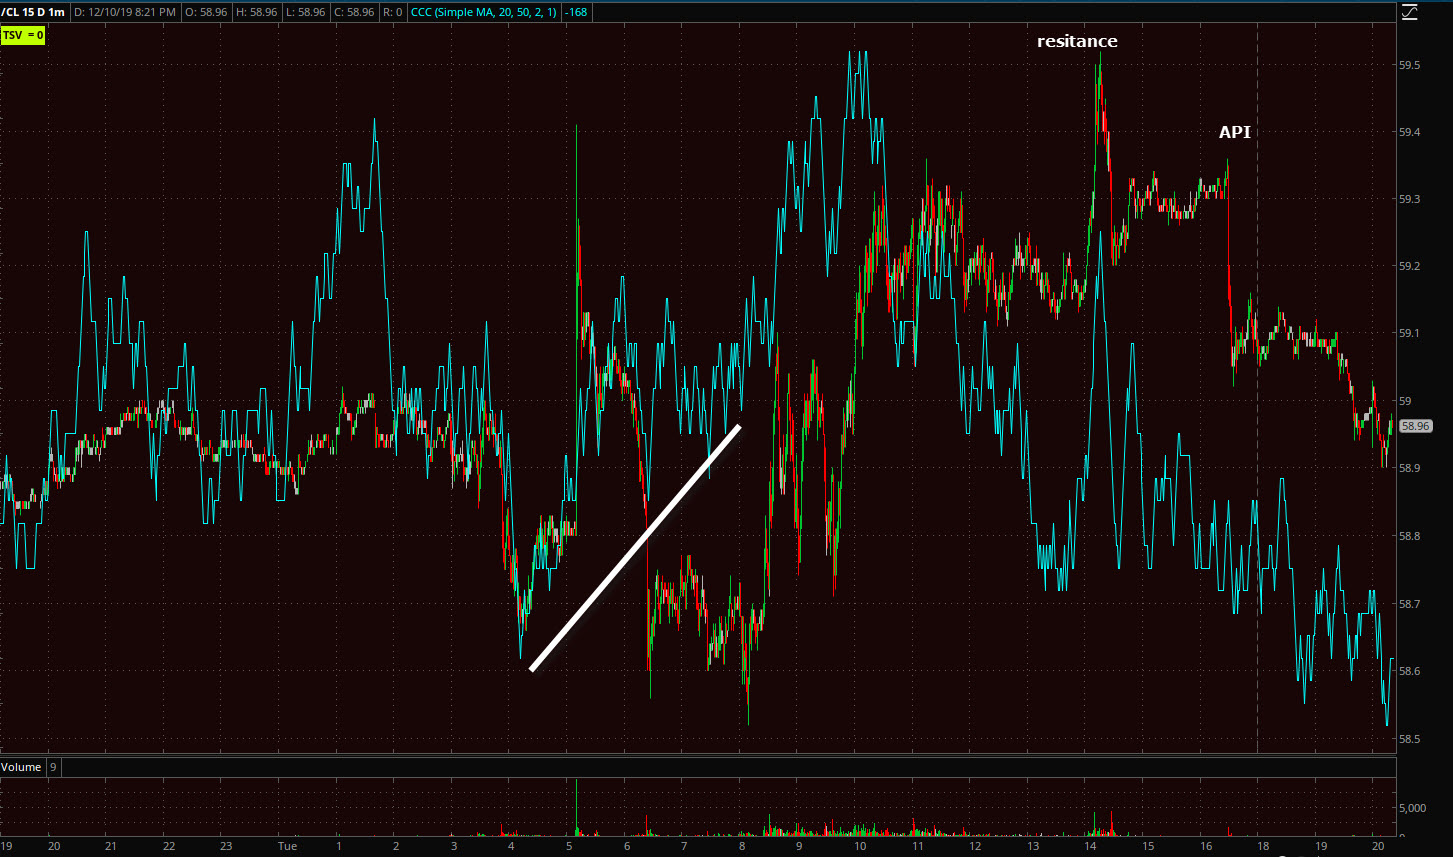 WTI crude futures (1m) earlier today I thought crude might spark some risk-on sentiment in stocks, but I noticed the broadening formation’s resistance nearby. 3C fell off quickly near resistance as buyers backed away.
Tonight White House Trade Advisor Peter Navarro told Fox News that he has “no indication that December tariffs will not be put on.” The Chinese yuan had a modest negative reaction, retracing most of the morning WSJ story that December 15th tariffs would be suspended.
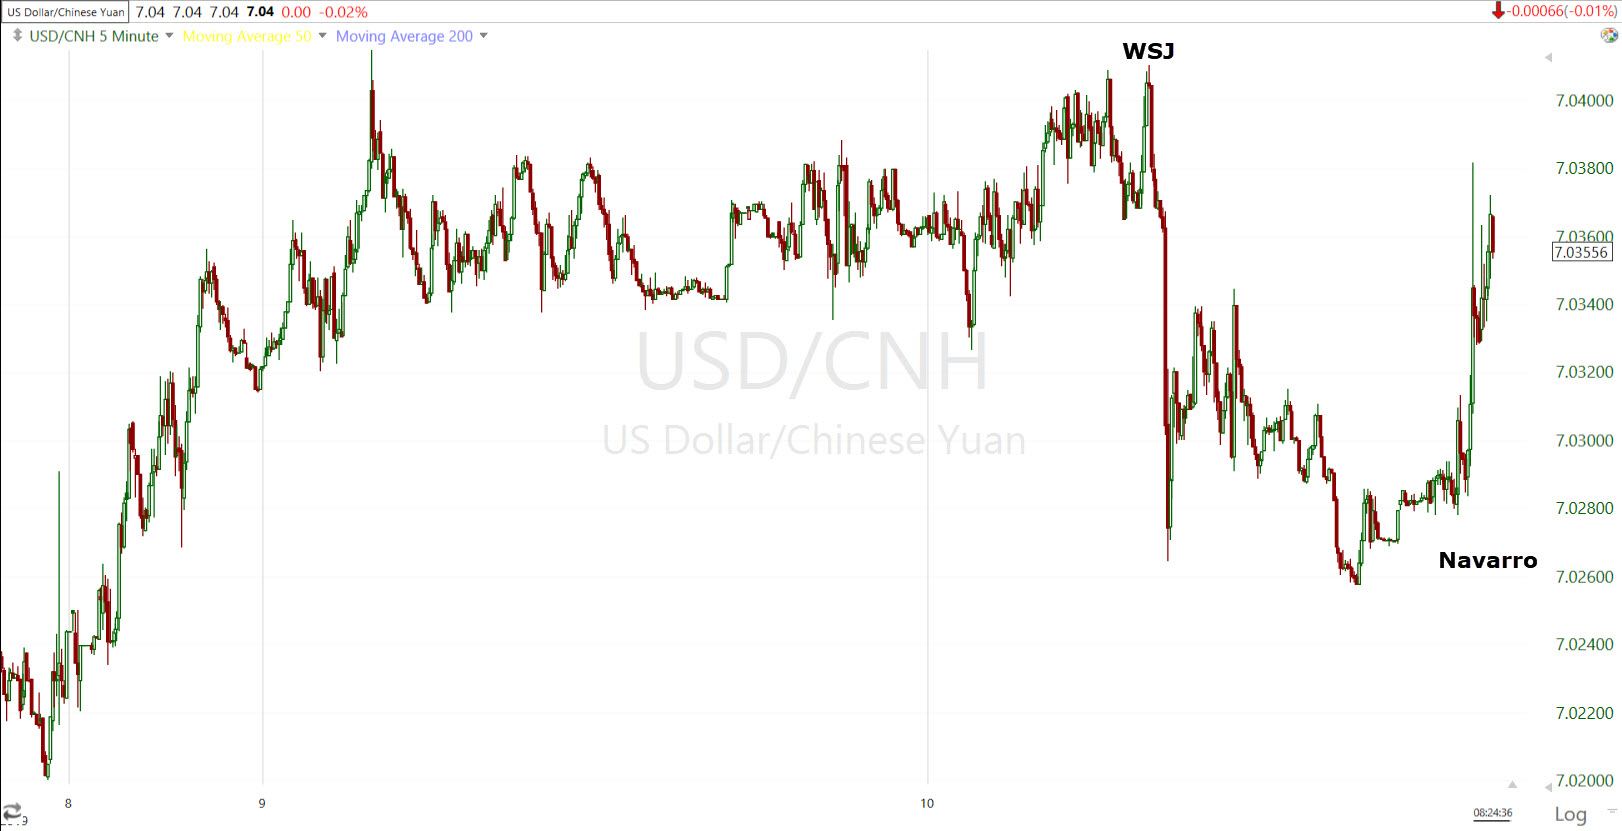
USD/CNH (5m this week)
The current implication for S&P futures on a short-term basis is a very modest headwind of -0.2% lower or $3126.
Reactions in safe haven treasuries and the Japanese yen are also modest, although Yen futures’ 3C chart is improving into the overnight session.
Looking ahead, investors will receive the Consumer Price Index for November, the FOMC Rate Decision, the Treasury Budget for November, and the weekly MBA Mortgage Applications Index on Wednesday.