Daily Wrap
The S&P 500 and Nasdaq Composite rose to fresh record highs on Tuesday as the market found continued support in the mega-cap tech stocks. News that top trade negotiators from the U.S. and China reviewed the Phase One trade deal and remained committed to the agreement aided early risk sentiment.
The catalyst that sent index futures higher Sunday night to start the week was President Trump announcing the FDA cleared plasma treatment for COVID, which seemed like a lot of hype to me. Today Dr. Stephen Hahn, chief of the Food and Drug Administration, apologized for overstating the benefits of plasma for treating coronavirus patients.
Small Caps and Dow displayed relative strength last night and pre-market, while NASDAQ displayed relative weakness. At the cash open that dynamic completely revered, much like yesterday, although yesterday it was NASDAQ that was strong heading into the open while Small Caps and Dow were weaker and that flipped at the cash open.
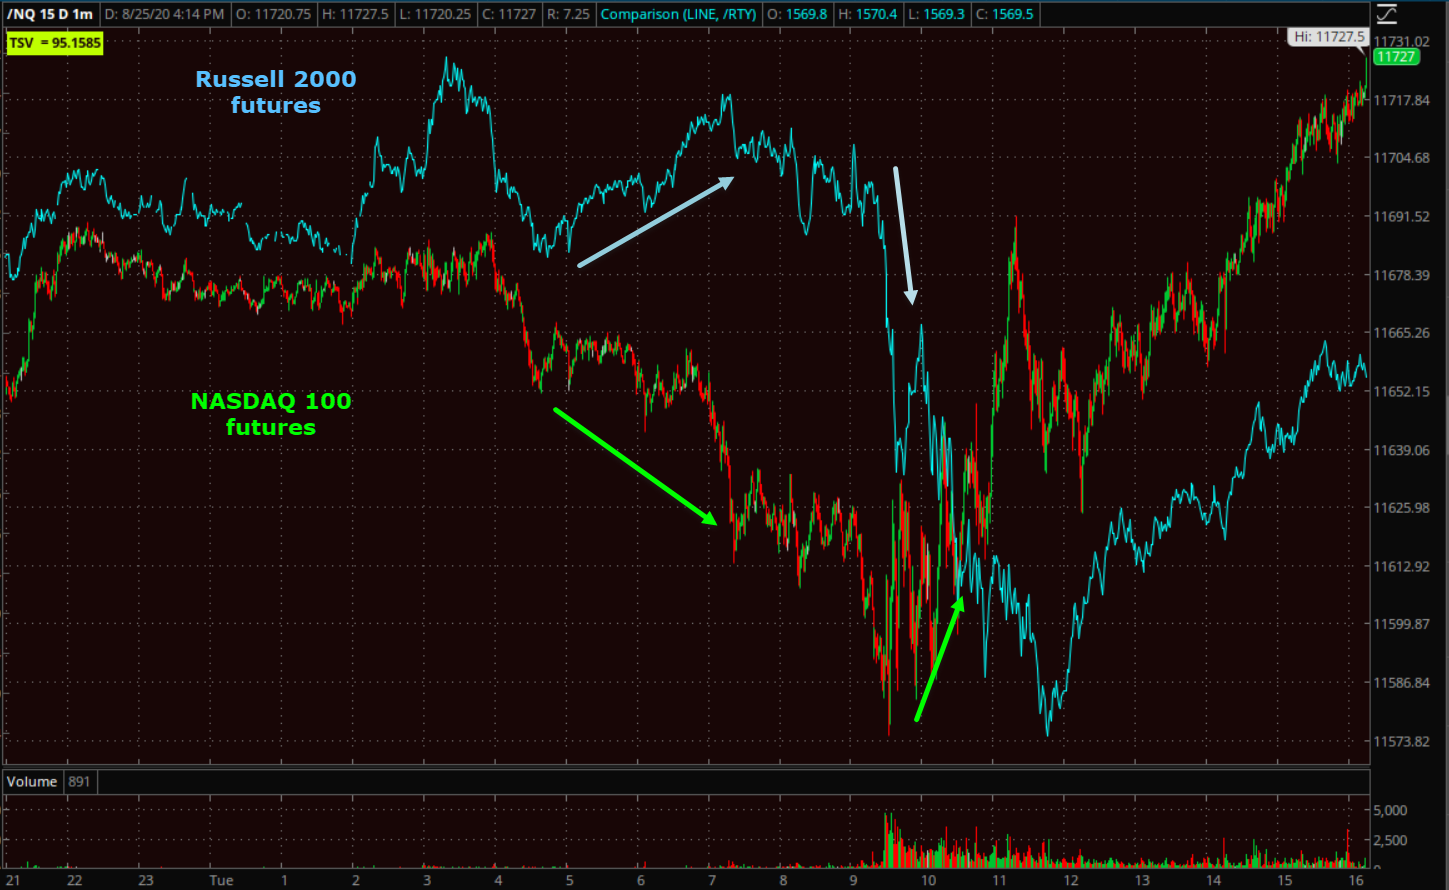
Russell 2000 and NASDAQ 100 futures (1m overnight and today). Notice R2K is strengthening in pre-market while NASDAQ is weakening, then, like yesterday, the dynamic turns 180 degrees at the cash open. I’m not sure what that’s about, but 2 days in a row at the cash open is curious.
This means that there was no follow-through on yesterday’s rotation to value and cyclicals, which was their first bit of strength in more than a week. Momentum style factors gained and value eased a little today (value sold, momo bid).
We got an ugly surprise in the Conference Board’s Consumer Confidence Index, which dropped to 84.8 in August from 91.7 in July, well below consensus of 93.0, and to its lowest reading since May 2014.
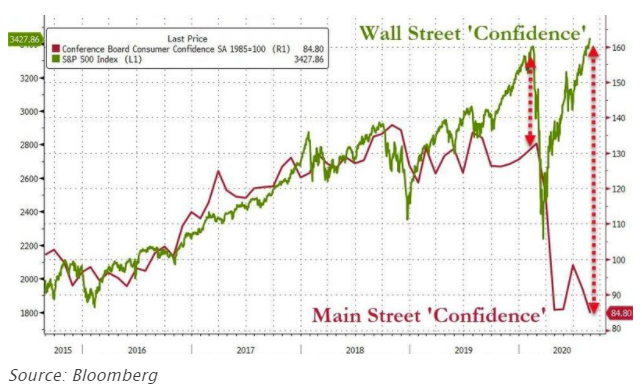
The key takeaway from the report is the understanding that consumers’ assessment of current conditions and the short-term outlook retrenched, reflecting most likely the real economic impact of the expiration of enhanced unemployment benefits at the end of July and difficult labor market conditions that will weigh on discretionary spending activity.
The drop to a 6-year low in confidence may have added additional downside pressure to cyclical/value stocks, but their weakness was evident from the open and the report came out 30 minutes after the open (10 a.m. ET). On the other end of the spectrum, New Home Sales surged 13.9% m/m in July to a seasonally adjusted annual rate of 901,000 (consensus 787,000).
Below you can see the highly unusual and nearly mirror opposite relationship between cyclical sectors and the momentum favorite mega-cap Tech or FAANG stocks in August.
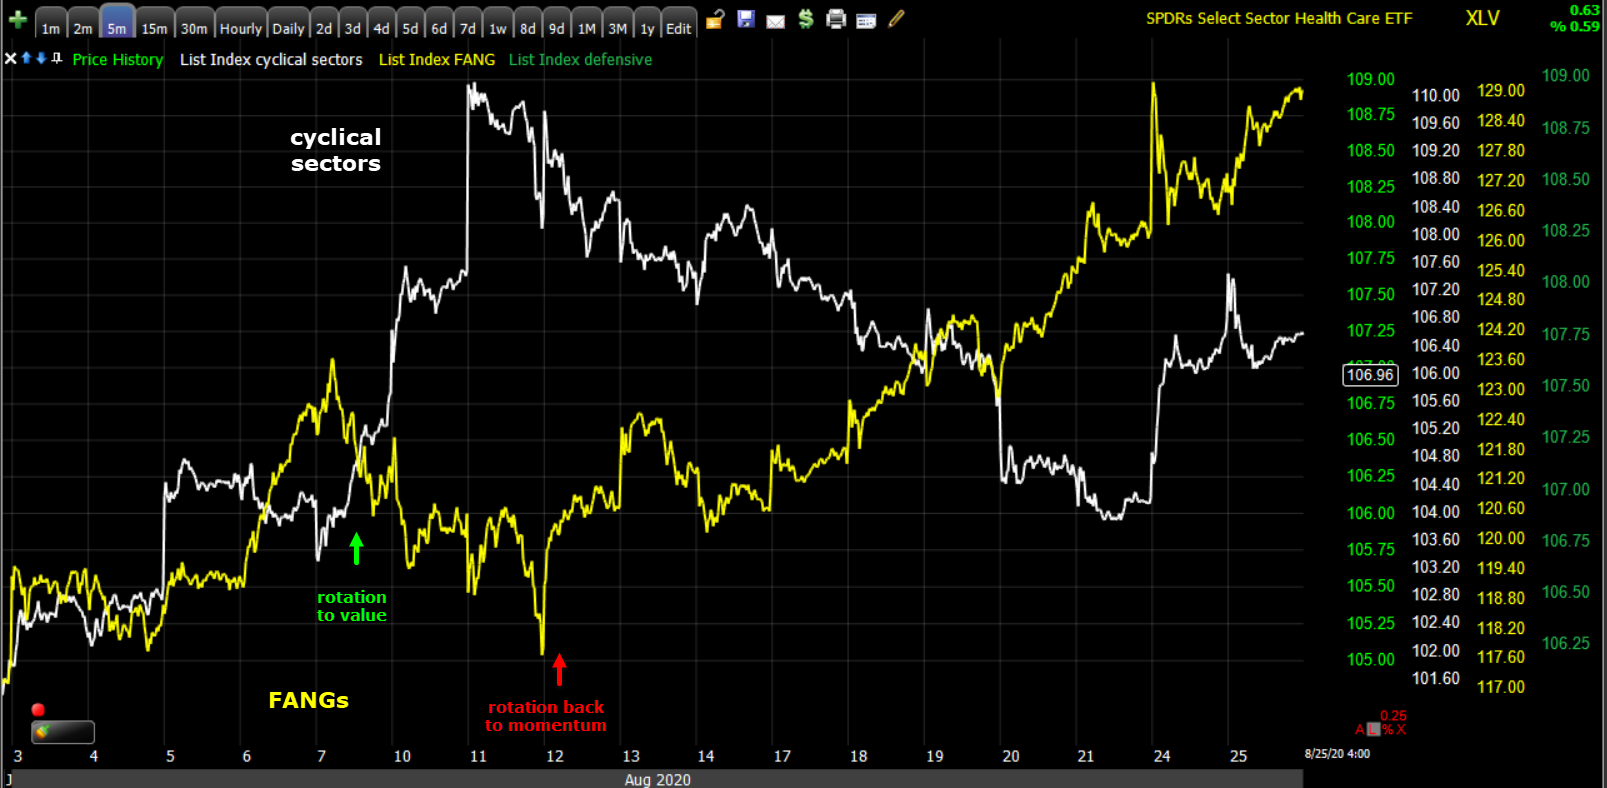
(5m from the start of August when the rotation became very obvious). To the far right you can see cyclical sectors drop this morning, while FAANGS gained.
The mega-cap Tech stocks provided the only real leadership with all trading higher led by Facebook (+3.5%), with the exception of Apple (-0.8%). Both Apple and Facebook recieved upgrades to new street highs, which has been a near daily event and embarrassment for analysts as they raise their estimates to catch-up to a rally that already happened.
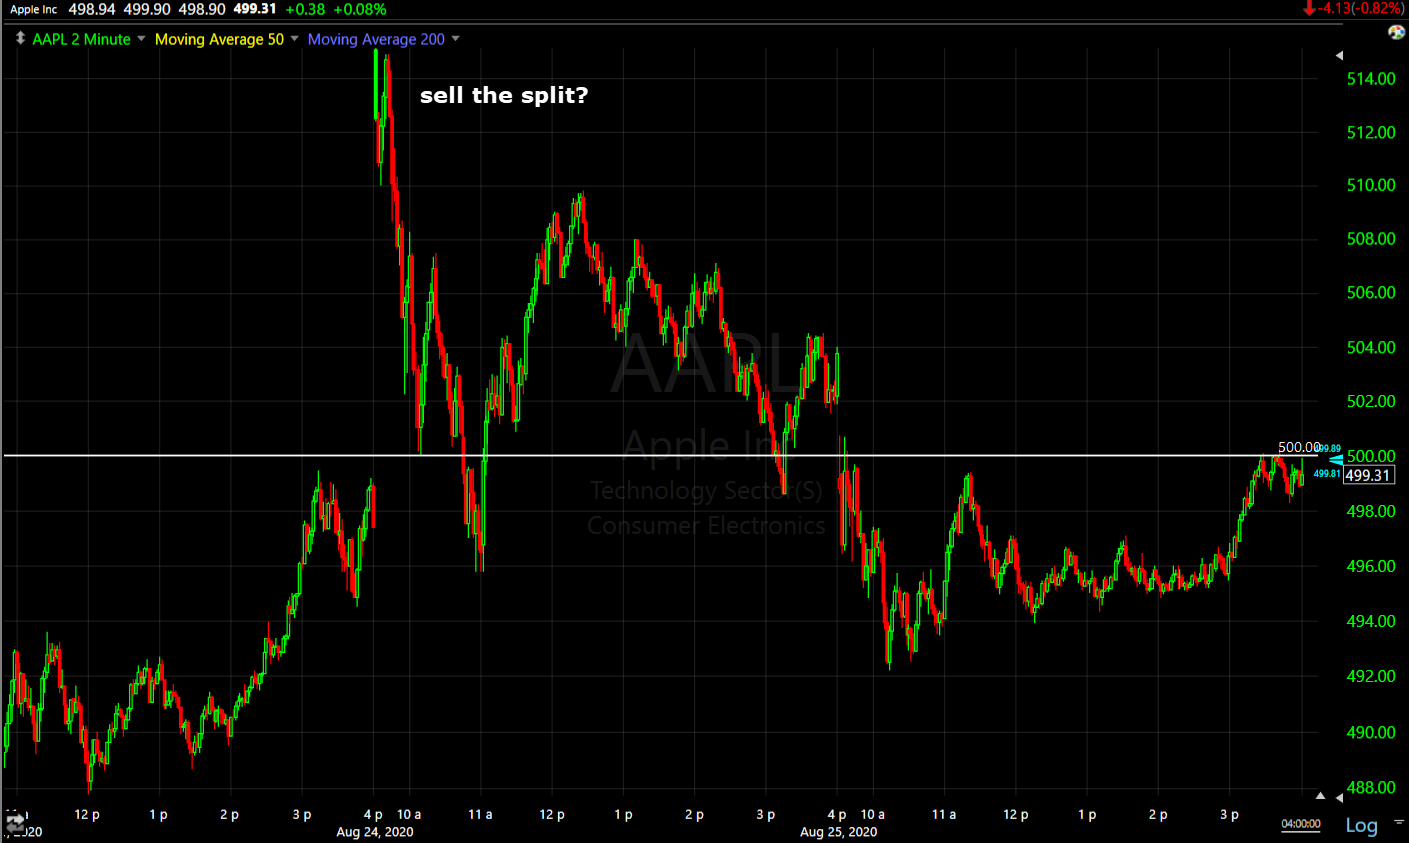 AAPL (2m) yesterday I speculated that Apple’s selling from a strong open higher may have been “buy the split news, sell the split fact”. Notice Apple found resistance right at the $500 level.
Averages
NASDAQ was the notable laggard yesterday and the notable leader today. Dow was yesterday’s leader and today’s laggard. The new entrants into the Dow saw nice gains, while those leaving declined noticeably.
S&P 500 ⇧ 0.36 %
NASDAQ ⇧ 0.82 %
DOW JONES ⇩ -0.21 %
RUSSELL 2000 ⇧ 0.17 %
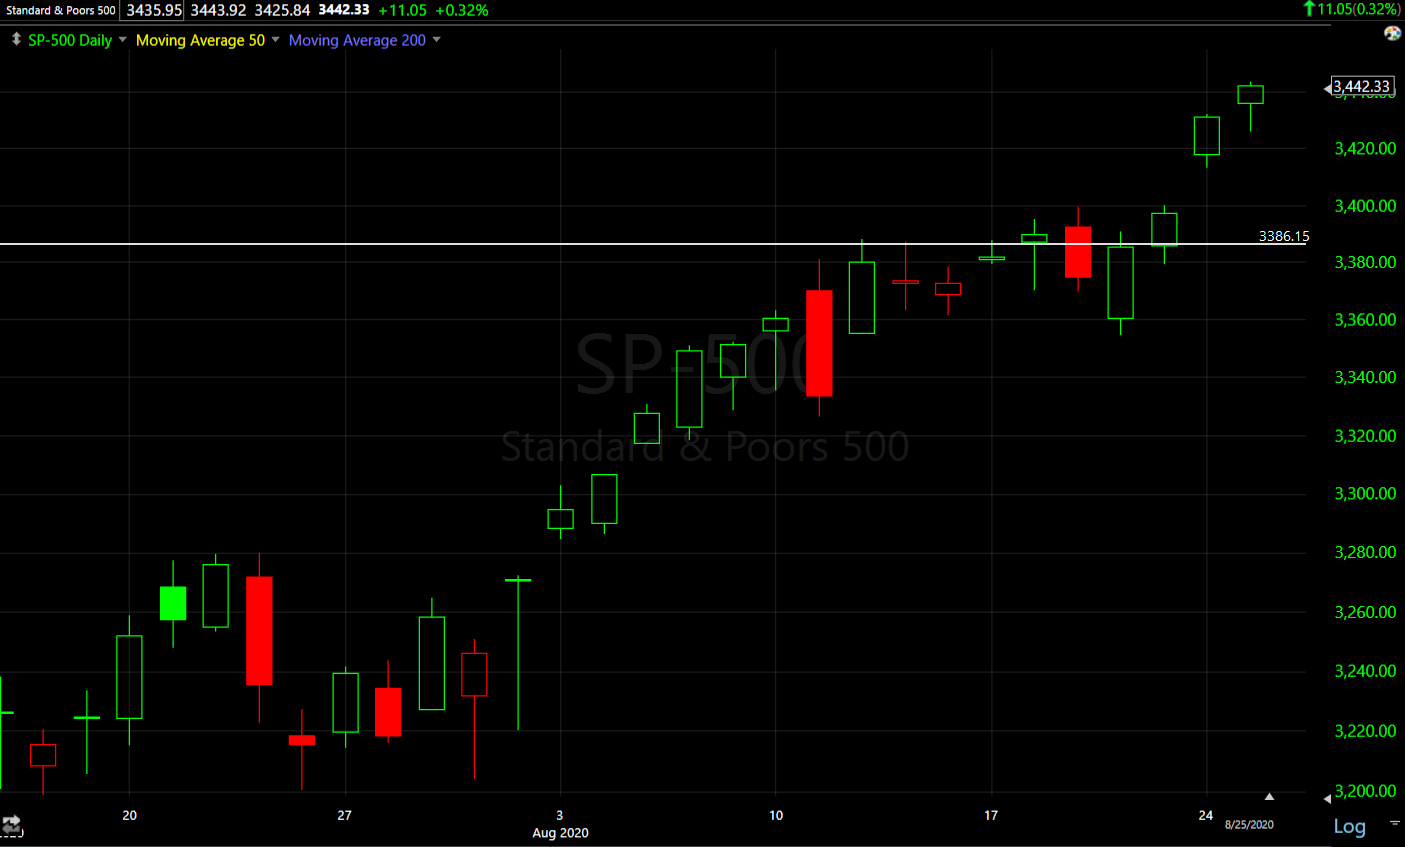 SP-500 (daily) has made 3 consecutive new highs above the February level and up 4 days in a row.
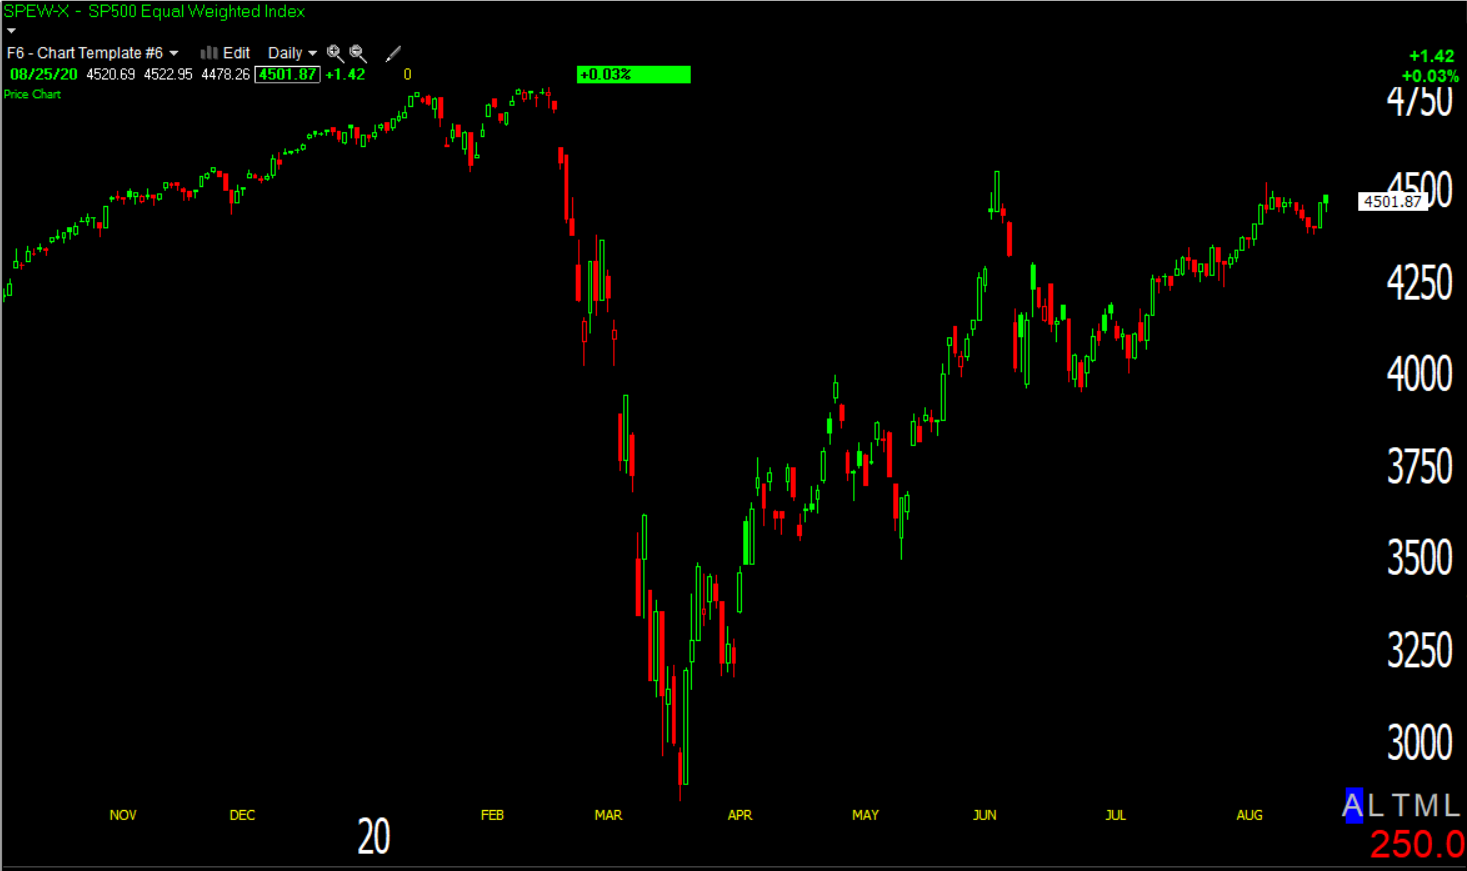
Equal Weighted SP-500 (daily) closed unchanged and is well below its February high, as are most stocks.
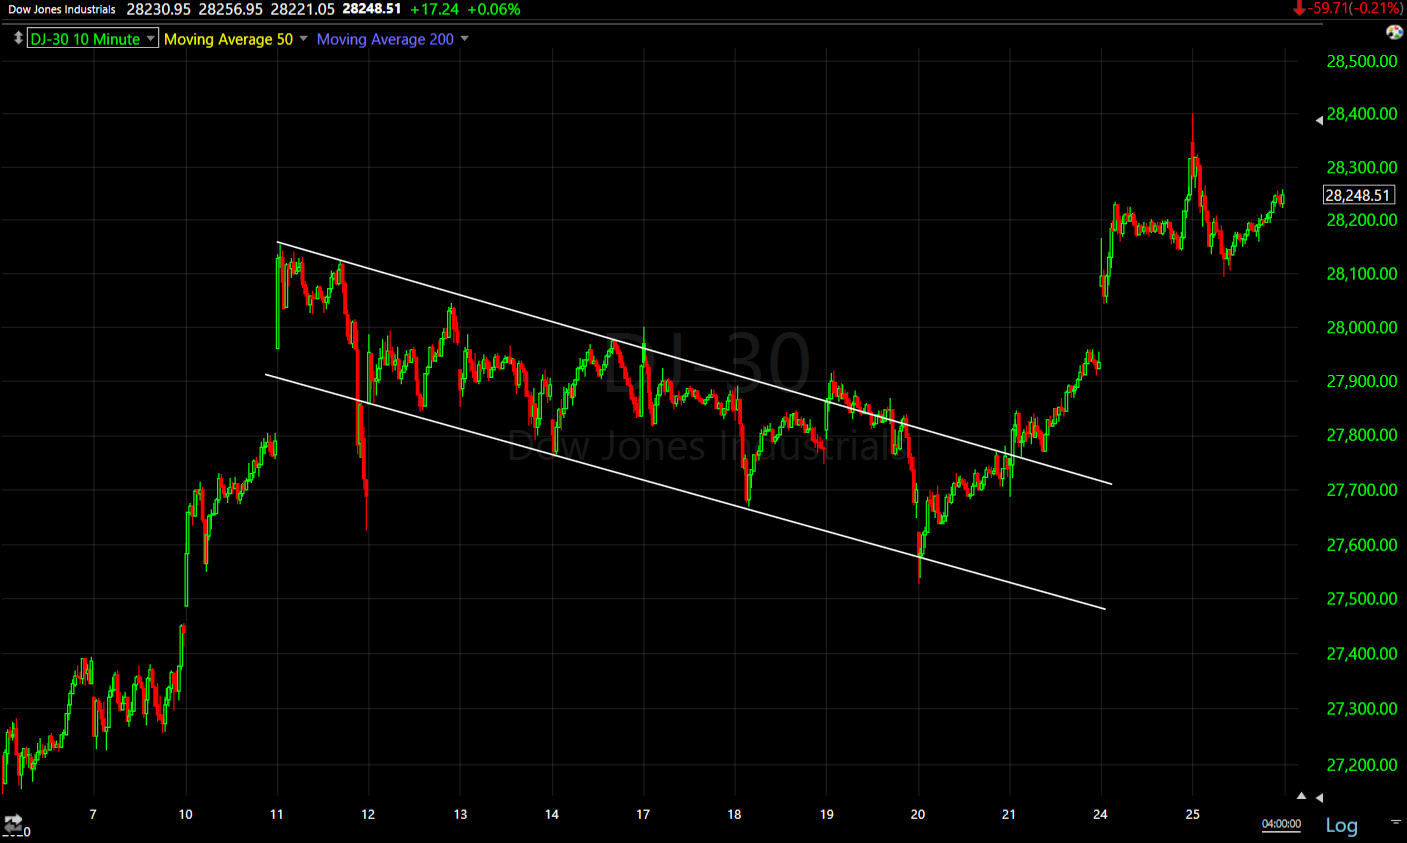 The Dow (10m) didn’t get follow through, but didn’t do anything so bad as to change the near term bullish outlook. The measured move still implies a target around 29,100 or about 3% higher.
Small Caps traded in a similar trend, although weaker and sloppier/wider, and unlike the Dow, tracing nearly all of the prior early August advance from rotation. The Energy and Financial sectors retraced all of the rotation gains last week.
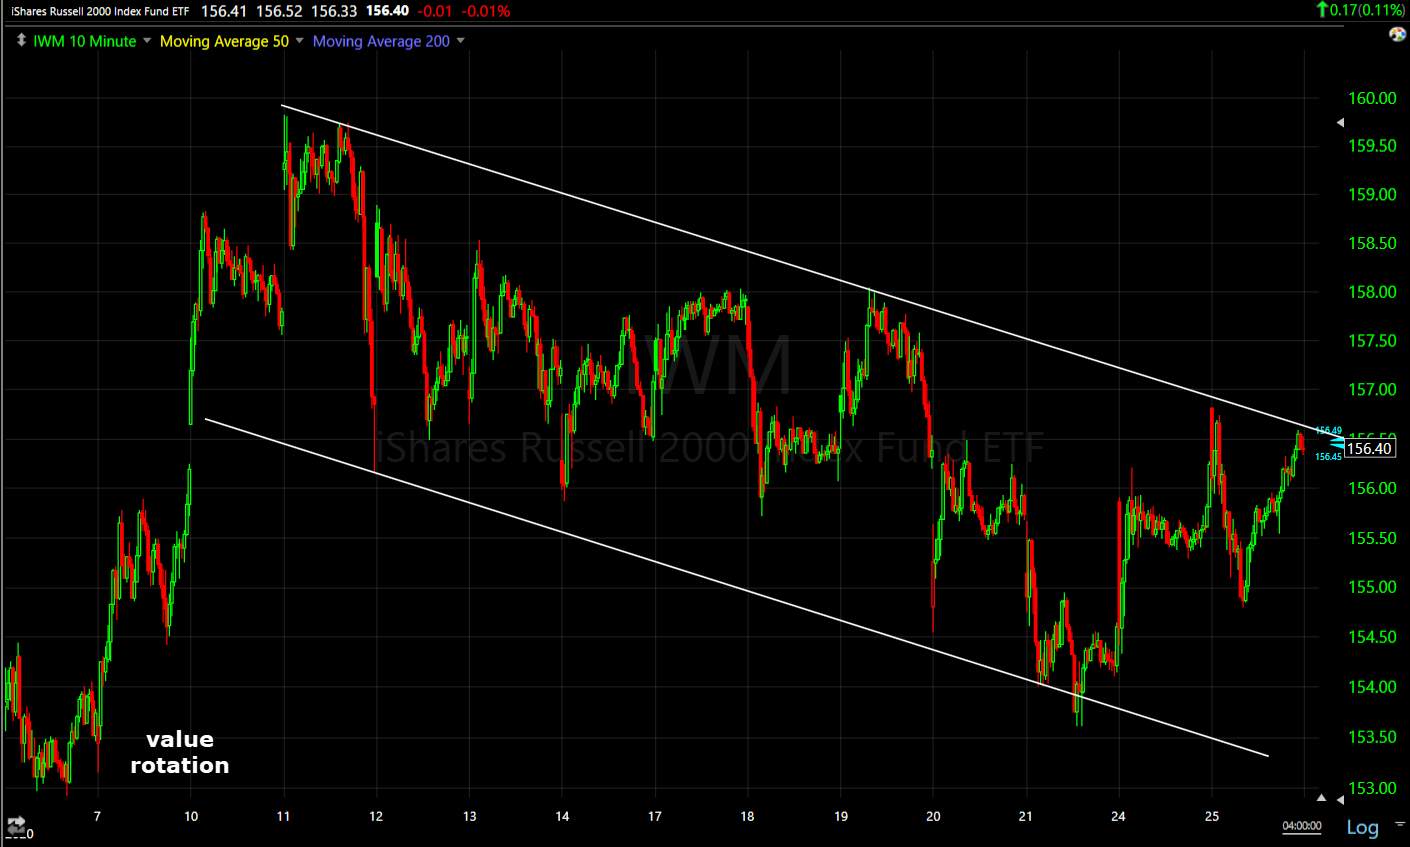
IWM (10m) gained on the rotation to value around August 7th, and fell as that rotation failed.
Below you can see how much influence the cyclical sectors have had on Small Caps, but Small Caps are not considered value. Despite their underperformance vs. the S&P on the year, they are much more richly valued than the S&P.
 Small Caps and cyclical sectors (5m from the start of August). I’ve mentioned before that Small Caps’ consolidation looked like Dow’s bullish flag, but it has been driven by the failure of rotation to economically sensitive sectors, and retraced just about all of the initial gains from that rotation.
The 3rd chart from the top shows how money has moved from value to momentum and the effect it has had on cyclicals vs. the FANGS. Lets add in the rate sensitive, bond proxy defensive sectors (Real Estate, Utilities and Consumer Staples).
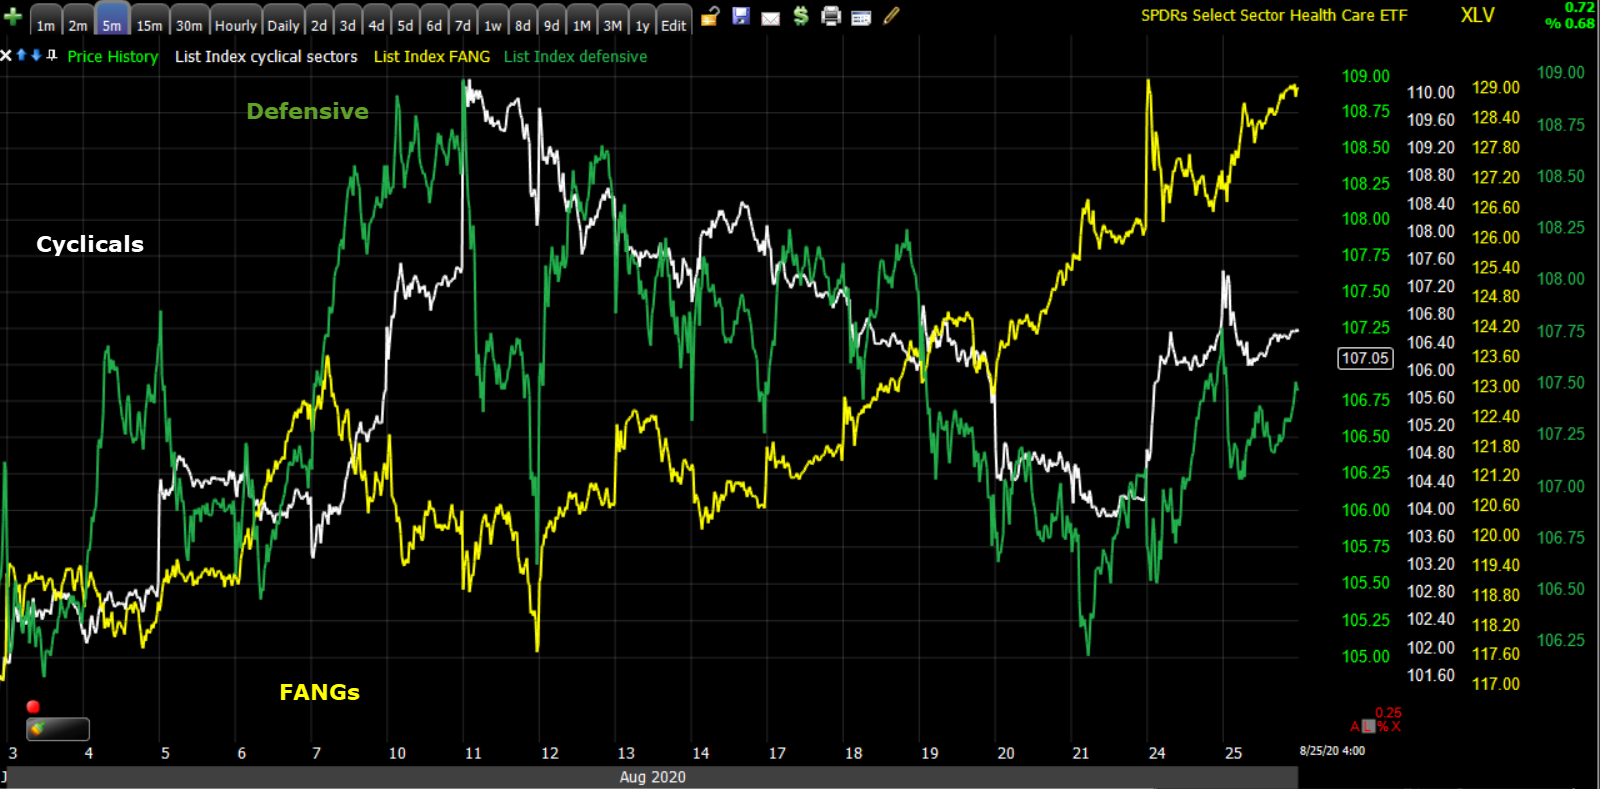 Notice the early month rotation favored the defensive sectors as well as cyclicals. This is why market breadth improved for about a week earlier in the month. At the same time the FANGs fell, then that completely reversed and both defensive and cyclical sectors fell, which is partly why market breadth has been increasingly horrendous as 5 mega-cap stocks drive higher the NASDAQ, S&P and to a lesser extent the Dow.
Below you can see how a handful of mega-cap Tech stocks have driven the NASDAQ higher.
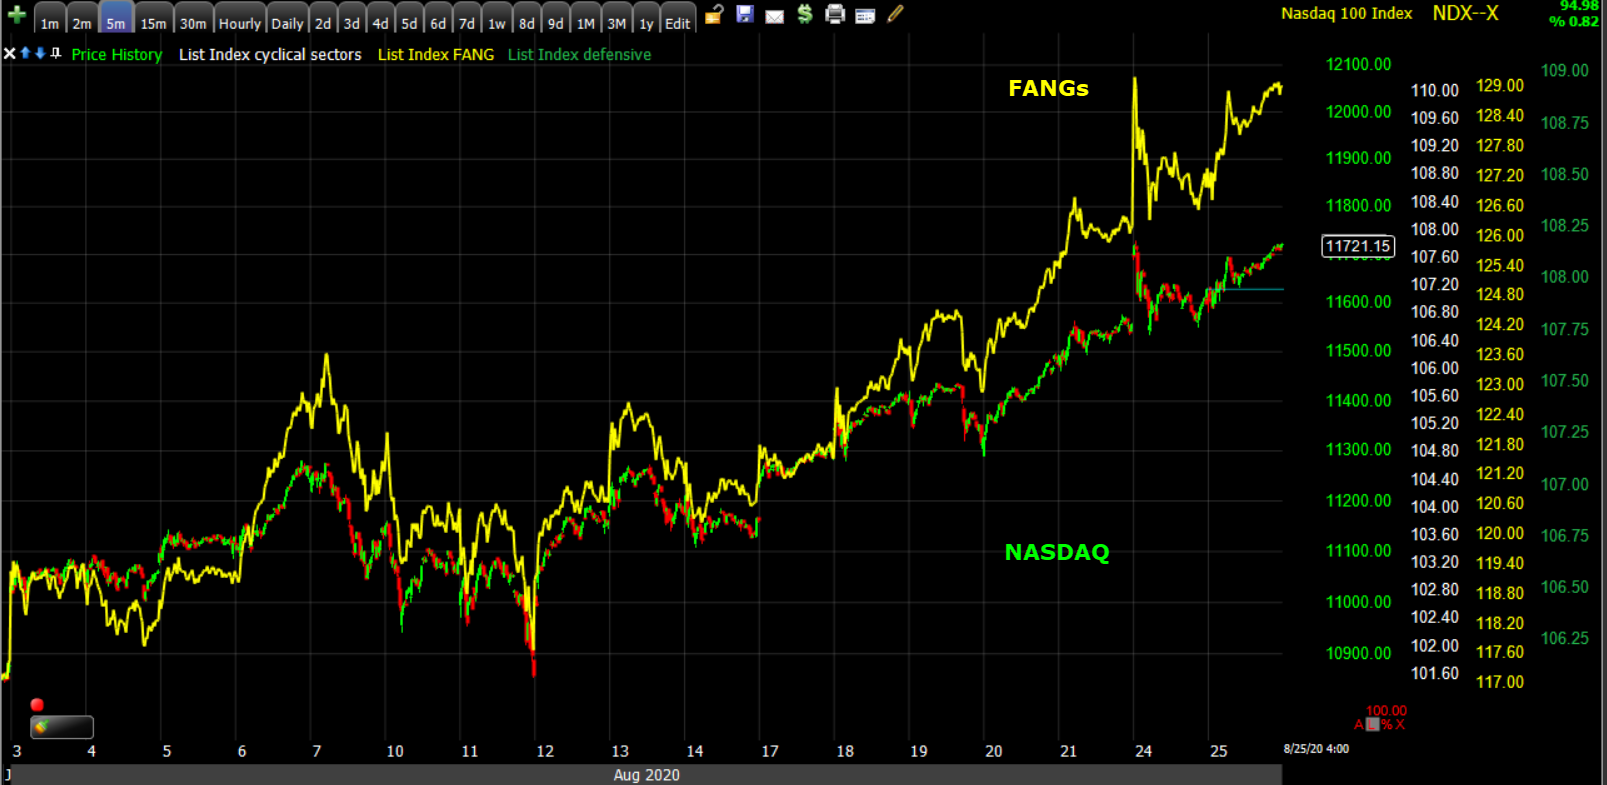
We saw this same dynamic in January and February in which it seemed money the Fed was pumping into the system via Repo operations and QE4 went straight to the mega-caps, while the majority of stocks started fading. The dynamic is way worse now, the worst I can recall.
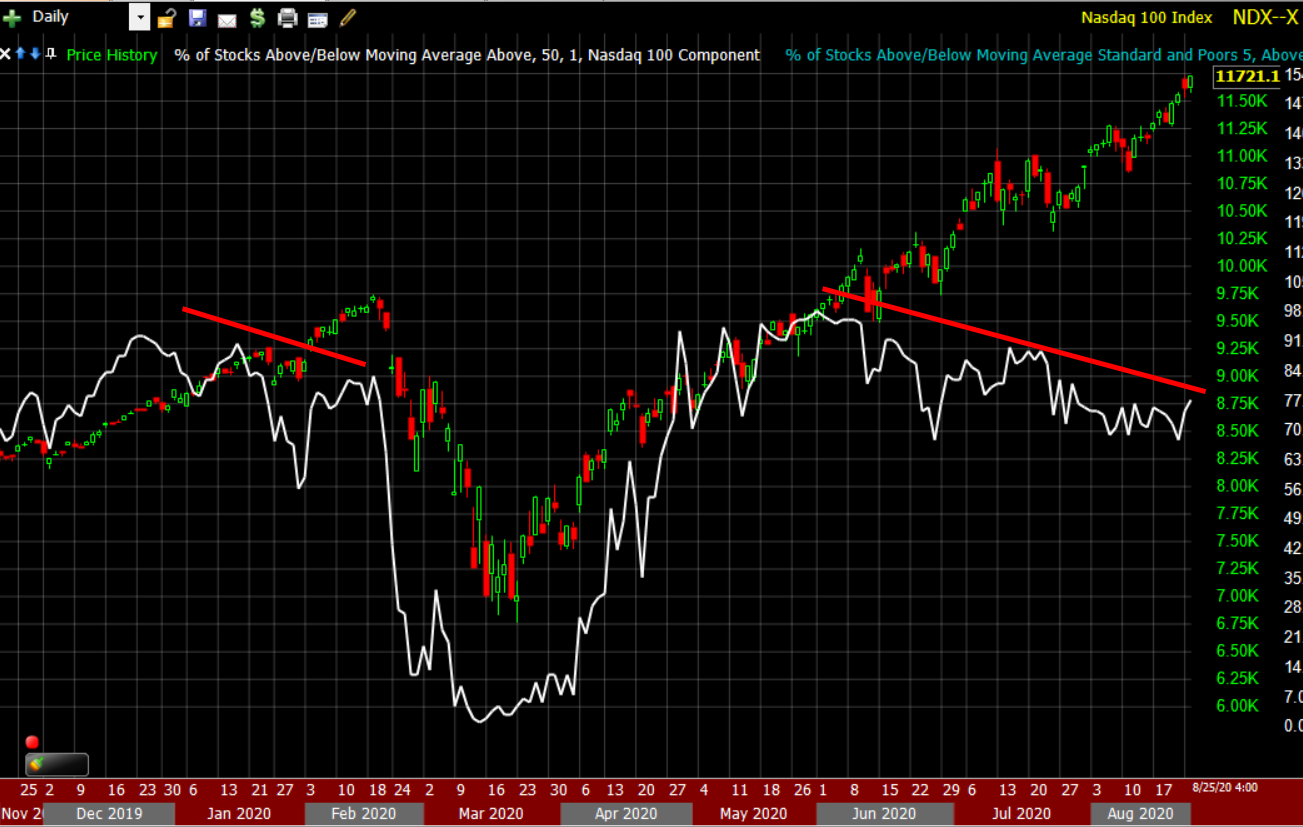 NASDAQ 100 (daily) and the percentage of NASDAQ 100 stocks above their 50-day moving average. You can see the divergence earlier this year as fewer and fewer stocks participated in the gains led by mega-caps. It’s worse now. And it has been getting more acute recently.
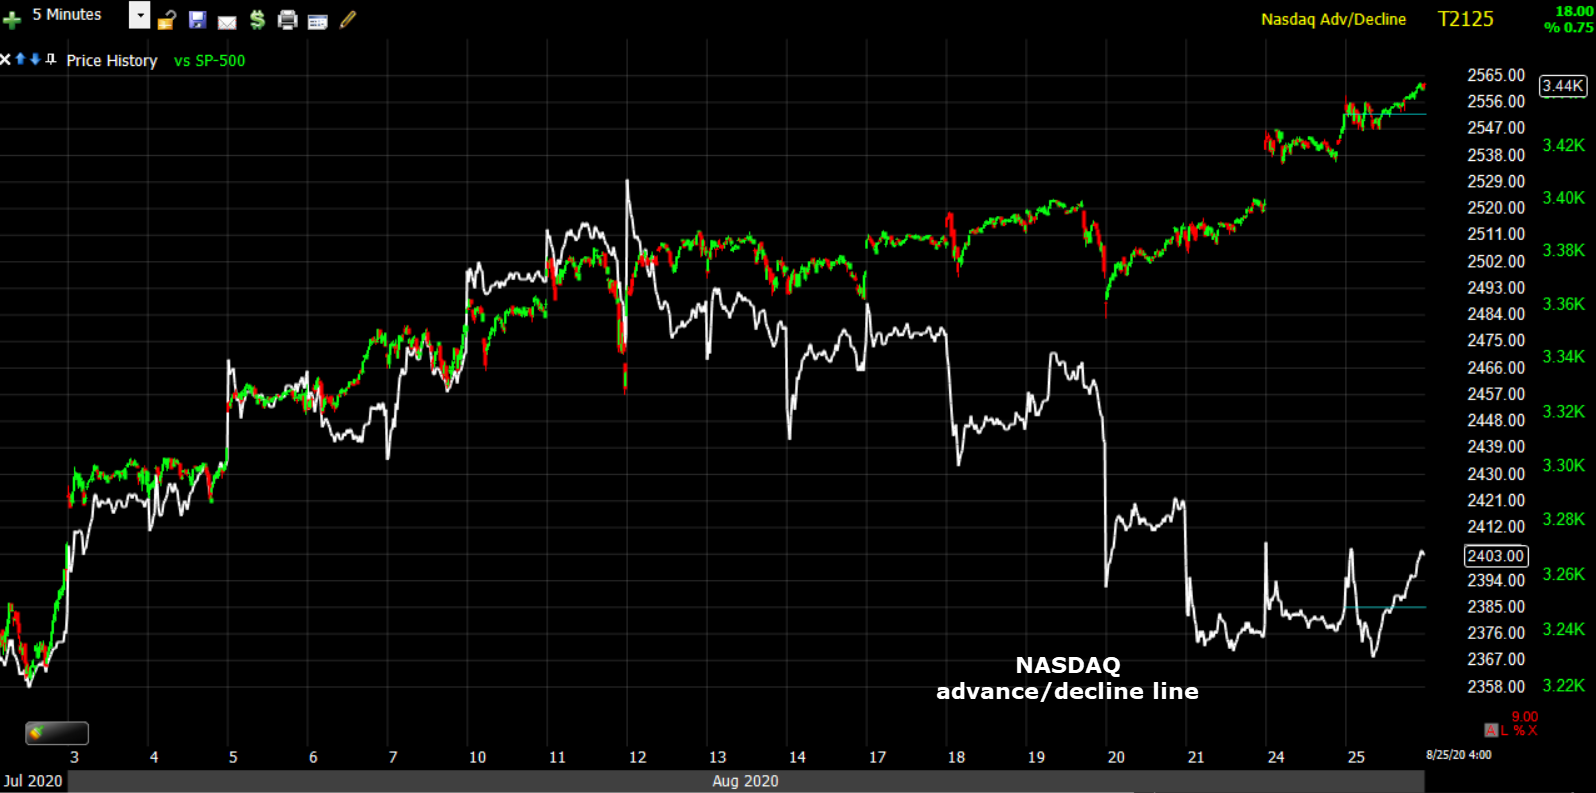
NASDAQ 100 (5m) and the NASDAQ Composite’s advance/decline line. Divergences in advance decline lines are very rare. Other breadth indicators show trouble long before and prices usually crack before the weakness becomes this apparent on advance/decline lines.
From a bigger perspective, since the S&P-500 closed above February’s high, the S&P has enlarged its massive Broadening Top.
 SP-500 (daily) I’ve never seen a broadening top this large in any asset class or stock, and certainly not a major index. There’s no doubt in my mind that this is the result of the Fed’s increasingly unconventional policy, whereby the solution to one crisis sows the seeds of the next crisis.
A Broadening formation (higher highs and lower lows) is a depiction of a market that has lost intelligent sponsorship, a chaotic market that is more often driven by news and rumor. Here it is with some context…
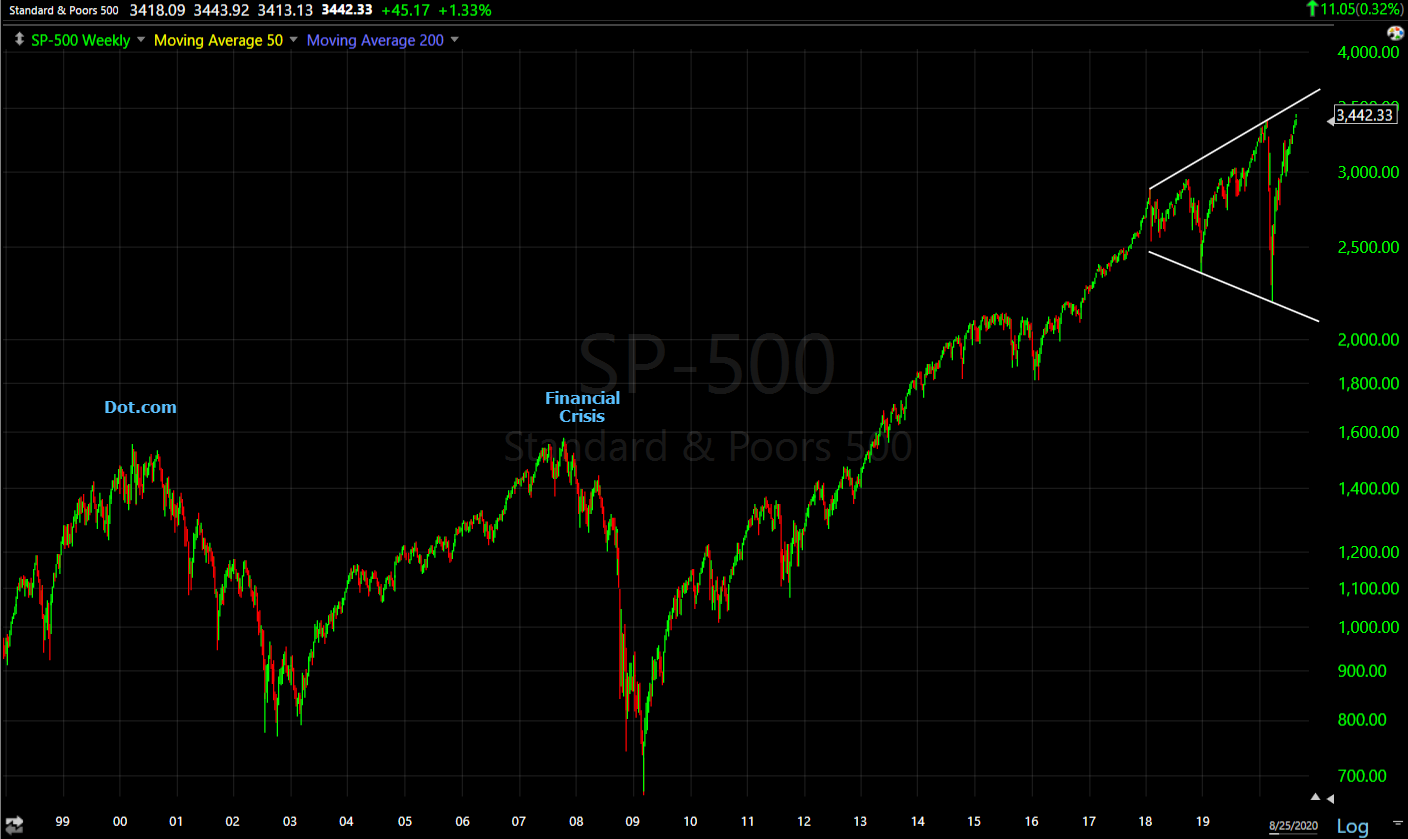
SP-500 (weekly) recessions and bear markets are natural and even healthy so massive imbalances aren’t built up, the same way regular small forest fires clear underbrush and prevent massive infernos. It sure looks like the Fed has been fighting the economic cycle. The Fed started with ZIRP (zero interest rate policy) and QE in 2008-2009. Their policies have gotten more unconventional and extreme since then. I think this chart is worth some contemplation. It seems like the Fed is stuck in a feedback loop of ever more stimulus creating larger imbalances followed by steeper crashes requiring more extreme stimulus leading to steeper rallies and greater imbalances. That appears to be exactly what’s behind this broadening top = higher highs and lower lows. It depicts exceptionally unstable conditions and as you might have guessed by the name, Broadening Top, they’re not bullish and usually don’t end well.
S&P sectors
While mixed, the theme was mega-cap heavy sectors and Health Care led, while growth-sensitive cyclical sectors lagged along with rate sensitive defensive sectors as treasuries fell and yields gained. DEfensive and cyclicals down, that’s the same trend of the entire month.
Energy was yesterday’s best performer and today’s worst, even as Crude gained as U.S. crude production in the Gulf of Mexico saw huge shut-ins.
The re-opening trades that did well yesterday (Cruise lines, Airlines, Resorts and Casinos) were out of favor and weak today. American Airlines (AAL -2.25%) confirmed today that it will cut 19,000 workers if federal payroll aid expires as scheduled on Oct. 1, capping a 30% workforce reduction since the coronavirus pandemic began.
Materials ⇩ -0.40 %
Energy ⇩ -1.40 %
Financials ⇧ 0.28 %
Industrial ⇩ -0.13 %
Technology ⇧ 0.50 %
Consumer Staples ⇩ -0.22 %
Utilities ⇩ -0.95 %
Health Care ⇧ 0.68 %
Consumer Discretionary ⇧ 0.33 %
Real Estate ⇧ 0.31 %
Communications ⇧ 0.94 %
I came across this chart of DocuSign (DOCU +0.3%), one of the stocks that soared as a result of Coronavirus and the work at home trend.
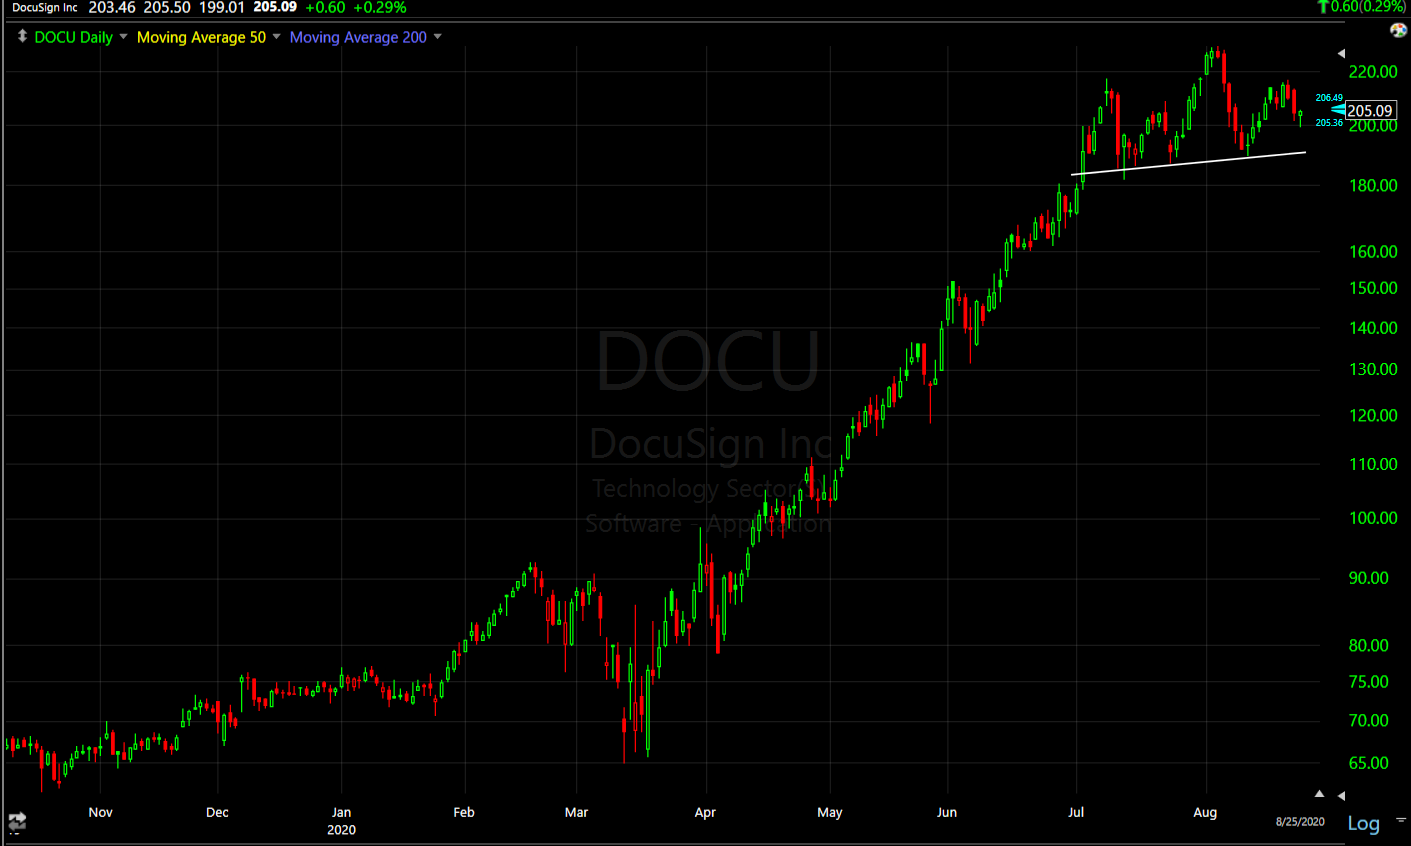 DOCU (daily) is looking a lot like a head and shoulders top with a neckline around $190. The measured move for the pattern would suggest about a -25% drop below the neck line toward the $141 area. I thought it was interesting given how much the stock had run up and in context of weaker price action this week in stocks like Tesla and Apple.
Internals
Yesterday’s strong internals didn’t last long. The S&P made a new closing high with more NYSE stocks Declining (1524) than Advancing (1436), and on very light volume of 713.3 mln. shares. That’s about 30% lower than the declining 50-day average volume and the second lowest volume of the rally.
It was the second lowest volume for the SPY too and about -45% lower than the 50-day average volume.
The Dominant price/volume relationship for the component stocks of most of the averages was Close Down/Volume Down, which is fairly benign, more typical of a consolidation day. For the NASDAQ 100 it was Close Up/Volume Down, which is the weakest, most bearish relationship.
Volatility
Volatility started the day with relative strength again, but faded in the late afternoon (VIX -1.5%).
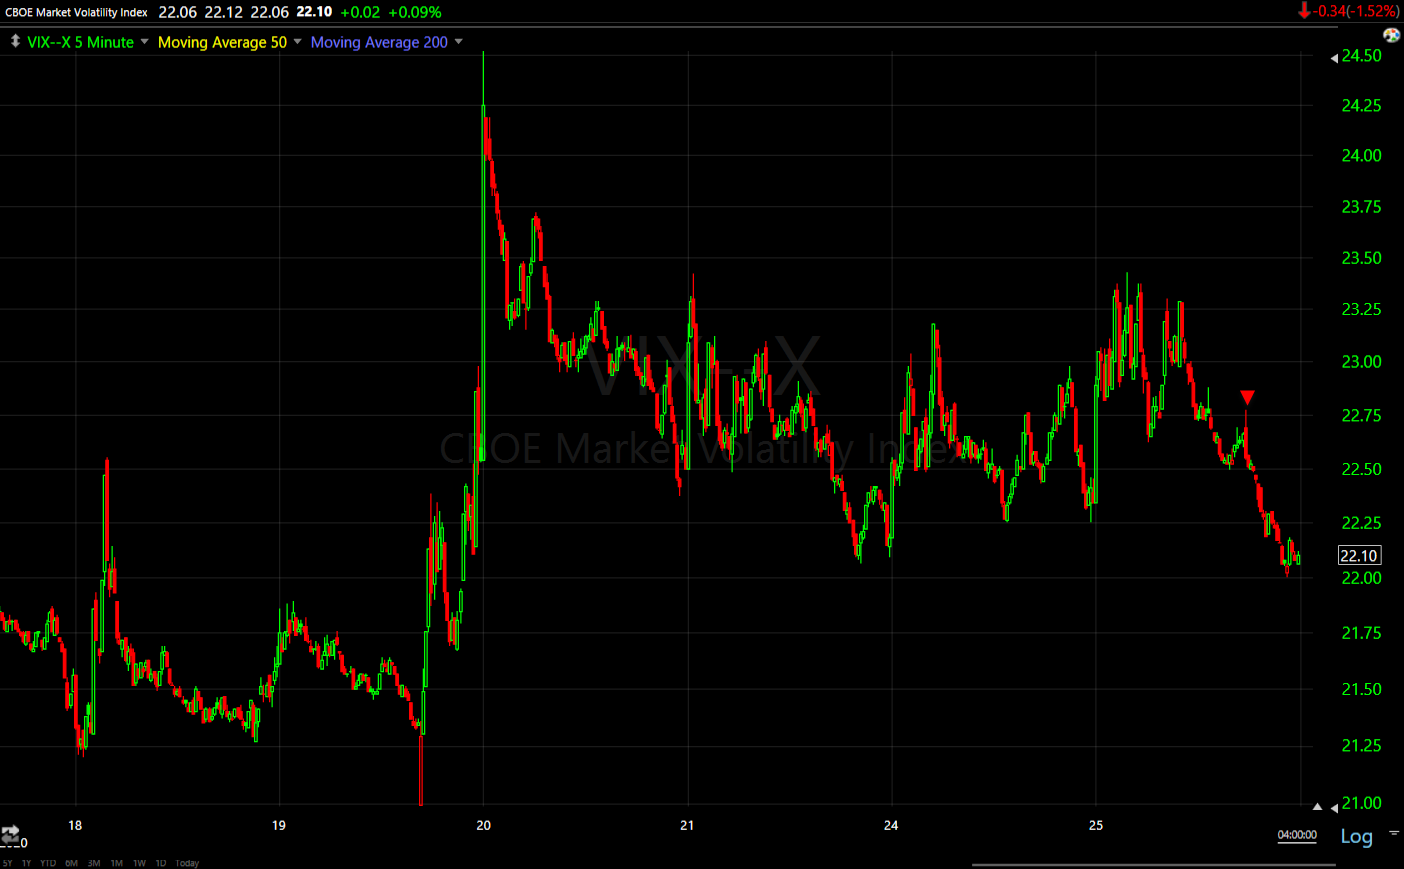 VIX (5m) since the 19th the S&P has closed higher 4 consecutive days and made 3 new record highs. VIX should be well below the lows of the 19th.
We should expect volatility to weaken ahead of Jay Powell’s Jackson Hole Symposium speech Thursday as is usually the case before Fed events.
On a side note, the Absolute Breadth Index hit a low of 15.50 on August 4th. Extreme lows (I use under 14 as a trigger) tend to precede large moves higher in volatility, VIX usually up double digits within a month, sometimes days.
ABI moved higher as market breadth improved with the rotation to cyclicals/defensive and small caps that started on August 7th. ABI moved up to 39, but stalled out mid-month as the rotation to cyclicals stalled out, and has traded sideways in the mid 30’s. The ABI dropped 10 points the last two days. It’s not into the teens yet, but the last time I mentioned it in late July it was in the 40’s and the reason I mentioned it was because it fell so sharply so quickly and came close to the extreme low signal (below 14) shortly after. At the pace of the last 2 days, ABI could be back in the teens before the end of the week.
Treasuries
U.S. Treasuries finished the session mostly lower, with longer-dated maturities seeing a bulk of the losses. The 2-year yield increased one basis point to 0.16%, and the 10-year yield increased four basis points to 0.68% in curve steepening trade. It seems Treasuries dropped on a rumor that Powell’s is expected to outline a new inflation framework in his Thursday speech. Many are speculating that that new framework will be based on an “average inflation target” that would allow yearly inflation to run past 2.0% to make up for the years it ran below.
Real yields dropped back below -1% today, which may start to have a beneficial effect on gold.
Currencies and Commodities
The U.S. Dollar Index declined -0.3% to 93.01.
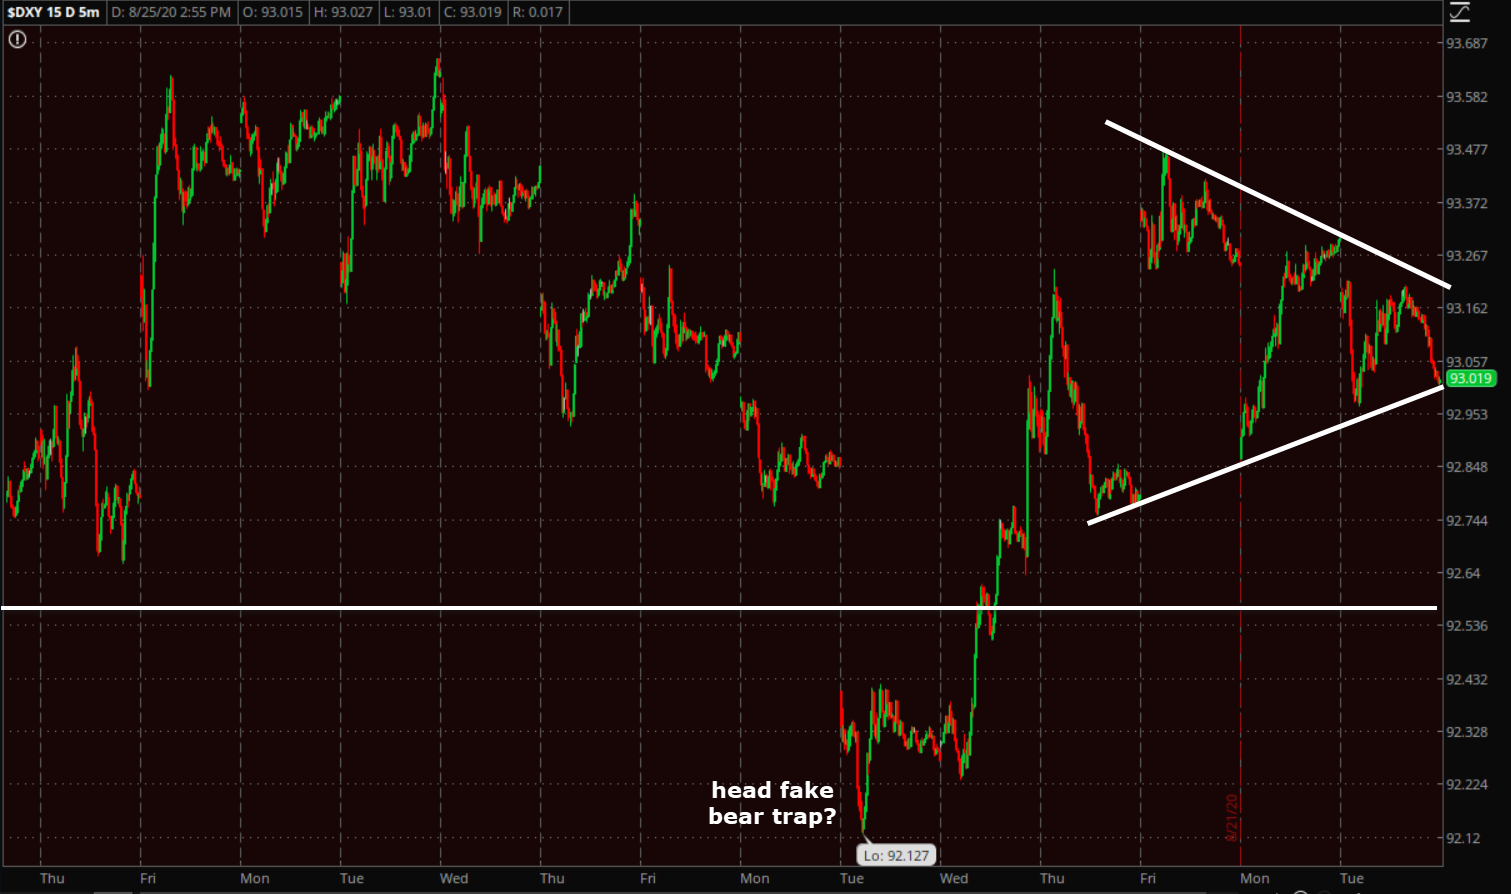
U.S. Dollar Index (5m) since last week’s potential head fake/bear trap, the Dollar appears to be consolidating in a symmetrical triangle (bullish bias due to the preceding advance). I think there’s a very good chance it’s sitting in this consolidation waiting to hear what Powell has to say on Thursday. I continue to think that a Dollar rally or even short squeeze would be a surprise to most and would have dramatic negative consequences across a number of asset classes from stocks to commodities.
WTI crude futures rose 1.7% to $43.33/bbl. with huge shut-ins for US crude production in the Gulf due to Hurricane Laura.
Cryptocurrencies were weak today with Bitcoin dropping below 11,500.
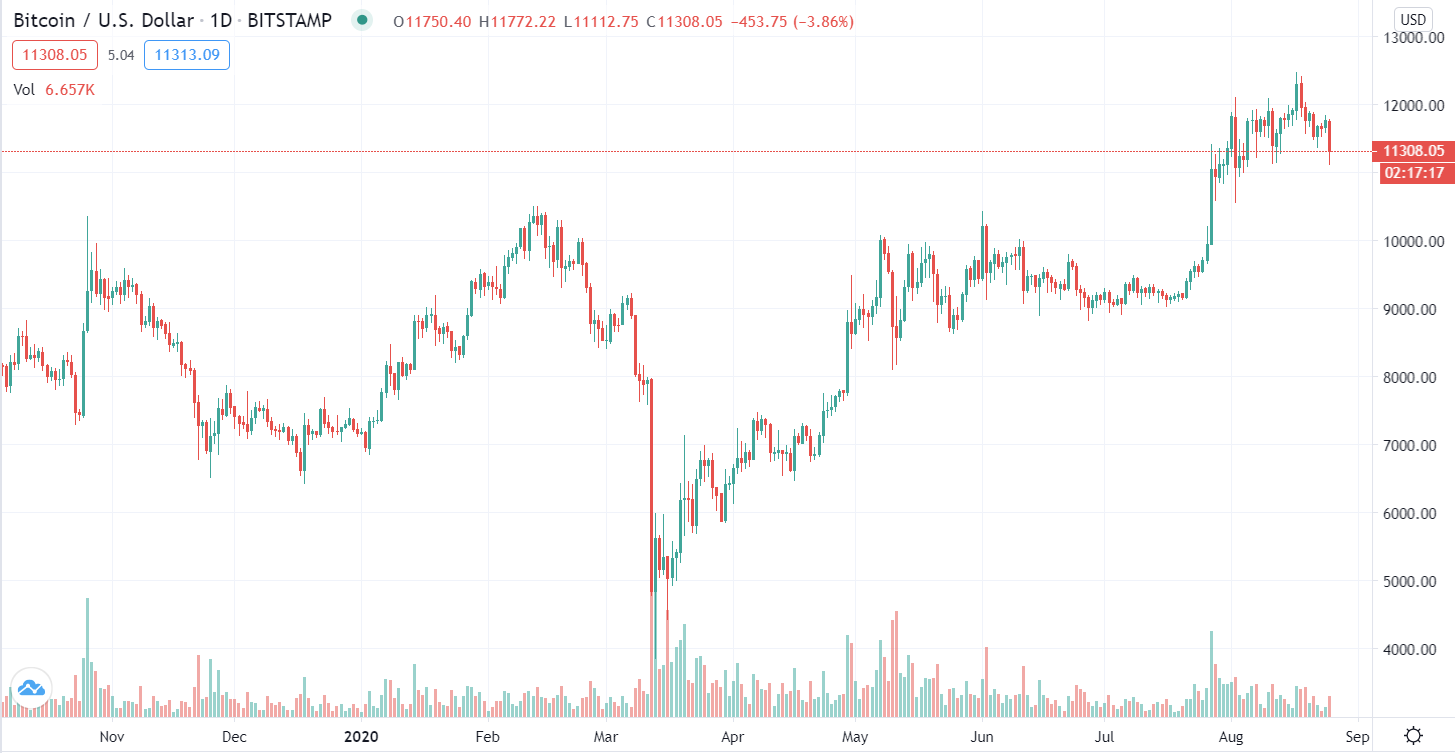 Bitcoin/USD (daily) the price action is not bothersome to me given the zone of supply at 12,000.
Summary
The cash sessions have been very dull since the start of last week. The only exception was a negative response to last Wednesday’s FOMC minutes, which revealed nothing new, but a market reliant on the Fed always doing more, took them as not dovish enough. There has been very little movement in the cash session in price terms and on 3C charts. Market breadth has been increasingly eroding. Volatility has displayed relative strength since the FOMC minutes, but I wouldn’t be surprised to see it weaken as Powell is set to speak on Thursday at the Jackson Hole symposium.
It looks to me like the market has lost its narrative. Earlier in the month the narrative shifted to buying the underperforming (value) stocks mostly in the economically sensitive cyclical sectors, which is a bullish development as it requires faith that the economic rebound isn’t just a snapback on re-opening, but it here to stay. We’ve seen this same attempt to buy the group at least four times over the last year and two times since mid-May. The rotation hasn’t stuck. Just yesterday this group was bid up for the first time in almost 2 weeks and could not follow through today. I would think that the crash in Consumer Confidence would put a nail in the rotation’s coffin since the U.S. economy is services driven by the consumer. That leaves the mega-caps, which by most metrics are extremely valued. I think the greatest risk to them, other than a shift in mass sentiment, is either a higher dollar or higher yields, both of which pressure their already historically stretched valuations.
About two weeks ago high yield credit was sharply negatively diverging with the S&P. It has rallied since then, but is still posting a relative negative divergence. More recently investment grade corporate credit has been displaying weakness. Remember these are assets backstopped by the Fed so notable weakness would seem very unusual.
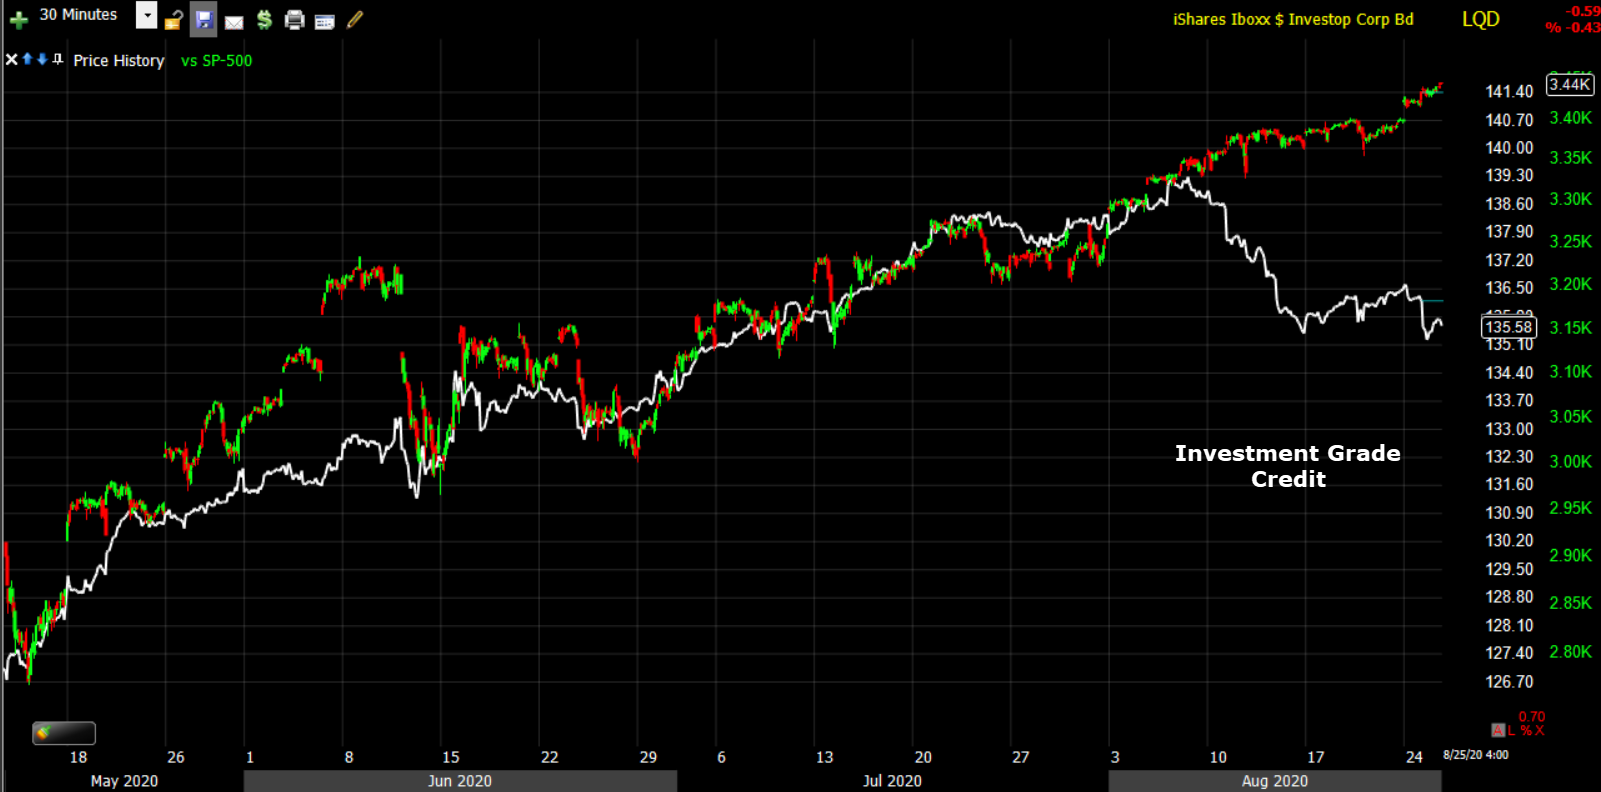 SP-500 (30m) and IG credit. I’m fairly certain the cause is the rise in rates that started with the rotation to value/cyclicals. Although yields did pull back as the rotation failed, but they didn’t retrace the entire advance. Higher rates tend to be positive for cyclicals like Financials/Banks, but if they rise too far, too fast, they can shock the market and valuations, which would most likely hit overvalued areas like mega-caps first. I noted last week that risk parity funds have been underperforming since the decline in Treasuries (rise in rates). The danger to risk parity is a sell-off in stocks and bonds, or a sharp sell-off in one (like bonds) that forces them to deleverage in the other side (stocks). I’ve seen episodes in which these funds deleveraging alone started a sell-off in the broader market. In any case, just something to be aware of, especially ahead of Jackson Hole on Thursday,
Overnight
S&P futures are near unchanged (+0.05%), but there is a 3C negative divergence developing pretty clearly.
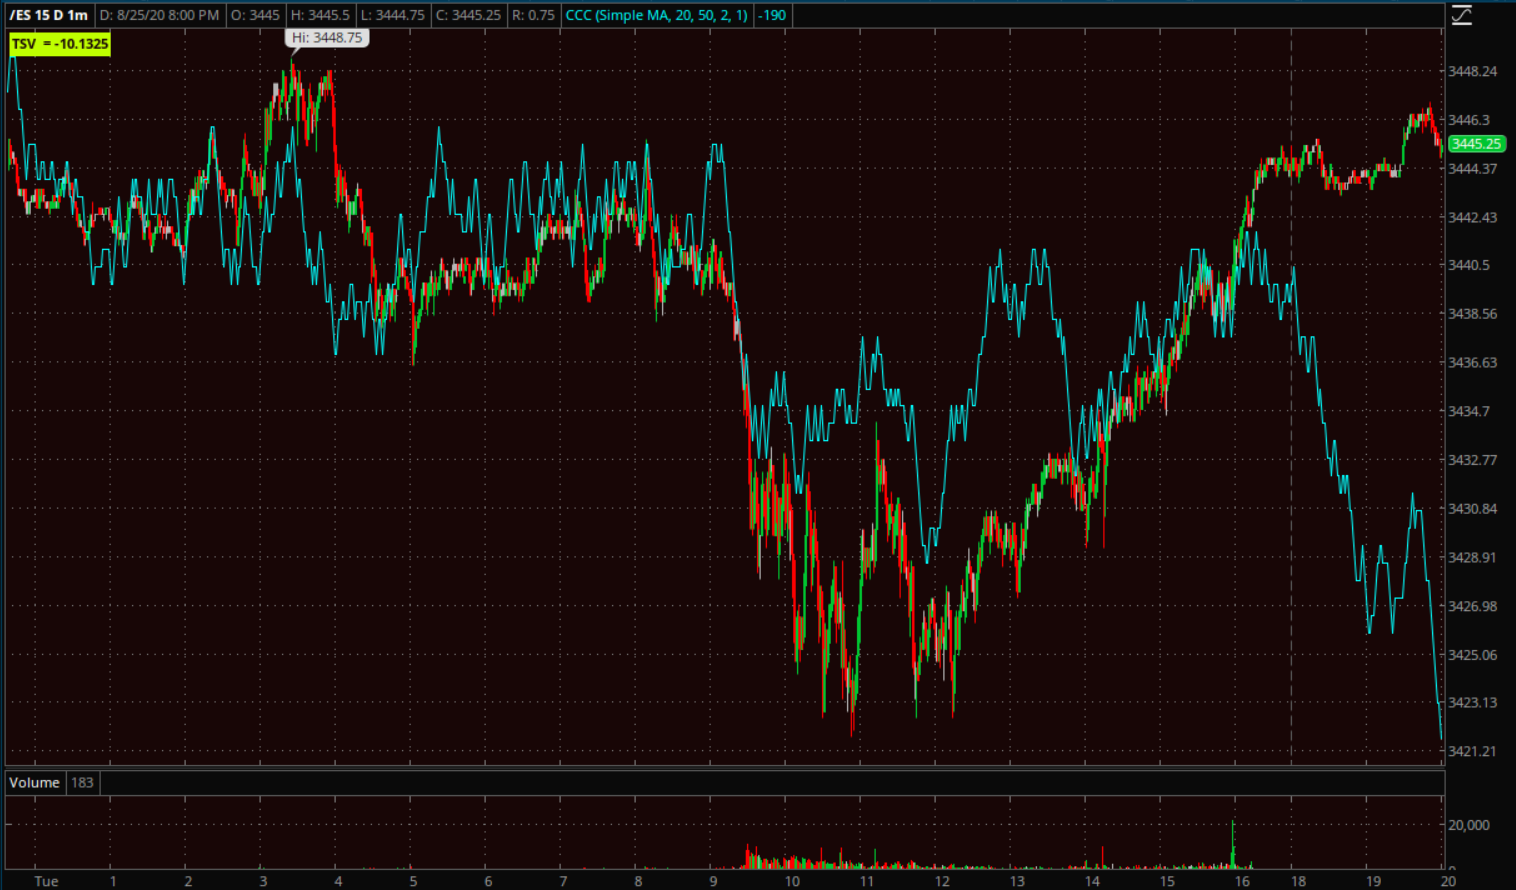 S&P futures (1m)
The NASDAQ 100 futures’ 3C chart is exactly the same. Dow and Russell 2000’s price action has been more of a bounce/consolidation off the morning lows. Their charts are closer to in line tonight, but weakness for the week is evident.
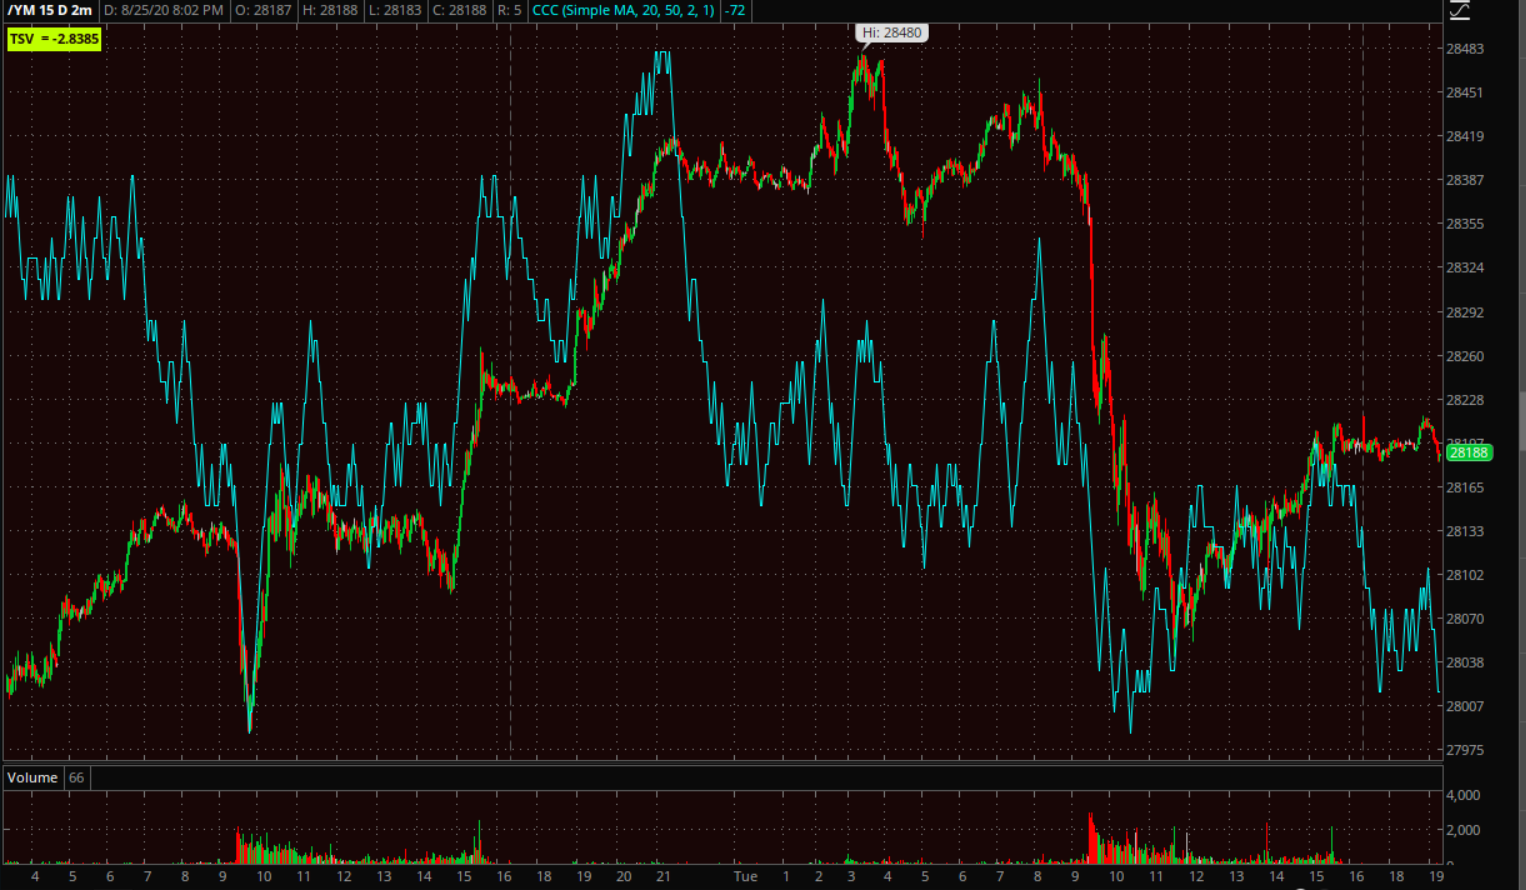
Dow futures (2m) negatively diverged overnight heading into this morning’s open. R2K futures are nearly the exact same.
VIX futures started a positive divergence this afternoon and despite price falling late afternoon, the divergence is still developing.
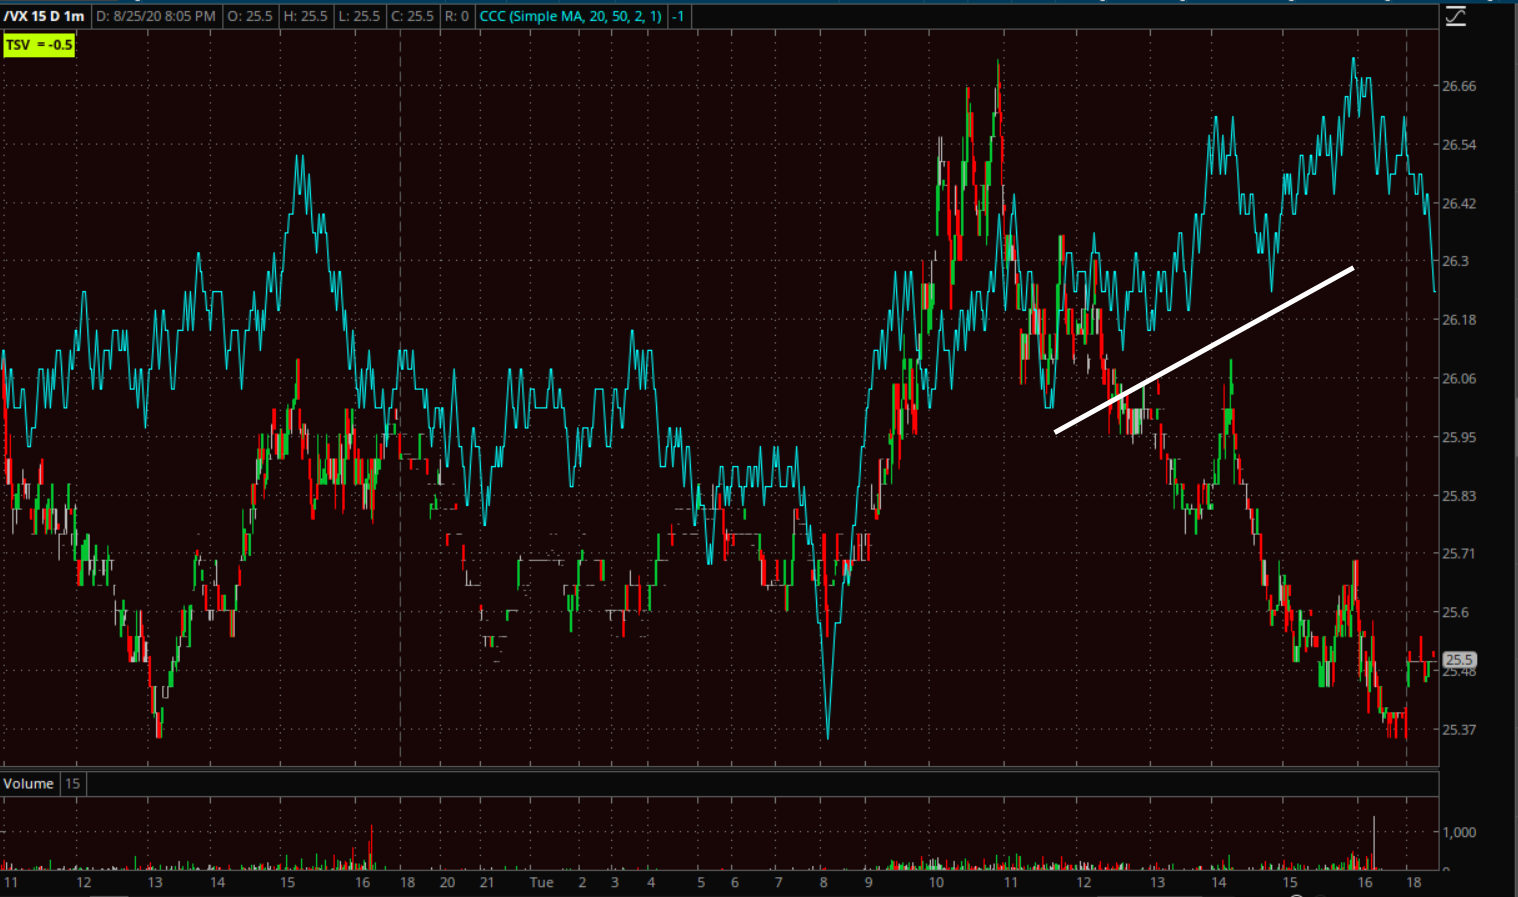
VIX futures (1m)
These aren’t huge in historical context, but there has been virtually no movement over the last week so it is a change in tone.
WTI crude futures are unchanged. They have a smaller negative divergence forming just over the last hour.
It looks like the Dollar is set to weaken overnight and Treasury futures too, so that should be a supportive environment for index futures. I’m interested to see what the 3C charts look like in the morning.
Looking ahead, investors will receive Durable Goods Orders for July and the weekly MBA Mortgage Applications Index on Wednesday.