Daily Wrap
The S&P spent most of the day trading in the same narrow range from yesterday until the final two hours as the mega-caps lifted NASDAQ, S&P and Dow. The five mega-cap stocks (Facebook +6.5%, Apple +3.5%, Amazon +0.6%, Alphabet +1.6% and Microsoft +1.6%) accounted for all of the S&P-500’s +0.65% gain, despite 54% of the index closing lower. Apple has added a third of a trillion in market cap over the last week alone, closing in on a 2 trillion market cap, and represents 7% of the S&P-500’s market cap.
Today was the first time this week the 5 stocks weren’t mixed and heading in different directions. There was no specific catalyst behind their advance.
Meanwhile, expectations of a deflationary maelstrom sent the 10-year real rate to a new all time record low of negative -1.10%, while gold made a new all time record high, up 14 of the last 15 days.
Initial claims for the week ending August 1 were better than feared, decreasing by 249,000 to 1.186 million (consensus 1.400 million), and the U.S. lifted its advisory to avoid all international travel. The latter helped put a bid in the airline stocks (JETS +2%).
Lawmakers scheduled stimulus talks for this evening. The White House and congressional Democrats are up against a self-imposed Friday deadline. President Trump said if a deal does not get done, he expects to act unilaterally and sign orders Friday or Saturday extending enhanced unemployment benefits and imposing a payroll-tax holiday. He told reporters he’ll also act on eviction protection and on student loan repayment. There’s still some question over whether he can use executive action, though.
Trump will reimpose a 10% levy on some Canadian aluminum imports. The decision reflects administration concerns about struggles by American aluminum producers, who’ve said they’re hurting from a “surge” of metal from Canada, and comes just weeks after the updated North American trade agreement went into effect.
Averages
Small Caps’ 3C confirmation started fading late yesterday and overnight, while QQQ’s 3C chart got a boost in the last 8 minutes of trade yesterday (see the charts in yesterday’s Daily Wrap). Small Caps underperformed the benchmark S&P while NASDAQ outperformed, also driven by the 5 mega-caps.
NASDAQ 100 made a 4th record closing high for the week, yet the number of NASDAQ 100 stocks trading above their own 50-day moving average fell again today with 5 less than yesterday – the lowest level since June 26th when the NASDAQ was 14% lower. Highlighting the 5 stocks’ influence, the NASDAQ 100’s equal weighted index closed +0.1% nearly unchanged, and over 100 basis points lower than the NASDAQ 100.
S&P and Dow both have mega-cap components and their rally this afternoon lifted both averages in the last two hours of trade. S&P’s equal weighted index closed down -0.1%, a 75 basis point difference. That’s very similar to the Russell 2000. The NYSE Index has the most stocks of any index in the world and it also closed nearly unchanged (-0.02%). Said another way, 5 mega-cap stocks were responsible for all of the day’s gains while most of the market did absolutely nothing. That has been the dominant theme this week.
S&P 500 ⇧ 0.65 %
NASDAQ ⇧ 1.27 %
DOW JONES ⇧ 0.68 %
RUSSELL 2000 ⇩ -0.10 %
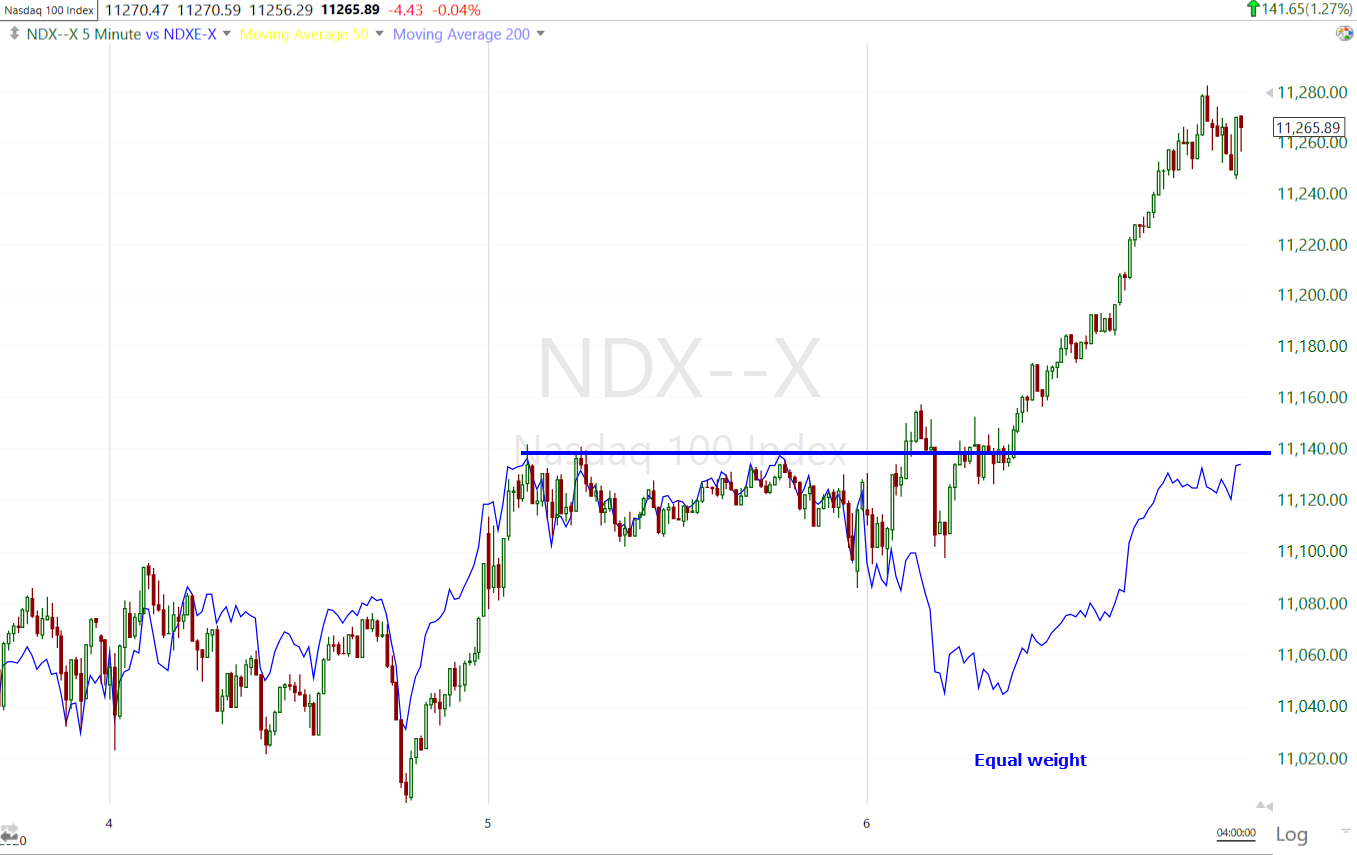 NASDAQ 100 (5m) and NASDAQ 100 equal weighted index is trading in the same range as yesterday, but the weight of the 5 FAAGMs pushed NDX to a new high.
S&P sectors
For the most part yesterday’s leading sectors (cyclicals) were today’s laggards, and yesterday’s laggards (Tech and Communications) were today’s leaders. I’ve noticed a lot of this hot-potato rotation this week, never spending too much time in any one place.
Materials ⇩ -0.42 %
Energy ⇩ -0.80 %
Financials ⇩ -0.04 %
Industrial ⇧ 0.38 %
Technology ⇧ 1.41 %
Consumer Staples ⇩ -0.02 %
Utilities ⇧ 0.58 %
Health Care ⇩ -0.53 %
Consumer Discretionary ⇧ 0.49 %
Real Estate ⇧ 0.19 %
Communications ⇧ 2.63 %
Internals
Not surprisingly, both NYSE and NASDAQ had more declining stocks than advancing stocks, and declining volume was heavier than advancing volume.
NYSE Advancers (1458) vs. Decliners (1479) on lighter Volume of 791 mln. shares. NASDAQ had 1492 advancers and 1765 decliners.
Like every day this week there was no single dominant price/volume relationship and there has been no 1-day overbought or oversold conditions, highlighting the low conviction the market has displayed all week… as if it were waiting for something.
Volatility
VIX lost -1.6%, but both NASDAQ and Small Caps’ volatility gauges ended marginally higher, as if the market had closed flat like the NYSE. There was no notable movement on 3C charts of volatility.
The Absolute Breadth Index closed at 20.8, the low of the week was 15.75. I’ve been looking for a move below 14, but I don’t want to give the impression that a move into the teens is an extreme low and not significant on its own. This week’s 15.75 is the lowest since mid-January (7.7) which was followed by VIX rising +50% before the end of the month.
ABI reached 15.80 on February 21st, although by that time the crash was starting and numerous asset classes had been warning for over a month. Still, VIX gained an incredible 400% over the next month.
Treasuries
U.S. Treasuries finished little changed. The 2-year yield was flat at 0.11%, and the 10-year yield declined one basis point to 0.54%. The 10-year yield had been down 4 basis points in the morning and slowly climbed into the afternoon as mega-caps took over leadership.
TLT and treasury futures on the long end saw positive 3C divergences into the close, suggesting a slightly more defensive stance into tomorrow’s Payrolls.
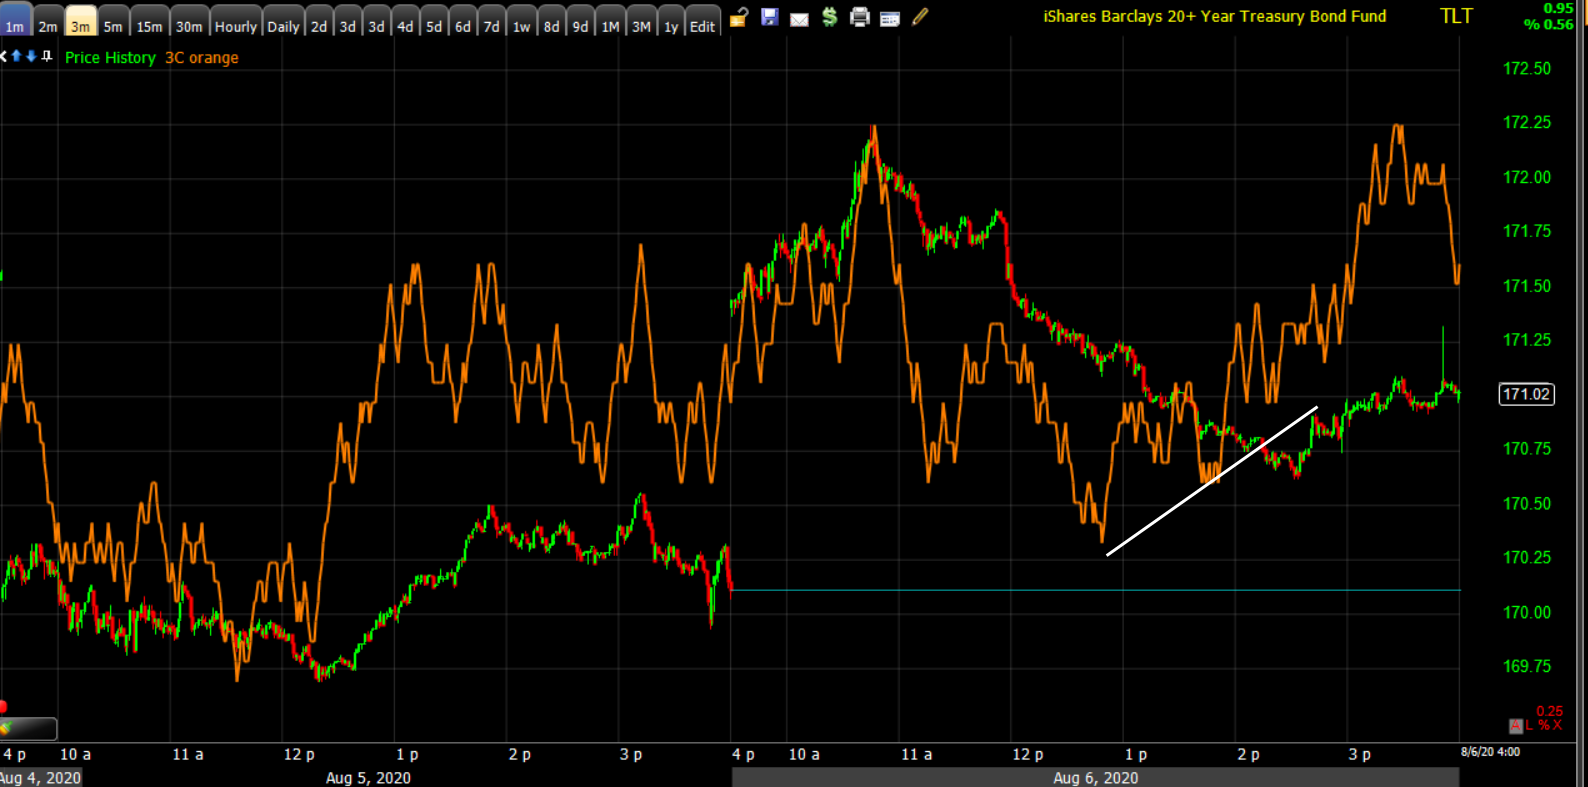
TLT (1m) pulling back from the morning’s high with a positive divergence at the afternoon low.
The 10-year real rate fell to a record low of -1.1% , which is one of influential the driving forces behind gold’s rally.
Currencies and Commodities
The U.S. Dollar Index declined -0.1% to 92.77.
The standout in the currency space, as mentioned in the Emerging Markets Update, was the Turkish Lira crashing, signalling investors expectations of a collapse of the Turkish economy.
WTI Crude oil closed lower by -0.7% to $41.95/bbl. (prices are sticky around $42- where overhead supply begins), and hanging right along the trend line in recent focus.
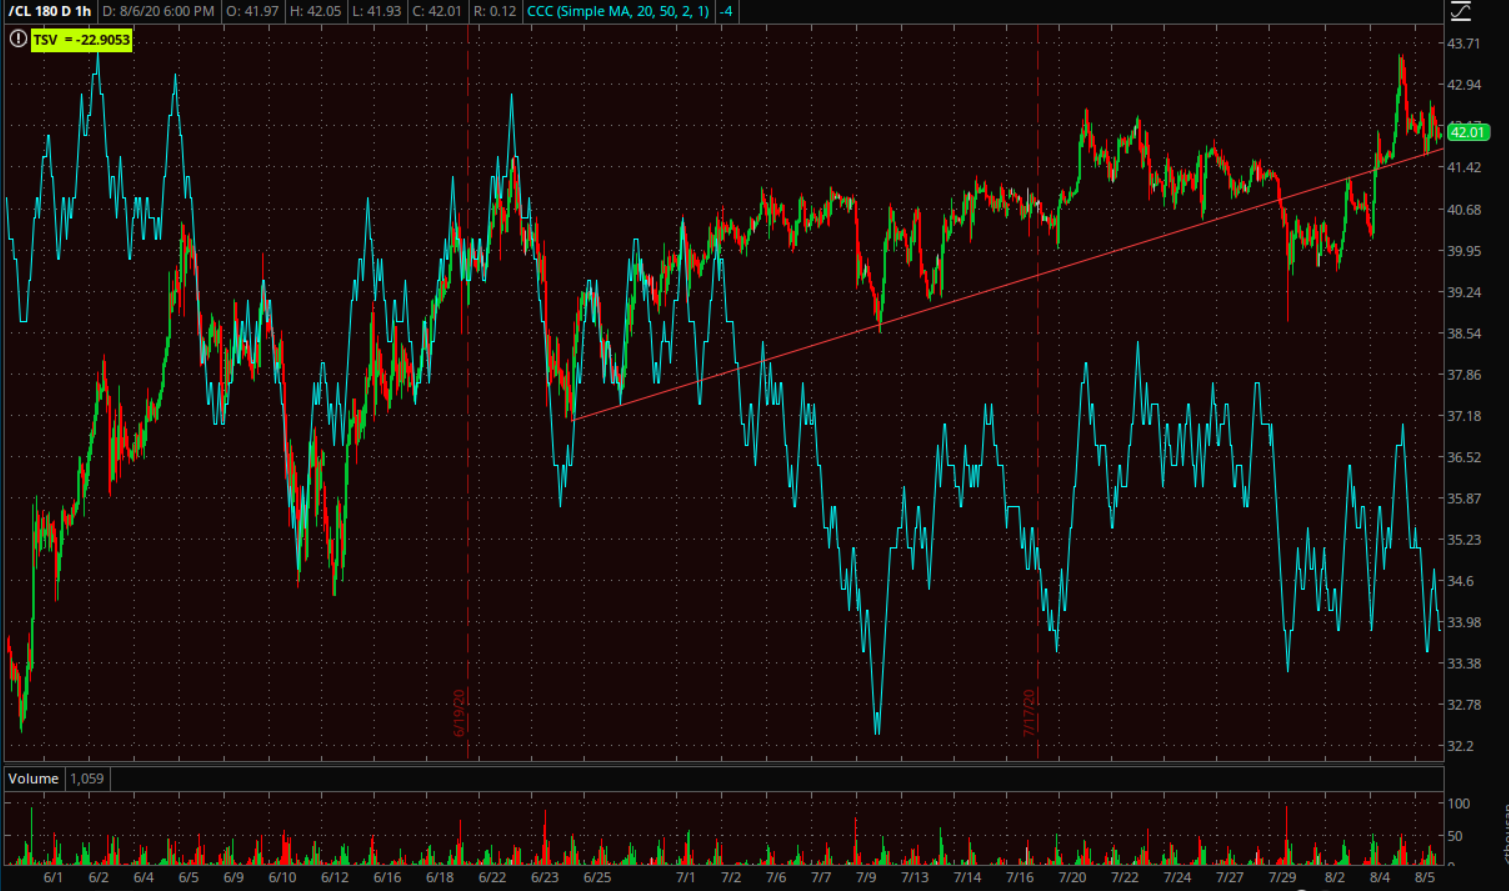
WTI Crude futures (60m)
Gold futures continue their tear higher, adding another +0.9% to $2068.80/ozt, and silver futures outperformed, rising +5.5% to $28.37/ozt.
I updated GDX/Gold miners (-0.67%) today and bought some calls. I wrote, “I’m buying some August 21 at the money ($41) calls.” That was a typo, at the money was $44, that’s what I meant.
GBTC (Grayscale Bitcoin) added another +4.34% today and +12.7% this week, outperforming everything except Silver.
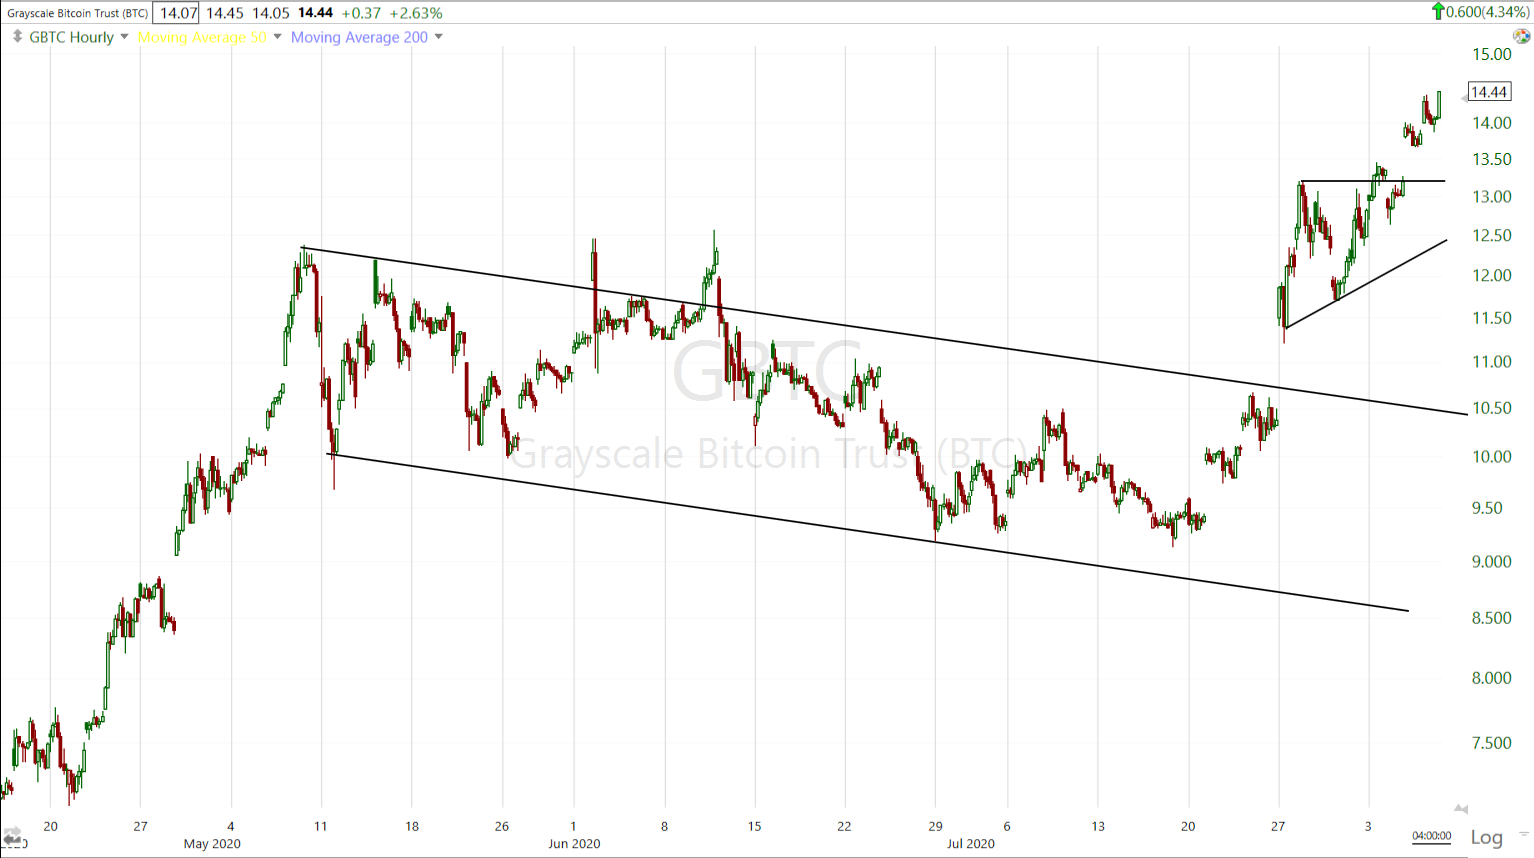 GBTC (60m)
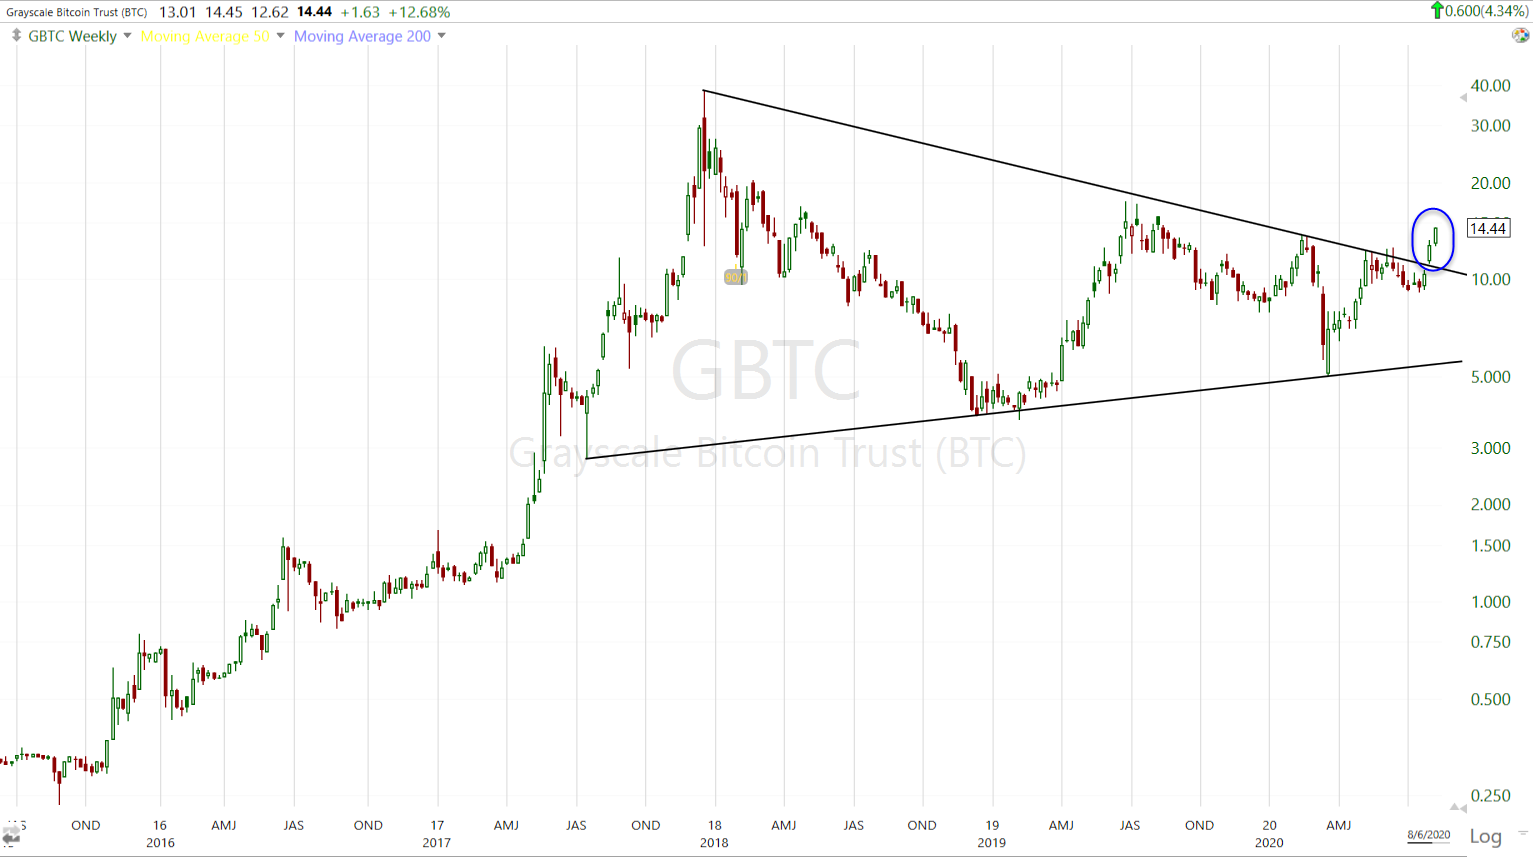 GBTC (weekly) – more important to me than the percent change is the follow through of last week’s breakout. I like everything about the price action here.
Speaking of price action, the PLUG long trade idea from yesterday worked great. It wasn’t only timely in breaking out the next day (today), but it acted as expected, running up to the first target zone of $11. It had been up +23% at $11.48 and backed down to $10.73 on the close, up +15% for the day.
I updated PLUG earlier today when it was up +21% and mentioned that with the +250% gain in the calls, you could take the initial investment off the table and let the rest run risk free. I didn’t do that, but I often do. Whatever you do, don’t get attached to the trade and let a win turn into a loss. It’s easy to get attached to trades that jump 20% in a day.
I’d have preferred that PLUG close at the high of the day as that’s very bullish, but I don’t have any issues with the price action so I intend to hold looking for the higher target of $15.80, unless I see something in the price action before then that suggests otherwise.
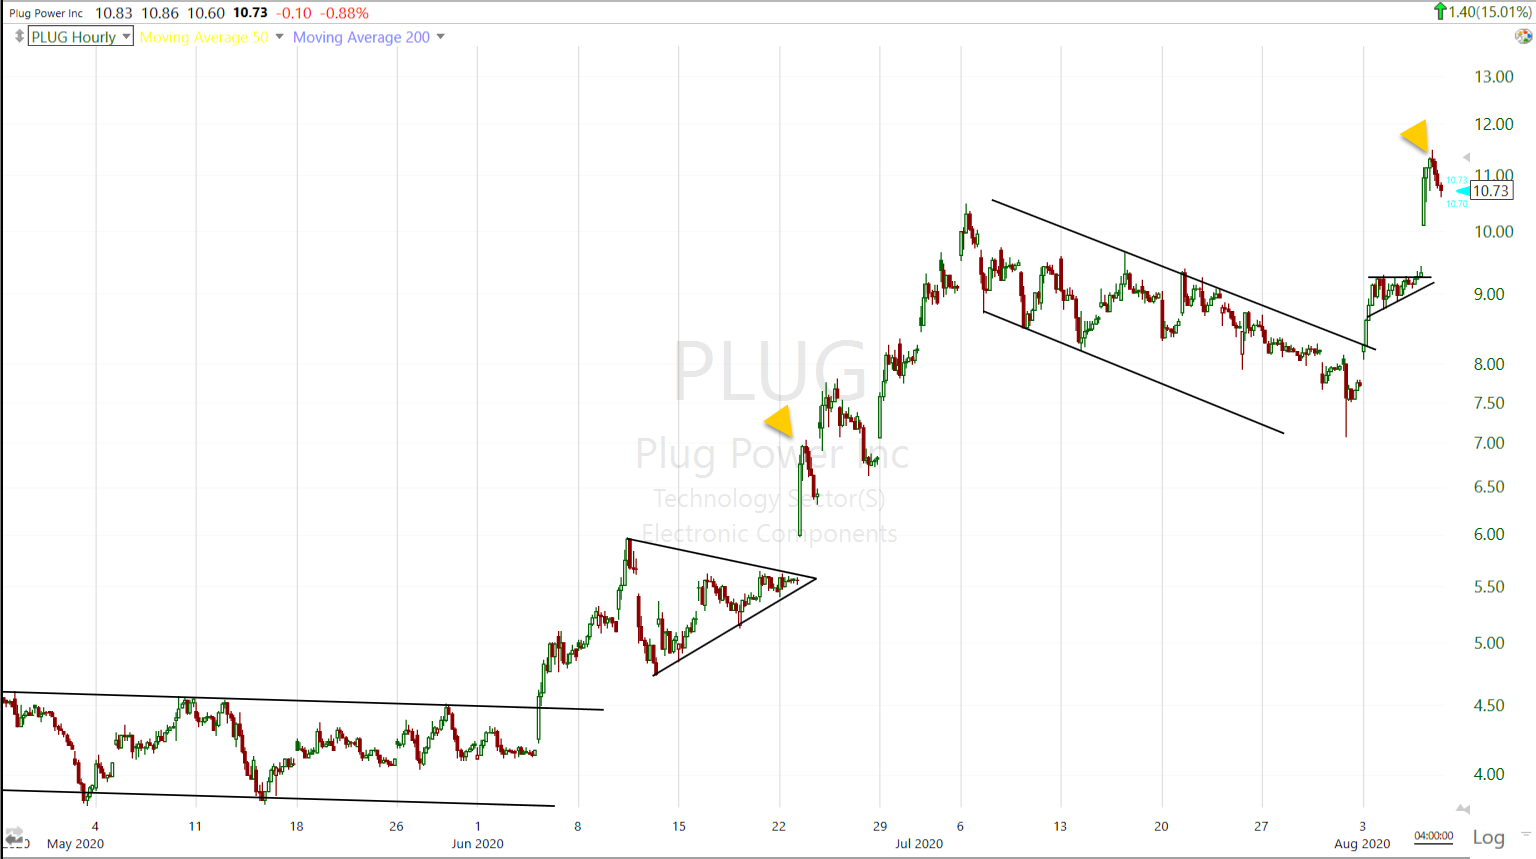
PLUG (60m) notice the chart’s bullish consolidations? It looks a lot like gold did several weeks ago, gold miners or silver. Just for example and context, today’s price looks almost identical to the breakout from the sym. triangle on June 23rd. The $11 area was the smaller of two measured moves and was expected to be a waypoint, so I have no issues with today’s move.
Summary
My takeaway for the stock market is the same as it has been all week. The market feels like it’s treading water, but has an overall optimistic take that a stimulus package will get done. Then of course there’s the ongoing earnings related influences, for example Disney’s effect on the Dow yesterday.
There’s a lot of rotating from here to there without staying in any one sector or theme too long before rotating to something else. For example yesterday it was small caps/cyclicals leading, today NASDAQ/mega-caps. That’s what 3C charts have shown as well. NASDAQ/QQQ lost confirmation Monday and it went sideways for 3 days. Russell 2000 lost confirmation yesterday and did nothing today. Actually most stocks did nothing today. The NYSE is the broadest index in the world and it was -0.02%. The median stock today was -0.18%.
Even crude oil popped back to the trend it slid below last week and is hanging out there like its a perch.
Volatility has been fairly dull, but that matches the S&P’s dull price action. The Absolute Breadth Index is something completely separate from volatility, it’s based on market breadth alone and has no component of volatility whatsoever. The CBOE SKEW Index remains very elevated at 141.75 today.
There are areas of conviction… like precious metals and crypto currencies, or… anything but the Dollar, or fiat. Perhaps tomorrow’s Payrolls report shakes things up. To be honest, a flat or dull market is the most nerve racking, stressful and time-consuming market for me.
Overnight
S&P futures are flat and losing 3C confirmation.
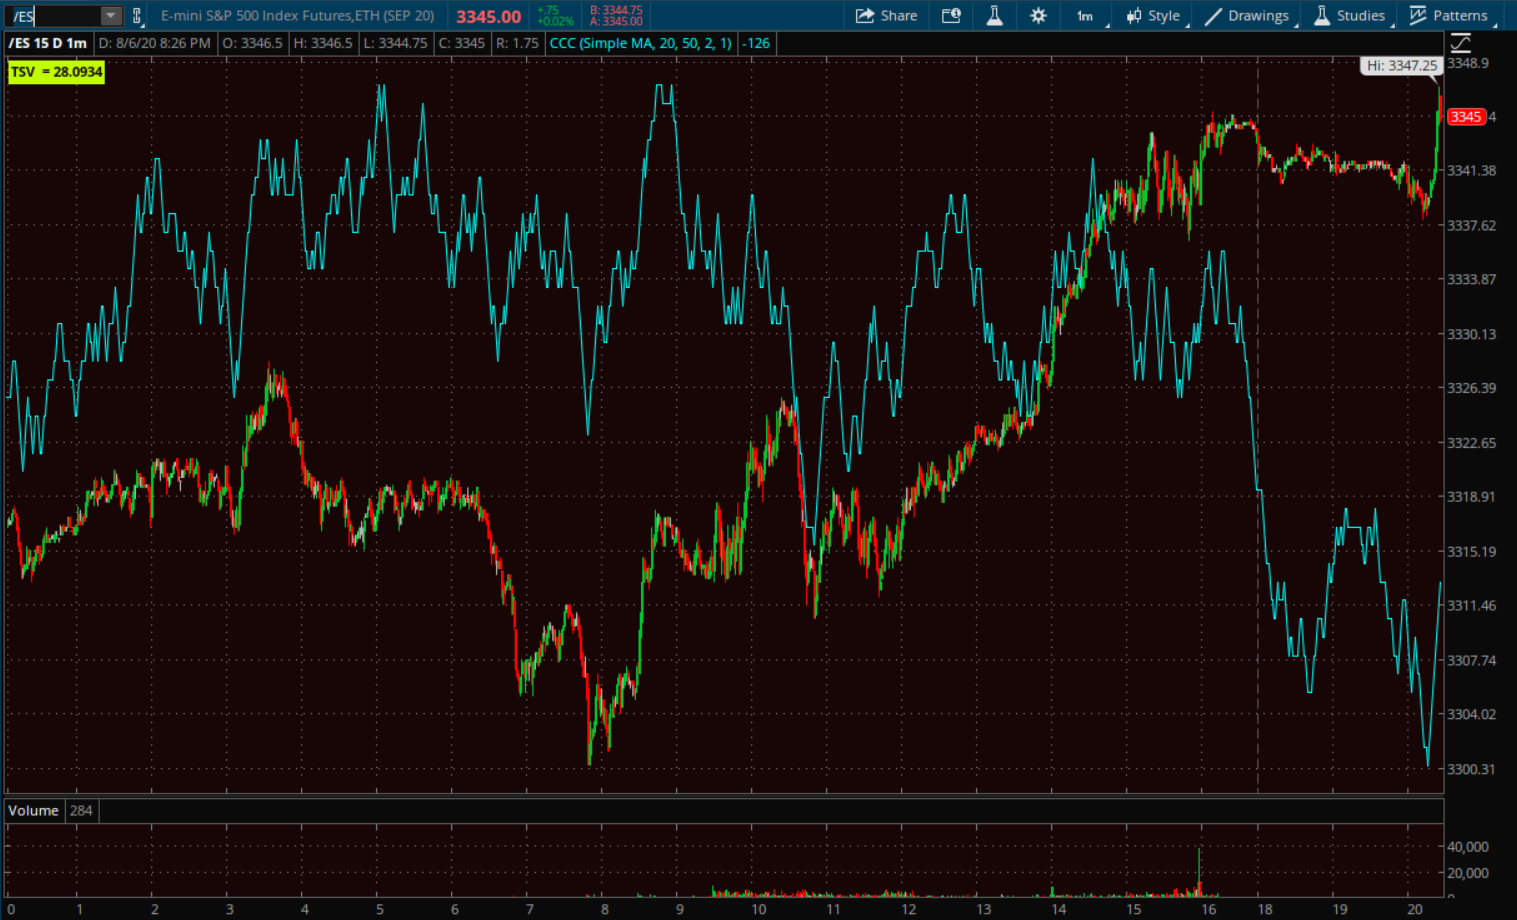
S&P futures (1m) – I suppose this divergence shouldn’t be surprising as it was the weight of 5 mega-cap stocks that drove the afternoon gain, and that’s not much of a driver overnight.
WTI futures are little changed at +0.5% ($42.15).
Gold futures, however, are up +0.5% to $2078.50. Silver futures are +4.6%.
I don’t expect there will be too much movement overnight. We will receive the key economic data point for the week before the open, the Employment Situation Report for July. Also Consumer Credit for June, and Wholesale Inventories for June on Friday.
The only change to my positions is adding GDX August 21 $44 calls.