Daily Wrap and Overnight Session – February 12, 2020
The major averages extended the last 2 weeks’ gains. The narrative of the day was shaped by reports from China indicating the slowing pace of the coronavirus, President Xi Jinping vowed that China would meet its economic goals while winning the battle against the deadly pandemic. Meanwhile, Fed Chair Powell concluded his congressional testimony, assuring investors that “the economy is in a good place”.
The market shrugged off a collapse in Euro area industrial production earlier today. Industrial production fell -2.1% in December on an M/M basis, and -4.1% in December on a Y/Y basis – its weakest level since 2012.
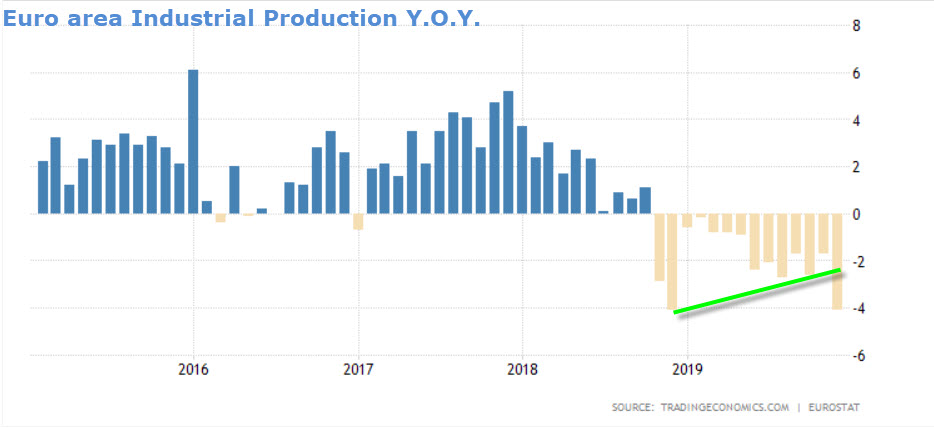
The economic “green shoots” turned brown.
It has only been 3 days since China started to return to work following the extended lunar new year holiday, and it may prove to have been premature.

Commenting on the trade deal with China, Treasury Secretary Steve Mnuchin claimed that the implementation of the phase one has slowed down due to the virus outbreak, adding that the full report about the coronavirus effects in China will be revealed in three to four weeks. On the other hand, he insisted that phase two negotiations are ongoing despite the disease issues in the Asian country.
Averages
The Dow and NASDAQ were the best. Small Caps showed some early weakness after the open, but bounced back toward the benchmark’s performance.
S&P 500 ⇧ 0.64 %
NASDAQ ⇧ 1.00 %
DOW JONES ⇧ 0.94 %
RUSSELL 2000 ⇧ 0.71 %
Dow futures’ gained overnight and gapped the cash index above a congestion zone.
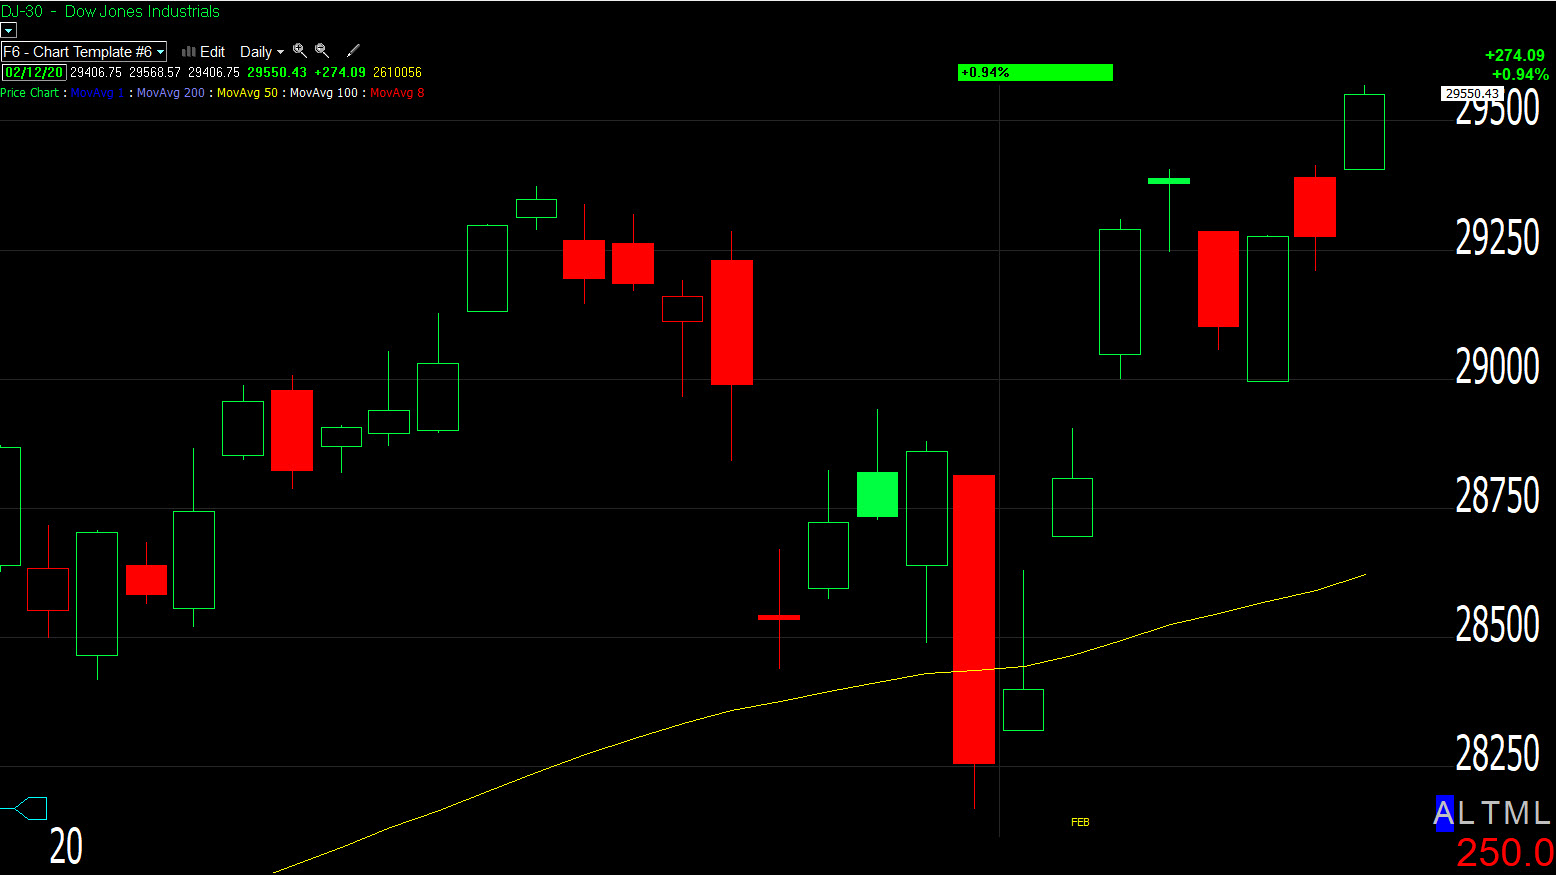 Dow (daily) opened above the congestion zone around 29,400.
I suspect Russell 2000 futures’ 3C chart tapered off heading into the cash session due to its own congestion or resistance zone nearby.
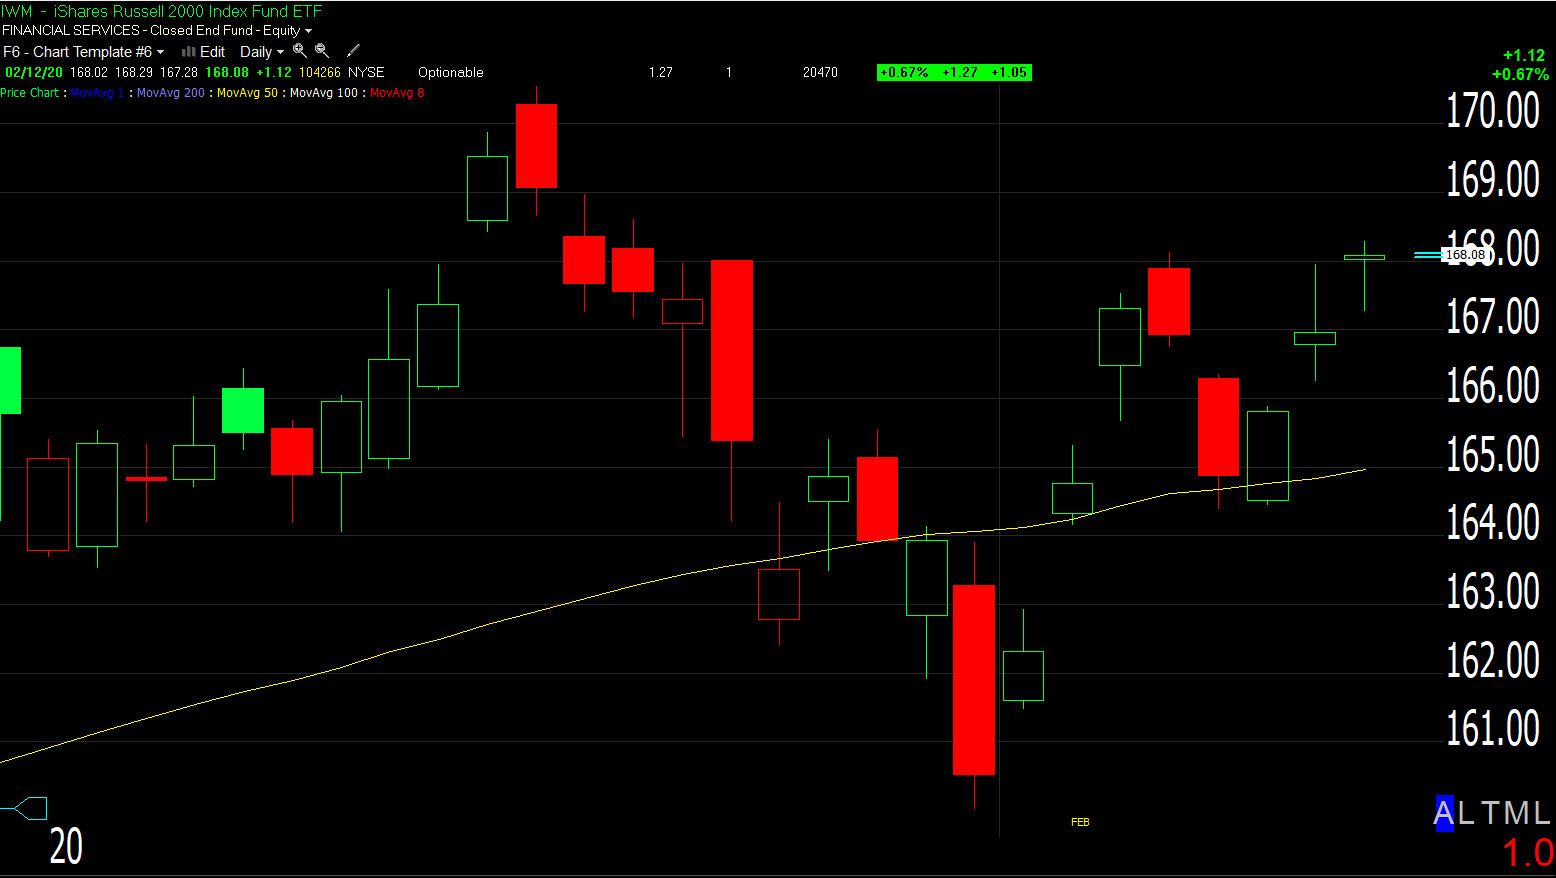
IWM (daily) that’s around $168 and has even more overhead supply than the Dow faced.
The cash session’s trade was very dull with the S&P trading in a tight intraday range of about 7 points or a quarter of a percent.
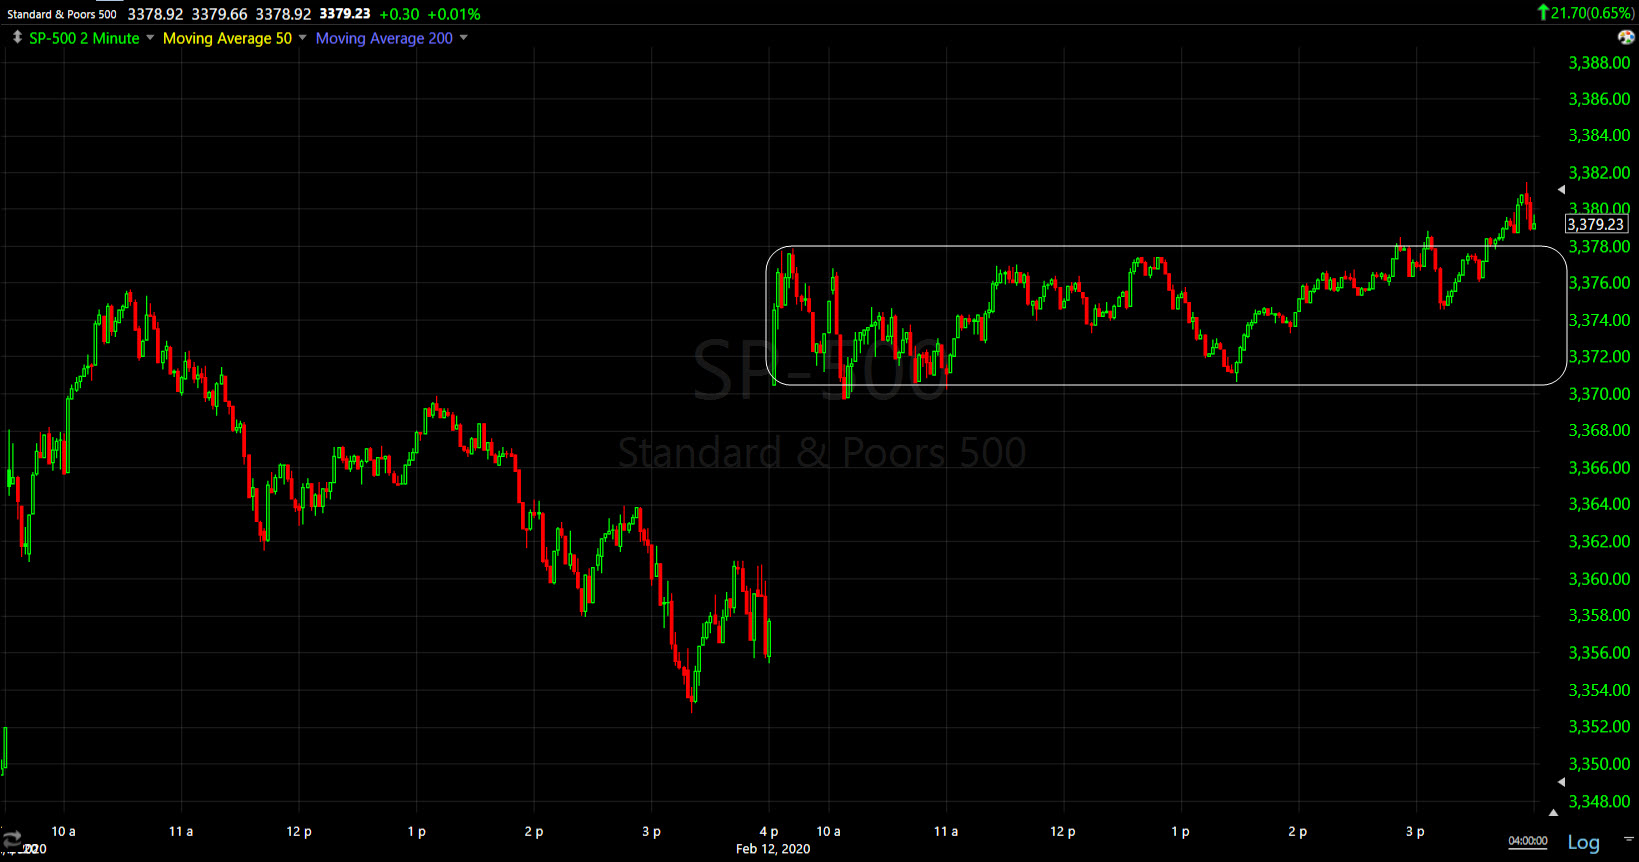 SP-500 (2m) only moved above the range at the close with Apple leading an end of day ramp.
S&P sectors
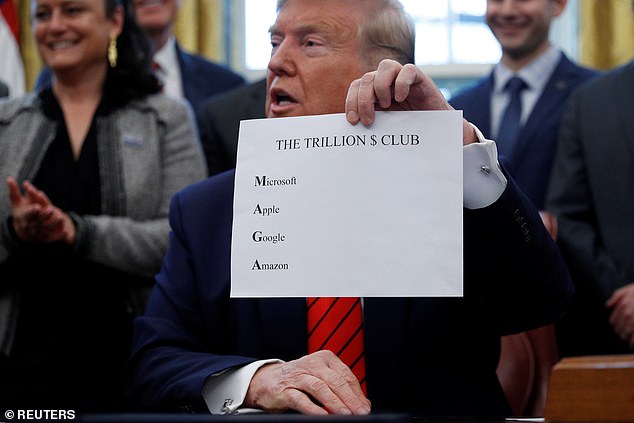
Participation was broad, but it was the same mega-cap sectors that were in the driver’s seat as the 2020 MAGA trade has become the 2020 consensus trade, right into the oval office.
Energy stocks received extra support from a 2.3% gain in WTI crude.
Materials ⇧ 0.55 %
Energy ⇧ 1.34 %
Financials ⇧ 0.06 %
Industrial ⇧ 0.94 %
Technology ⇧ 1.08 %
Consumer Staples ⇩ -0.05 %
Utilities ⇧ 0.07 %
Health Care ⇧ 0.12 %
Consumer Discretionary ⇧ 1.02 %
Real Estate ⇧ 0.64 %
Communications ⇧ 1.30 %
To keep the Energy sector’s 2% bounce this week in perspective…
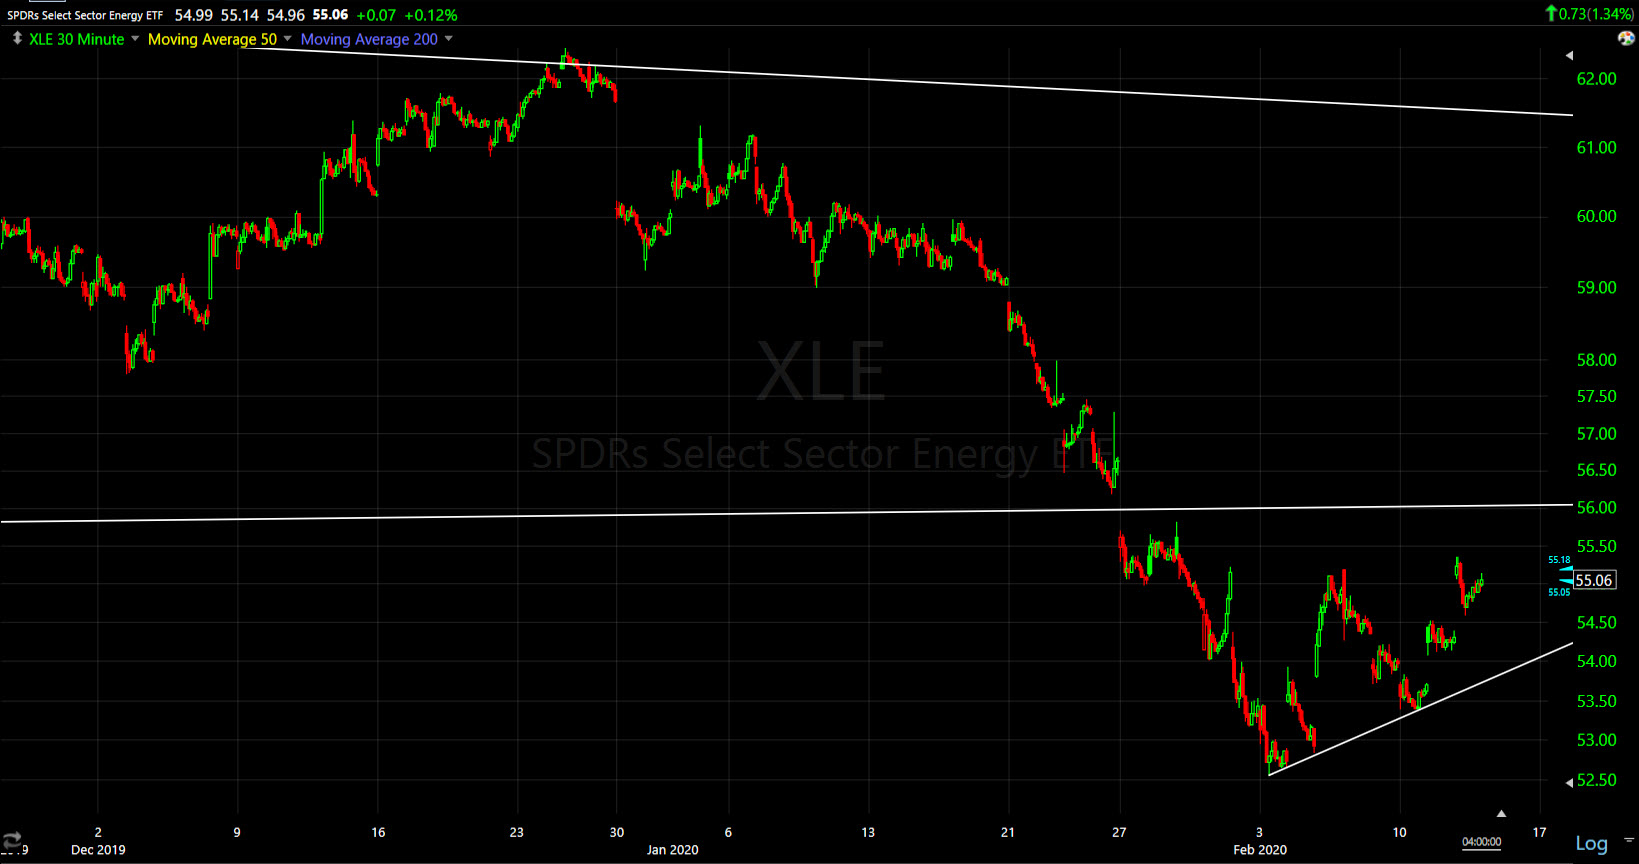
Energy / XLE (60m) the first meaningful technical level is above $56. Energy is simply consolidating after a -15% drop, the consolidation has a bearish bias.
Many other sectors are back near levels they’ve been struggling with for nearly 2 months.
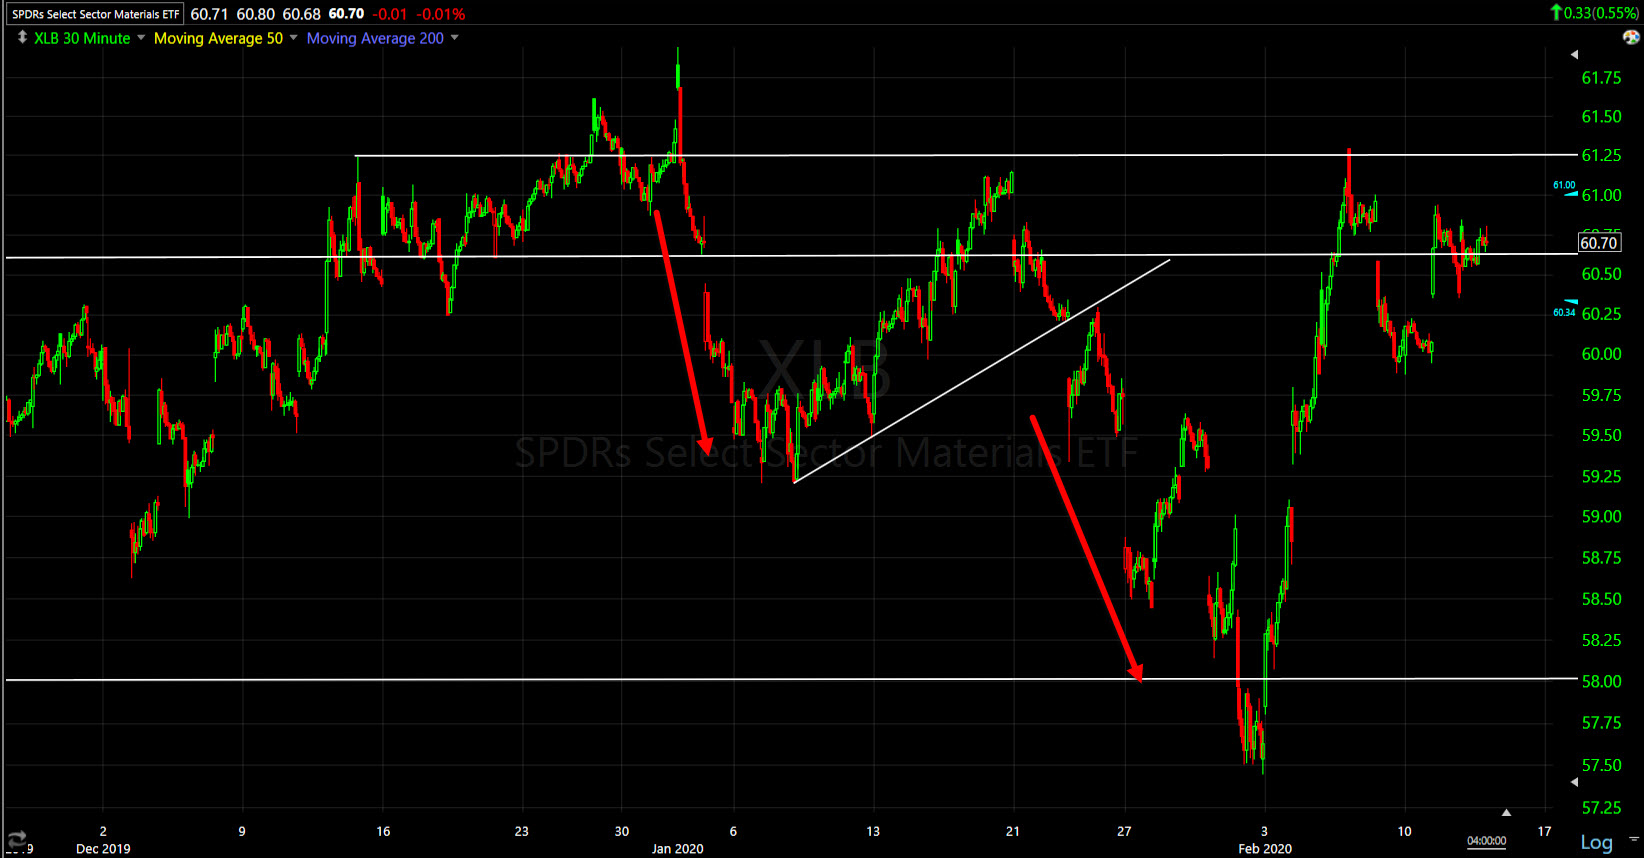 Materials/XLB (30m) made a fist leg down before the Corona virus, consolidated and then a second leg down to my target. Last week’s rally back to $61 was stronger than a dead cat bounce, and so far this week the sector has consolidated at this area of resistance it has been tangling with since mid-November.
*This is not a sector that has any meaningful S&P weight, it is however very growth sensitive. A few weeks ago I put up the charts of International Paper (IP) and Dow Inc. (DOW). The stock market has been discounting an economic rebound due to the phase I trade deal, priced to perfection and then some. These two stocks, one that makes among other things,shipping materials (cardboard), and the other plastics, should be two of the first to respond positively to an economic growth rebound, yet their charts were increasingly bearish into 2020. In fact, they still are.
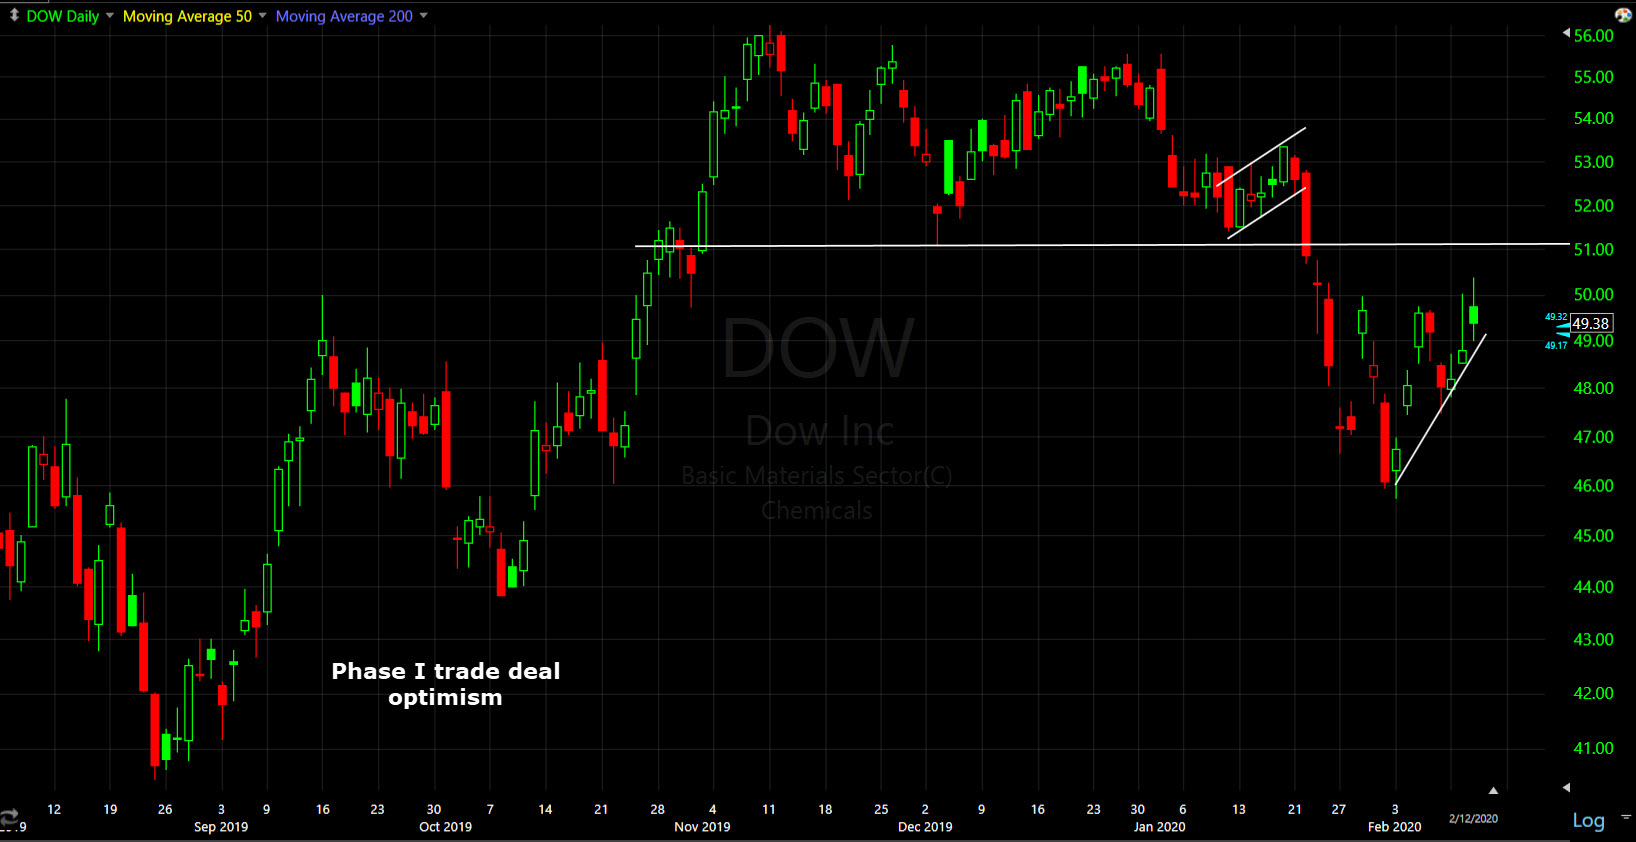 Dow Inc.(daily) rallying on the phase I trade deal, and turning bearish into 2020 (after the trade deal became public in mid-December).
Adding weight to the message these stocks are sending…
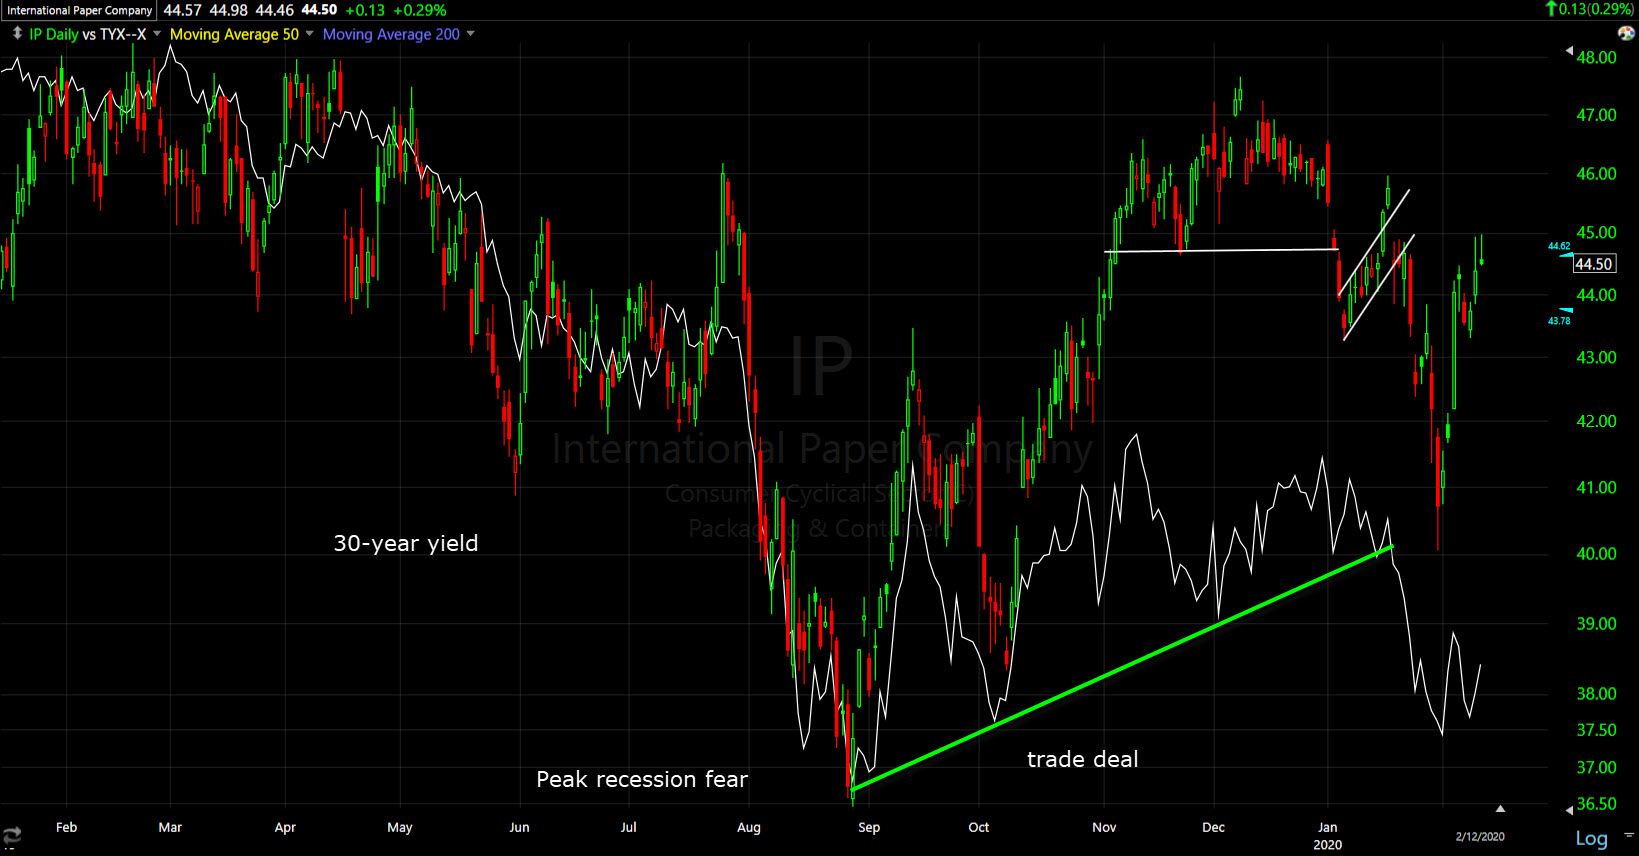 International Paper / IP and the 30-year yield. They both bounce from peak 2019 recession fears and both break the economic revival hopes trend at the same time at the start of 2020. That’s not coincidental. Since then crude, copper and commodity currencies have followed suit, as well as some of the economic data coming out now like today’s Euro-area industrial production.
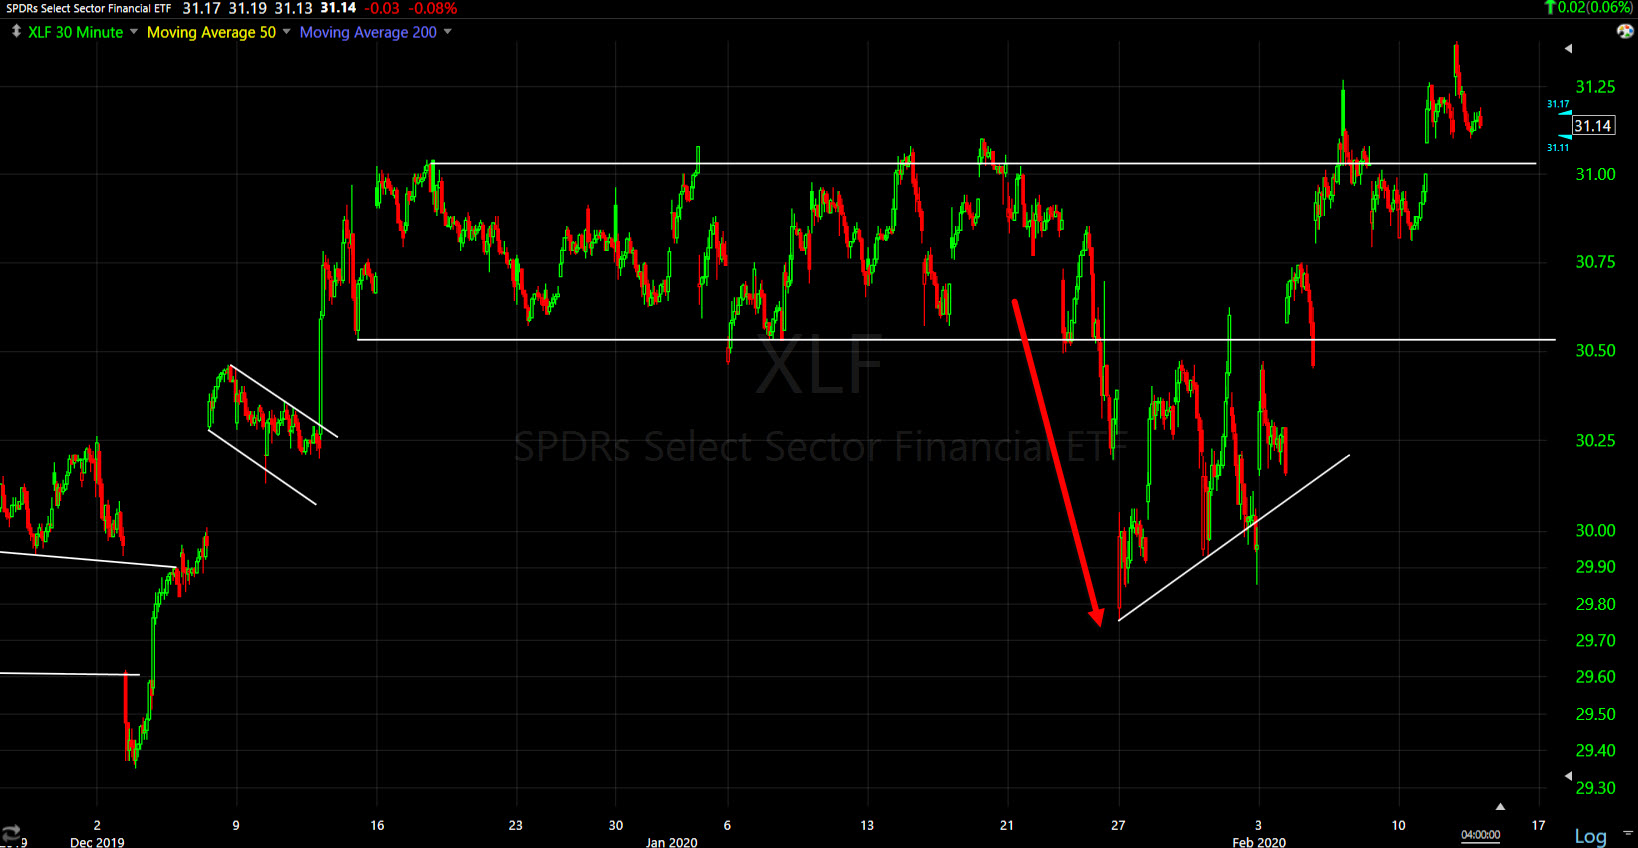 Financial sector/XLF (30m) made a first leg down led lower by Regional Banks, which were led lower by a flattening yield curve. The sector is above resistance since the February liquidity rebound, however the Regional Banks that tend to lead the broader sector are back at their own resistance.
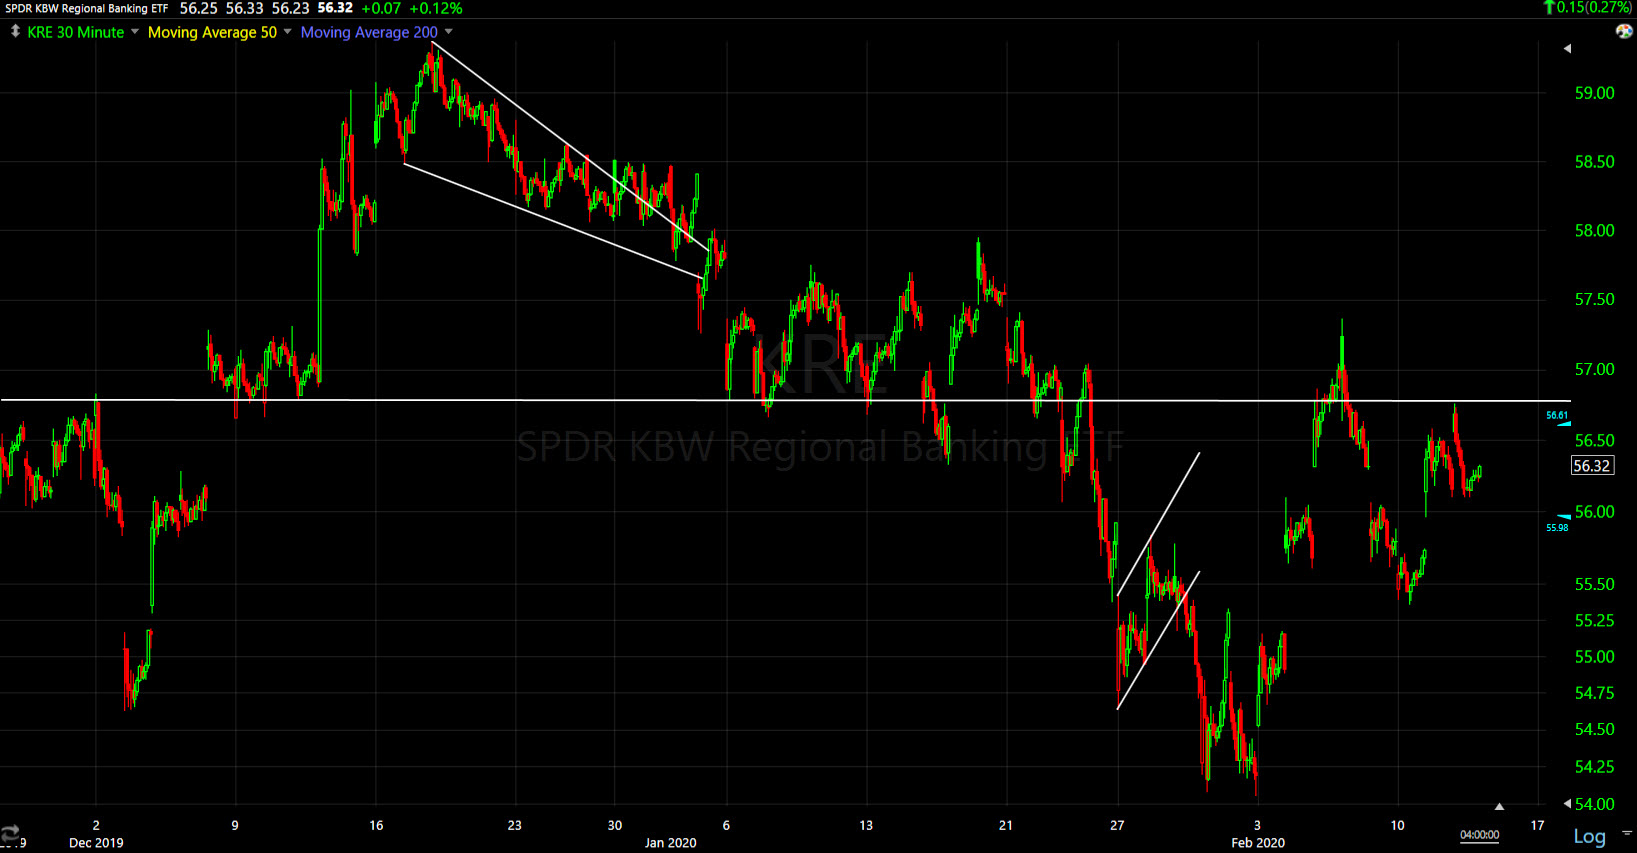 Regional Banks (30m) I think that the Financial sector’s price action would be more credible if the banks led, or even confirmed.
And while on the subject of yields…
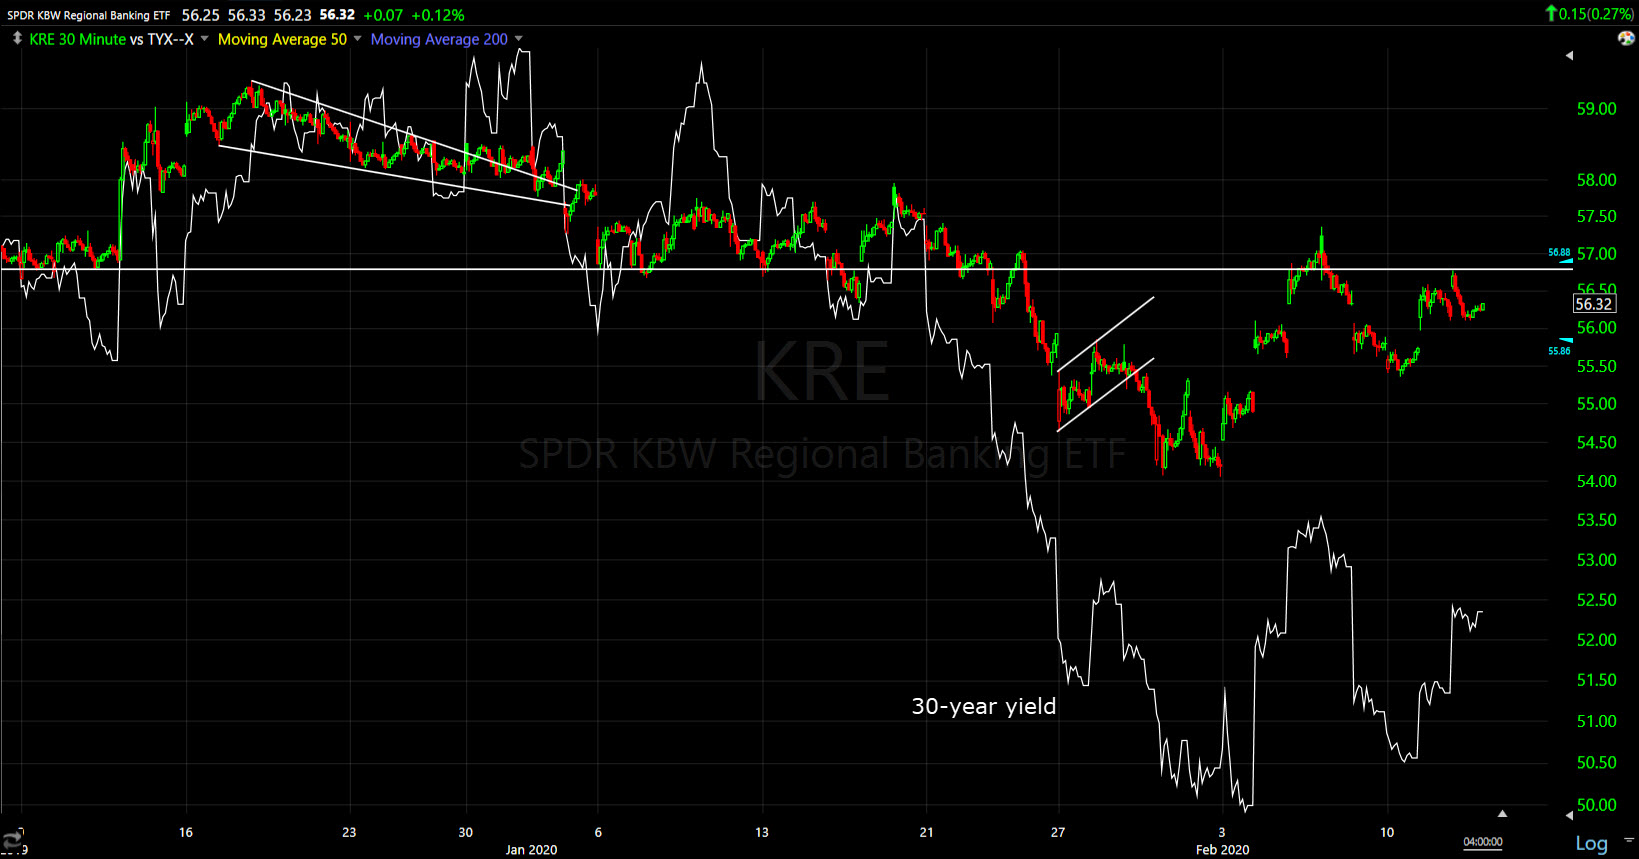
Regional Banks (30m) and 30-year yield. Yields are correcting/bouncing with the rest of the market this week, but I fully expect they turn back down.
And a bigger picture…
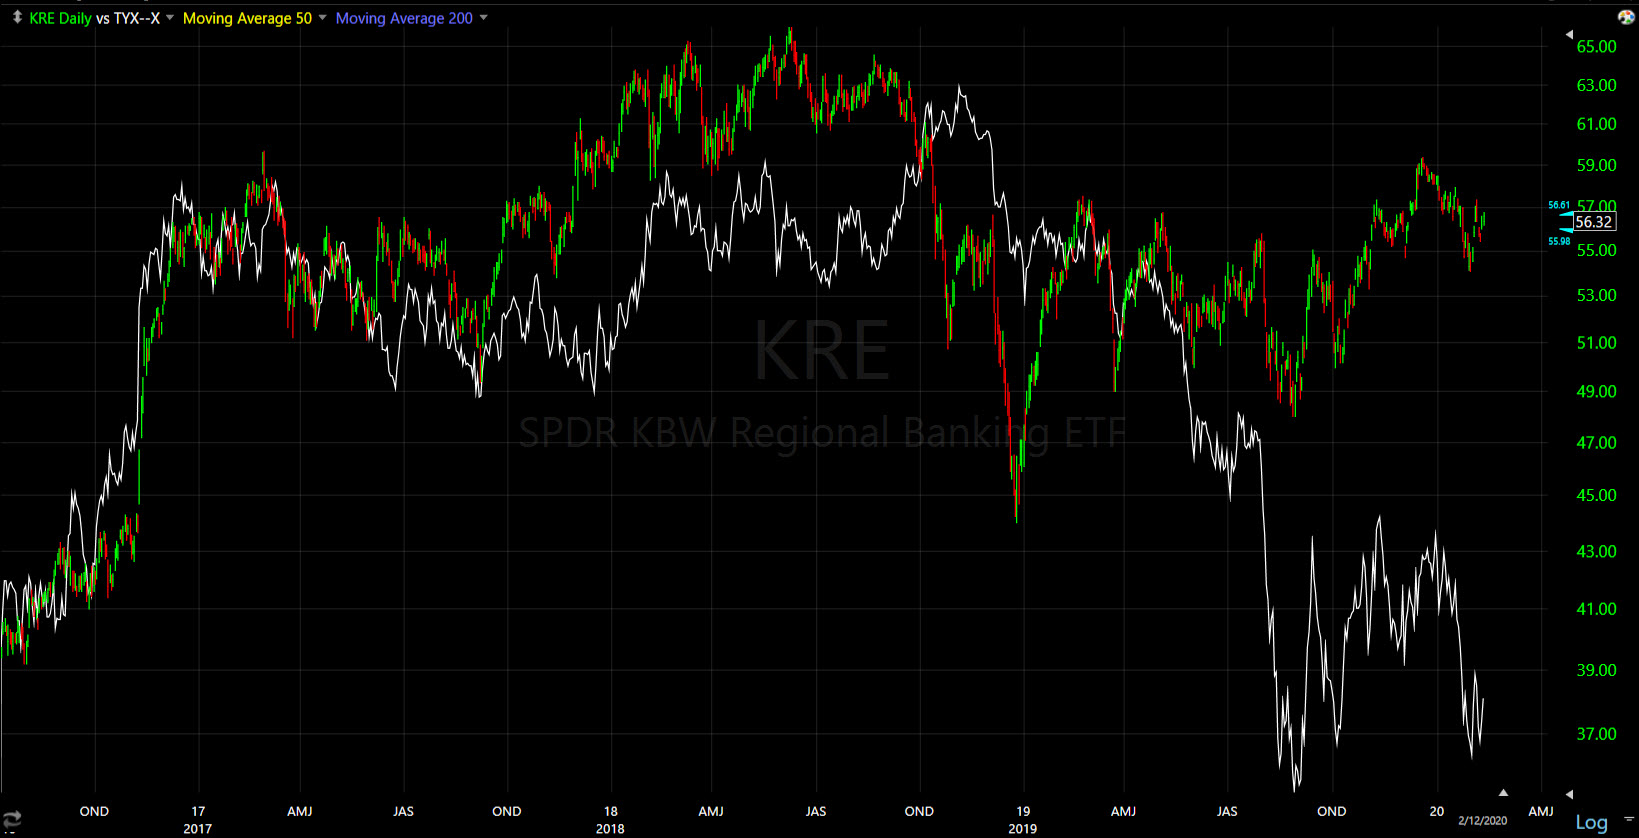 Regional Banks and 30-year yield (daily) -the yield curve is more important in my view, but yields are not a tailwind for the banks by any stretch of the imagination. The 30-year just broke the Q4/ trade deal rebound trend just last month.
One sector that improved its technical outlook last week was Industrials.
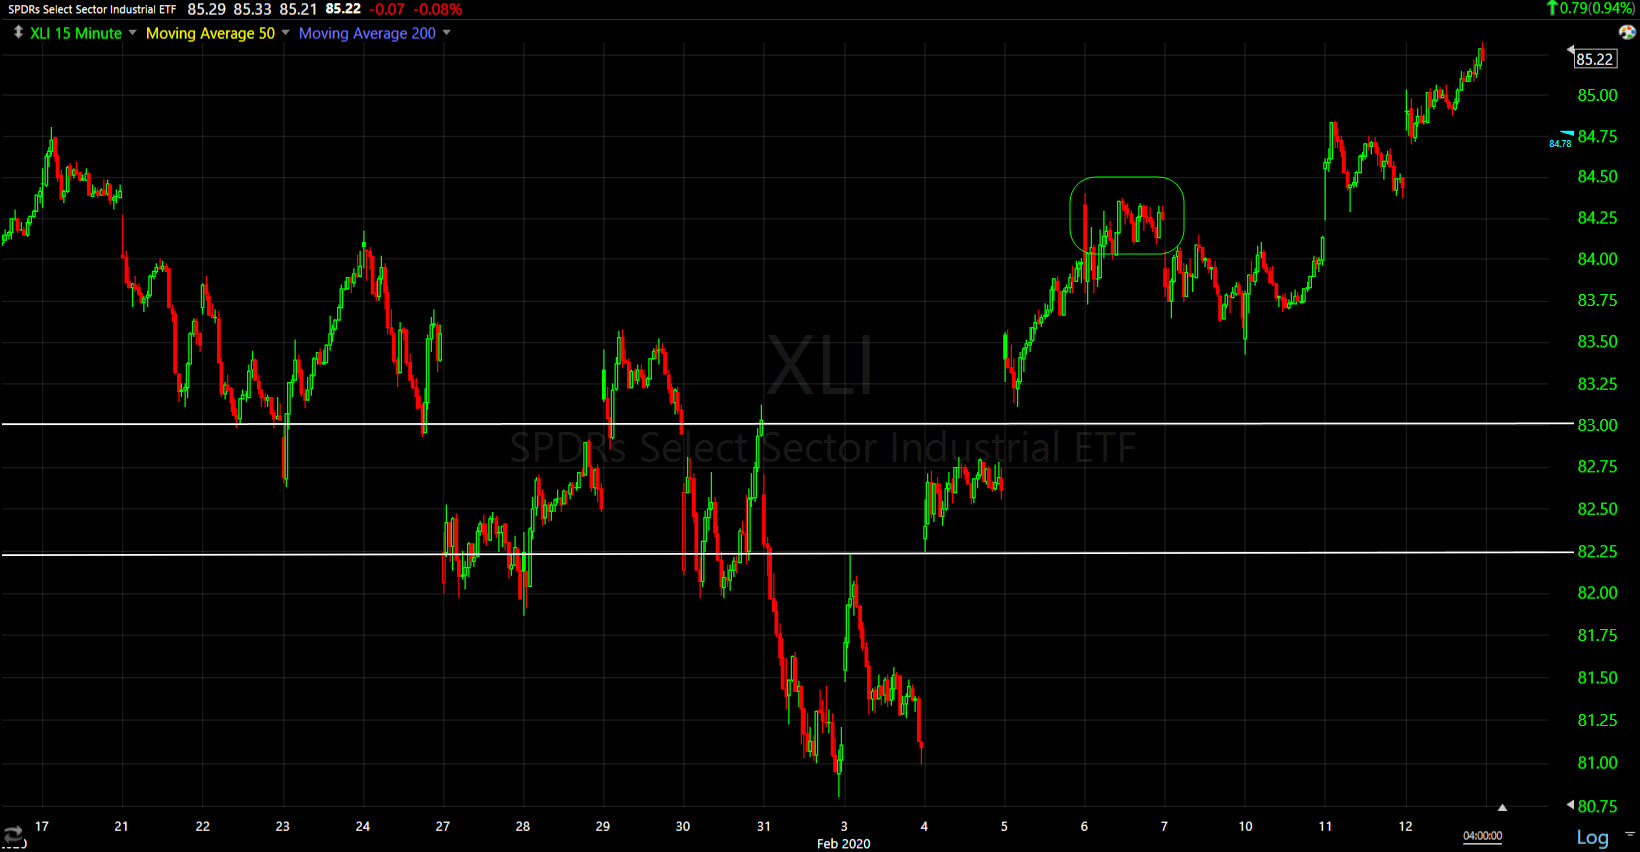 Industrial sector/XLI (15m) made a higher high last week (green), which took it out of a short term down trend. The sector has added to gains this week.
However, the Transports that tend to lead industrials are not confirming yet. They are back at a key level they’ve had their own battle with since November.
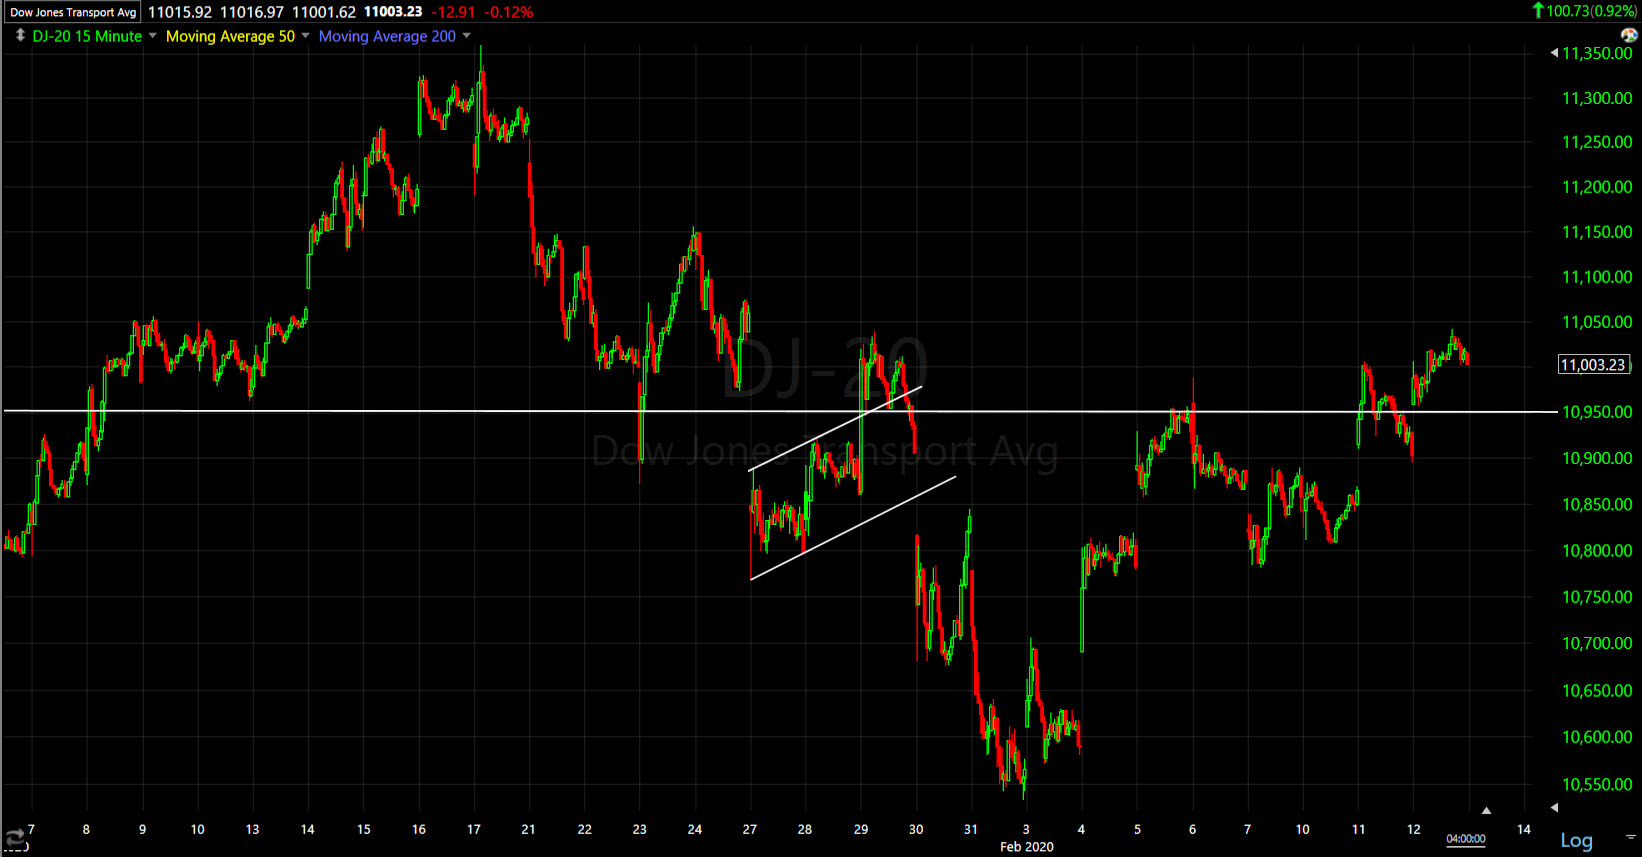 Dow Transports (15m) fell a little short of the second leg down target before bouncing. They are back at the 10,950 or 11k level. Note that unlike Industrials, the trend is still lower lows and lower highs.
This one is not a multi-month resistance level, but an area of interest nonetheless, especially because of the sector’s weight.
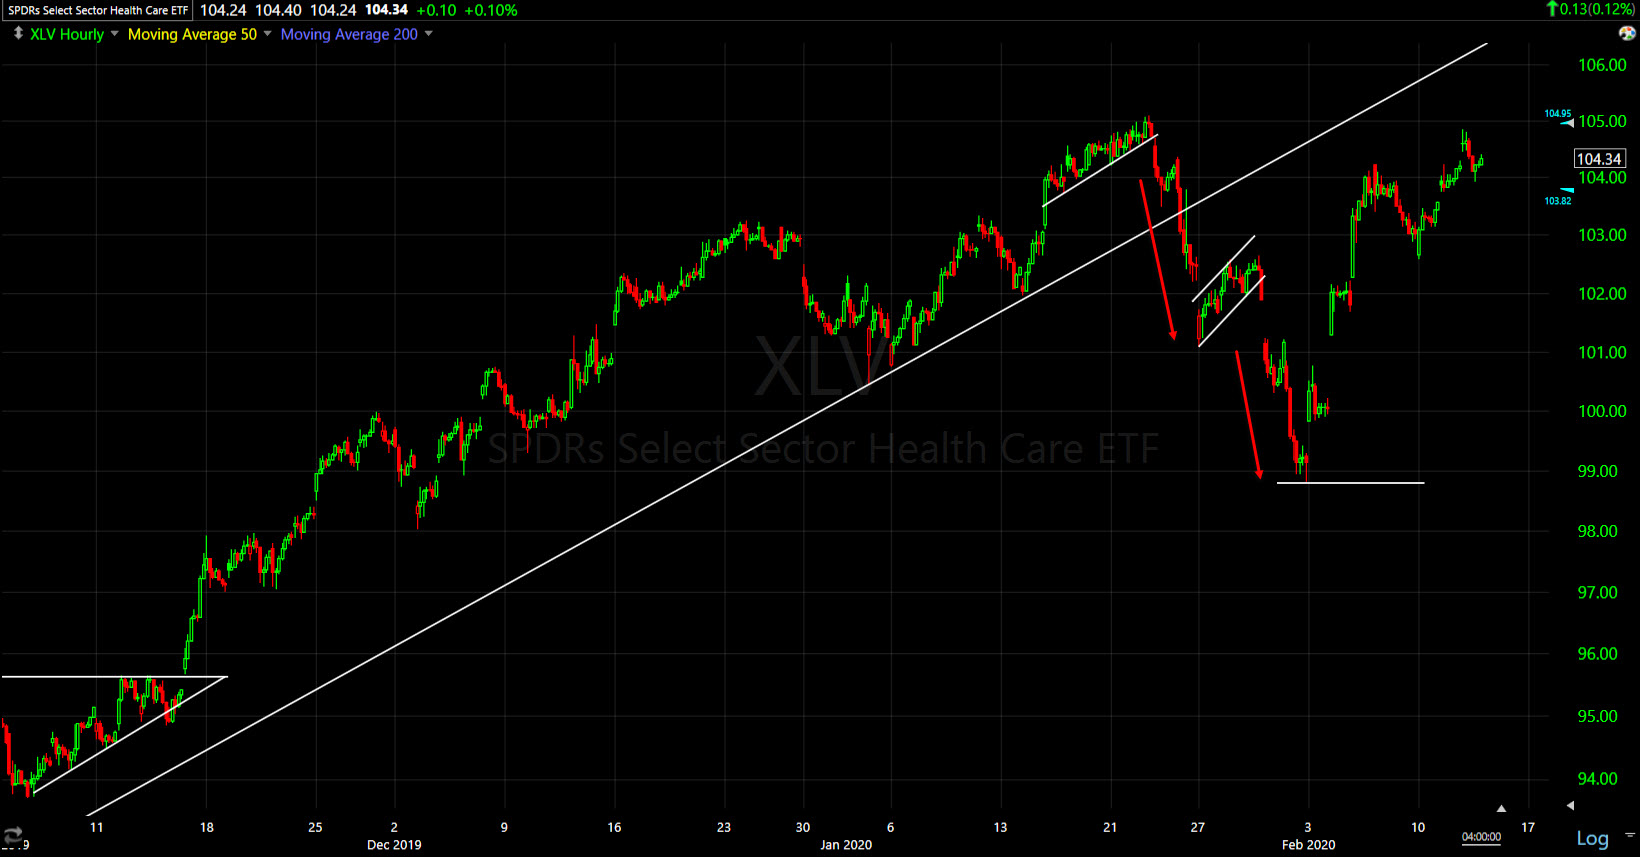
Health Care / XLV (60m) the second most heavily weighted sector behind Tech. It did hit the second leg target on the nose before bouncing. It could back-test the broken 4 month trend, but the first technical development would be a higher high above January’s.
Internals
NYSE Advancers (1147) were 4:1 over decliners (1147) at the open, but that faded to less than 2:1 on NYSE volume of 929.2 mln. shares.
SPY’s volume fell to the lowest of the year, the lowest since Christmas.
There’s no Dominant price/volume relationship.
Both yesterday and today had solid participation, evidenced by small caps leading Tuesday. That hasn’t done much to remedy the market breadth situation.
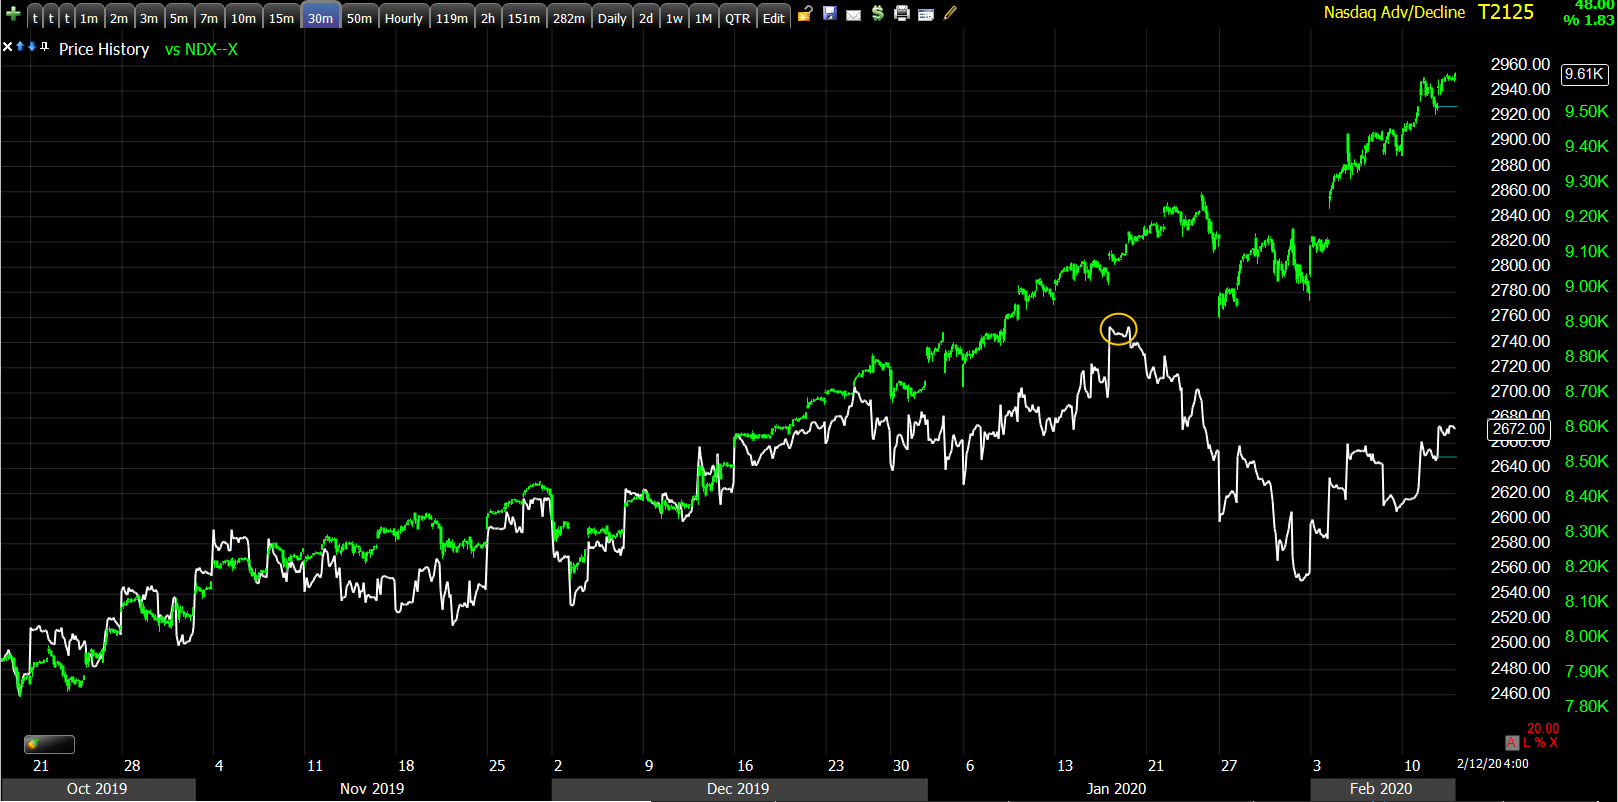 NASDAQ 100 (30m) and NASDAQ Composite advance/decline line. The NASDAQ 100 is about 4% above its January high while the A/D line is about 4% below. This is still the largest divergence since the June 2019 market high on a relative basis and sharpest since September 2018.
Volatility
After relative strength Tuesday, VIX relative strength was unwound today and the Volatility Index fell -9.5%. From the way volatility has traded this week and the signals it has given, I think someone was well aware of the FTC announcement coming and had hedged long exposure in the FANG/MAGA names ahead of the announcement in case there was a bad reaction. Being there wasn’t much additional reaction today, I believe the position was closed and yesterday’s strength rolled off.
There’s still a lot of relative strength left.
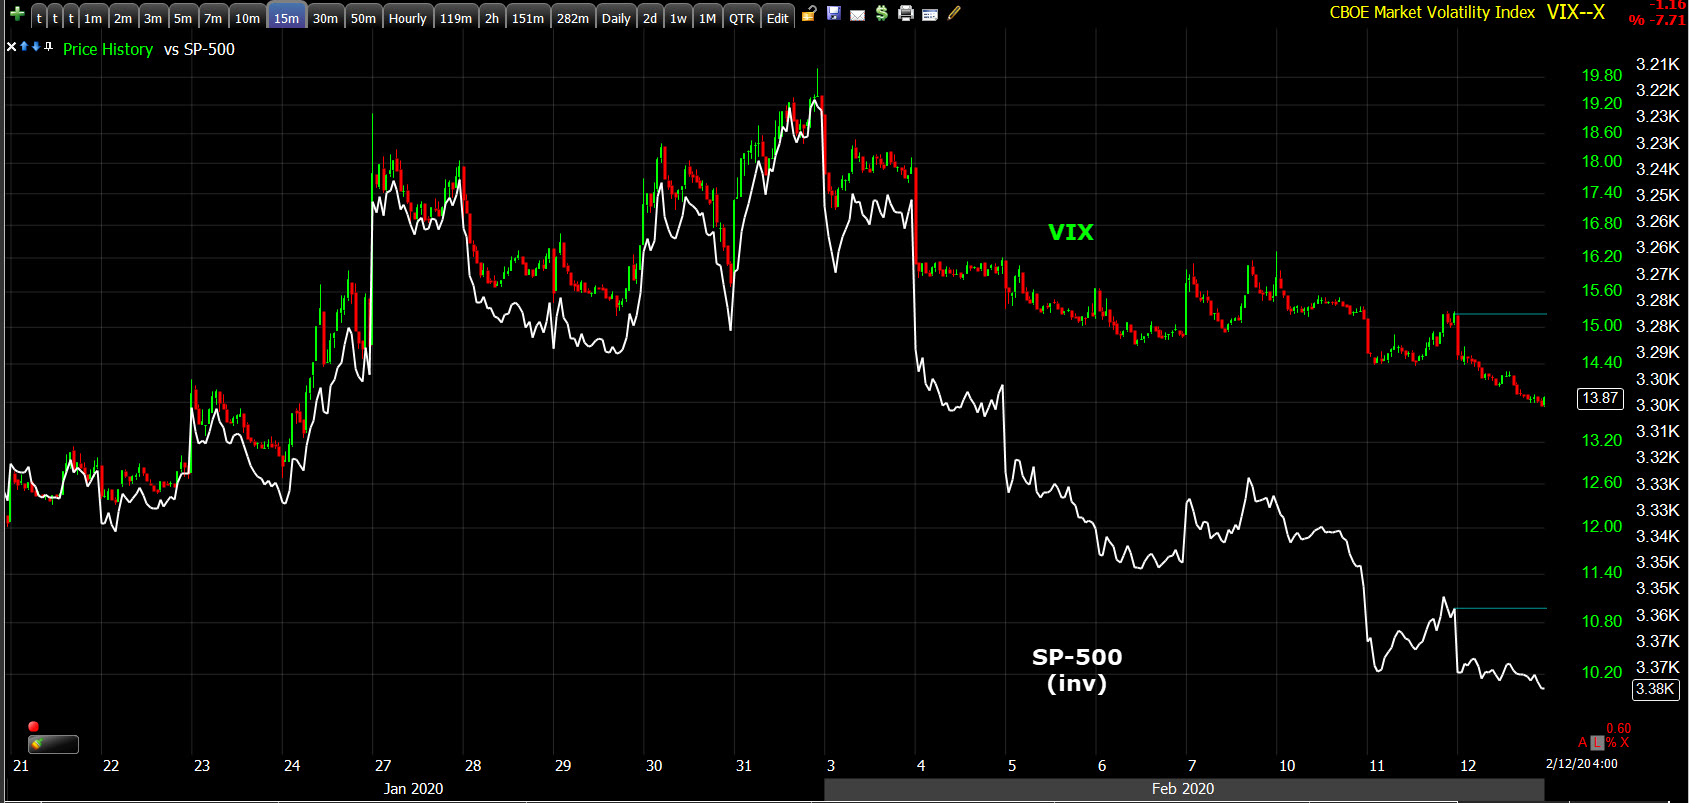 VIX (15m) and SP-500 (white) inverted. Just based on the last month’s trade, VIX could or perhaps should be near $10, which just illustrates that while stocks are trading as if the corona virus were a net positive or didn’t happen, there are still those not sold and still hedged up.
Treasuries
U.S. Treasuries continued their pull back amid the bullish bias in stocks. The 2-year yield increased two basis points to 1.44%, and the 10-year yield increased four basis points to 1.63% steepening the curve by 2 bp.
As for TLT, it’s consolidating and looks fine.
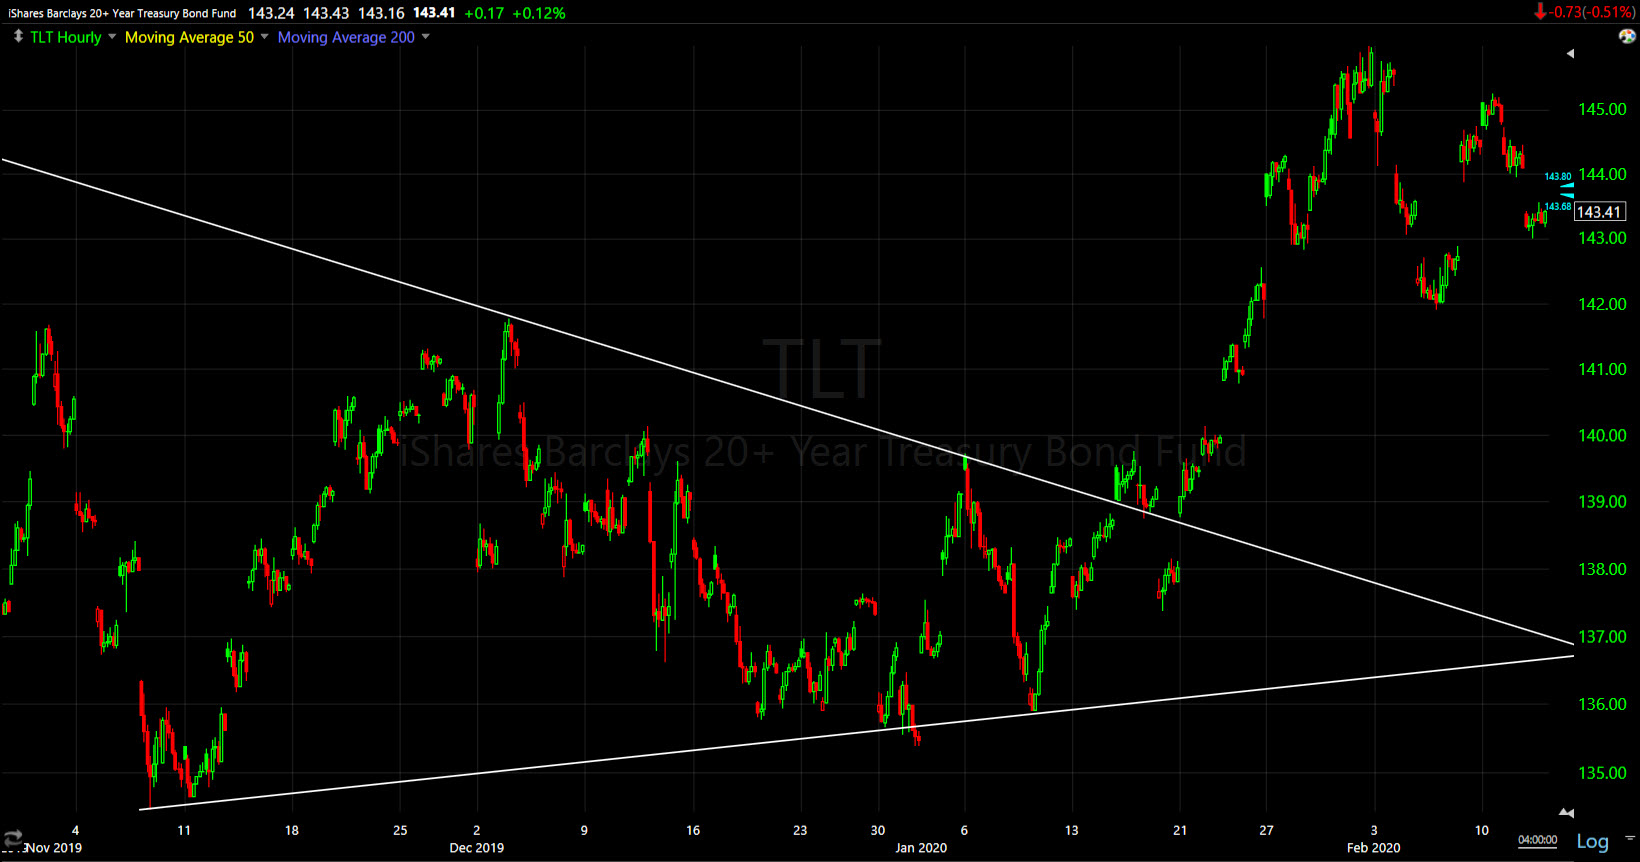
TLT (daily) I would still view TLT’s price as constructive all the way down to the gap around $140, depending on how it got there of course. I would consider it long here as well, but I want to see some signs of inflows just in terms of tactical execution.
Currencies and Commodities
The U.S. Dollar Index remained strong, closing +0.3% higher at 99.00 with a big move in the cash session.
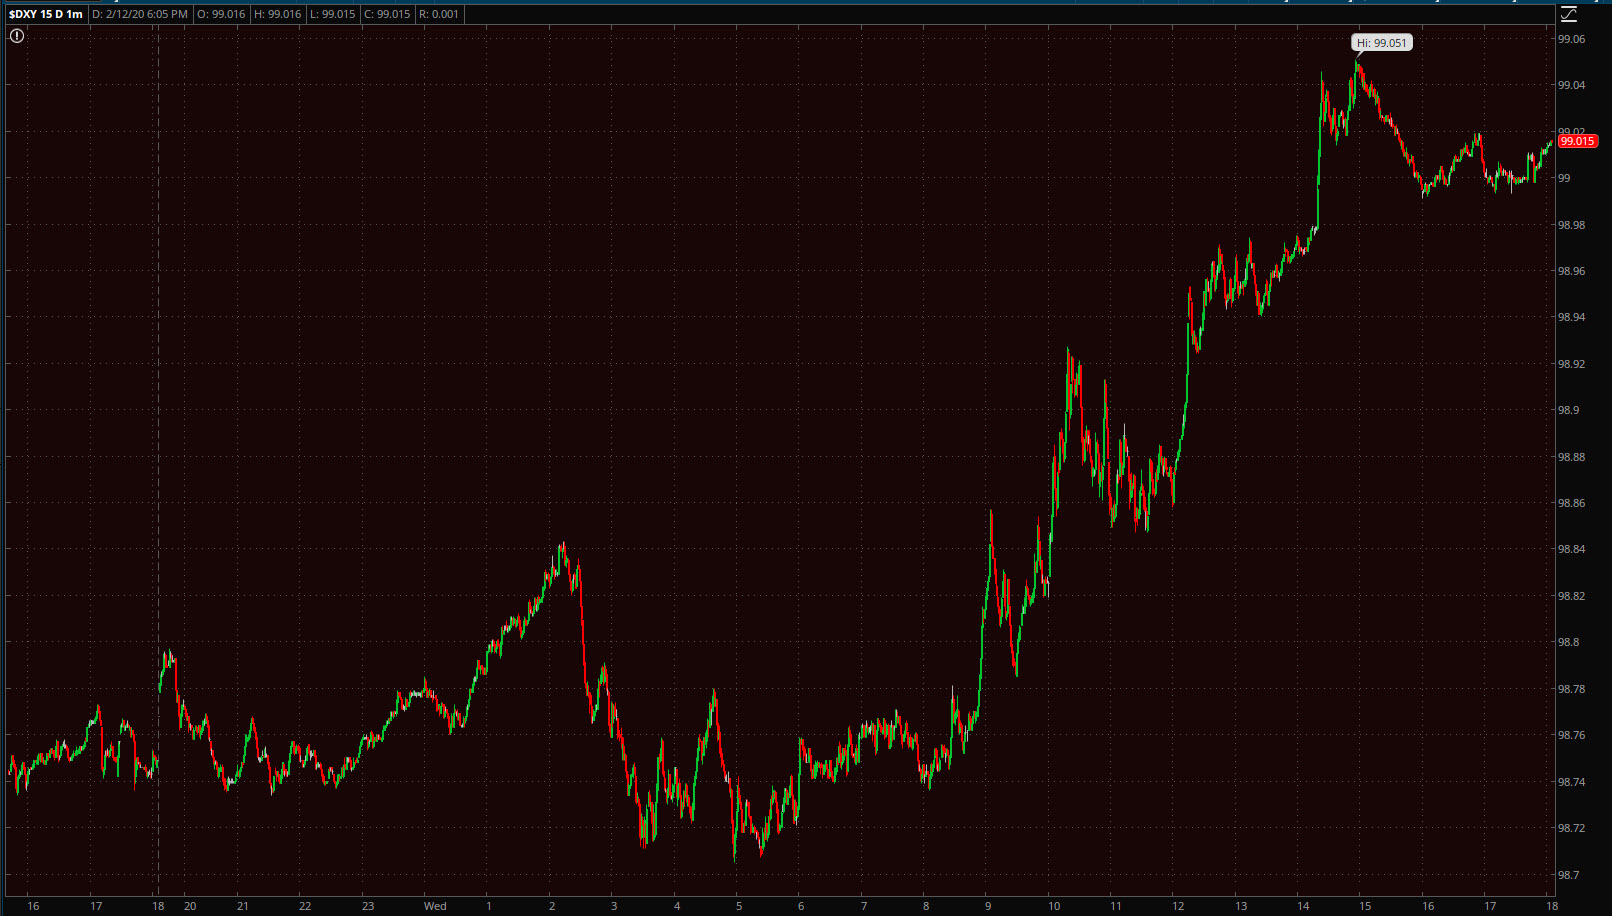
Dollar Index (1m)
There could be several reasons for Dollar strength including a flight to safety (or cash). There was some evidence of that a few weeks ago. It could also be, and I think this is likely, inflows into U.S. assets as a “safer place” for foreign investors, much like we saw through the first half of 2018. Also consider the economic data from the Euro-zone today. The Euro traded down to its lowest vs. the Dollar since May 2017.
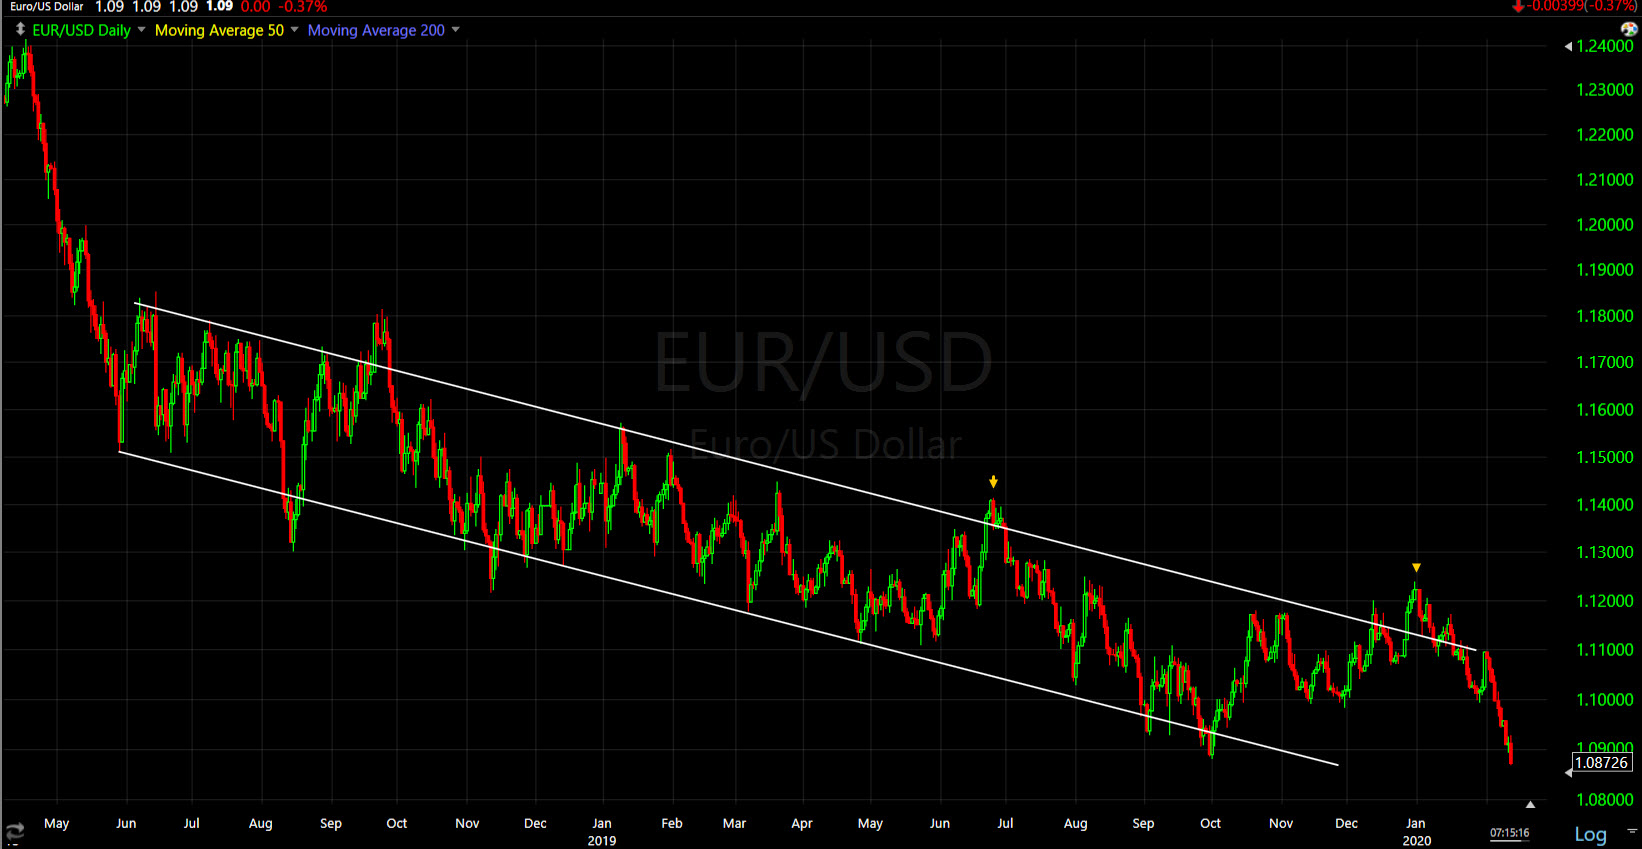
EUR/USD (daily) the currency pair is a reflection of the economic trend for the region. There were a few false starts (growth re-acceleration) in June and December.
Given Dollar strength and the unknown impact of the Corona virus, I still think Emerging Markets could face a difficult tie and a rising dollar puts additional pressure on them. I mentioned watching EEM and the emerging market currencies for divergences… the currencies tend to lead the equities.
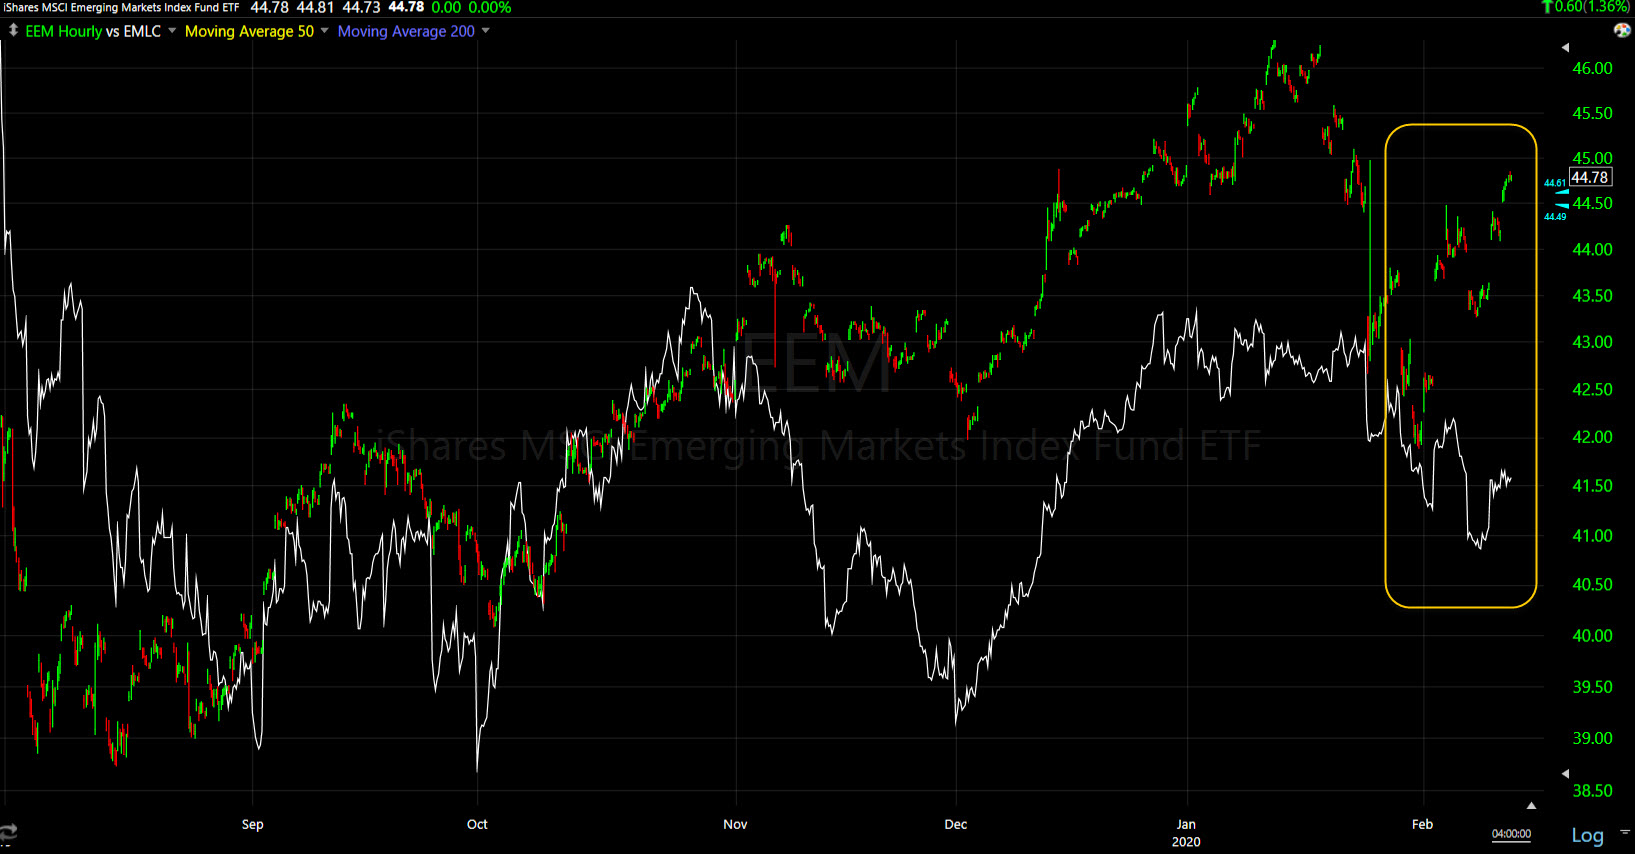
EEM (60m) and proxy for a basket of EM currencies (white). There is a larger relative divergence as the currencies didn’t confirm the January highs in EEM, and there’s a divergence opening up on the recent rebound from January lows. It’s not extreme yet.
On a somewhat related note, the safe haven Swiss Franc is soaring amid the risk-on mood in equities this week. I mention this more broadly in terms of risk sentiment, but also whenever there was trouble brewing in emerging markets, we’d see the Swiss franc gaining.
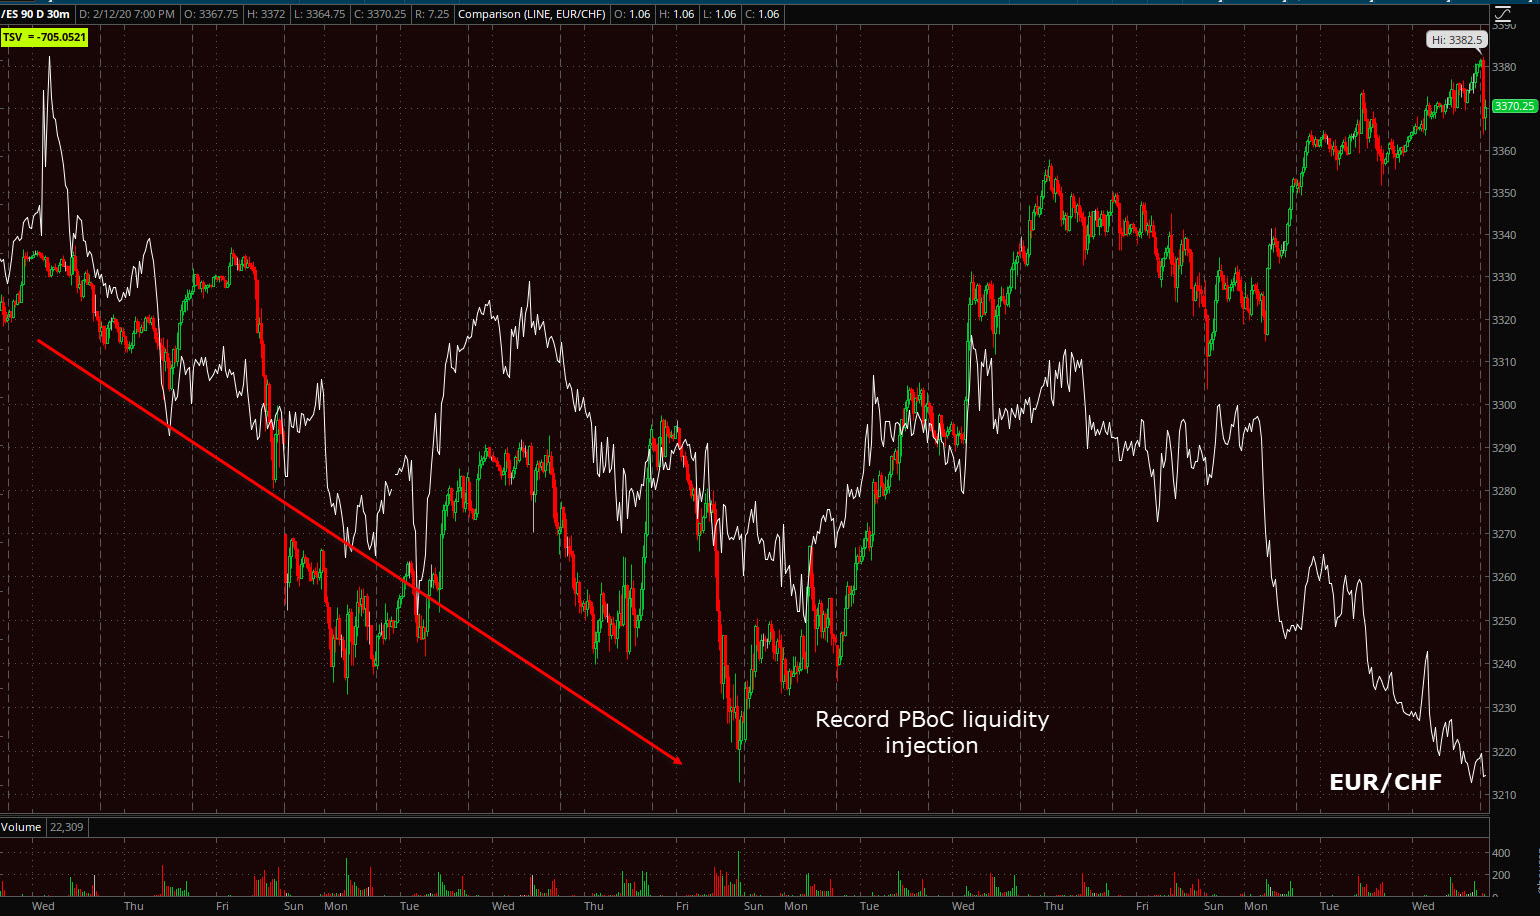
S&P futures (30m) and EUR/CHF – the Franc has been gaining coming into this week and diverging with the S&P suggesting safe haven flows.
WTI Crude oil gained +2.3% to $51.17/bbl., despite OPEC cutting demand outlook, record US production, and a big crude inventory build. Much like the Energy sector, technically speaking crude isn’t doing anything more than correcting after a >20% plunge in a month, and pretty much right where it was expected.
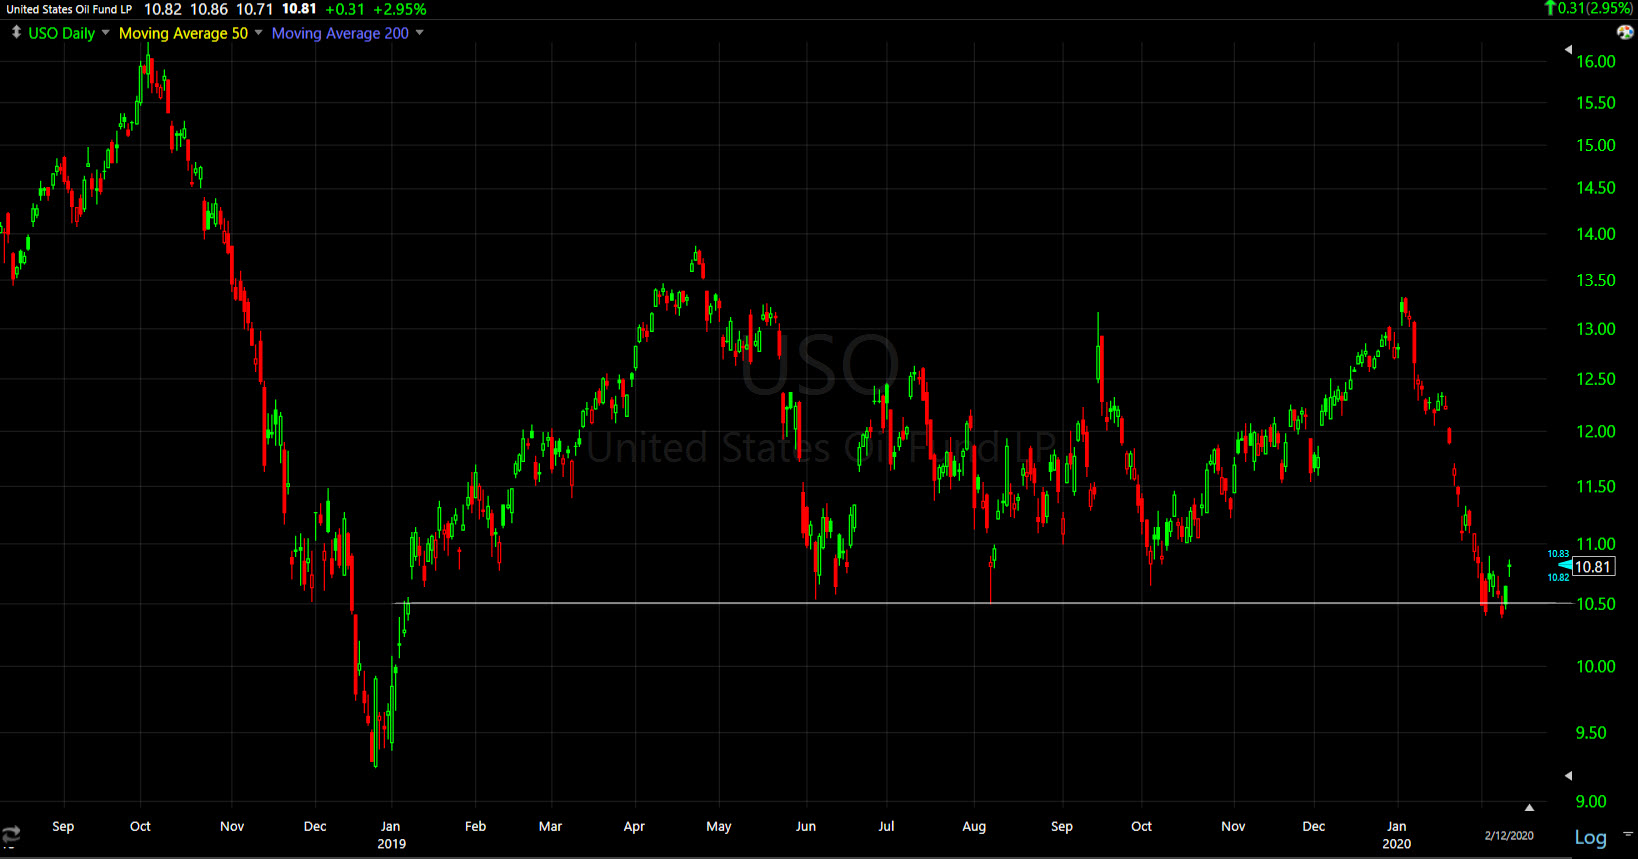
USO (daily)
Gold futures settled +0.1% to $1,571.60/oz.
U.S. economic data was limited. The weekly MBA Mortgage Applications Index increased 1.1% following a 5.0% increase in the prior week. The Treasury Budget for January showed that the deficit continues to grow, with a deficit of $32.6 bln versus a surplus of $8.7 bln a year ago. The deficit surged 25% in fiscal 2020 and is up $1.1 trillion over the past year.
Summary
Today’s cash session was very dull with very few signals and as mentioned, the lowest SPY volume since Christmas. Most of the gains and momentum came from the overnight session. The cash session was a very narrow range, which is what I would have expected anyway as Powell testified ( a drift with a positive bias).
I can’t add much more based on the day’s cash session. Considering the data and the glaring red flags from multiple asset classes (commodities, rates and currencies), and taken with the damage already done to market breadth recently, investors better hope that the central banks keep pumping money and it keeps finding its way into the MAGA/FAANG stocks. I hesitate to use this phrase, there is no pun intended… I think the market is whistling past the graveyard and I think investors are crazy to chase this rebound in stocks.
Stocks have rebounded as if nothing happened. That’s not the case for commodities, rates and currencies.
The market, or scientists, don’t know what they don’t know about the virus and the effect on the economy. The message numerous asset classes were sending even before the virus, was that the Q3/Q4 2019 economic rebound priced to perfection in stocks, may have been premature on its own, before any additional effects from the virus. We’ve seen enough economic data since to take that message seriously.
Overnight
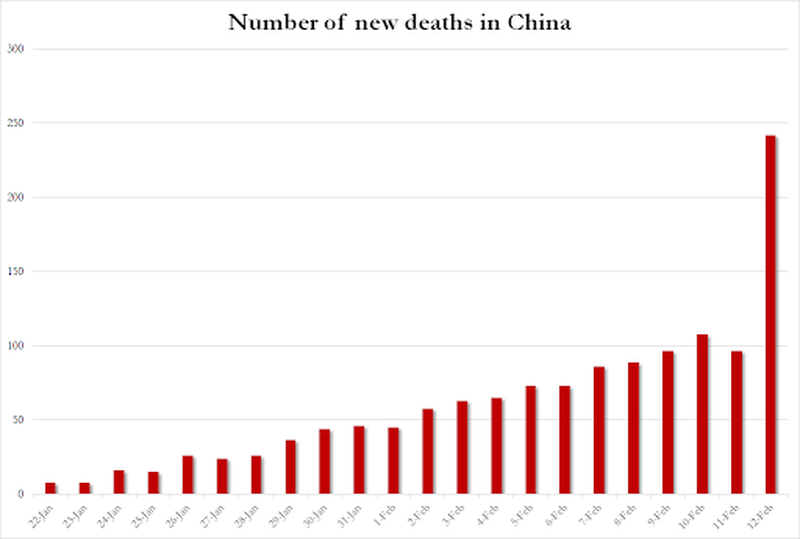
There is shocking data on the Corona virus out tonight after the close. Recall that the narrative for the week’s rally thus far has been 1) that China is going back to work after an extended Lunar New Year holiday, and 2) the number of infections tapered off, suggesting that the worst has passed.
“The boost in the market was attributed to reports indicating that the rate of new coronavirus cases was slowing down. However, it was already widely reported that the reason for the slowing rate was because the Chinese National Health Commission quietly changed its definition of Coronavirus “confirmed case” in the latest guideline as of 2/7/2020. As a result, going forward patients who tested positive for the virus but have no symptoms will no longer be regarded as confirmed, even though some patients won’t show symptoms for weeks!”
The Hubei province just released its latest round of coronavirus outbreak figures and they’re shocking. The number of cases exploded by 14,840, resulting in a total of 48,206 cases, including 13,332 clinically diagnosed cases.
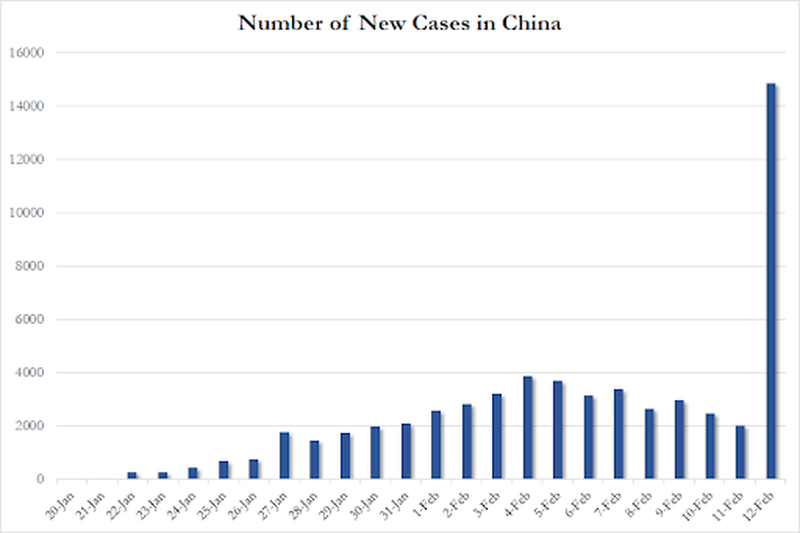
So why the sudden and dramatic change? They changed the rules again, going back to what they were, and adding “Clinical diagnosis”
“With the deepening of understanding of new coronavirus pneumonia and the accumulation of experience in diagnosis and treatment, in view of the characteristics of the epidemic in Hubei Province, the General Office of the National Health and Health Commission and the Office of the State Administration of Traditional Chinese Medicine issued the “Diagnosis and Treatment Plan for New Coronavirus Infected Pneumonia (Trial (Version) “adds” clinical diagnosis “to the case diagnosis classification in Hubei Province, so that patients can receive standardized treatment according to confirmed cases as early as possible to further improve the success rate of treatment.
According to the plan, Hubei Province has recently conducted investigations on suspected cases and revised the diagnosis results, and newly diagnosed patients were diagnosed according to the new diagnosis classification. In order to be consistent with the classification of case diagnosis issued by other provinces across the country, starting today, Hubei Province will include the number of clinically diagnosed cases into the number of confirmed cases for publication.”
S&P futures reacted, albeit not much…
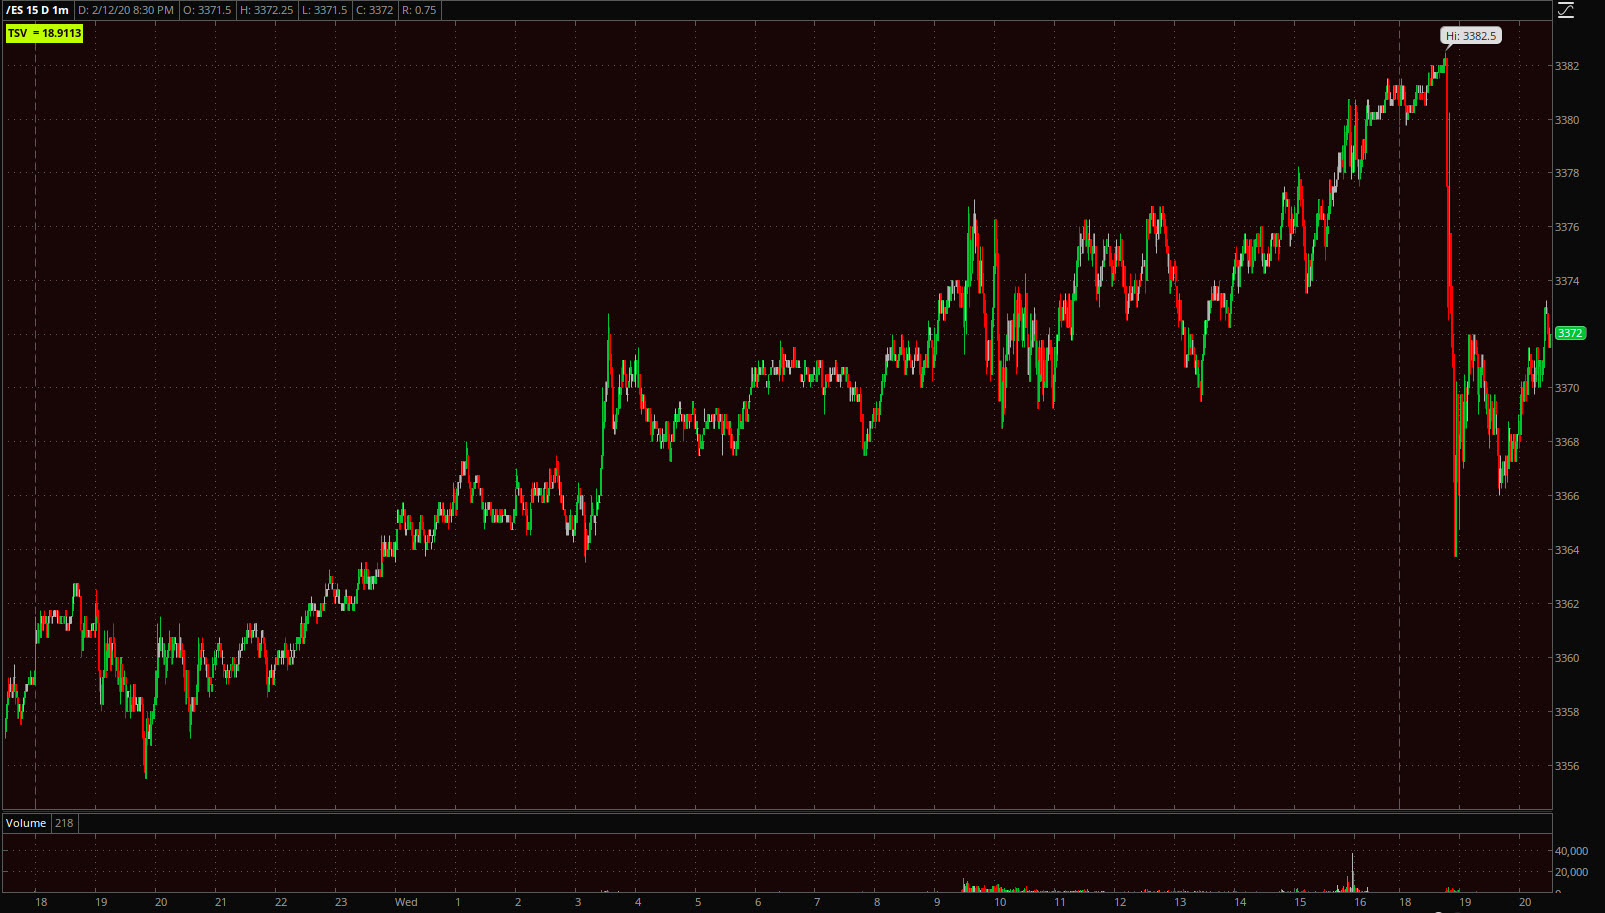
S&P futures (1m) down -0.25%
Perhaps this explains why 3C was positively diverging in safe-haven Japanese Yen futures earlier today?
“There is an early change in some defensive assets, the Japanese yen shows it most clearly. 3C is starting to move pretty sharply here, although the price trend is unchanged at the moment. Gold has a similar developing signal.”
Yen futures also reacted to the news…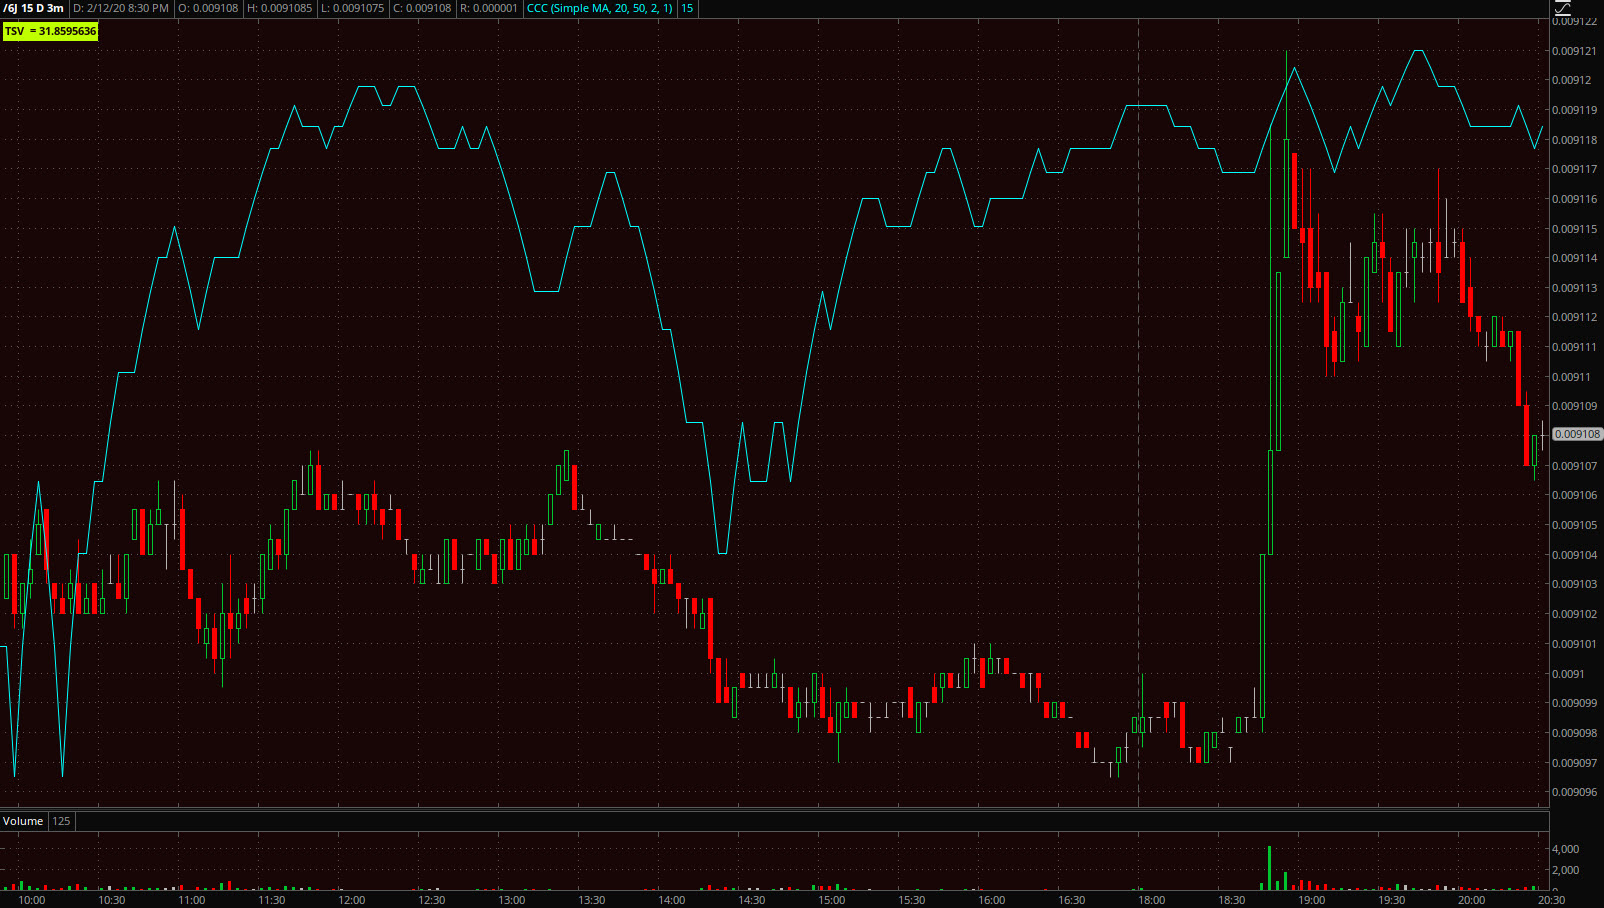
Japanese yen futures (1m)
Other assets that reacted, the Aussie (negative), Crude (negative), Copper (negative), gold and silver futures (positive), and U.S. Treasury futures (positive). The reactions are pretty much on the same scale as S&P futures, which is to say not a lot. We’ll see what the charts look like in the morning.
On the economic data front, investors will receive the Consumer Price Index for January and the weekly Initial and Continuing Claims report on Thursday.