Daily Wrap – August 29, 2019
Trade-talk optimism made a comeback this morning. China’s Commerce Minister Gao repeated his country’s willingness to proceed with negotiations in a “calm” manner, adding Beijing wasn’t planning on immediately retaliating on the latest U.S. tariff increases. Mr. Gao hoped discussions could help remove the new tariffs imposed by the U.S., although he refrained from answering if retaliatory measures were entirely off the table.
The futures market jumped on the comments around 3 a.m. ET, and the cash market maintained the bullish composure throughout the day.
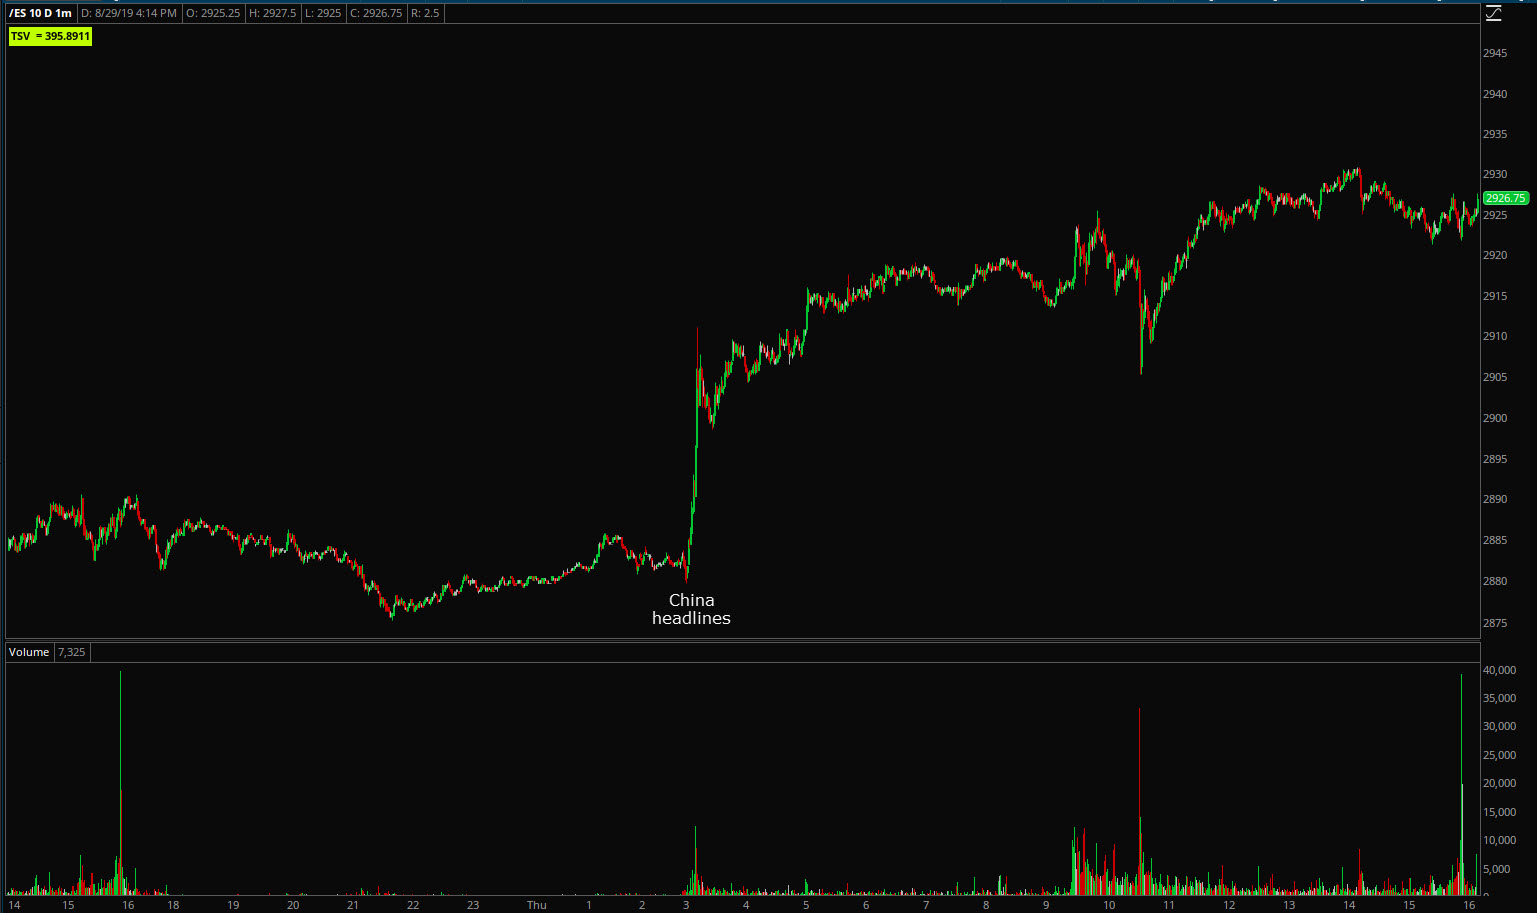 S&P futures (1m) jolted higher at 3 a.m. ET
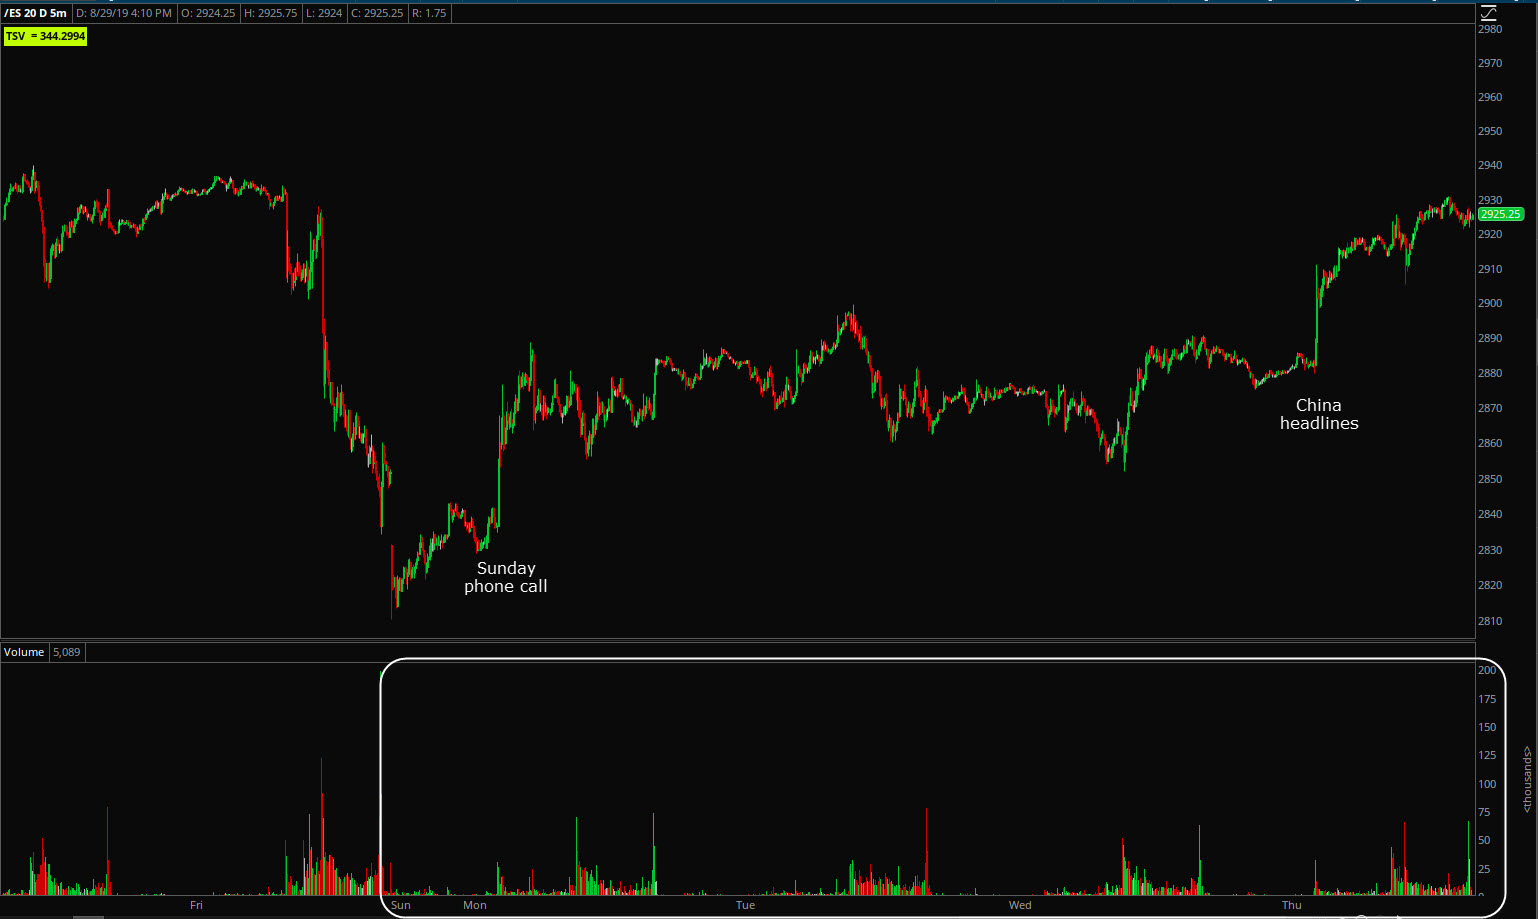
S&P futures (5m) this week shows the biggest moves were both trade optimism related, and both in thinner extended hours trade.
The first catalyst for futures Sunday night was President Trump claiming the Chinese called over the weekend to restart trade talks. The Chinese promptly denied any knowledge of such a call, but the market has held that hopeful and bullish bias. According to a CNN report today, the call didn’t happen.
“aides privately conceded the phone calls Trump described didn’t happen the way he said they did,” “Instead, two officials said Trump was eager to project optimism that might boost markets, and conflated comments from China’s vice premier with direct communication from the Chinese.”
The market had no reaction to the report.
There was a brief reaction to the ECB’s Knot suggesting no need for more QE. 3C tone started to weaken this afternoon as the S&P was in the $2930 area. Tone worsened after the news of the DOJ starting a new inquiry in to Huawei.
For the week, the S&P has retraced all of last Friday’s tariff escalation losses as if the new tariffs never happened.
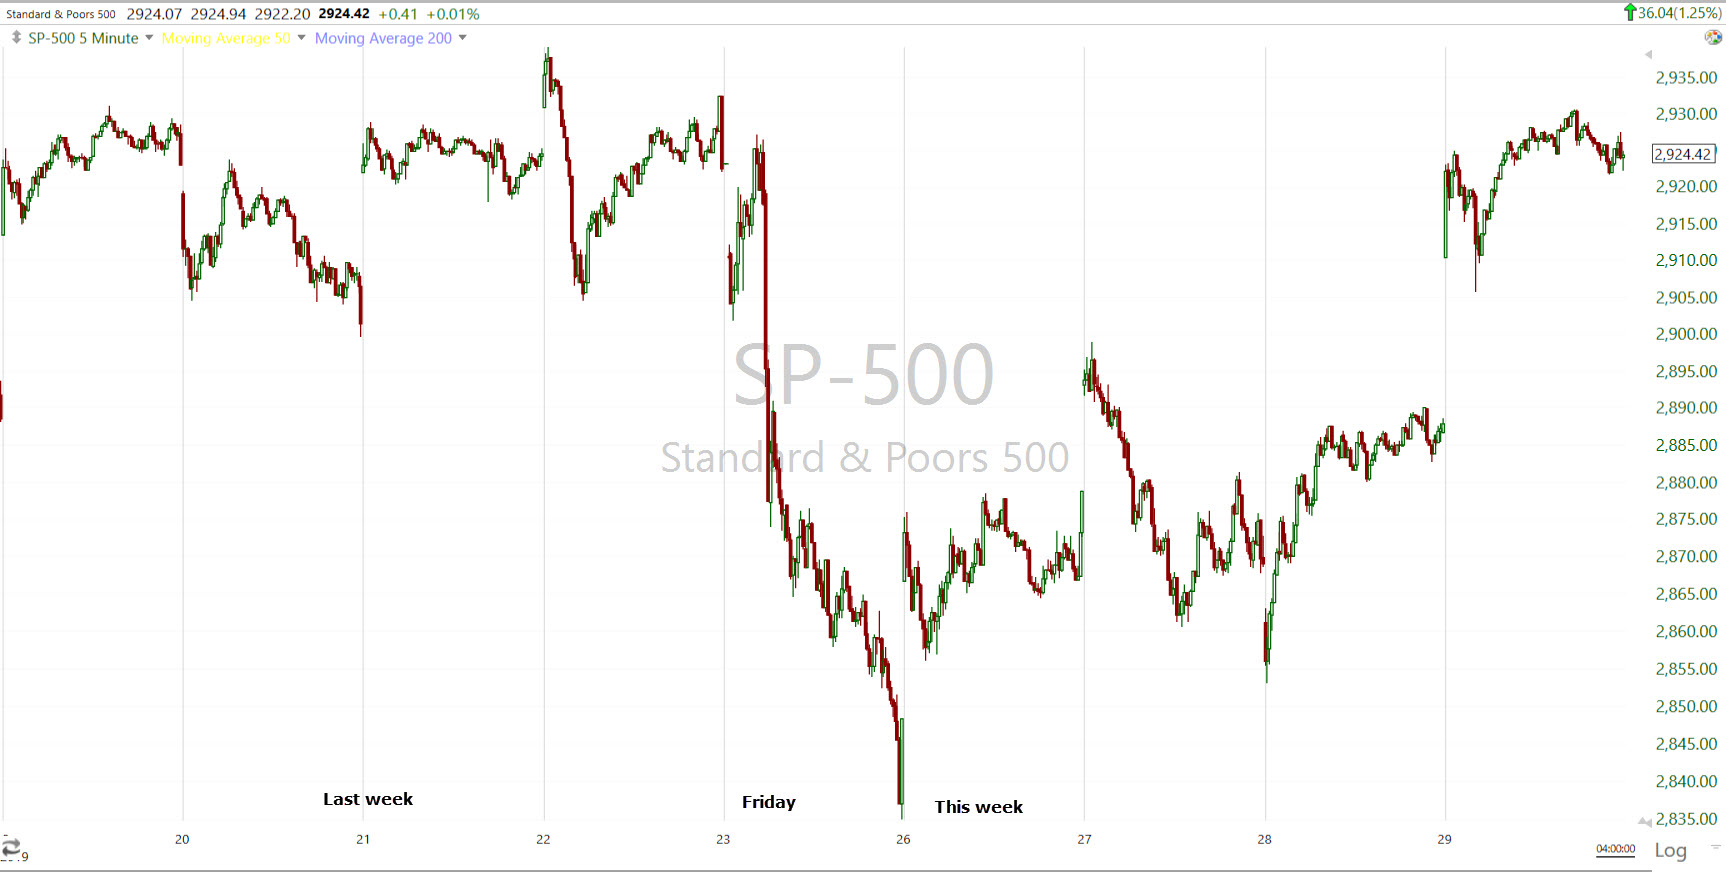
SP-500 (5m)
Averages
Russell 2000 was the strongest performer for a second day. Small Caps tend to lead the broader market.
S&P 500 ⇧ 1.26 %
NASDAQ ⇧ 1.51 %
DOW JONES ⇧ 1.25 %
RUSSELL 2000 ⇧ 1.63 %
The NYSE TICK chart shows the extent of buying programs and short squeezes on the open…
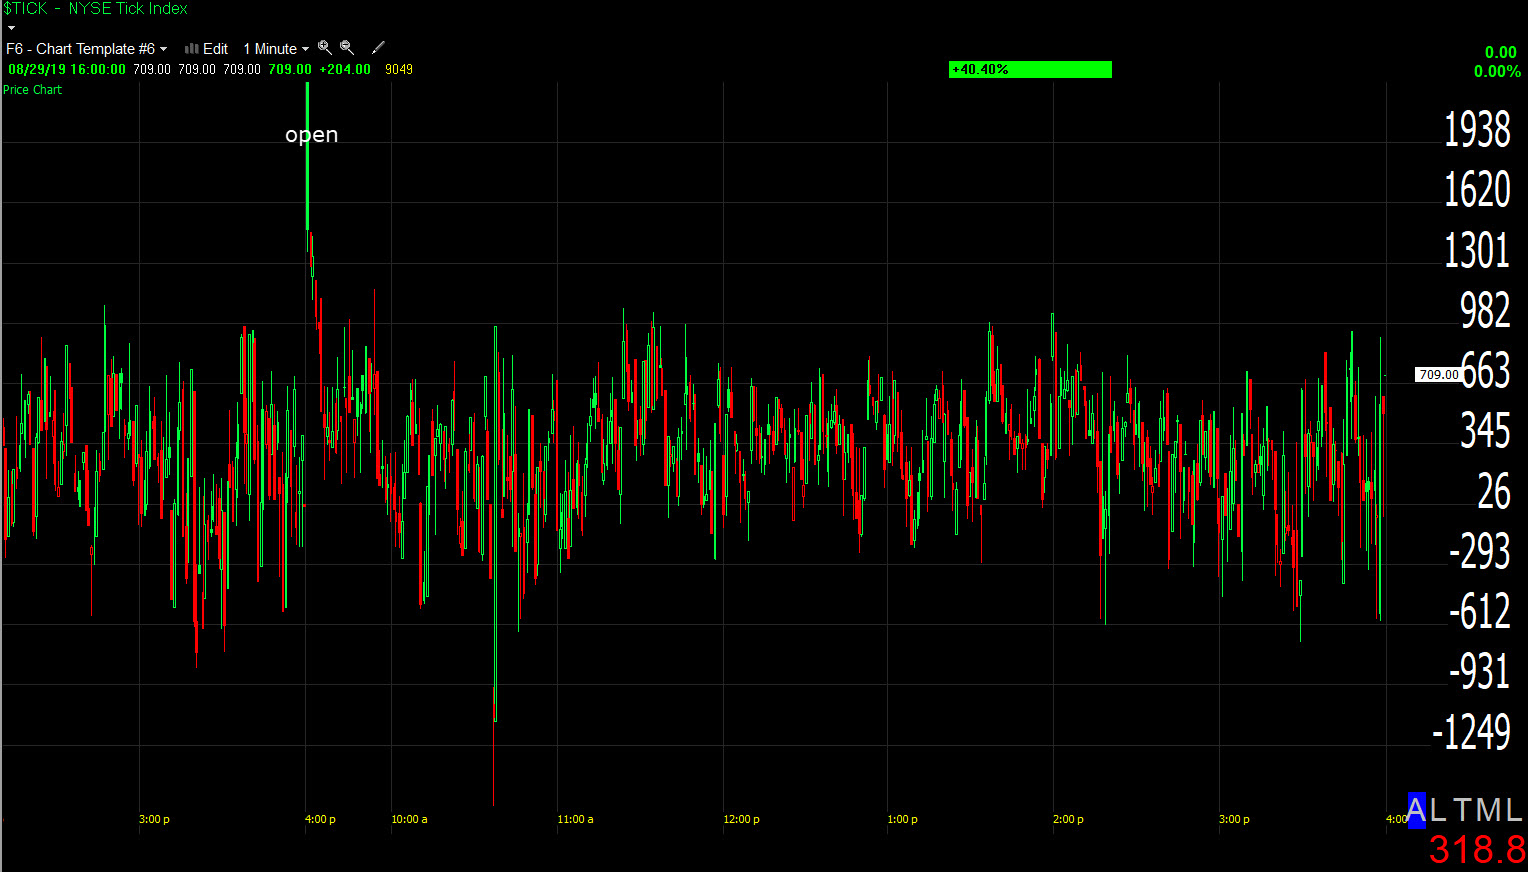
NYSE TICK Index (1m today) The opening surge was huge, but fell off quickly, muted the rest of the day. The first time I looked at NYSE advancers/decliners this morning they were better than 8:1.
The averages traded outside of Friday’s range putting an end to the whimper rally possbility.
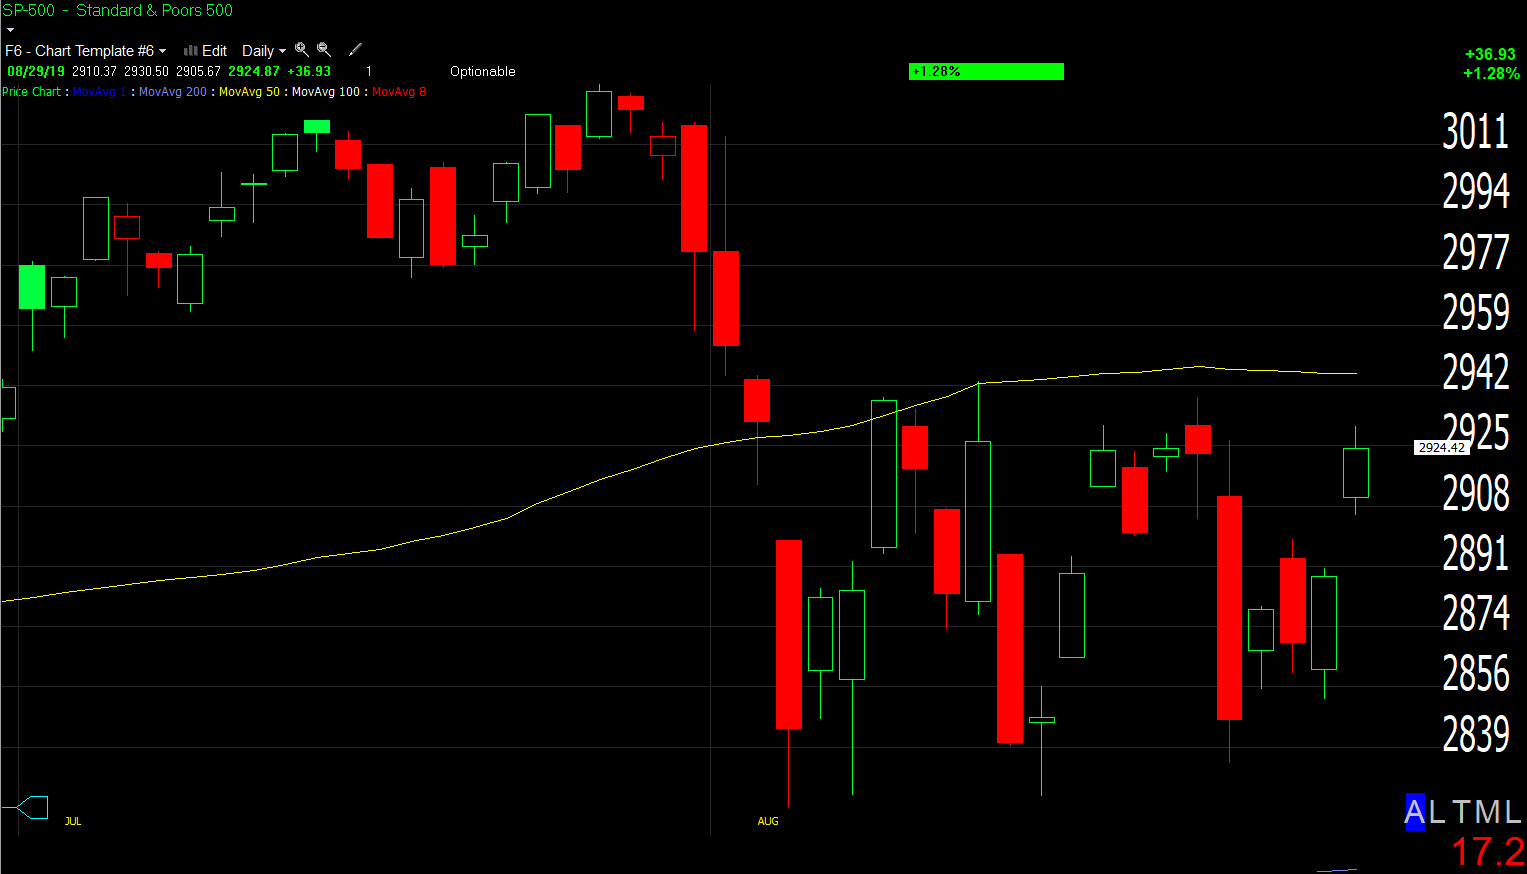
SP-500 (daily) The Dow and NASDAQ 100 also fell short of testing the 50-day moving average (yellow) above.
Today was strong enough to take a whimper rally off the table, it was not strong enough to change any of the August consolidation trends.
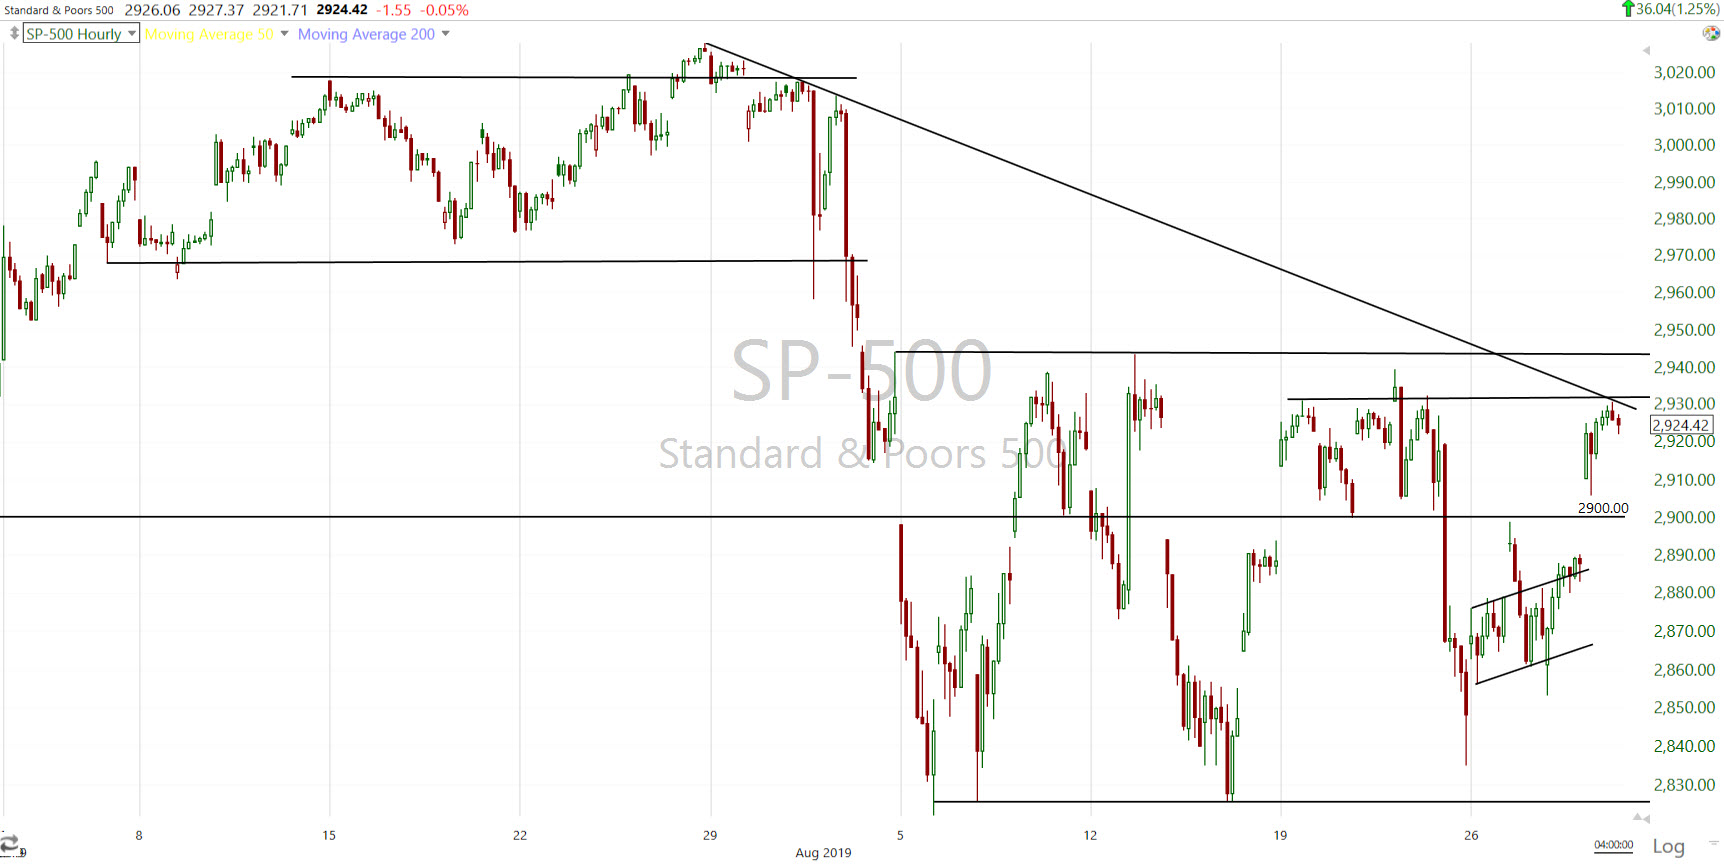 SP-500 (60m) still trading in a lateral range. The S&P met resistance today at the 2930 area where a descending trend line converges with the top of last week’s price range (resistance).
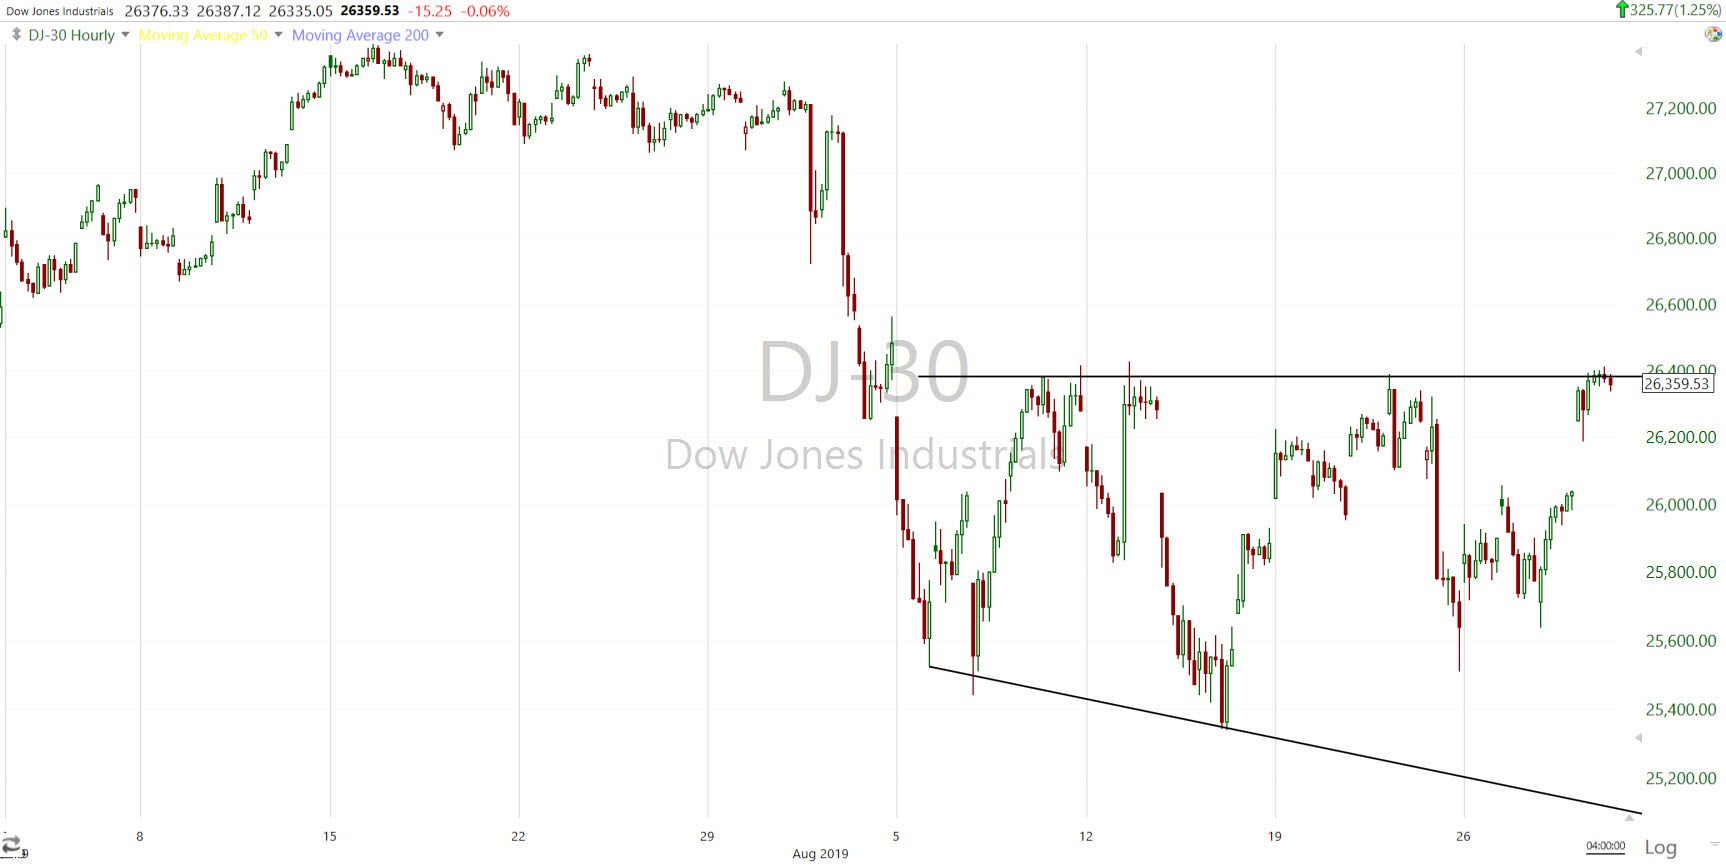 Dow Industrials (60m) are trading in a right angle broadening formation. There are no broadening bottoms. A broadening formation depicts a chaotic market with no leadership, being pushed around by rumors headlines.
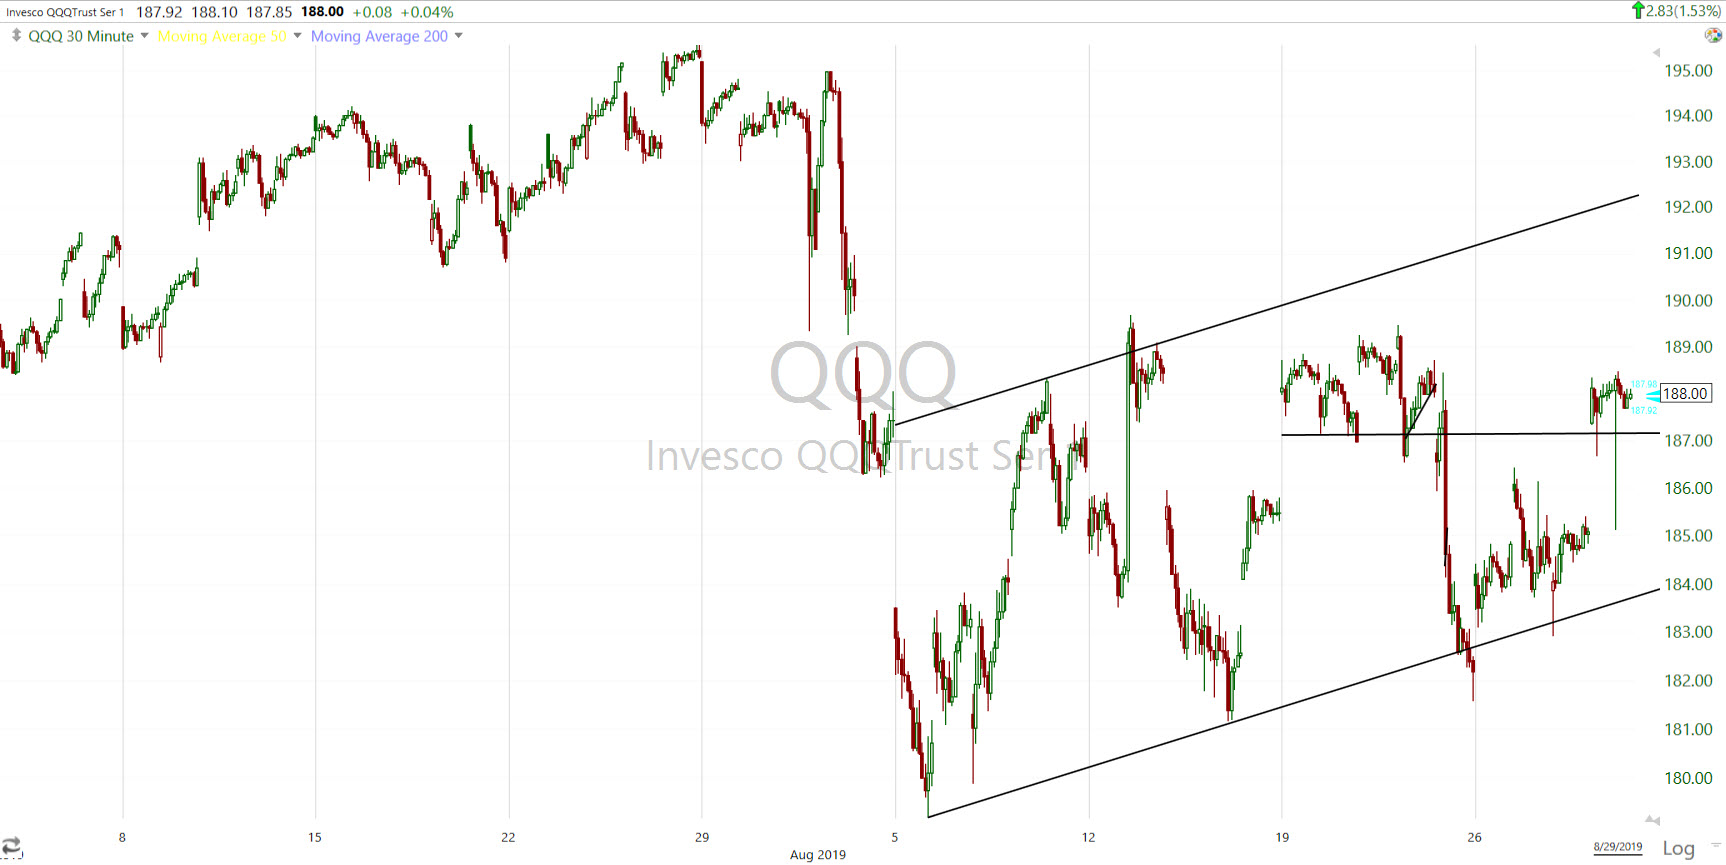 NASDAQ 100 (30m) has been trading in a bear flag, but the last two rallies failed to meet the upper trend line.
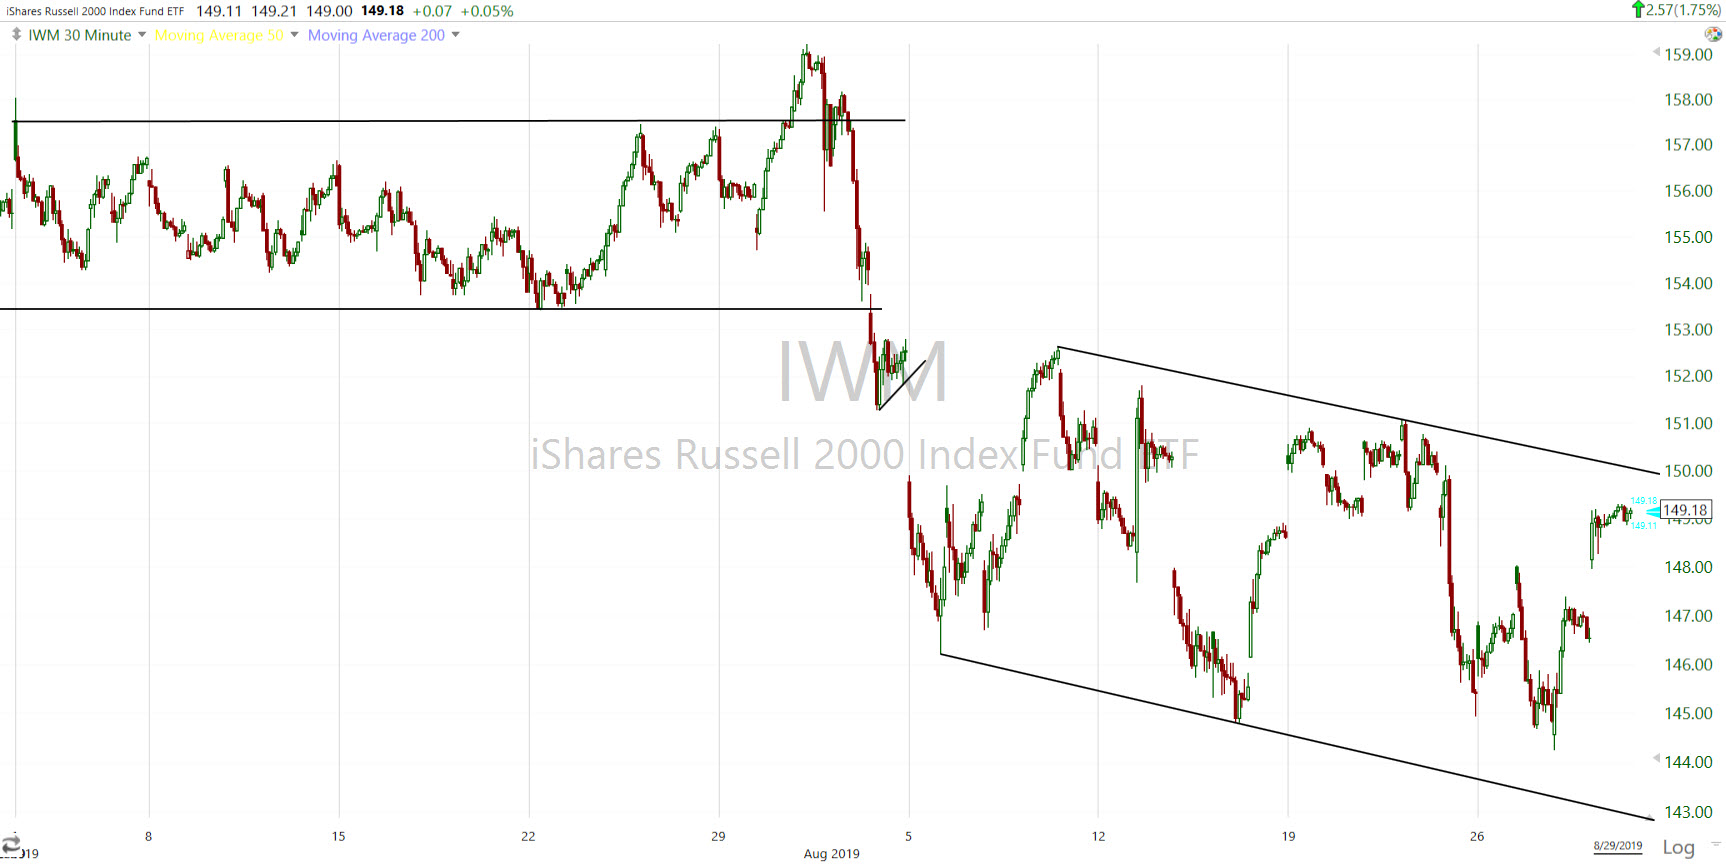
IWM (30m) despite two days of leadership, small caps remain within the month’s down trend.
From a broader perspective…
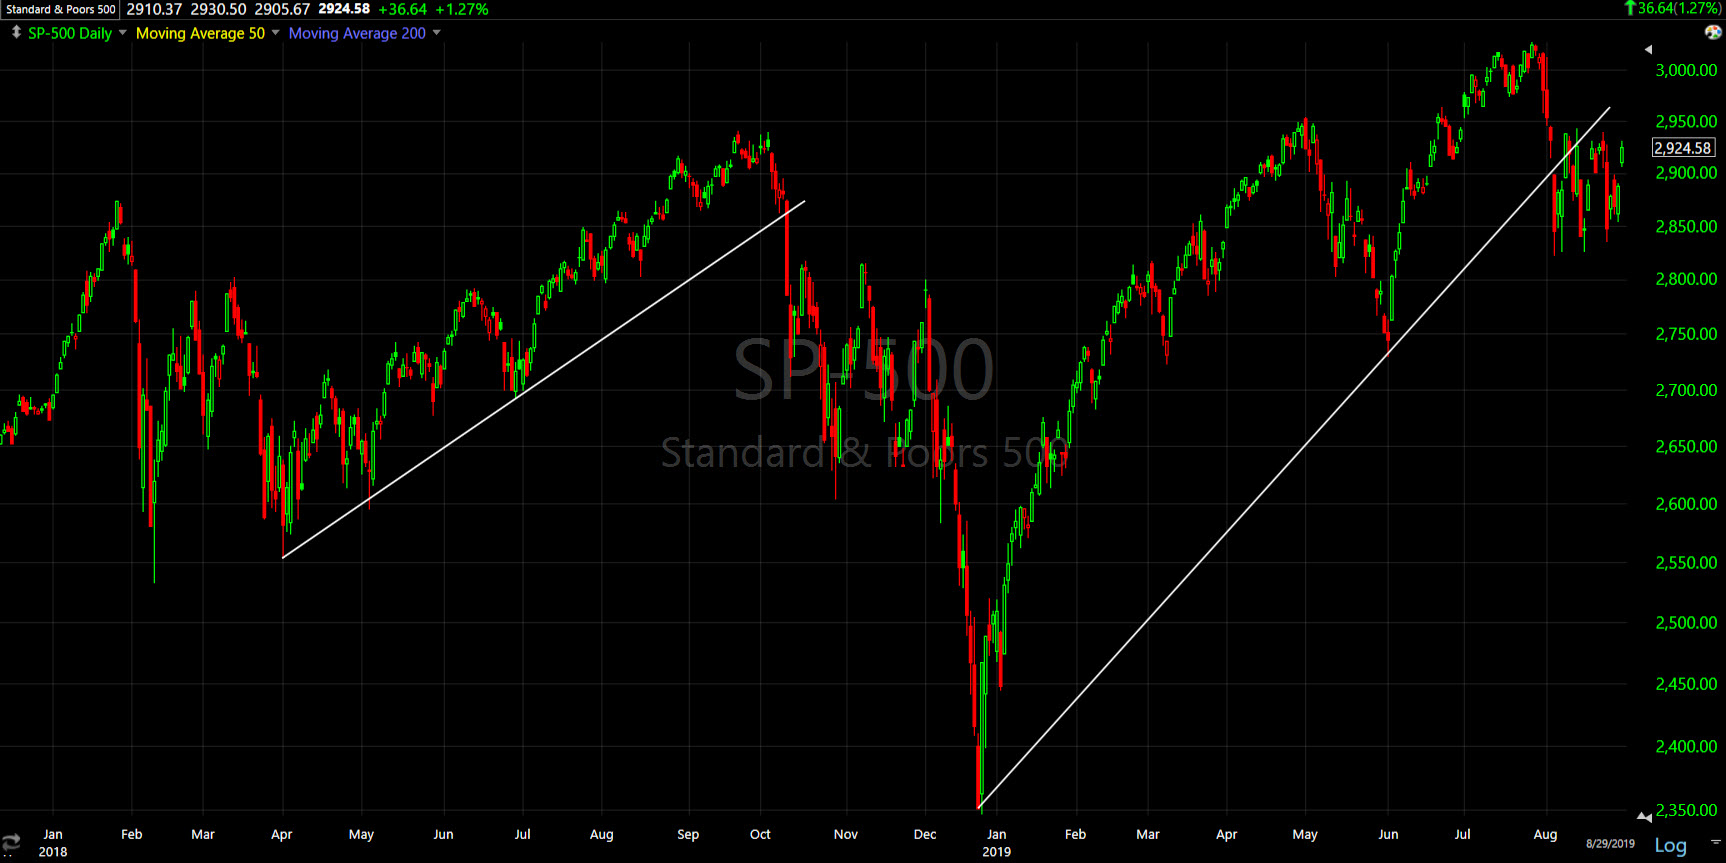
SP-500 (daily) remains under the 2019 up trend, as does the Dow and Russell 2000. NASDAQ 100 is right at the 2019 trend.
S&P sectors
All 11 sectors participated today. Leadership came from the S&P 500 cyclical sectors, and trade or tariff sensitive sectors. Financials benefited from some yield-curve steepening. Energy benefited from higher Crude oil (+1.6%), which has been the most supportive risk asset for stocks this week. Energy and Financials may have also benefited from some end-of-the-month re-balancing given their poor performances in August.
The three defensive sectors and defensively oriented Health Care lagged behind.
Materials ⇧ 1.28 %
Energy ⇧ 1.47 %
Financials ⇧ 1.51 %
Industrial ⇧ 1.71 %
Technology ⇧ 1.74 %
Consumer Staples ⇧ 0.05 %
Utilities ⇧ 0.69 %
Health Care ⇧ 0.76 %
Consumer Discretionary ⇧ 1.50 %
Real Estate ⇧ 0.72 %
Communications ⇧ 1.56 %
The trade, growth and tariff sensitive Transports (+2%) and Semiconductors (+2.25%) showed relative strength.
As you can see above with the major averages, each has a different price trend through the consolidation in August. S&P sectors are the same. There are a few sectors that may need revised trend lines, but nothing so much as to have changed the overall consolidation theme.
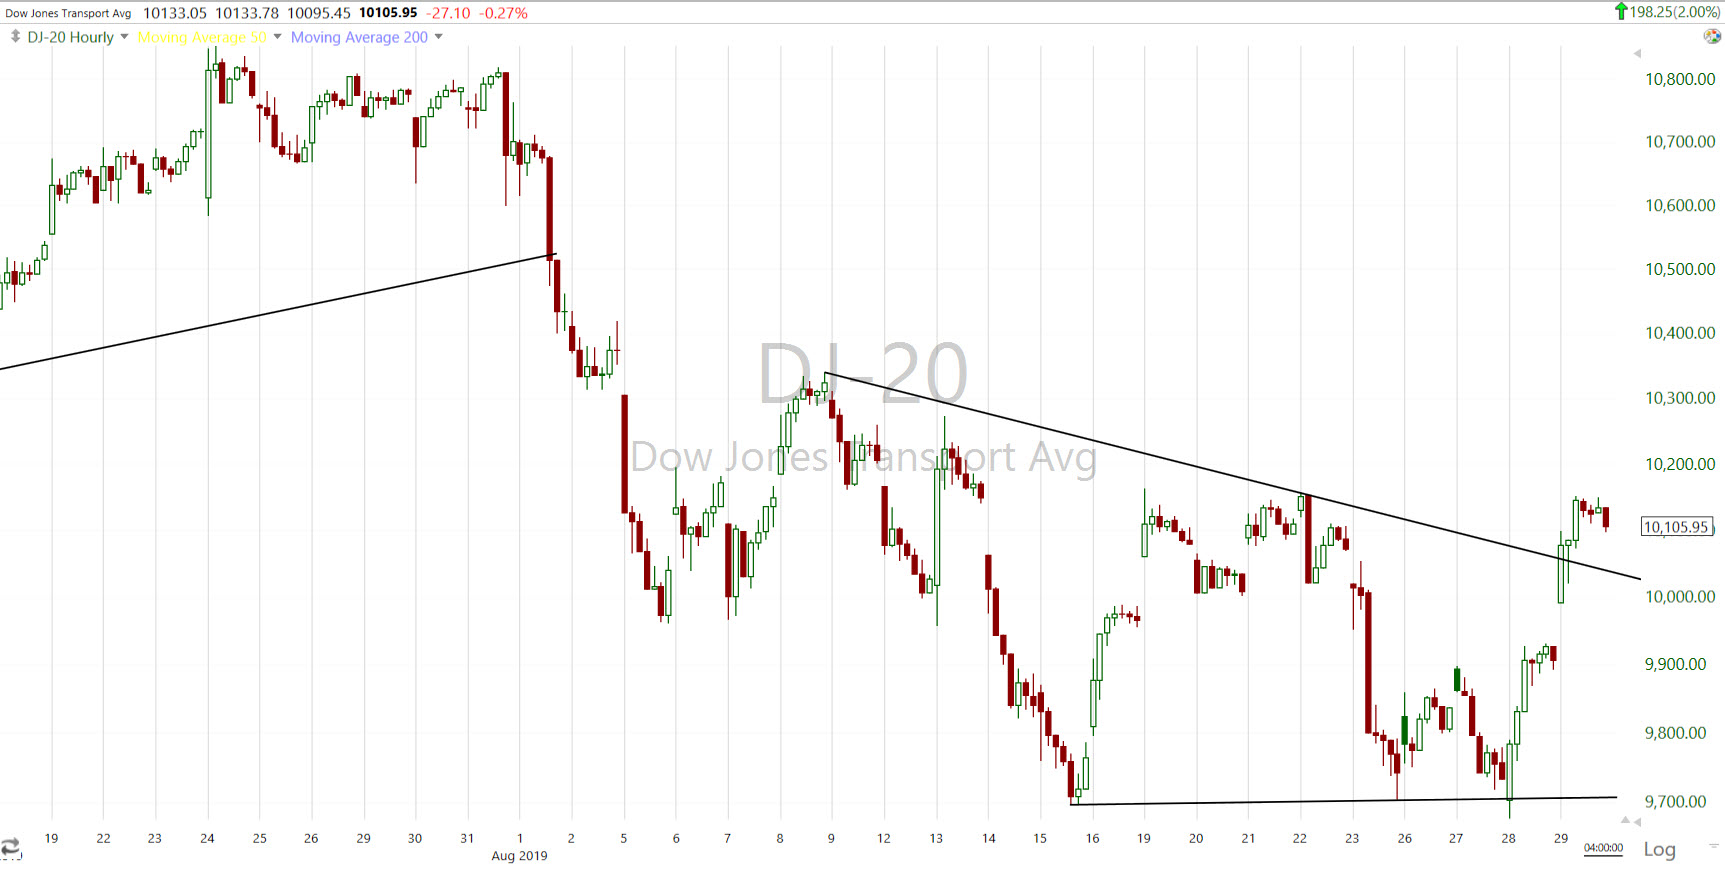 Dow Transports (60m) were trading in a bearish descending triangle until today. The consolidation trend may be revised if it’s more than a day or two. For example, Transports may be revised to a more lateral trend like the S&P. The trend would remain consolidative unless there’s a close above the August 8th high.
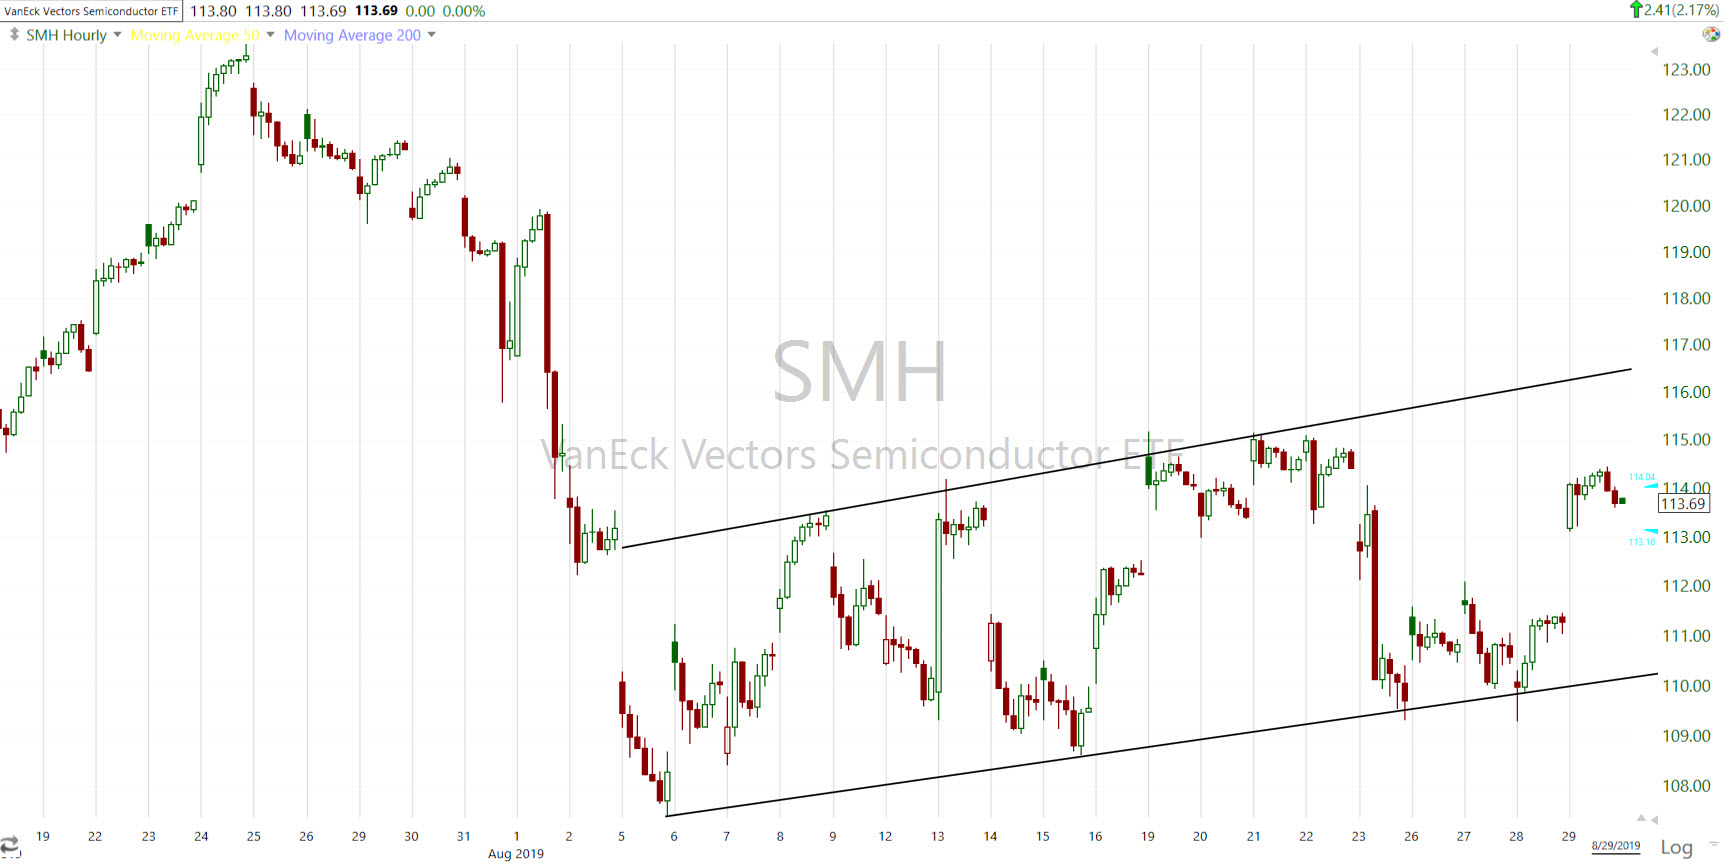
Semiconductors (60m) are similar to the NASDAQ and the Technology sector, all have been trading in bear flags.
Only the three defensive sectors have bullish/constructive trends in August.
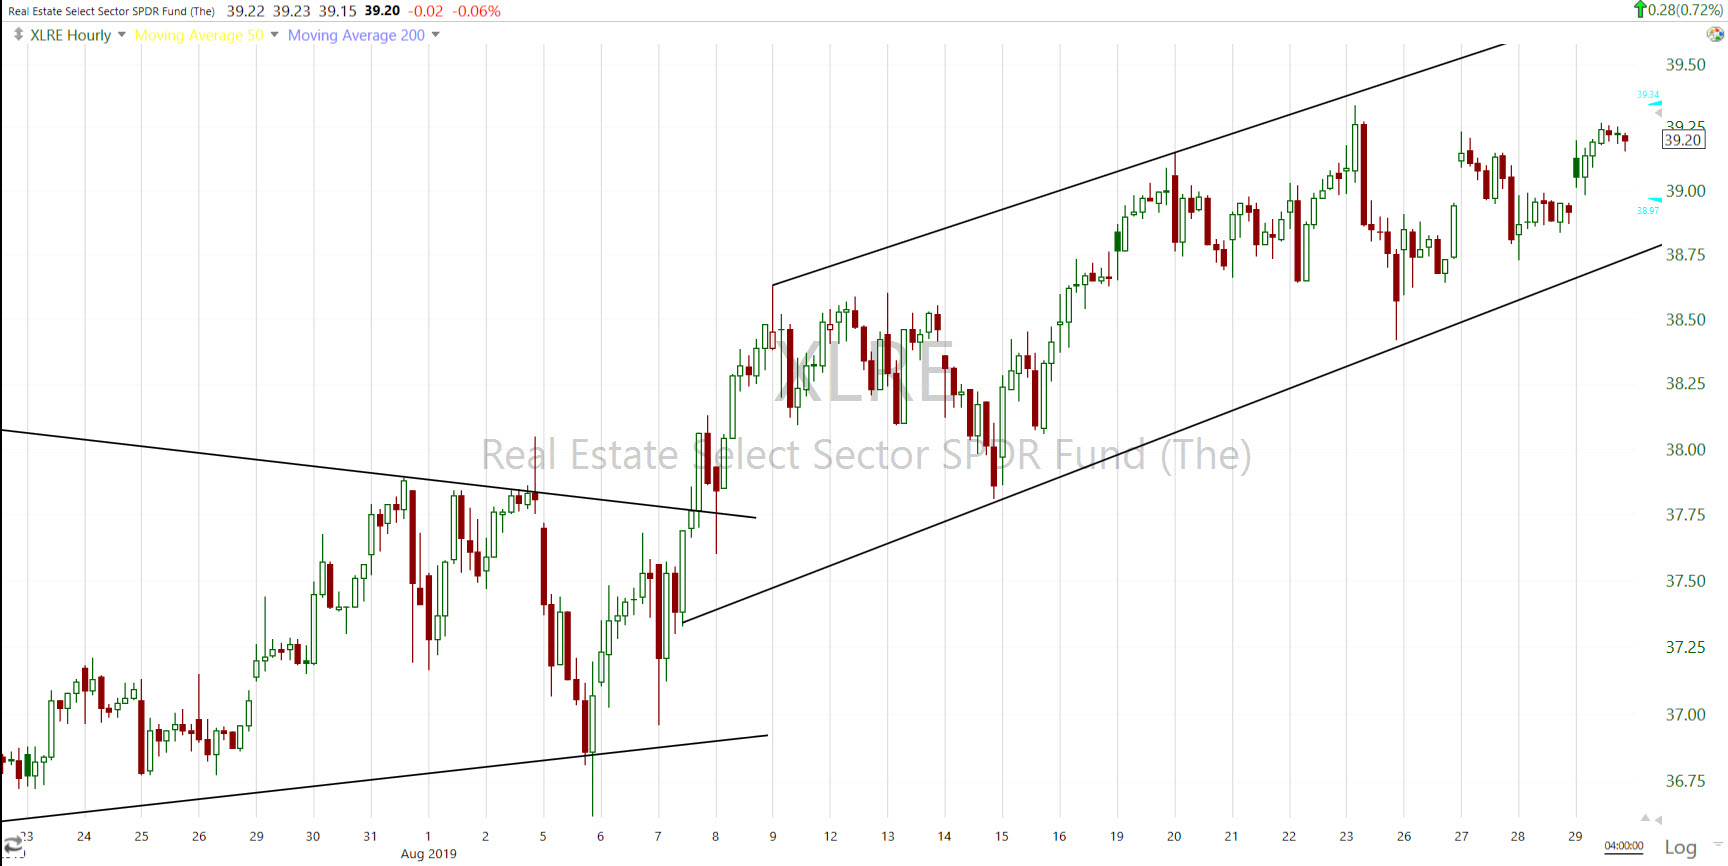 Real Estate sector (60m) trending higher in August and making new record highs.
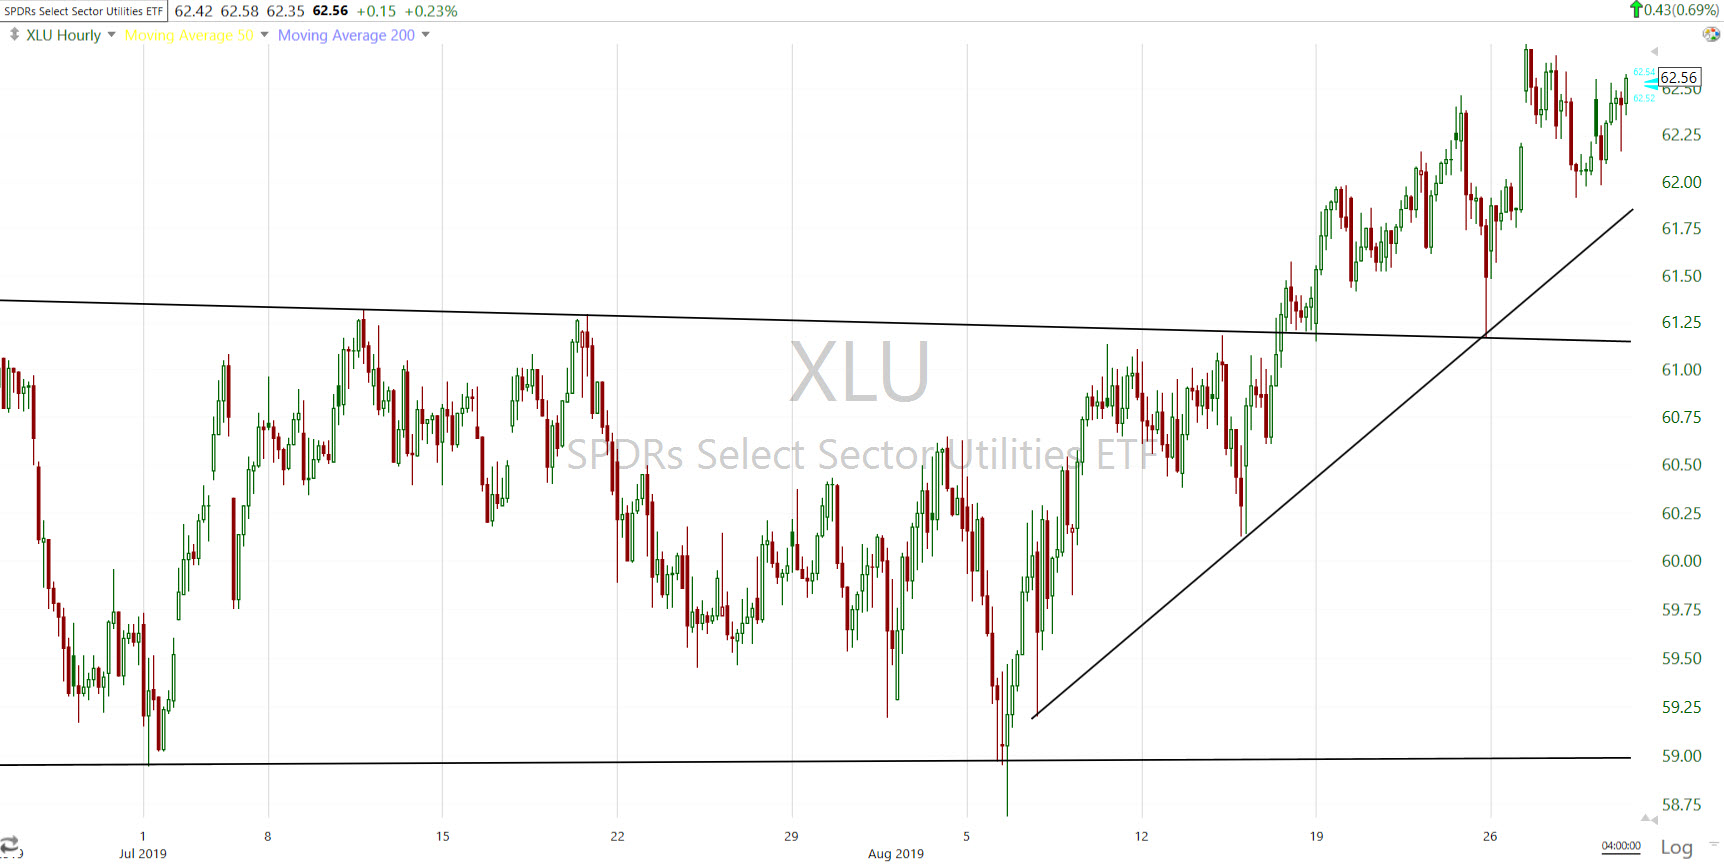
Utilities (60m) trending higher in August, also making new record highs.
Internals
Looking under the hood – NYSE advancers (2219) were better than 3-to-1 over decliners (640). The fly in the ointment is volume was light at 712.6 mn shares, barely above Wednesday’s very light 706 mn shares.
The dominant price/volume relationship today was even stronger than yesterday with 60-70% of the components for the each of the major averages coming in at the weakest relationship, Close Up/Volume Down. Internals today put in another 1-day overbought condition, or depict a day that looks robust on the outside, but more feeble on the inside.
One thing today did accomplish was to relieve the short term oversold condition (breadth oscillators) from last Friday’s plunge, something that had not been done the first 3 days of the week.
Beyond the oscillators being relieved, breadth continues to be poor.
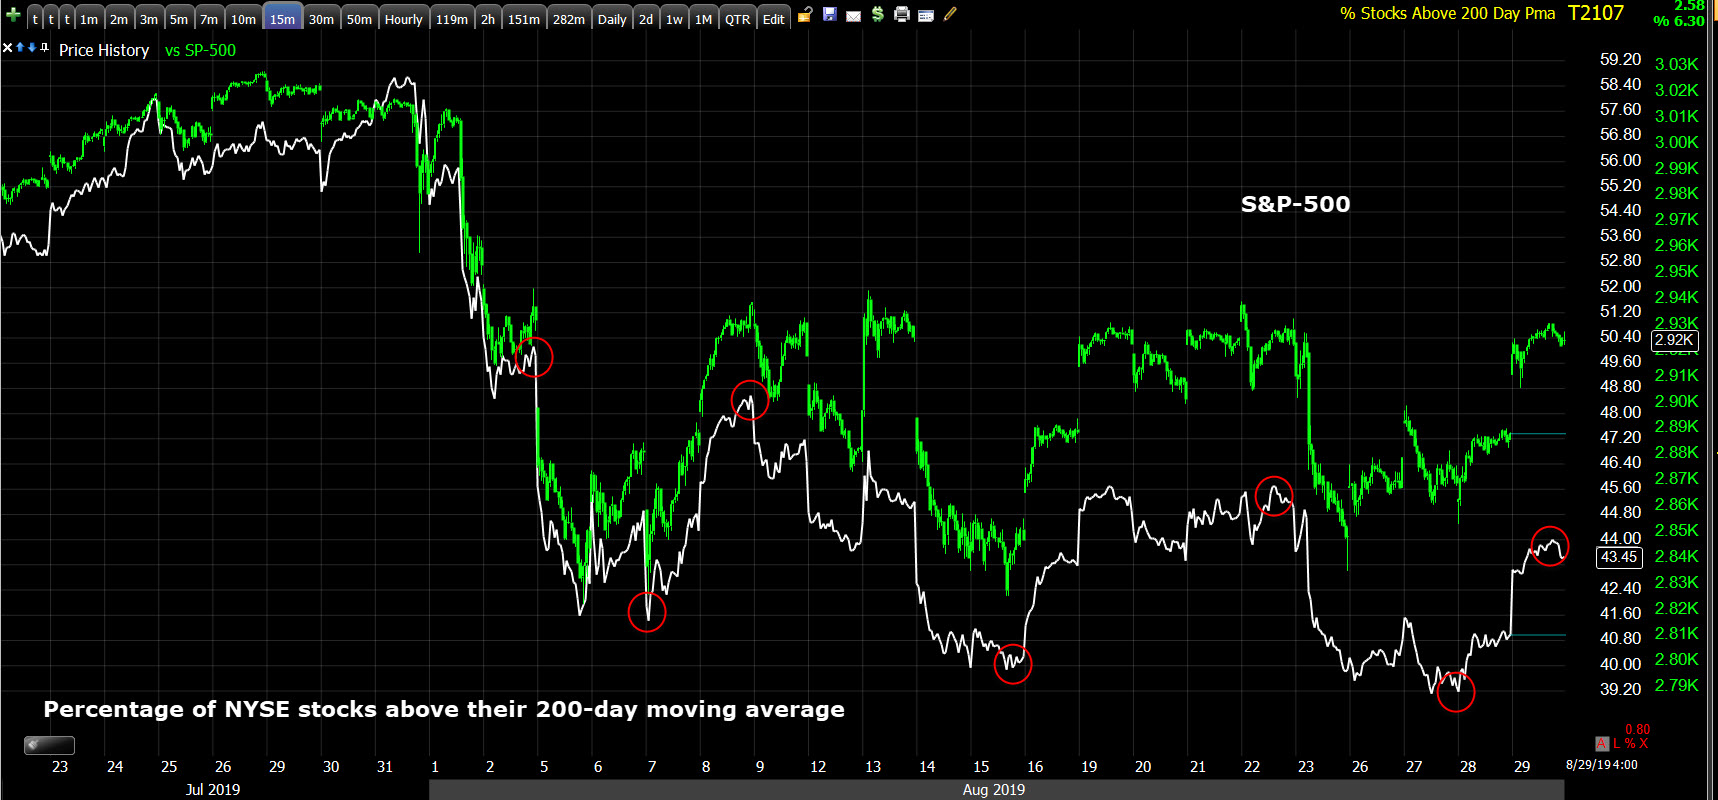
SP-500 (15m) and the percentage of NYSE stocks above their 200-day moving averages (white). I featured this chart earlier in the week to point out deteriorating market breadth – lower highs/lower lows through August, while the S&P has been mostly sideways. The trend remains unchanged as of today’s close.
Treasuries
The 2-year yield increased one basis point to 1.52%, and the 10-year yield increased five basis points to 1.52% in curve steepening trade, benefiting Financials. The steepening could have been due to the bullish sentiment today, or improved sentiment pertaining to economic growth, supported by an upward revision to second-quarter consumer spending growth.
Before the cash open, Treasuries (and many other asset classes), looked out of place relative to the S&P’s pre-market gains. Treasuries straightened out early in the cash session, but drooped in the afternoon.
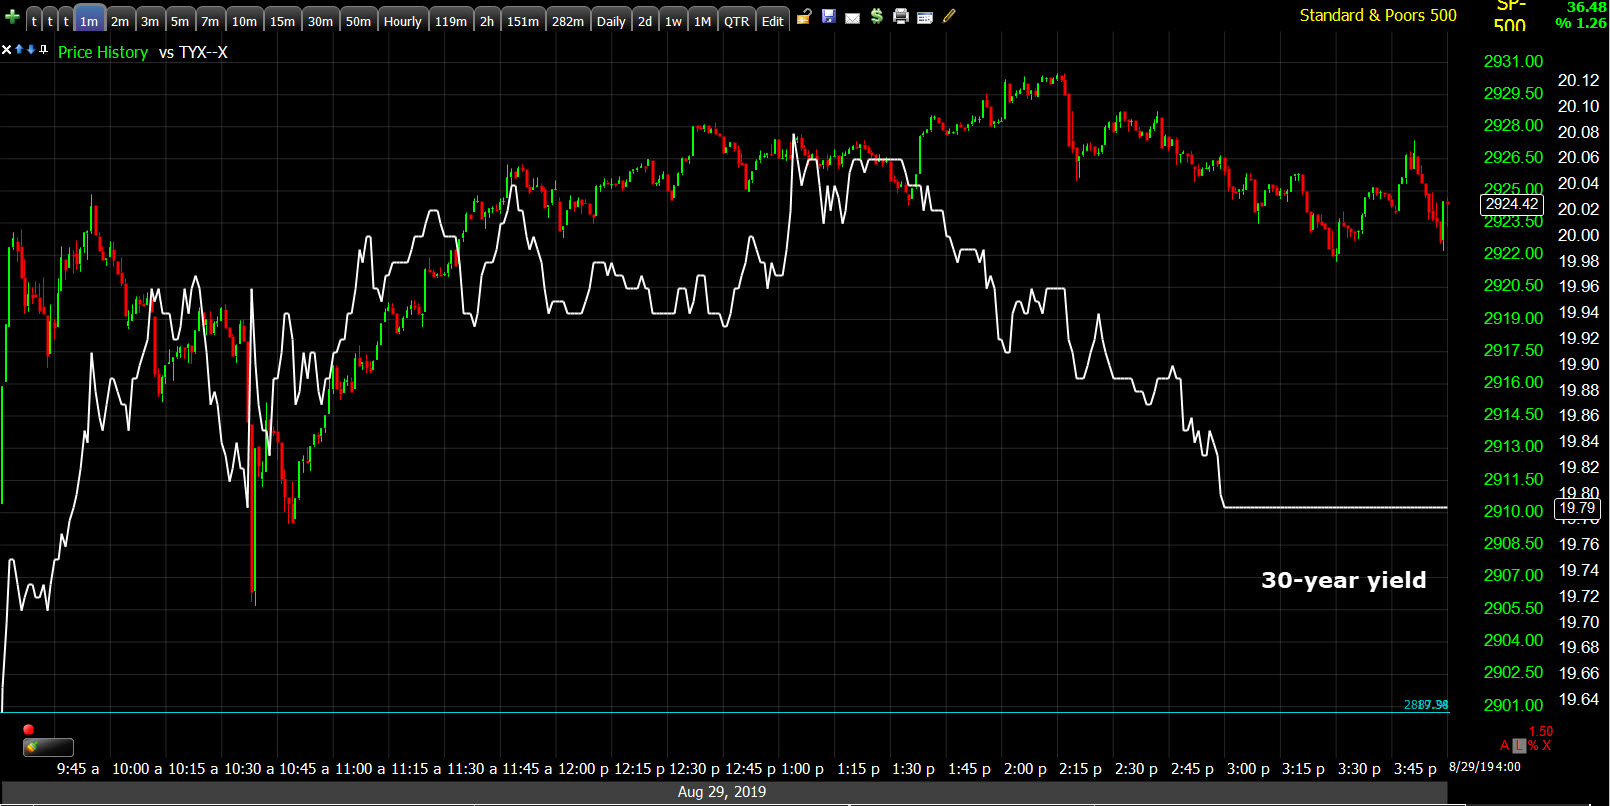 SP-500 (1m) and 30-year yield. Yields barely moved before the open, then caught up quickly this morning. By the afternoon longer duration treasuries started gaining in what looked like a modest rotation to safety.
Yields on the week are still sharply divergent with the S&P…
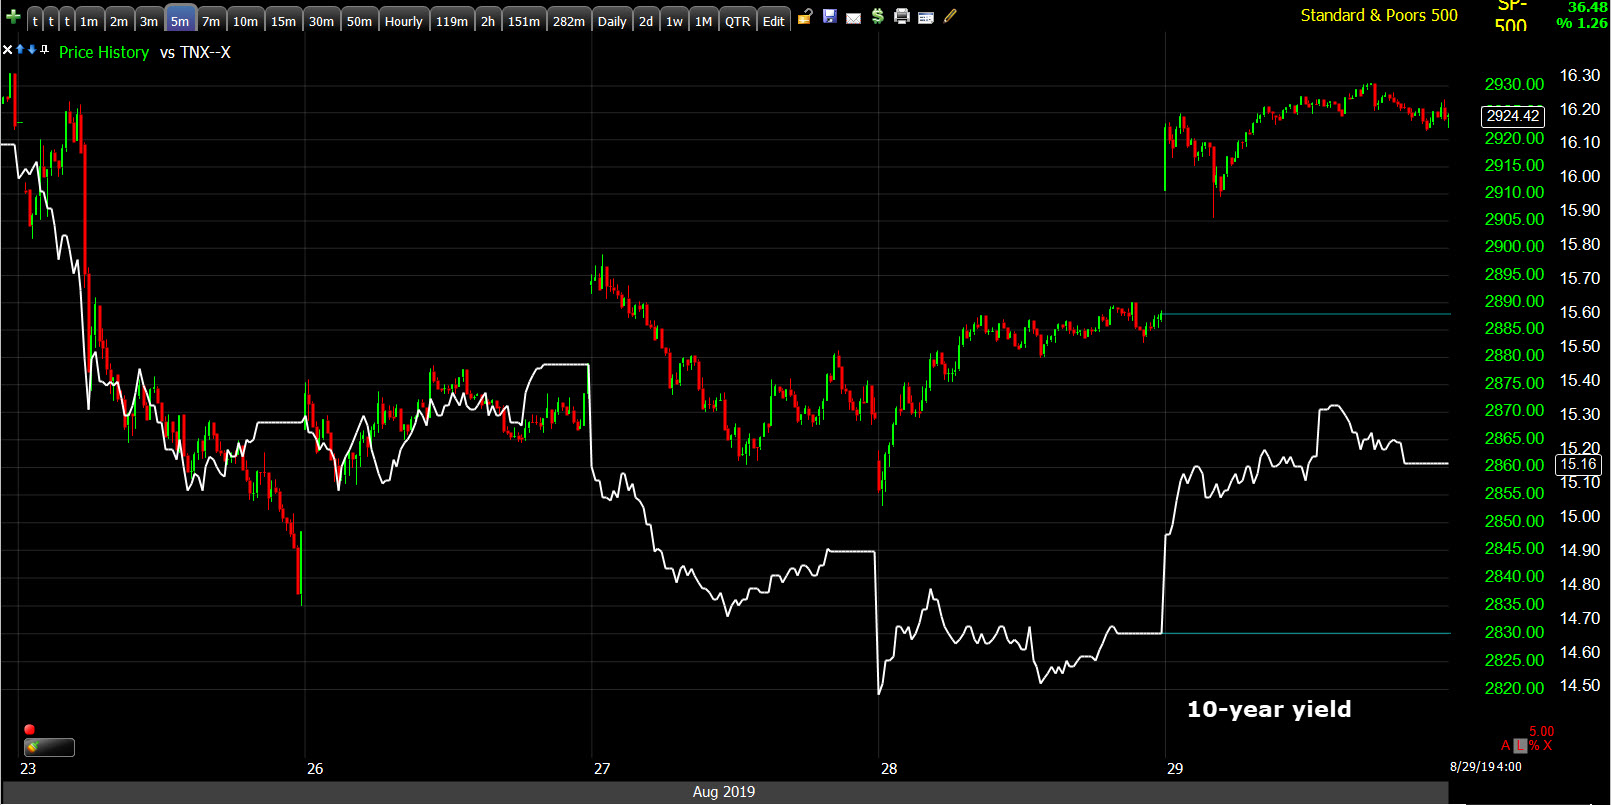 SP-500 (1m) and 10-year yield. The decline Tuesday and Wednesday has left a wide divergence still open.
Yields on the month are even more divergent with the S&P…
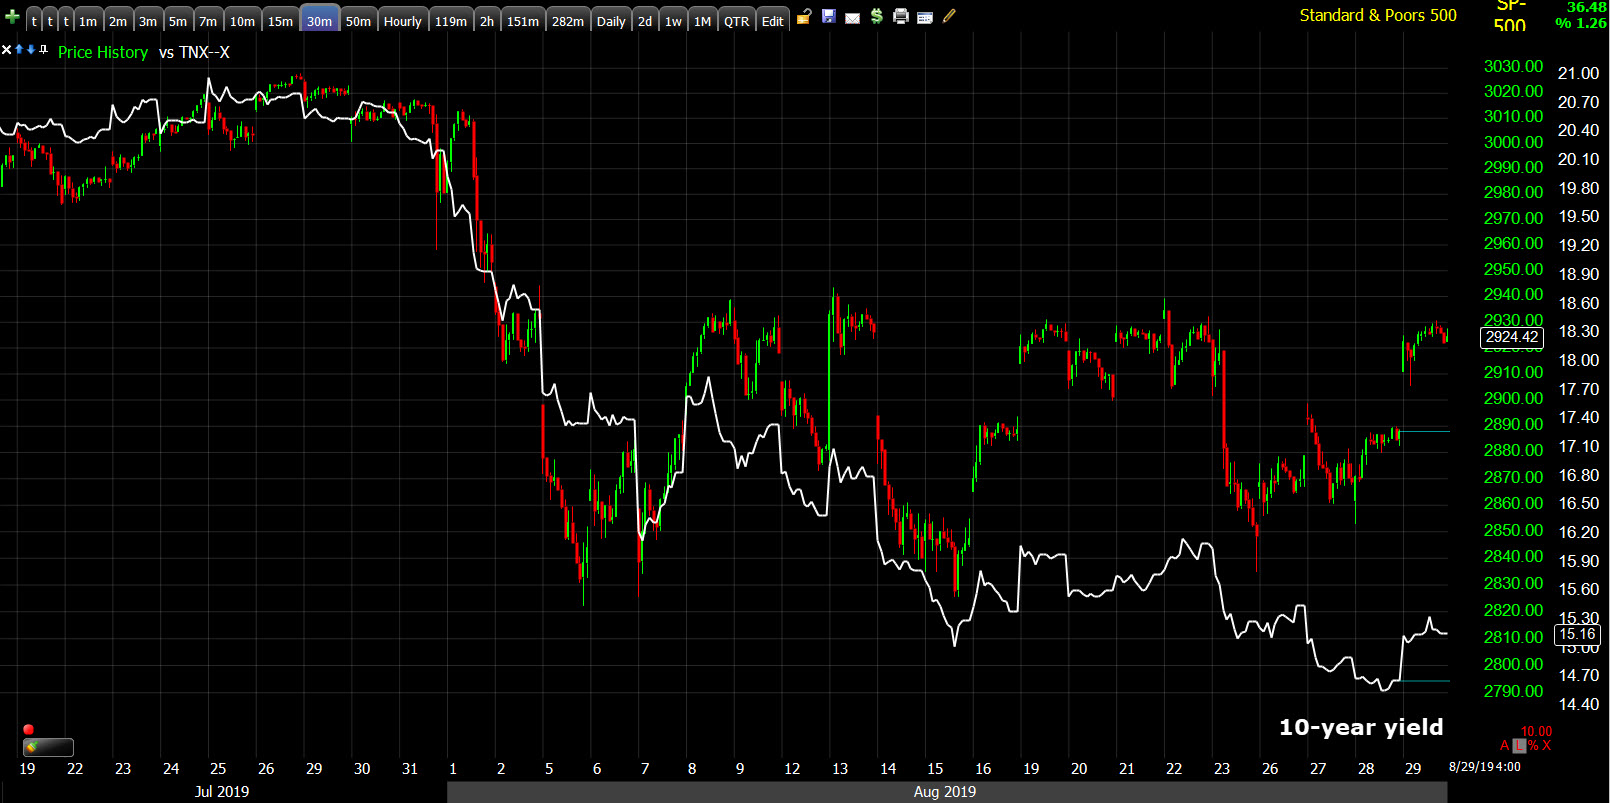
SP-500 (30m) and 10-year yield making lower highs and lower lows through August. The trend is unchanged leaving a large divergence with the S&P.
Currencies and Commodities
The U.S. Dollar Index advanced 0.3% to 98.45.
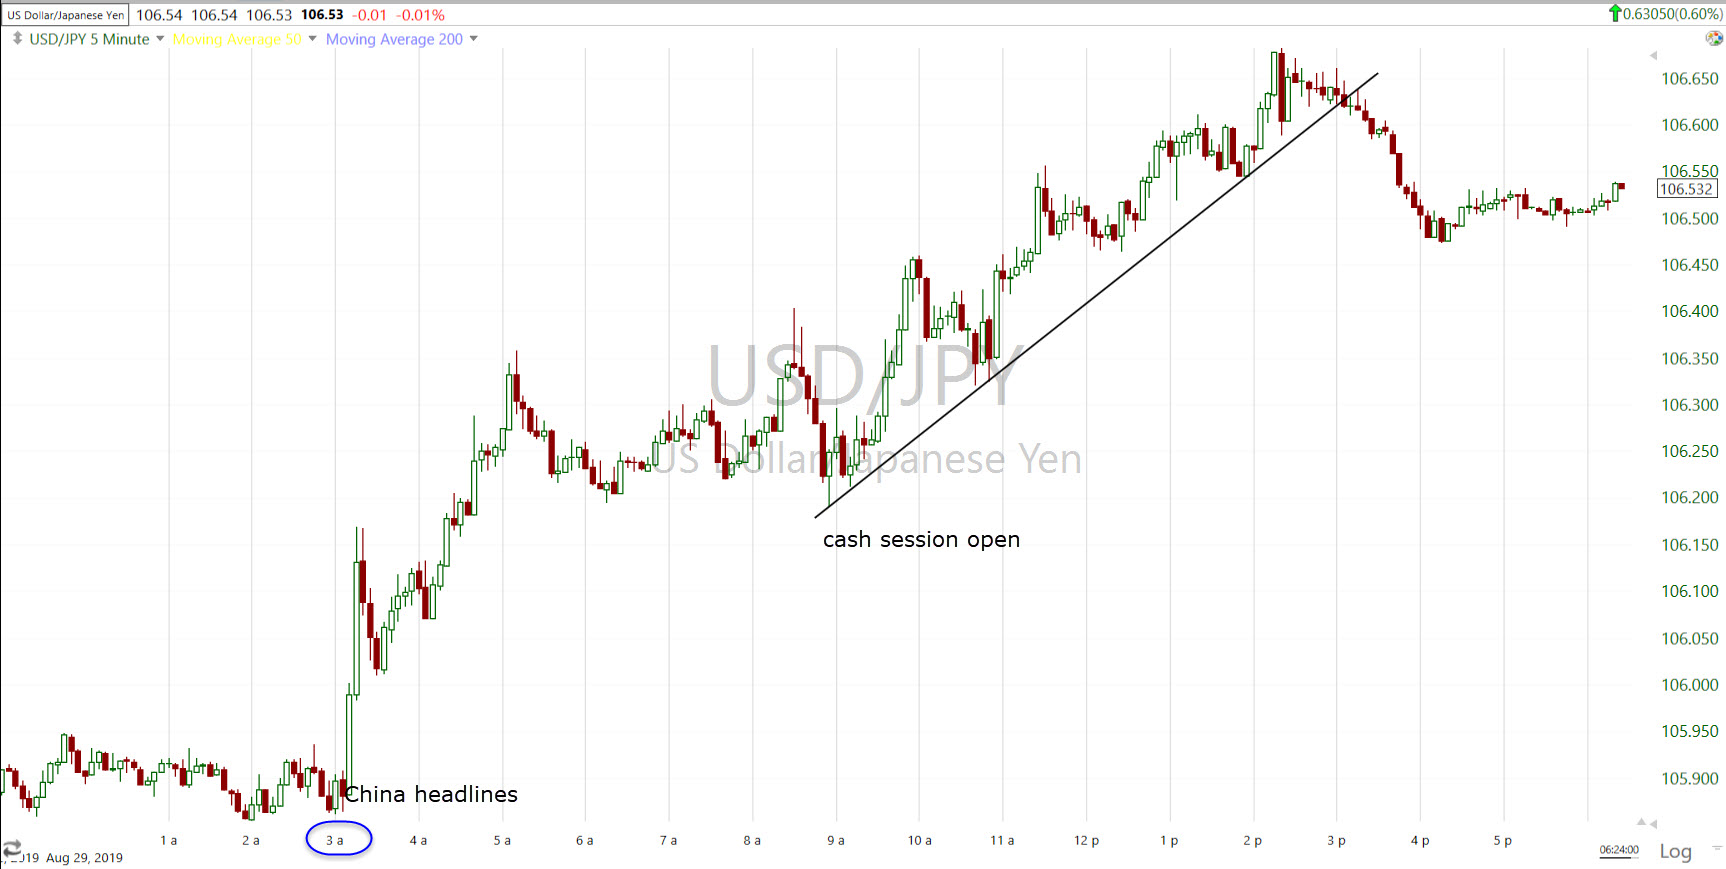 USD/JPY (5m) from the overnight session through today. The pair surged on the headlines from China overnight. It was a little dull before the open. Then in the cash session the yen was sold with some modest interest in the safe haven yen in to the close.
USD/JPY’s August consolidation is unchanged.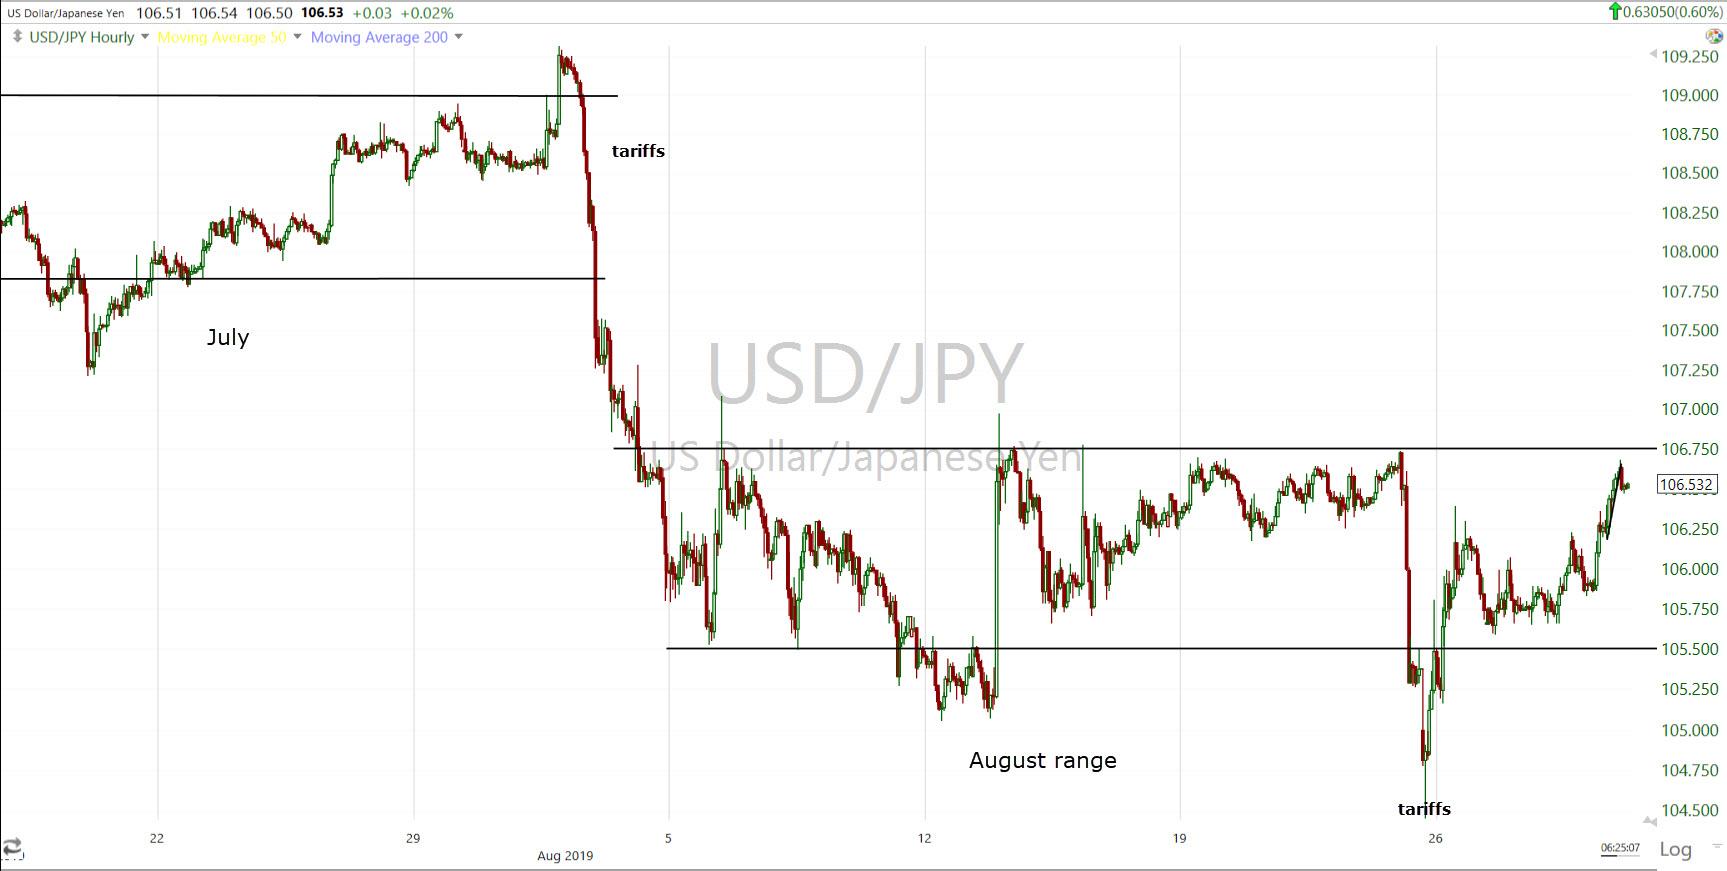
USD/JPY (60m) selling off on the early August tariffs, then consolidating like the S&P in August, with the exception of last Friday’s new tariffs sending the pair briefly below the range as the yen was bought in a flight to safety.
AUD/USD was less enthusiastic about the headlines…
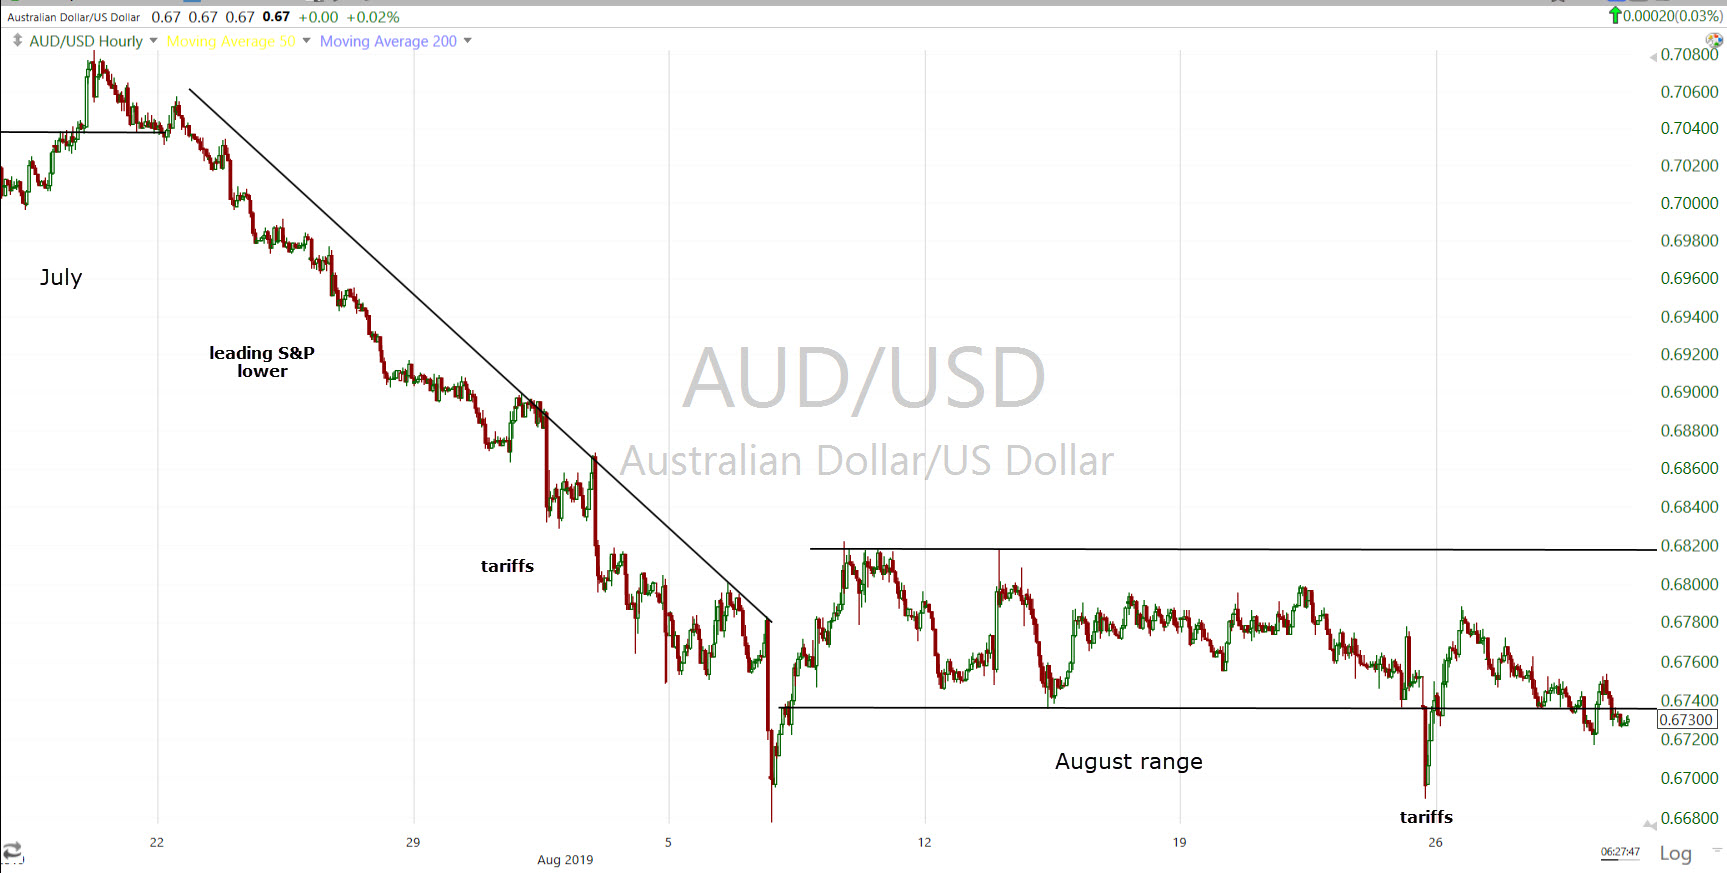 AUD/USD (60m) lingered near the bottom of the August range today.
If you want to put the overnight headlines in some perspective…
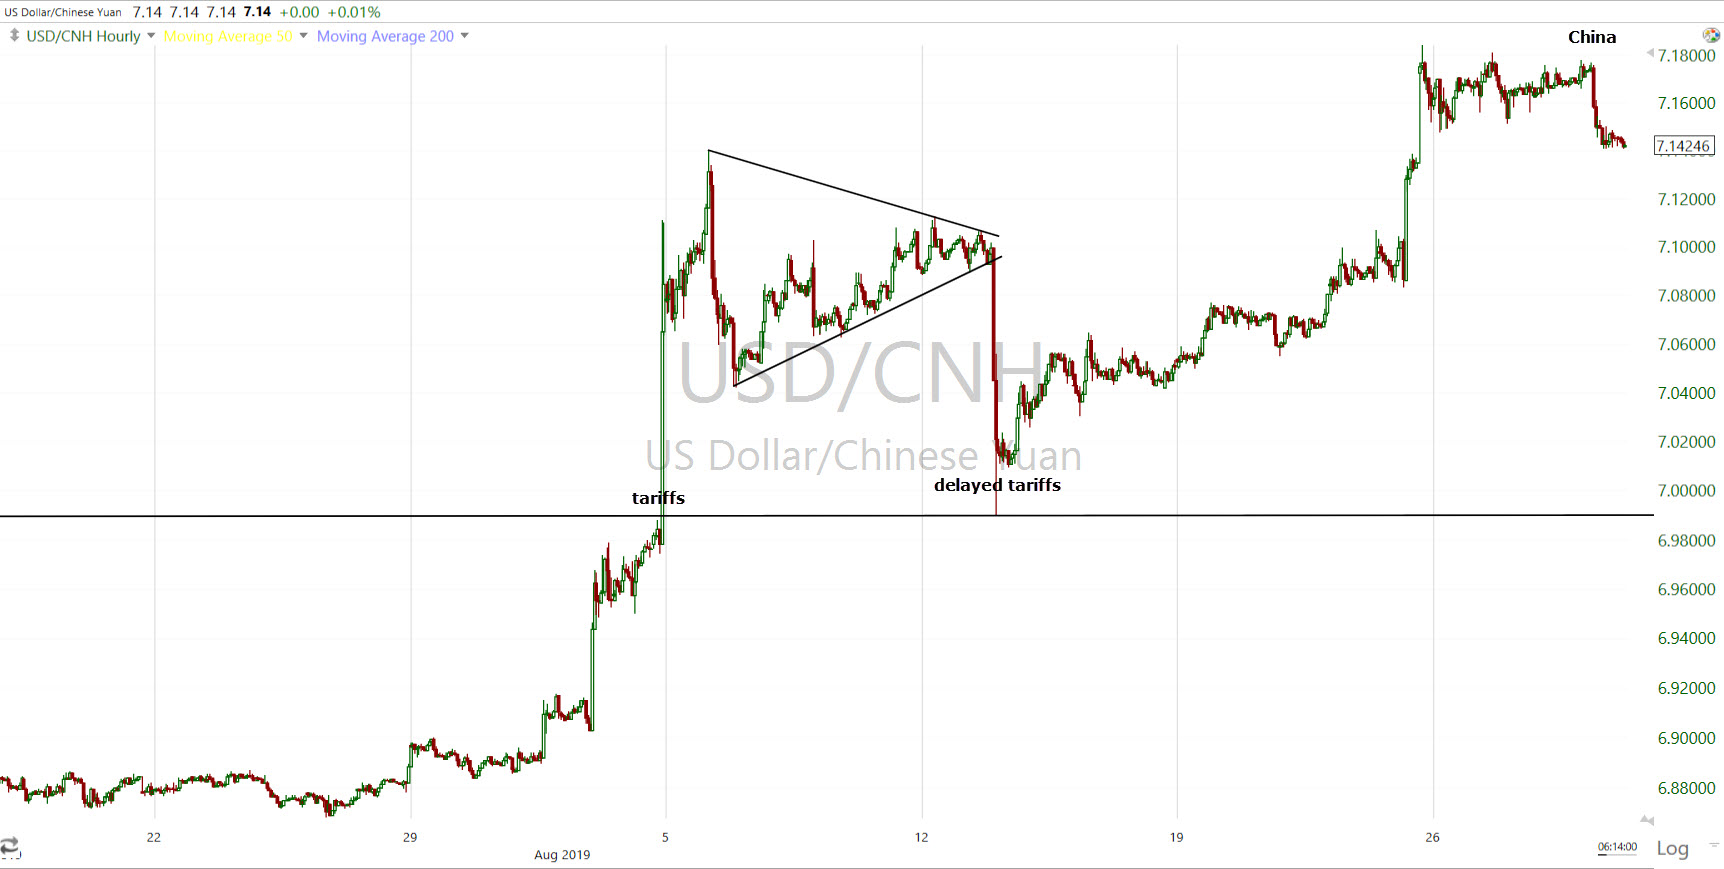
USD/CNH (Dollar/off-shore yuan 60m). The yuan sold off hard on the first tariff escalation in early August. It gained on a brief deescalation as President Trump delayed some September tariffs until December. The drop to the far right is the overnight reaction. Today’ reaction to the hopeful headlines was not as strong as the delayed tariffs reaction. In both cases, the chart above is a gauge of market hope and fear centered around the trade war. The breakout above $7 and the trend since shows the Chinese yuan being devalued again like 2018.
Surprisingly there was no reaction in the FX pair this afternoon to the Wall Street Journal report that U.S. prosecutors are looking into additional instances of alleged technology theft by Huawei.
WTI Crude oil closed up +1.6% to $56.67/bbl . Crude has been the most constructive risk asset for the S&P this week. Crude closed a little above the downtrend starting mid-July.
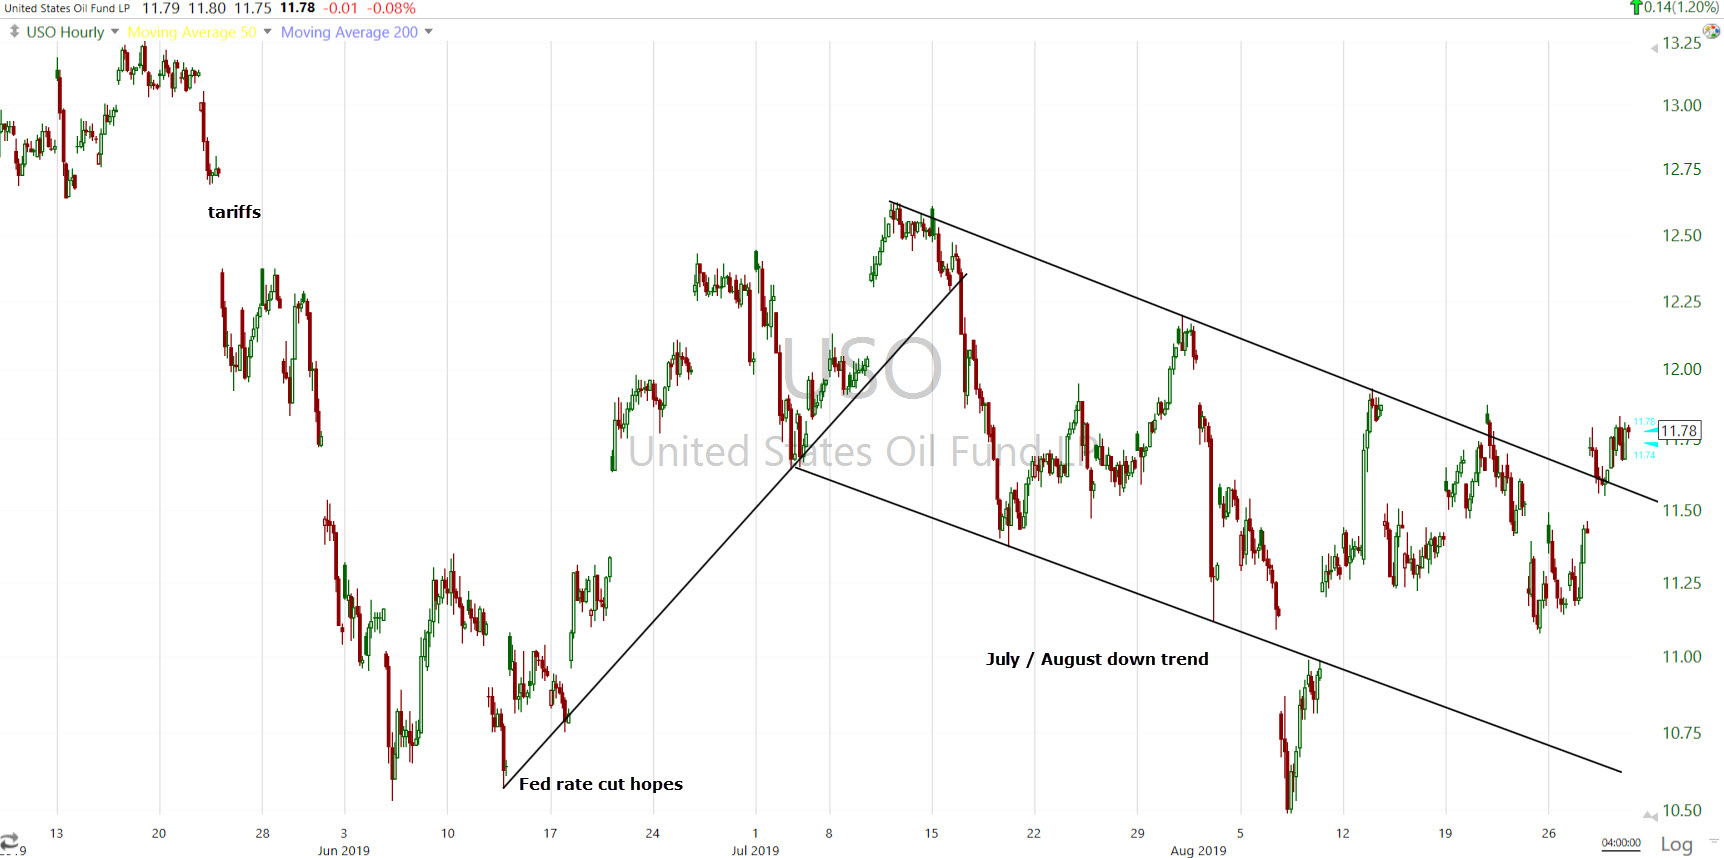
USO (60m) today’s close could be a change in charter for crude, but it has not broke out above resistance at the highs of the last 4 weeks.
Summary
Today is another day in a series of days this month that the market has strong price-percentage changes (both directions) due to elevated volatility. Looking under the hood at internals, today way no different than the rest of the advances this month… Lacking conviction.
Below are some 5 min. 3C charts. The 5 min. chart smooths out the noise of 1 min charts to help reveal the trend.
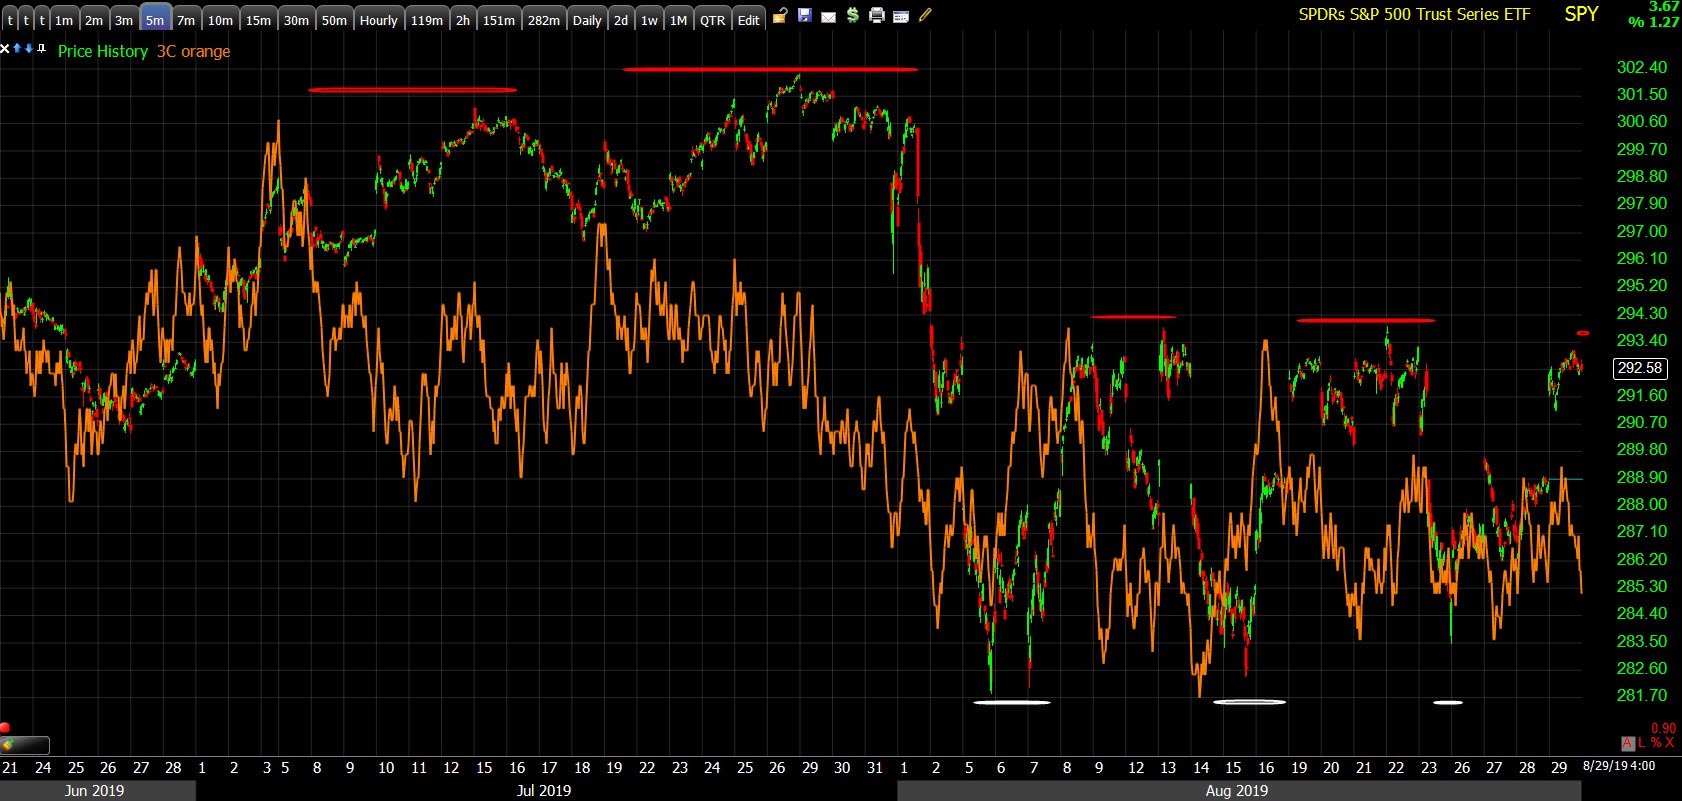 SPY (5m) June was strong. In July there were low grade, but persistent negative divergences (red) leading to the early August decline. Since then the S&P has consolidated mostly sideways. The first two rallies off the low end of the price range had positive divergences (white) and much stronger momentum in 3C than this week.
A closer look…
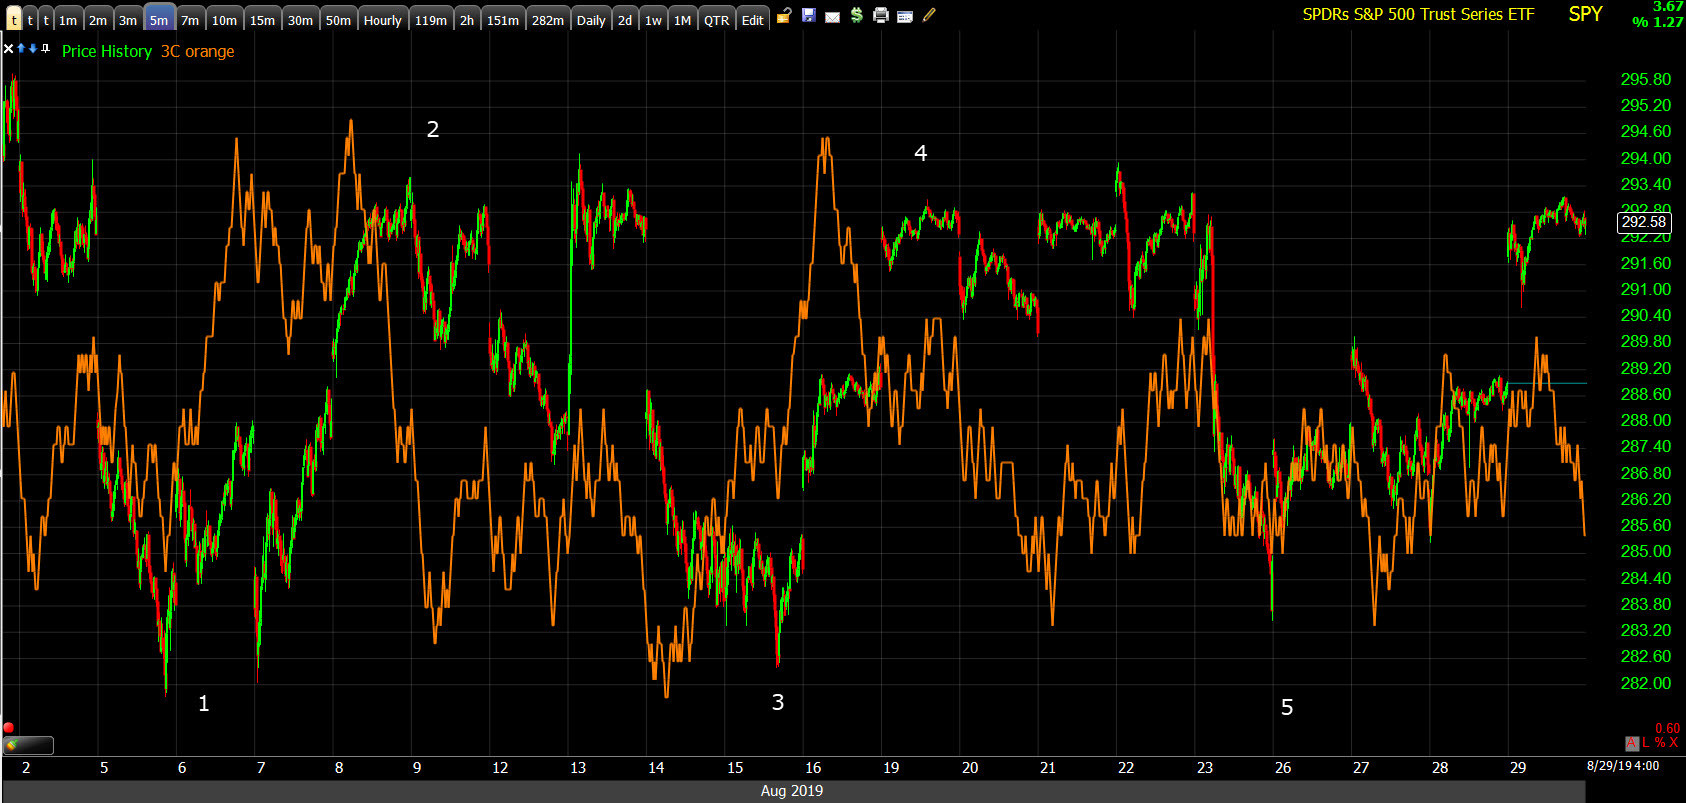
SP-500 (5m) Notice how sharply 3C moved up on the first two bounces (1 & 3), not so this week (5). Negative divergences at the high end of the range (2 & 4) were pretty crisp as well. Thee wasn’t good confirmation this morning and charts started weakening this afternoon.
IWM’s 5 min chart was leading lower weeks ago.
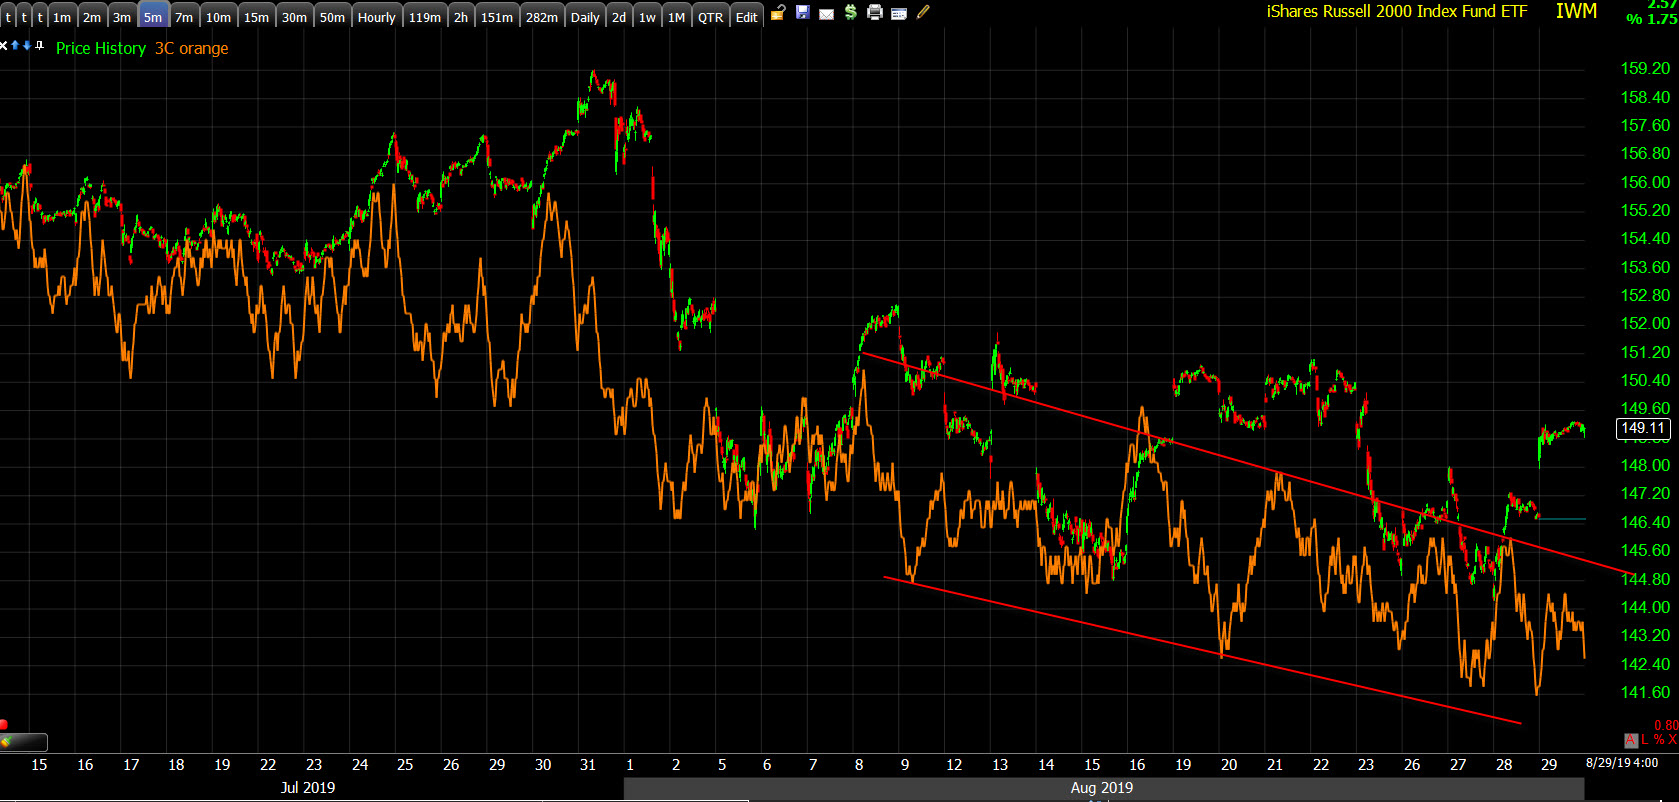 IWM (5m) Since then IWM’s price trend has followed 3C lower (lower highs/lower lows).
Relative to price, QQQ’s is the most divergent.
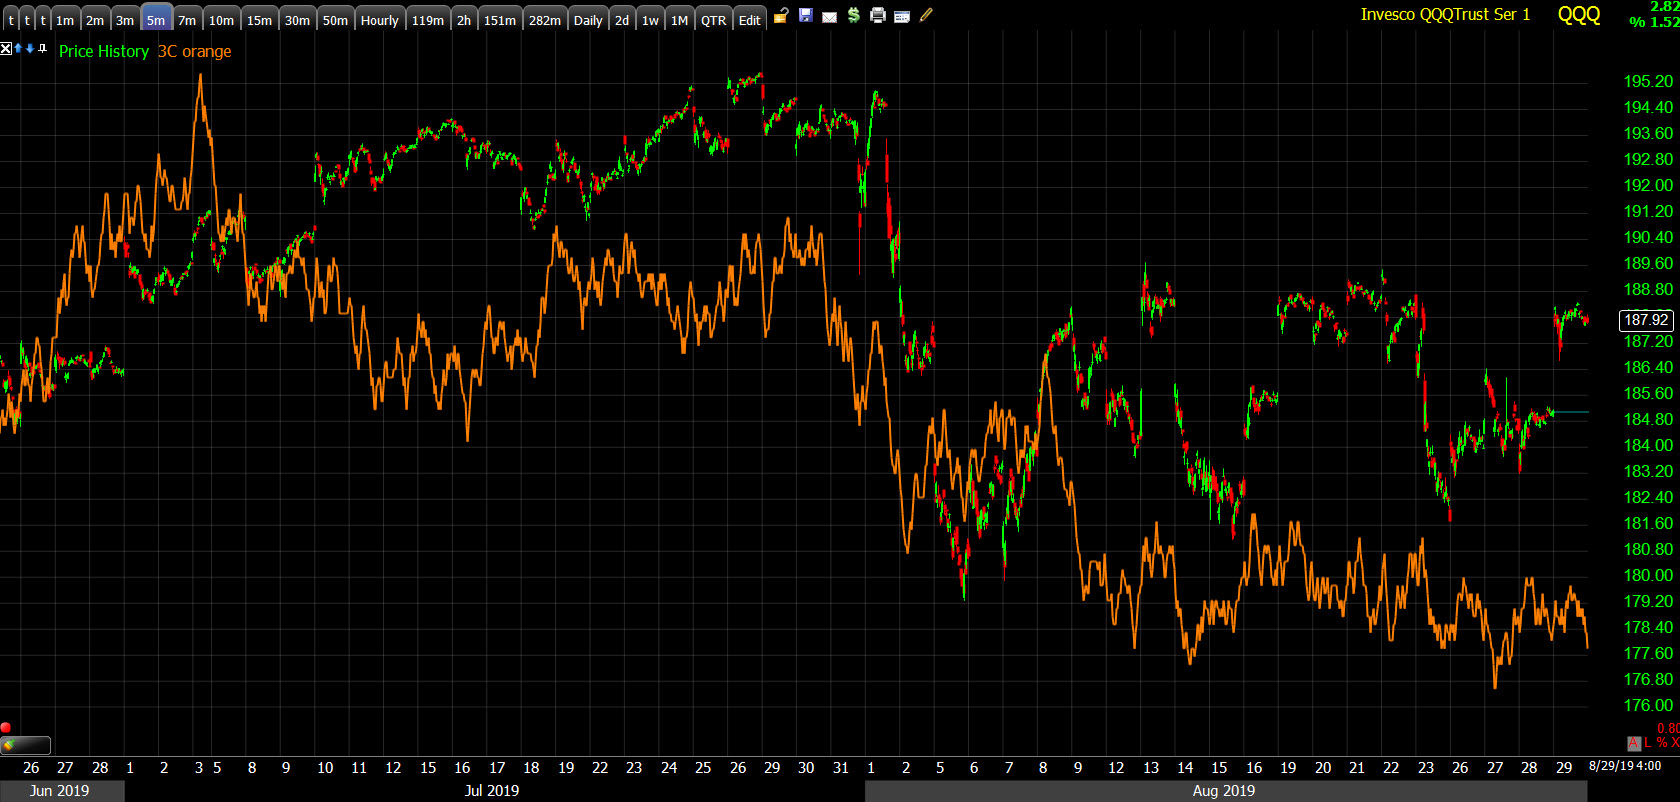
QQQ (5m)
There were no changes in trends for the major averages, S&P sectors, Treasuries, VVIX or gold.
Not much interest in safe havens today. The market didn’t seem too worried about risks heading into the last day of the week, last day of the month, and 3-day Labor Day weekend. U.S. markets will be closed Monday.
While there was little reaction to the Knot/ECB news today, Reuters reported last night that ECB policymaker Ewald Nowotny told a newspaper that the ECB should be ready to disappoint markets. There’s a little theme developing with the Fed and ECB. The market wants the Fed and ECB to be more aggressive in cutting rates and stimulating, and they are both resisting.
I’m still planning on adding to my new QQQ short, as long as QQQ is above $187, up to the 192 area – the top of the bear flag’s range. QQQ’s price was more enticing today than Wednesday for adding to the position, but the strong market signals like Tuesday morning were missing. Before the open it seemed like maybe they’d be there, but treasury yields quickly closed the morning’s divergence. If I see good signals tomorrow and a strong edge, I don’t mind adding in to a 3-day weekend, but there has to be a good reason. I’ll let you know as always.
There’s a hurricane barreling toward the east coast of Florida where I live. The stores and gas stations are already empty or have long lines. If the hurricane looks like a high probability strike, I may have to cut out tomorrow afternoon to get some supplies. I’ll let you know.
Overnight
S&P futures are down -0.1%. The 3C chart has moved pretty close to in line since some weakness this afternoon. Dow and Russell 2000 futures’ have better confirmation tonight than S&P and NASDAQ, that has been the case most of the day. Bulls still have the right of way.
VIX futures were hit hard on the China headlines coming the very same time VIX futures opened for trade. They’ve pulled it back together with a relative positive divergence this afternoon, but it’s not jumping off the charts like a leading divergence.
WTI Crude futures are down -0.1%. 3C has been in line since this afternoon’s consolidation under $56.90.
Yen futures saw a little buying interest at 3 p.m., but they and other safe haven assets are not in demand tonight. The only thing standing out is Nikkei 225 futures’ 3C chart is negatively diverging from price tonight.
Looking ahead, investors will receive Personal Income and Spending for July, the PCE Price Index for July, the Chicago PMI for August, and the final University of Michigan Consumer Sentiment report for August on Friday.