Daily Wrap – February 25, 2020
It may seem like there’s a lot to say on a day or week like this, but in truth all the hard work was the last few weeks before this sell-off happened, when the information was useful. The Nasdaq Composite (-2.8%) joined the S&P, Russell 2000 and Dow in turning negative for the year. The Dow wiped out 4 months of gains in the last few days and is down more than 5% YTD. Meanwhile, Gold is up over 7% YTD and Bonds (TLT) almost 12%.
Technical levels such as the NASDAQ’s 50-day moving average and S&P’s January 31st lows held briefly this morning as buyers started trying to buy the dip in the mega-cap tech names that were the focus of selling Monday. However, Small Caps led the broader market lower. As mentioned last night, Small Caps slightly better performance Monday was not a sign of improvement, it was simply the result of not having exposure to the mega-caps that took the brunt of selling Monday.
CDC officials warned that the spread of the coronavirus in the U.S. appears inevitable, but the HHS said the immediate risk is low. NEC Director Kudlow tried to ease nerves by telling CNBC that the U.S. has contained the virus “pretty close to air-tight,” but the market didn’t care much for optimistic views today. I believe the CDC warning was the reason why the domestically focused small caps led lower today, concern over the spread of the virus in the U.S.
MasterCard (MA -6.7%), United Airlines (UAL -6.5%), and Macy’s (M -5.5%) joined the growing list of U.S. companies to pull earnings guidance, of which many issued just weeks ago.
The market legged down more in the afternoon after Fed Vice Chair Clarida reiterated that it’s still too early to assess the growth impact from the coronavirus, or whether it will lead to a material change in its outlook. The market has been anticipating that the Fed take action, both in plunging yields, especially the short end the last 2 days, and Fed funds futures now pricing in 2.6 rates cuts in 2020 starting in April. Clarida’s comments were a little more dovish, but not what the market was hoping for. Maybe the Fed shouldn’t have blown through ammunition trying to bail out hedge funds caught in the repo crisis as stocks were at all-time highs. The bond market is taking rates down for them and the Fed may not have much room to respond via conventional rate cuts. The bond market is way ahead of them and that’s evidenced in the flattening yield curves. I’m guessing that the Fed thinks twice about tapering Repo and QE.
Over the last month, Bonds, currencies and commodities were screaming there was an insanely high risk of stocks doing just what they are doing this week, while buyers felt that stocks would never fall again with the Fed having their back. It “feels” to me like investors are still convinced that this is just a fluke and the Fed will ride to the rescue at any moment.
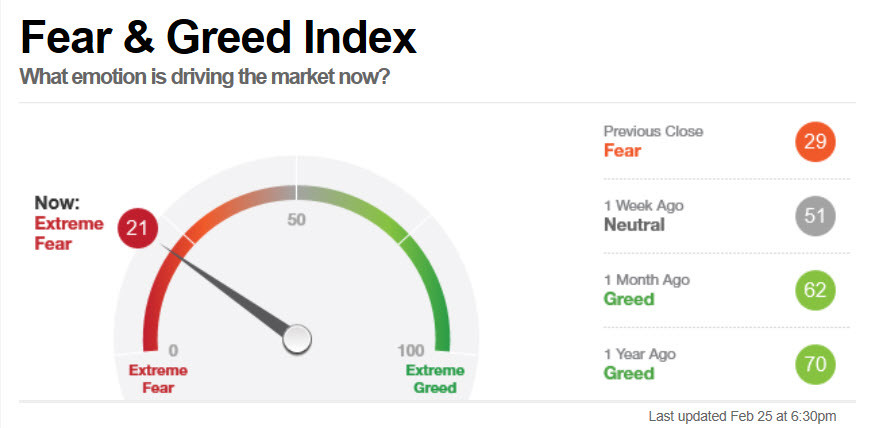
the Far and Greed index, however, has flipped. Remember this contrarian signal?
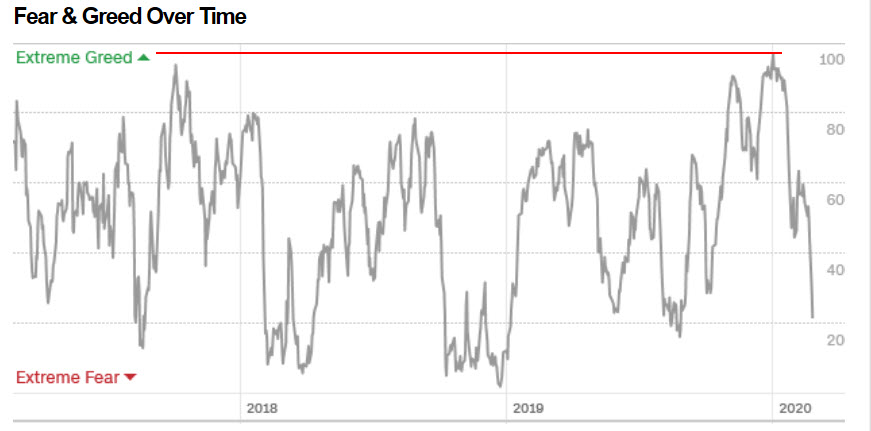 CNN’s Fear and Greed index was pegged at extreme greed, the highest level in years…
What a difference a week makes…
The market has not been trading on improving growth, earnings or fundamentals, but rather multiple expansion, investors willing to pay more for less, due to the Fed essentially de-valuing money by flooding financial markets with it. Talk about moral hazard.
Averages
S&P 500 ⇩ -3.03 %
NASDAQ ⇩ -2.70 %
DOW JONES ⇩ -3.15 %
RUSSELL 2000 ⇩ -3.45 %
Noruma’s quants identified the S&P’s $3215 level as a trigger level for CTAs to de-leverage and that’s exactly what today’s trade looks like, systematic and methodical – not panicky and emotional – de-leveraging.
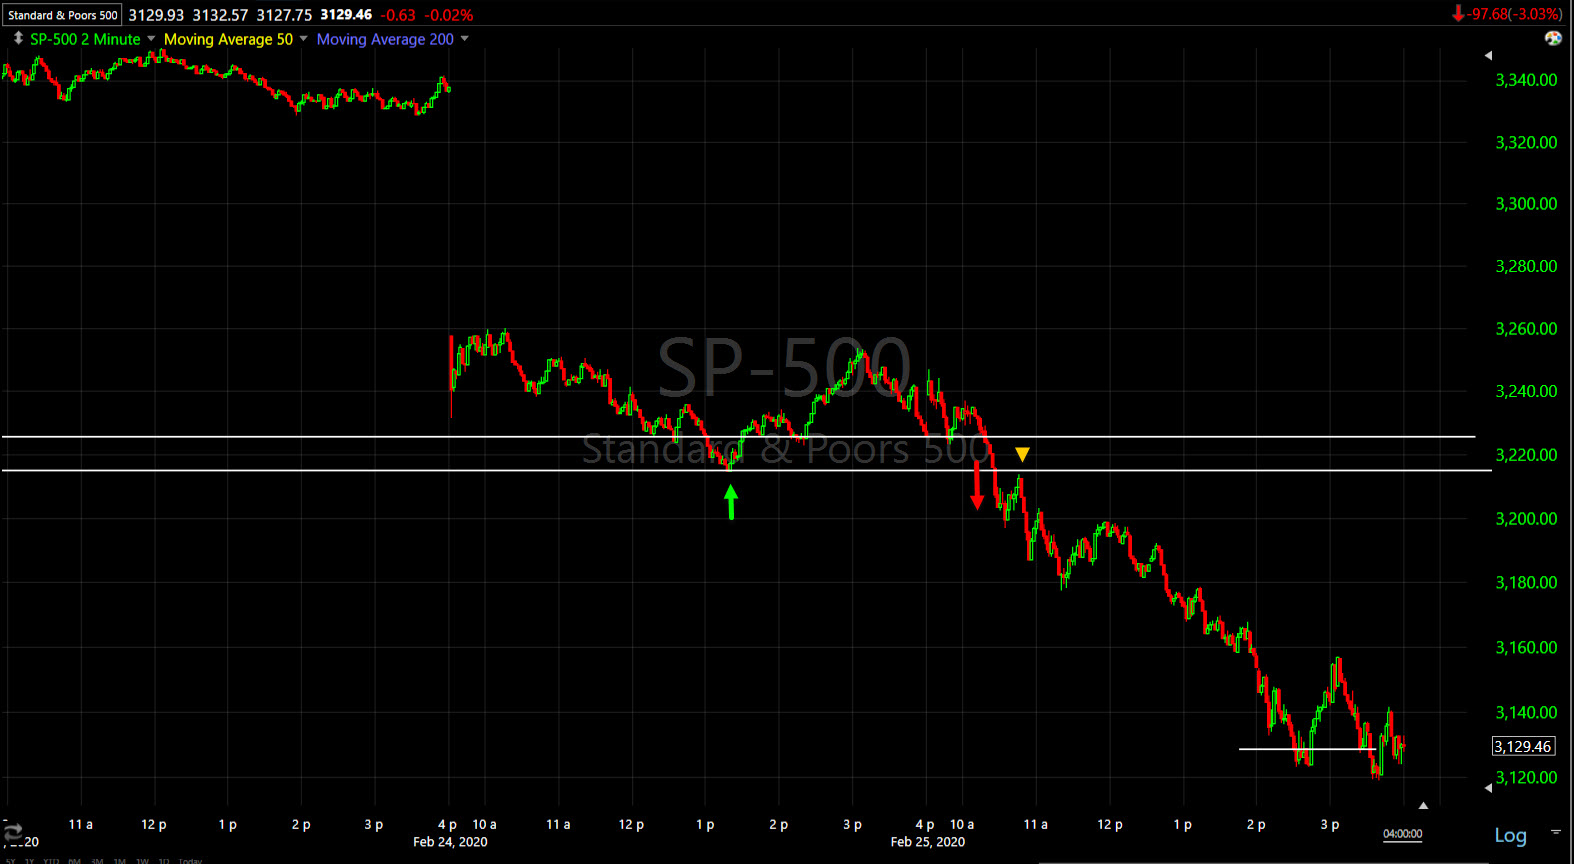
S&P 500 (2m) held the Jan. 31st low Monday which was the level identified, but fell below shortly after the open, back-tested it once (yellow arrow) and marched lower the rest of the day. While initial sell-offs are very volatile, bear markets are pretty dull, typically falling slow and steady on low volume, rather than big waterfall sell-offs most traders expect.
The small trend line at $3128 is another level they’ve identified as a de-leveraging point if the level is broken. Unfortunately these are complex models and change hourly, but as you can see the S&P closed right at it so it seems to have some validity.
Technical and psychological (potential) support levels have been little more than a speed bump.
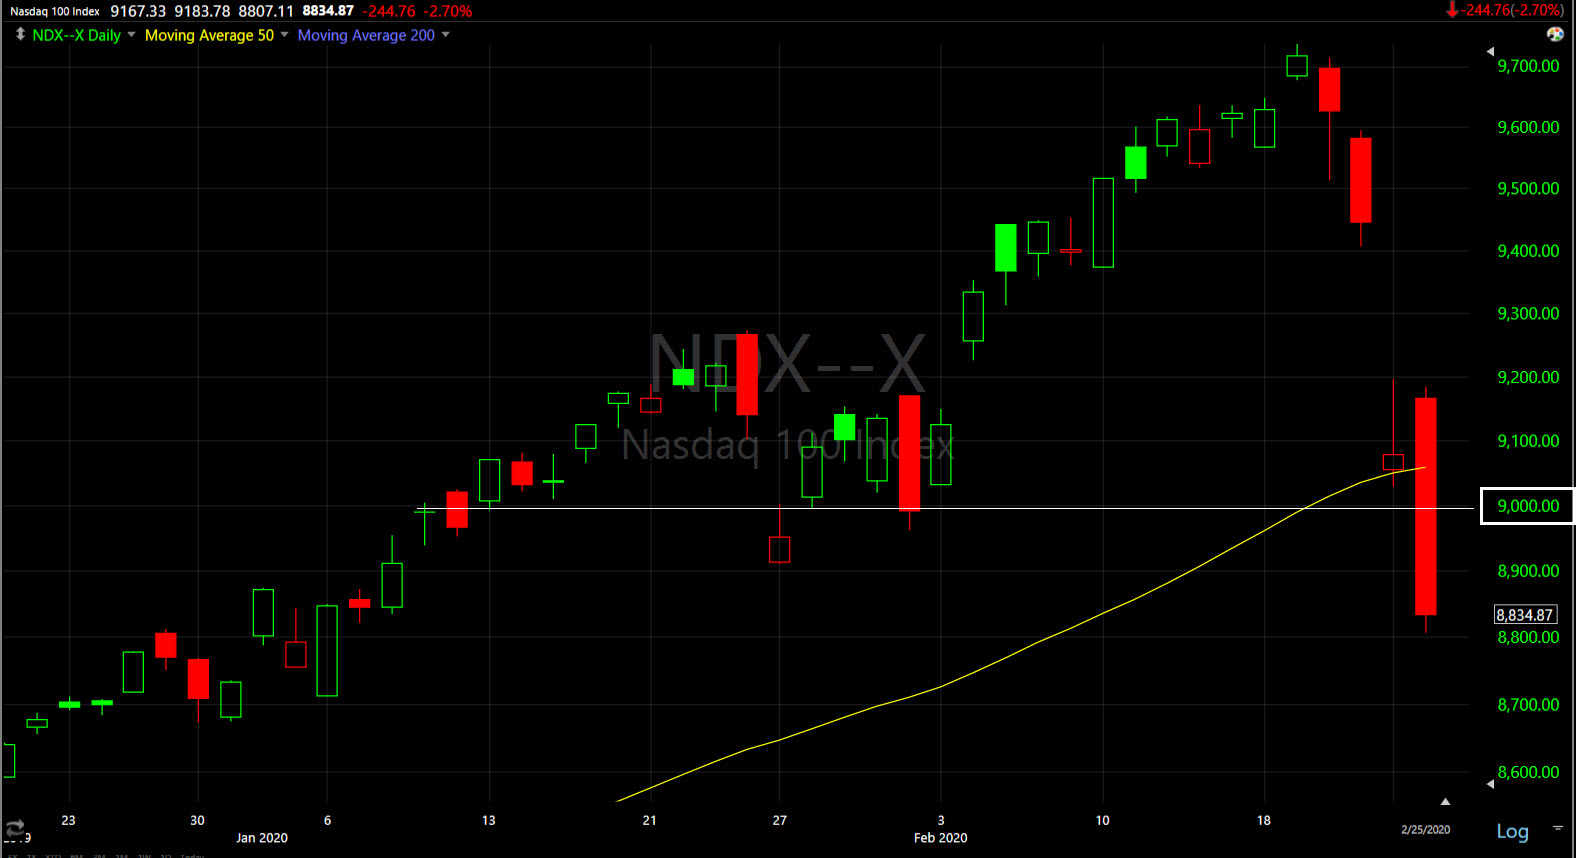
NASDAQ 100 (daily) held its 50-day moving average Monday, then sliced through it today, as well as the $9000 (psychological and tested technical support) level.
Of note, the Dow and Small Caps are in the area (a little below) their 200-day moving averages so it will be interesting to see what they do here.
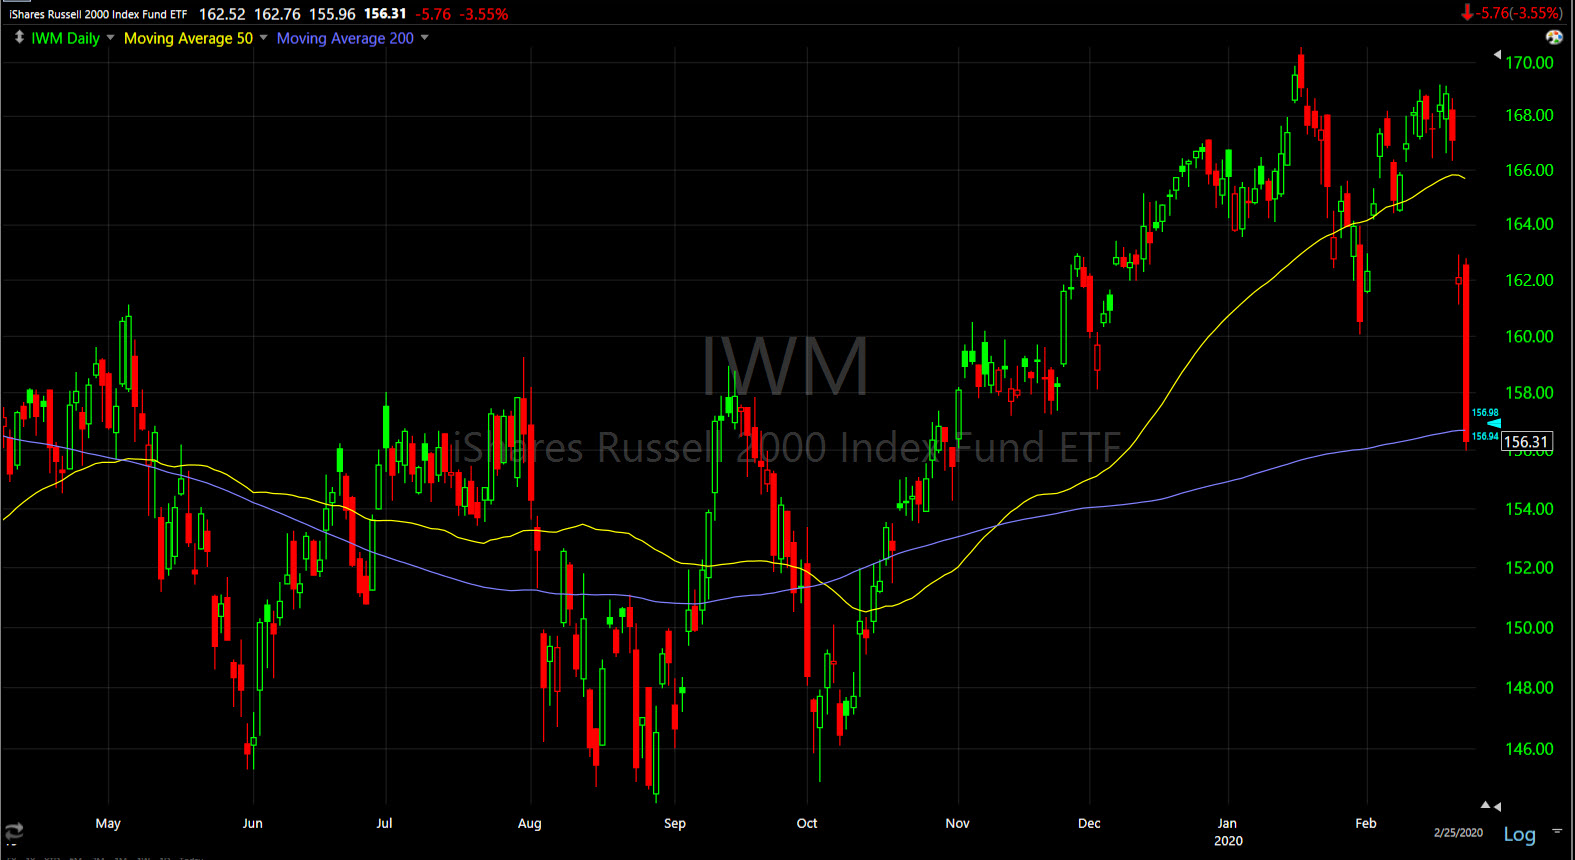 IWM (daily)
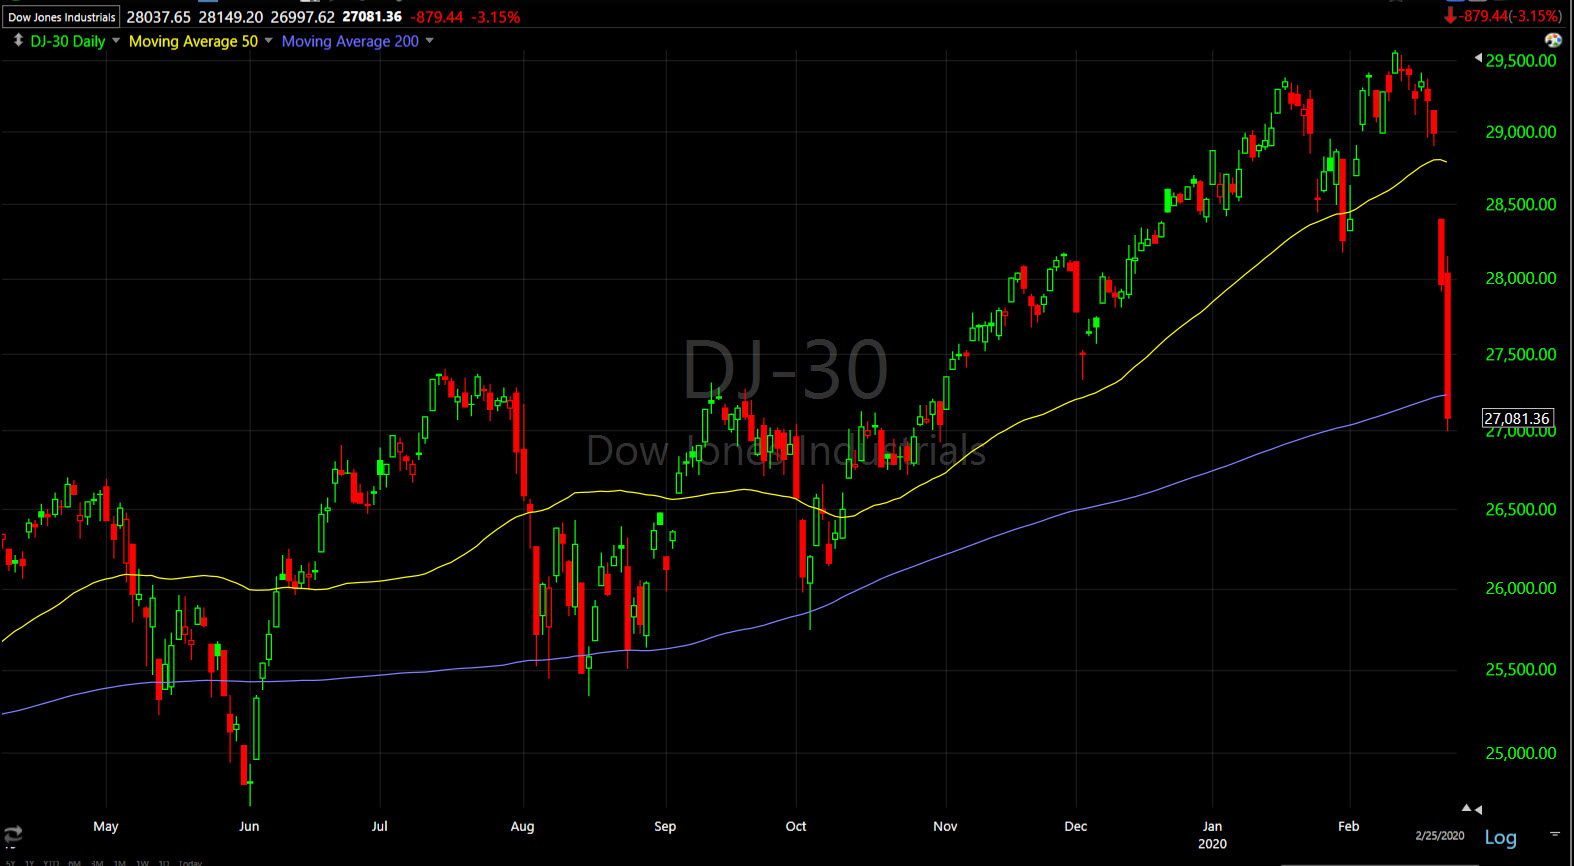 Dow (daily)
While I have been pointing out just how disconnected stocks have been from the reality reflected by just about every other major asset class over the last month, the speed and extent of the decline in stocks has surprised even me, and I still don’t think stocks have caught down to the other asset classes’ reality yet. Typically prices consolidate after a very strong and impulsive decline, then decline a second time. This week it has been shoot first, ask questions later.
Volatility
VIX traded most of the first half of the day unchanged as the S&P was down 1%, evidence that the selling had a less panicky feel, but during the afternoon as stocks continued dropping, VIX gained and closed up +11.25% to the highest level since the 20% S&P plunge in December 2018. Volatility seems to have undergone a regime change as mentioned last night. I suspect higher volatility levels (more volatile price action up and down) is here to stay for a while. You might keep that in mind when managing position sizes and risk. I prefer wider stops and use smaller position sizes to accommodate them. Heightened price volatility makes up for the smaller position sizes (long and short).
VVIX is well into the red alert zone (above 110-115) at $121, also the highest in more than a year, since the late 2018 market melt-down.
S&P sectors
All 11 S&P 500 sectors finished with steep losses ranging from 1.8% (Consumer Staples) to 4.3% (Energy)- sell first and ask questions later. While still being dumped, the 3 defensive sectors have the smallest losses.
Materials ⇩ -4.31 %
Energy ⇩ -4.42 %
Financials ⇩ -3.39 %
Industrial ⇩ -4.08 %
Technology ⇩ -3.20 %
Consumer Staples ⇩ -1.80 %
Utilities ⇩ -2.10 %
Health Care ⇩ -3.03 %
Consumer Discretionary ⇩ -2.67 %
Real Estate ⇩ -2.51 %
Communications ⇩ -2.67 %
Dow Industrials (daily) blew right through the 50-day and 200-day.
Banks were thrashed…
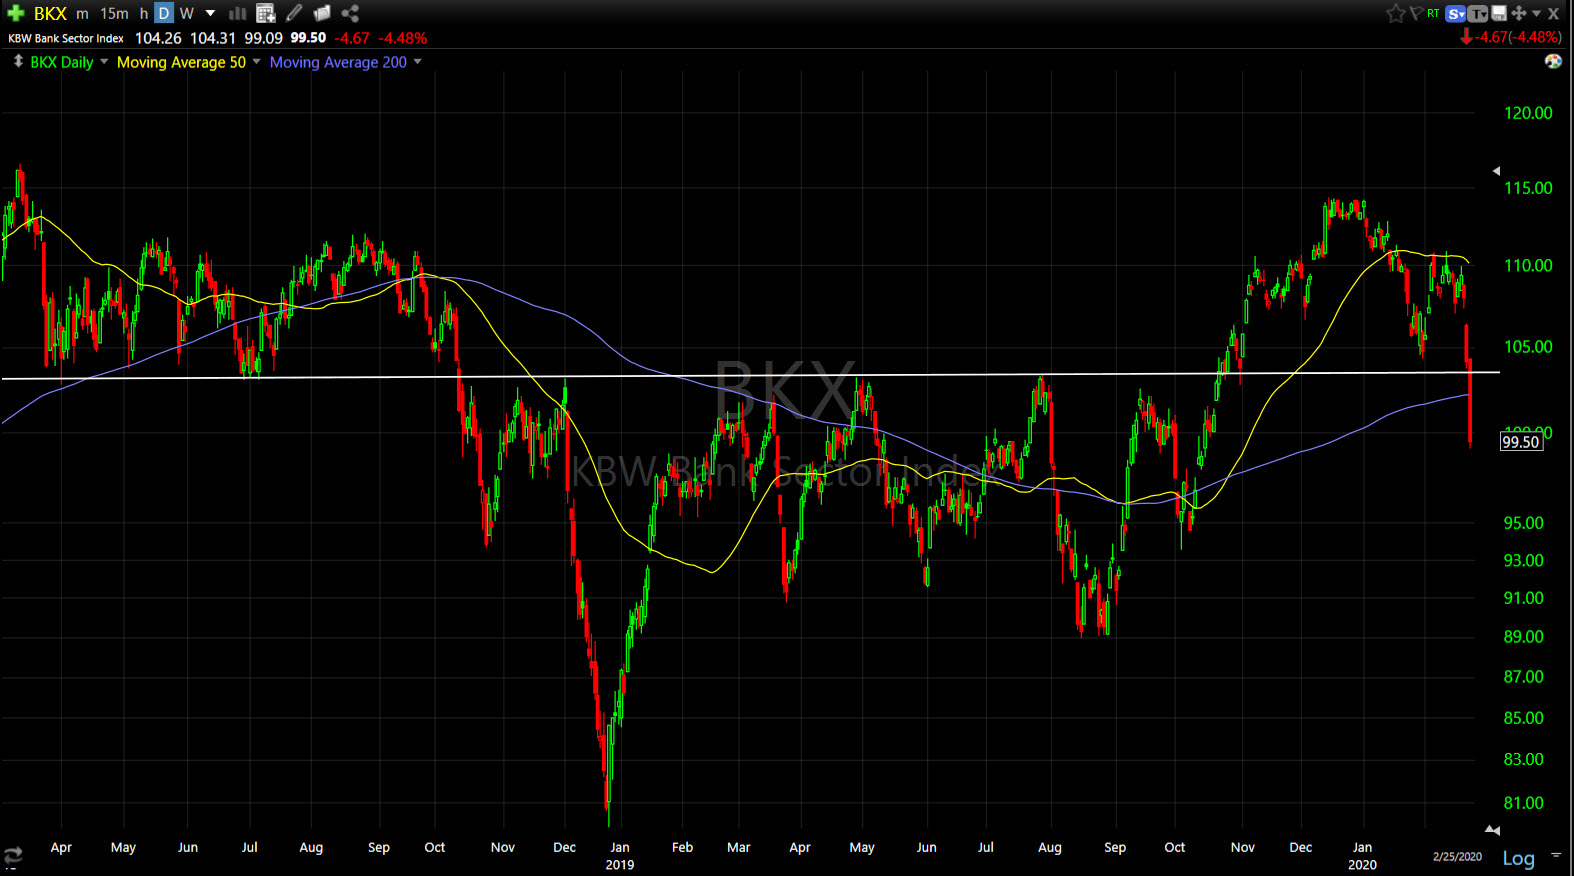
KBW Bank Index (daily) sliced right through its 50-day and 200-day, but more importantly through what was a strong support level (former resistance) around $103.50. Remember that yield curves have been flattening, which tends to lead Banks/Financials, and the more sensitive Regional Banks have under-performed.
Once again Transports were one of the worst performing groups after holding above support at the end of last week.
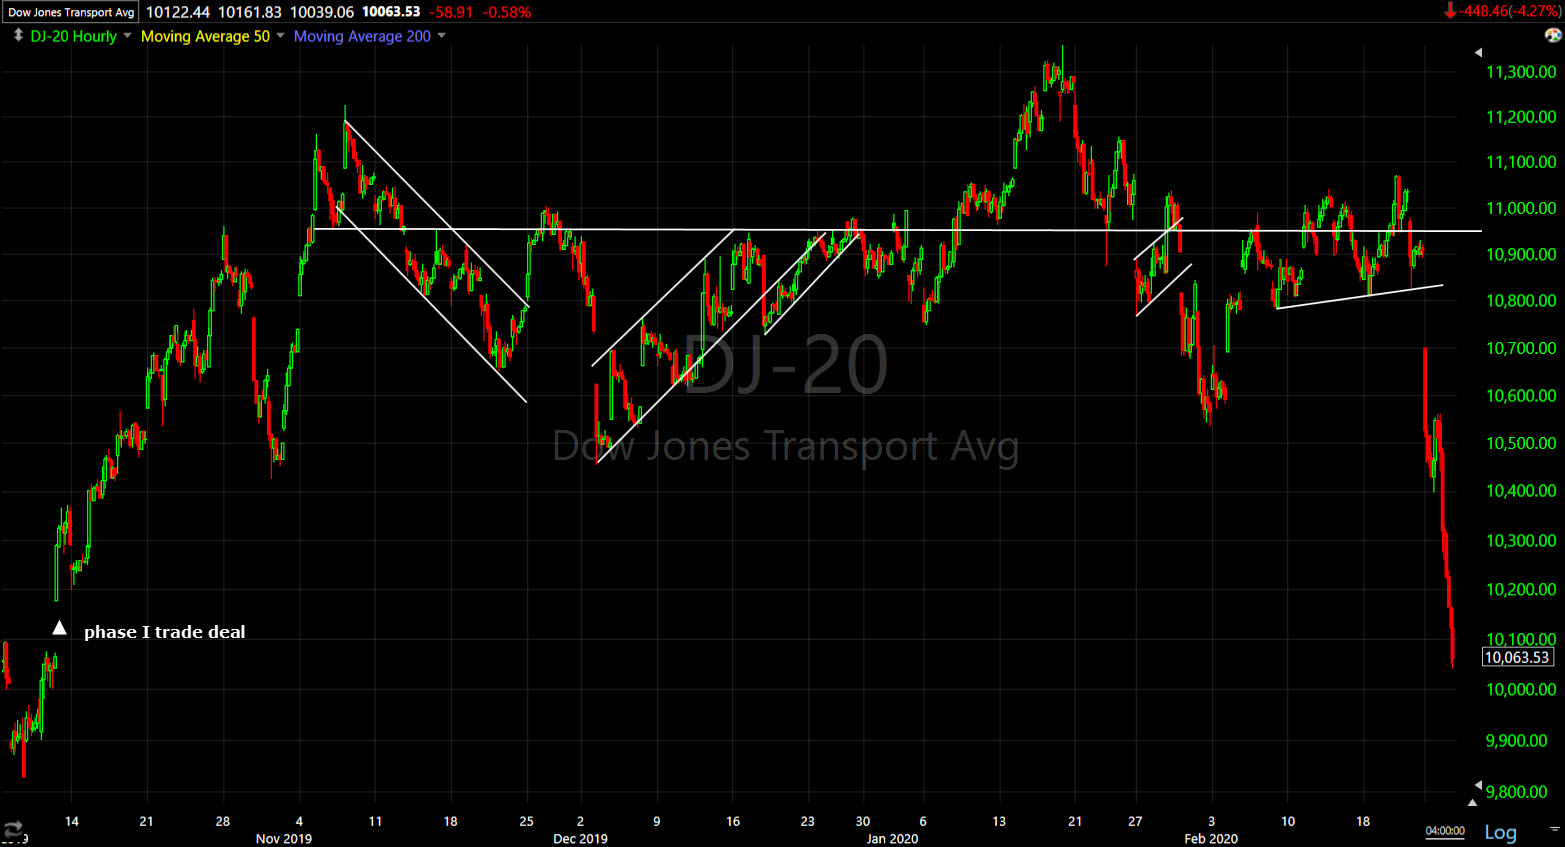
Dow Transport (60m) briefly held at the second leg down target from late January at 10,400, then plunged lower. While there’s not any exact relationship, the 30-year yield blew through the trade deal lows from October last week. Now Transports have erased virtually all gains since the trade deal and did so in 2 days.
The weakness in the Energy sector should have caught investors attention as a red flag for the economic growth outlook long ago, and it still should.
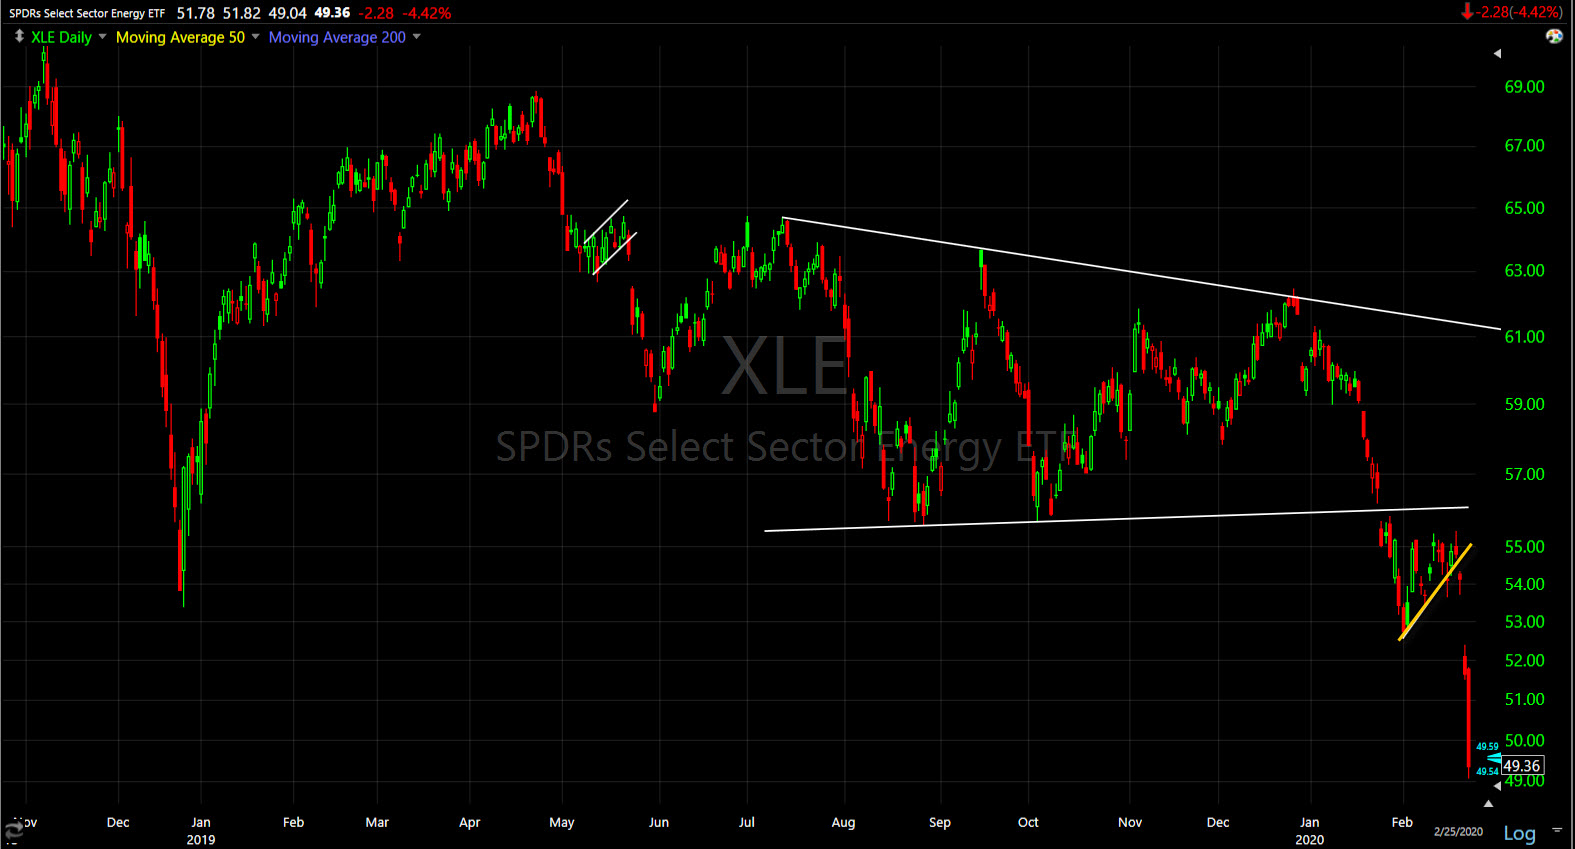
Energy sector (daily) the first plunge on the virus should have been a major red flag. Any S&P sector trading near multi-year lows should have been a red flag.
The bounce/consolidation (yellow) in February did nothing to change the bearish outlook. The sector is at the lowest level since 2010. The first leg down was about 12%, which would put a measured move target somewhere around $48, approximately 2.75% lower. That’s a stunning move for an entire sector.
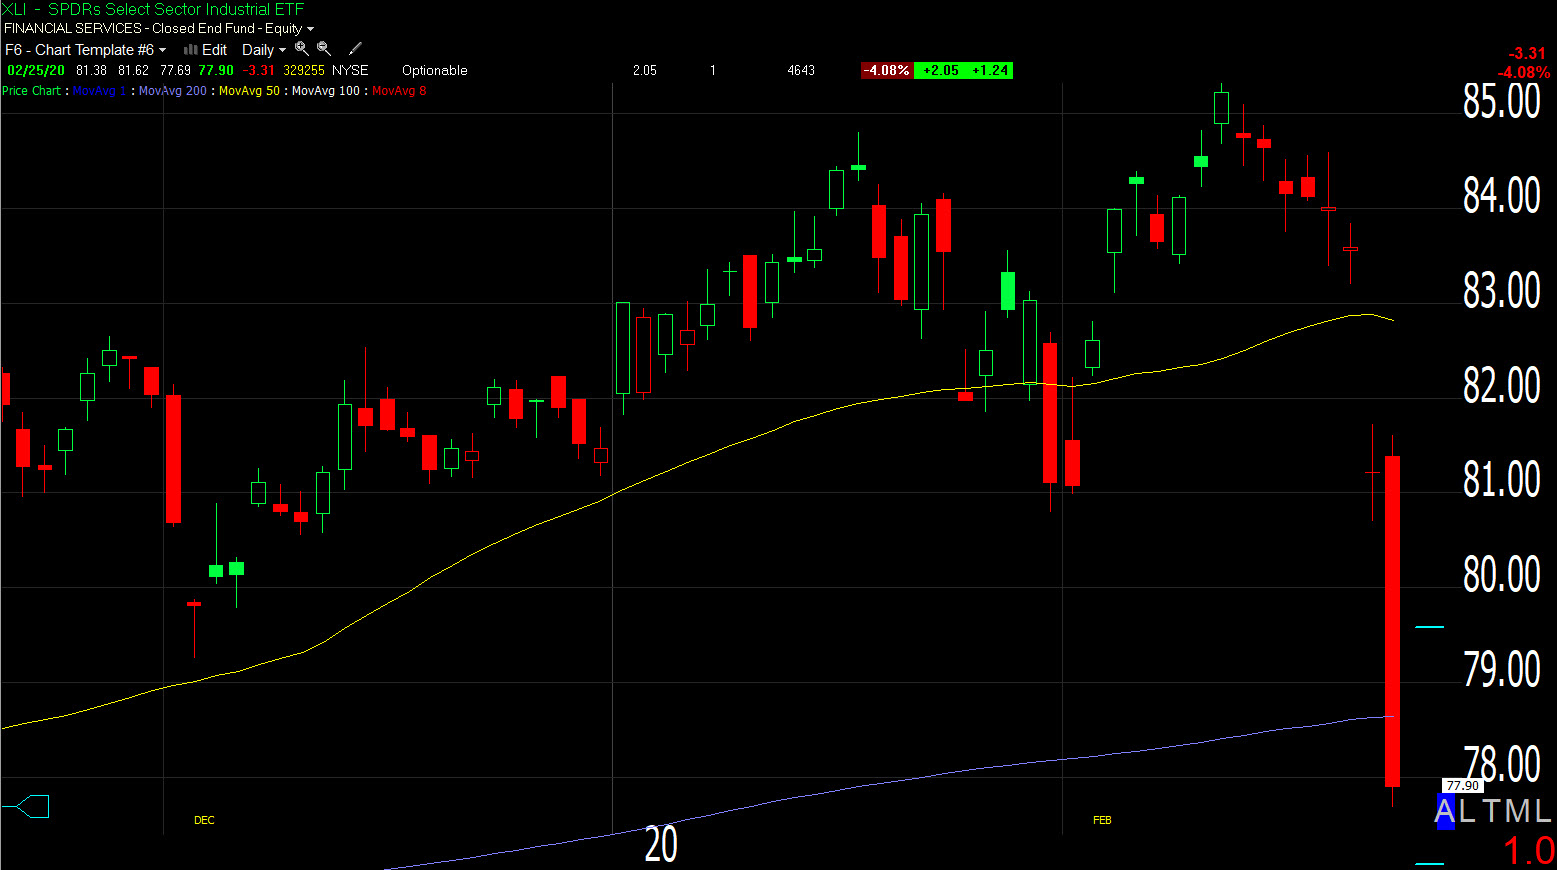
I bought some long exposure to the market in the Financial sector (XLF March 20, $29 calls) earlier today. I posted charts with my reasoning earlier today here. XLF tested down to, and closed just above its 200-day moving average, and just below $29.
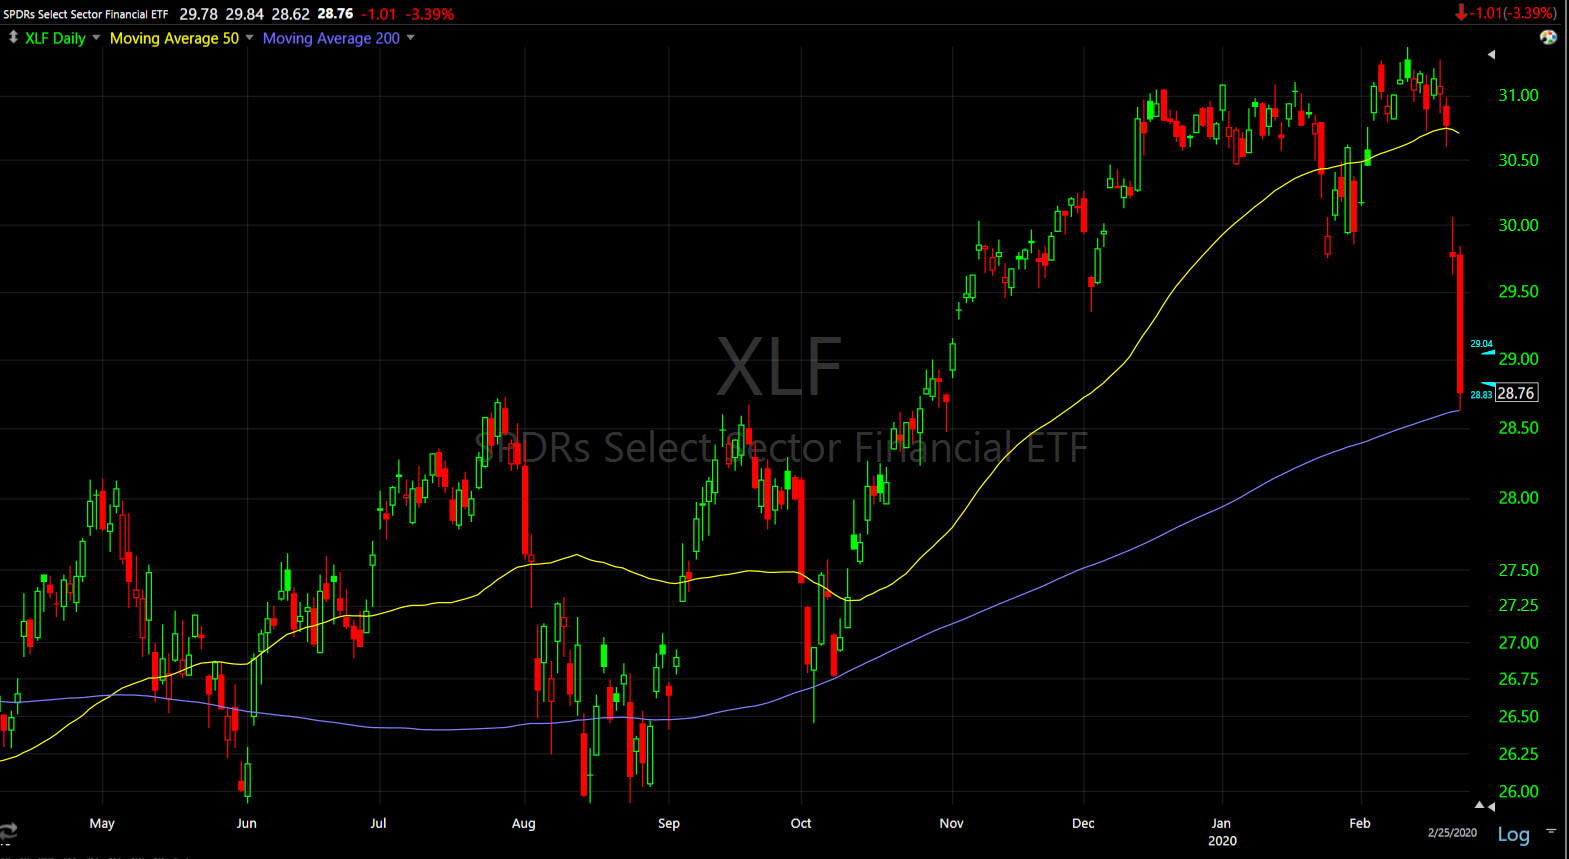 XLF (Daily)
If I see more probabilities building for a market bounce/correction, and Financials look set to benefit, I’ll add to the position. I have just about a month on the contracts. I’m only looking for a bounce, but in environments with increased volatility like this, that bounce could be spectacular.
Internals
Internals are once again extremely lopsided reflecting just how intense the sell-off has been. Decliners (2538) are more than 9:1 over advancers (278) on increasing downside volume of 1.4 bln. shares.
The Dominant price/volume relationship of component stocks in the major averages looks almost the exact same as yesterday, I even updated it again to make sure. It’s an overwhelming relationship of Close Down/Volume Up, which is typical of a short-term selling climax. For a second day internals reflect just about the most extreme 1-day oversold condition I can remember.
One of the reasons the sell-off is so sharp, in my opinion and this is an opinion I’ve shared many times over the last month, is because market breadth has been horrible with only a handful of very heavily weighted mega caps (FAANGs or MAGA stocks) driving the major averages higher with their disproportionate weighting.
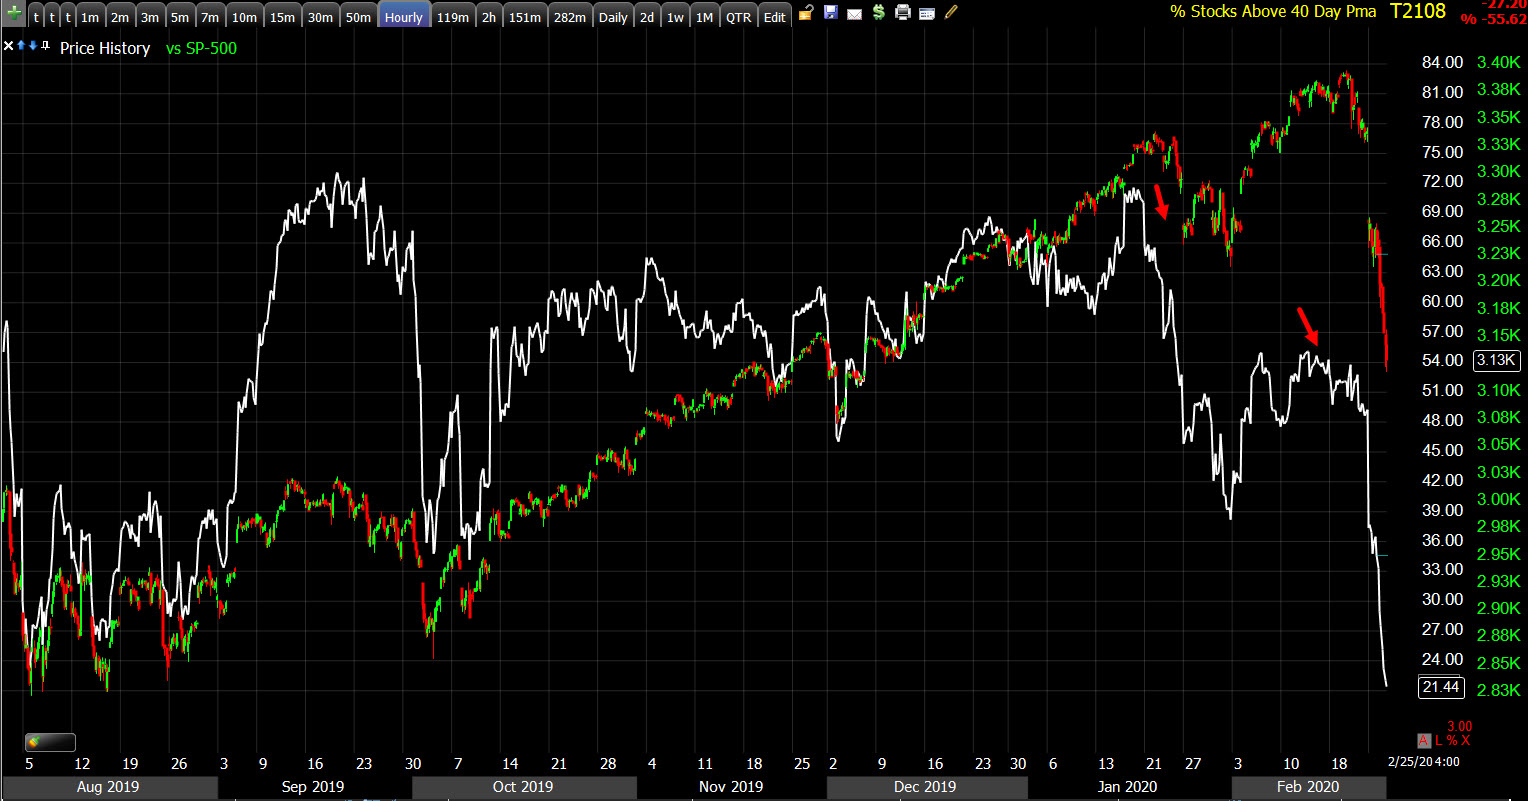 S&P-500 (60m) and the percentage of NYSE stocks above their 40-day moving averages. Breadth, which has not been great on the advance from September’s low, deteriorated before the late January decline, and was magnitudes worse on the rebound to recent new highs.
Another takeaway from the chart above is that when the percentage has dropped below say 30, the market has been pretty oversold.
That oversold reading is reflected on many breadth charts, surprisingly after only 2 days.
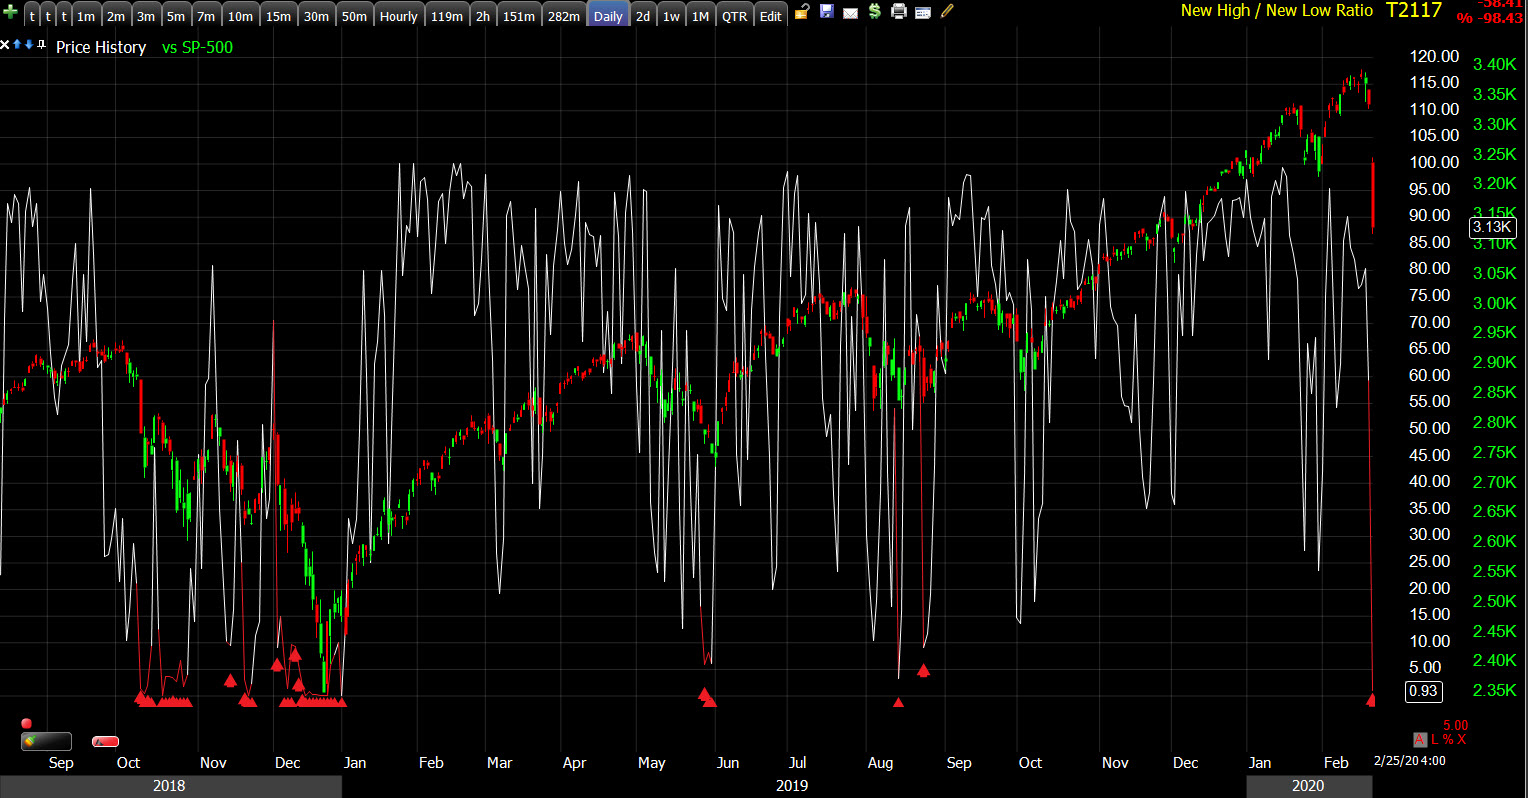
SP-500 (daily) and the NYSE New high/New Low ratio. I’ve highlighted instances it crossed below 10. However, it crossed below and stayed below 10 for 2 weeks in late December 2018. Just as the market can stay overbought an unreasonable amount of time, it can also stay oversold. I do NOT see the same kind of absolute bidless market we saw in December 2018, although it may appear that way now. Credit market s also shut down, not pricing a single issue for over 40 days. In my opinion it wasn’t the market sell-off that caused the Fed to flip flop 2 weeks later, it was the credit market shutting down.
Treasuries
The 2-year yield fell six basis points to 1.20%, and the 10-year yield fell five basis points 1.33% after setting a record low at 1.31%. The 30-year fell 3 basis points- curve steepening for a second day, which figured into my decision to buy some long Financial exposure.
The 30-year yield breaking the psychological 2% level last Friday, at an all time low while stocks were just off an all-time high, was one of the most obscene signals last week and was a big deal. Stocks have been a 1-way street lower since. The 30-year yield now trades 20 basis points lower and TLT is at an all-time record high. The 10-year yield also made a new all time record low 1.3055%. The market isn’t waiting on the Fed to take rates down, it’s doing it for them.
The 5-30 year yield spread has been steepening, in fact everything (above 5y) has been steepening against the 5 year. However, the Fed’s most reliable yield curve to indicate probabilities of recession, the 3 month-10-year, continues flattening into inversion.
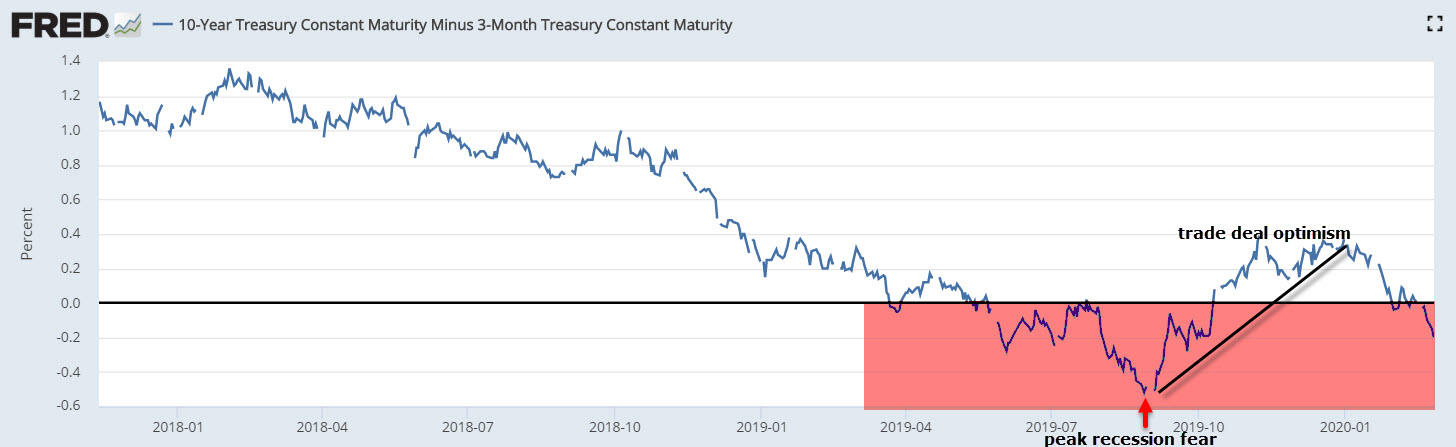
3m-10y spread- this trend from peak recession fear August/September 2019, to a bounce to a lower high on trade deal optimism, and a break of that 4-month trend into 2020, is seen everywhere from treasury yields to commodity currencies like AUD/USD, to commodities like Crude and copper. The warning signals were there at the start of January, but the trend started turning mid-December immediately after the details of the much anticipated (and apparently underwhelming) trade deal were released.
Currencies and Commodities
The U.S. Dollar Index fell 0.4% to 98.96. The Dollar, which was on a tear higher as global funds flowed to the U.S. as a hideout from the virus, seems to be down the last several days as the U.S. looks increasingly susceptible to an outbreak.
WTI crude closed the session down -2.7% at $49.89/bbl., below the $50.50 area of interest, but still above the early February low of $49.31. I’m watching both crude and copper closely because if they break last month’s lows, they’ll be pricing an even more negative economic impact. Yields have made that lower low so it wouldn’t be surprising for crude and copper to follow in coming days/weeks.
In the 2018 peak growth/downturn, crude lost double (42%) that of the S&P (20%). Crude’s Jan-Feb 2020 decline is just over 20% while the S&P is near -7.7% for this leg. Unfortunately the Fed’s balance sheet expansion which has inflated stock prices, has made it much more difficult to directly compare asset classes, but this may offer some context…
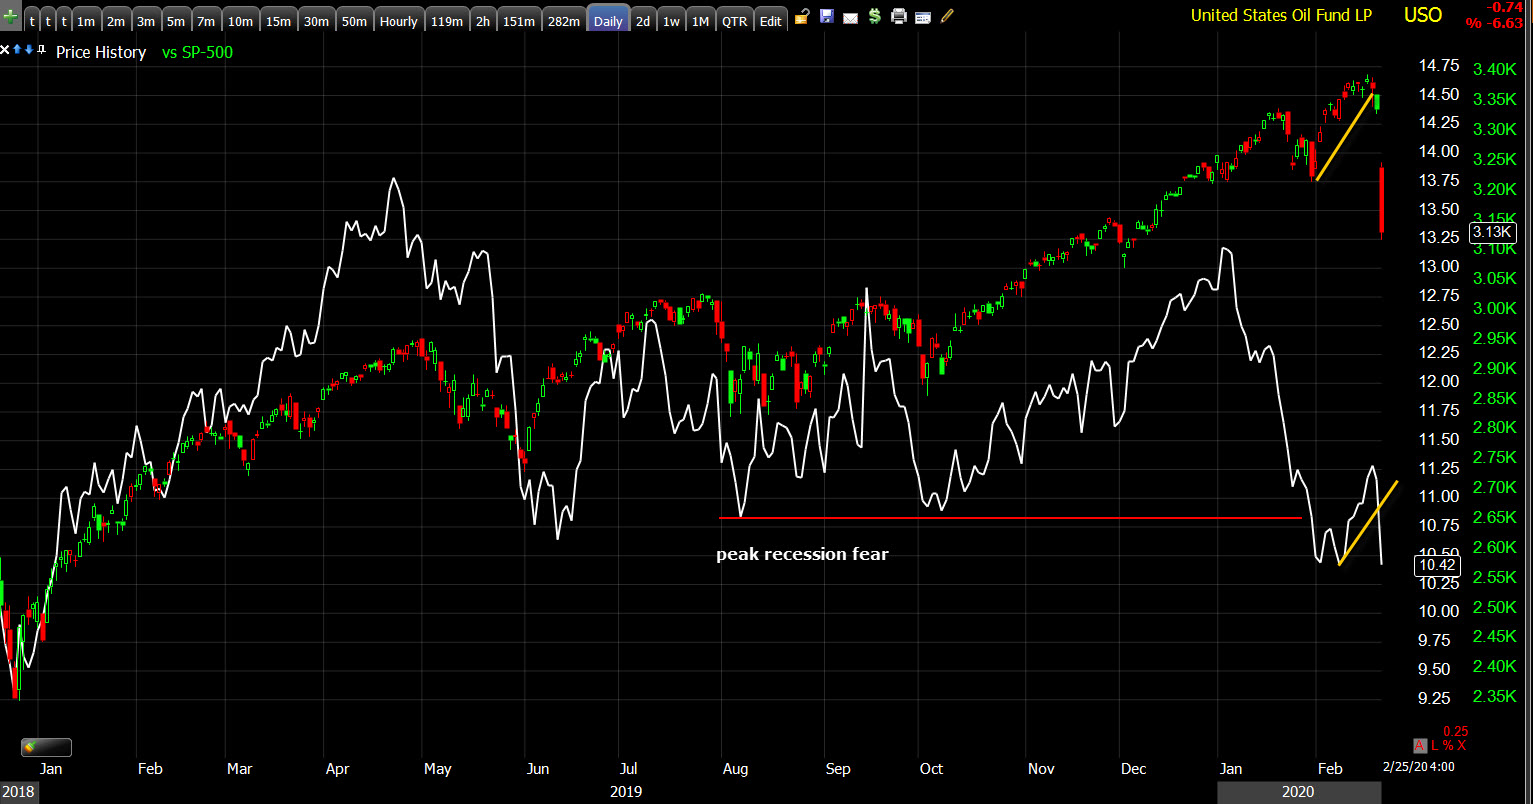
SP-500 and USO/Crude (white), Crude is just below the August/September peak recession fear levels. The S&P is still well above those levels. Copper’s picture is similar, and the 30-year yields is even more extreme as it crossed below peak recession fear levels last week and trades at record lows.
Gold futures settled lower by -1.6% to $1,650.00/oz. Gold fell just shy of my $1700 target level yesterday. I’m not sure what the selling Monday afternoon was about. Some think it was related to profit taking in gold to cover margin calls in stocks, some think it is the BIS (the central banks’ central bank) selling gold. The U.S. cash close saw more selling in the safe-haven asset. However, recall that gold got a head start on this move by a week, breaking out last Tuesday, which was among the numerous signals that were screaming trouble ahead for stocks last week. I’ll update Gold as the chart develops. Its medium term and long term charts are excellent and I don’t expect that will change.
Summary
Forget about consolidation and a second leg lower, the market was in liquidation mode, sell first, ask questions later. When volatility suppression, that commonly accompanies central bank intervention, breaks, prices sing and I give more weight to price action than technical indicators. That said, there are some price trends in the area that are worth noting, and the market is short term oversold by many measures.
Here are the 3C charts…
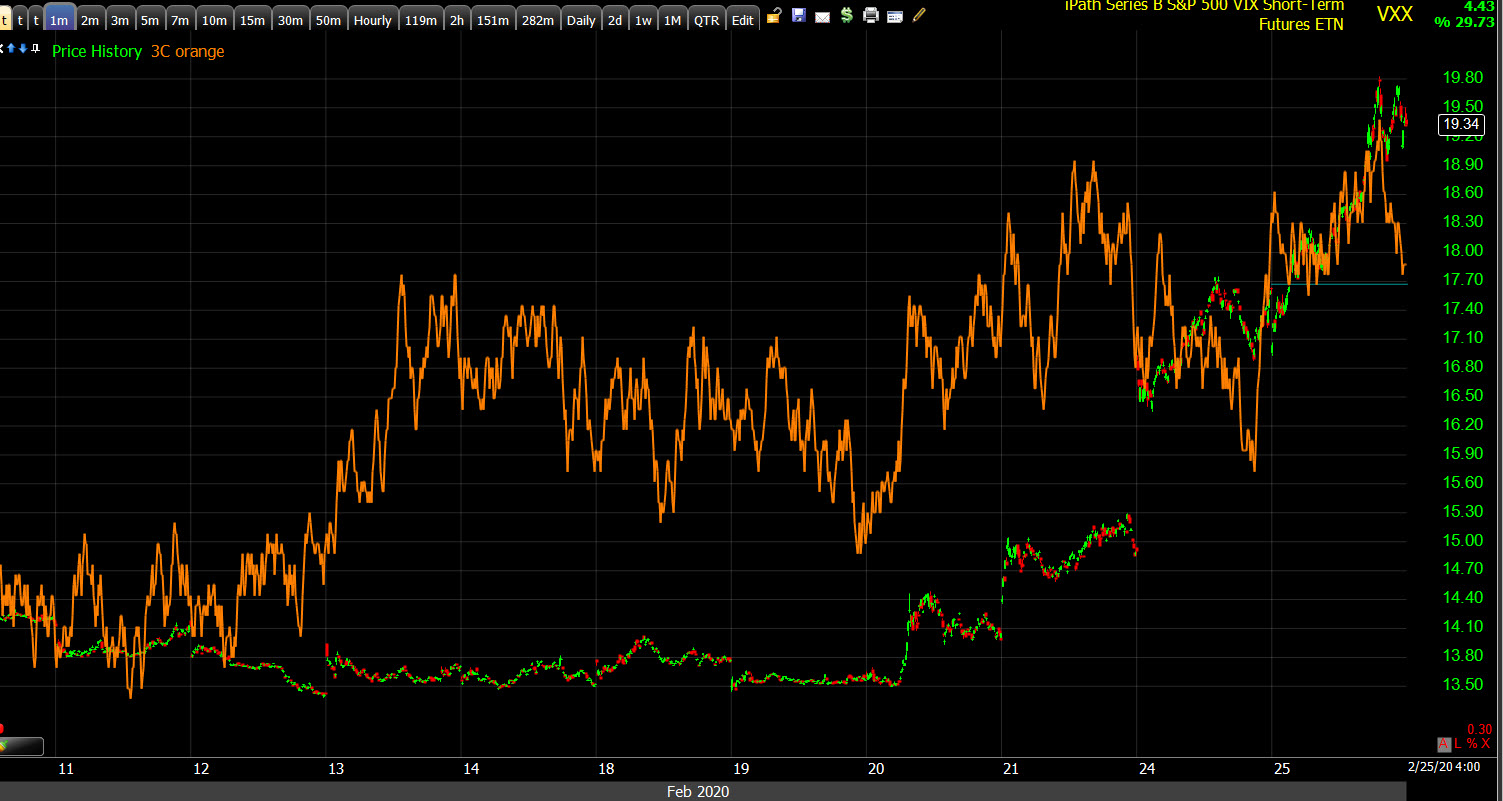
VXX (1m) interestingly it positively diverged around Feb. 12th. 3C is still confirming price gains.
Small Caps’s 3C chart was the first of the major averages (Small caps tend to lead the broader market) to negatively diverge from price just a couple of days after VXX positively diverged.
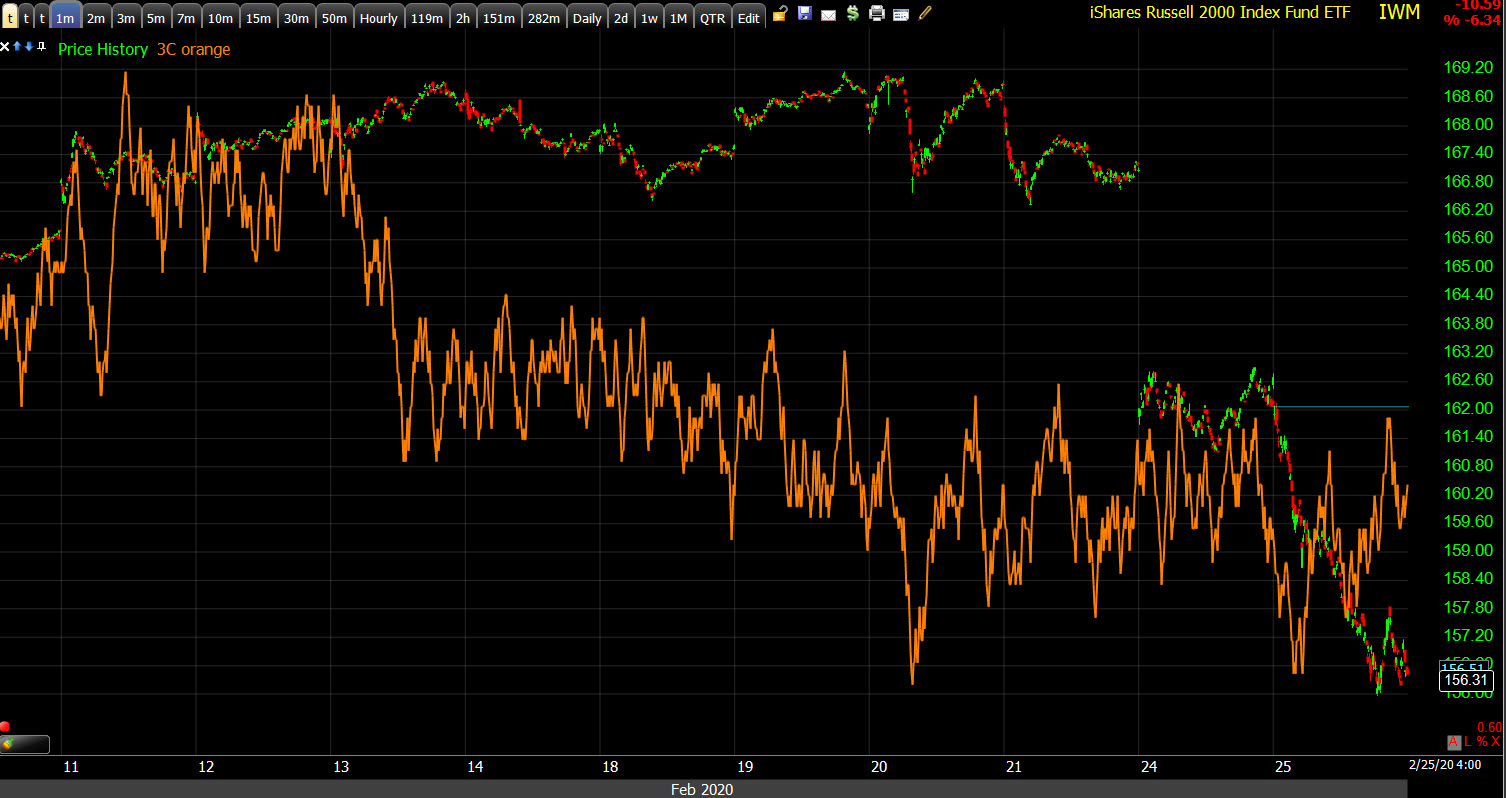
IWM (1m) neg. diverging around the 13th. The chart isn’t showing high probabilities of a low, but it’s not leading lower like it was.
The other major averages 3C charts followed in IWM’s footsteps.
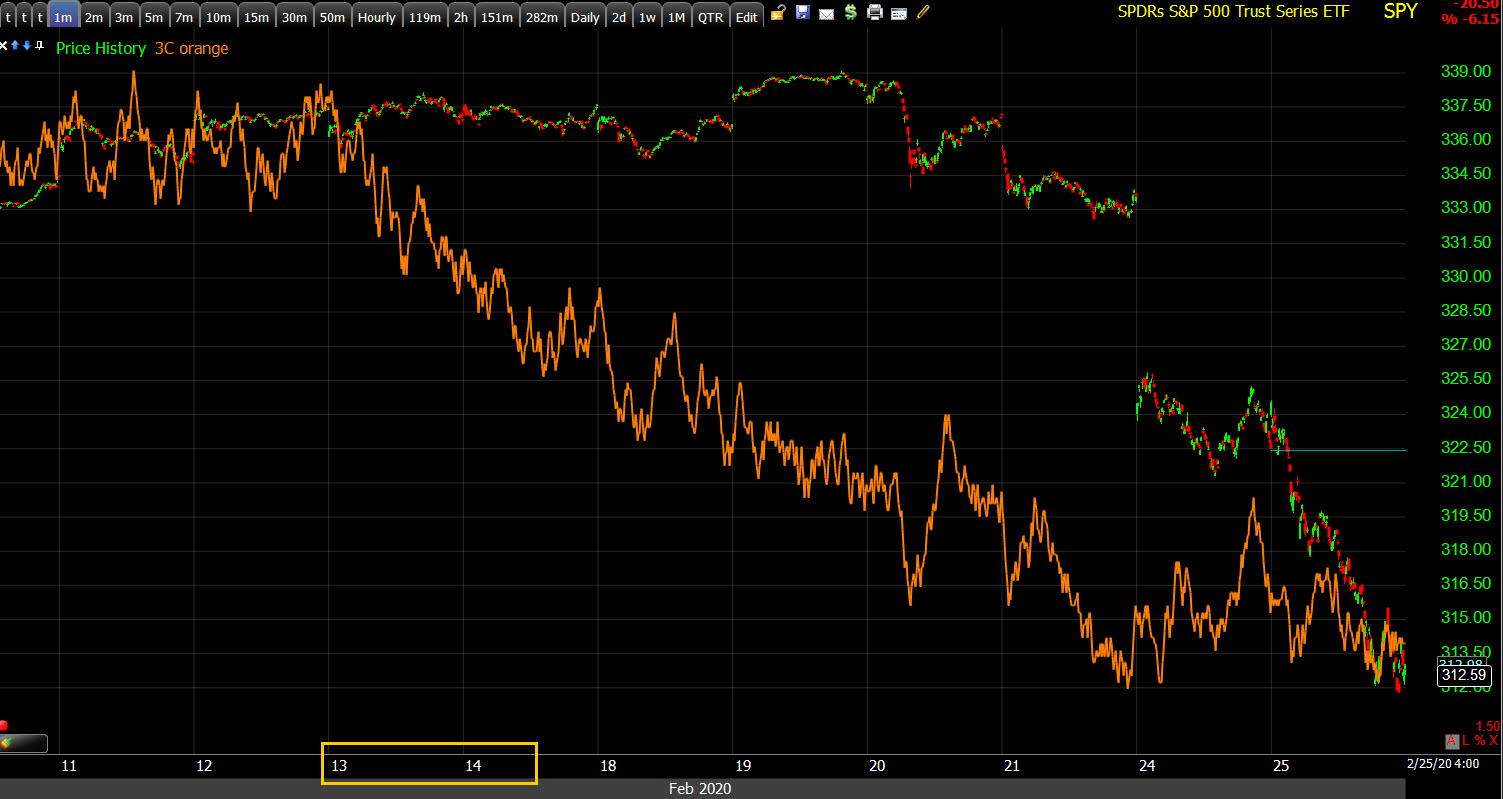 SPY (1m)
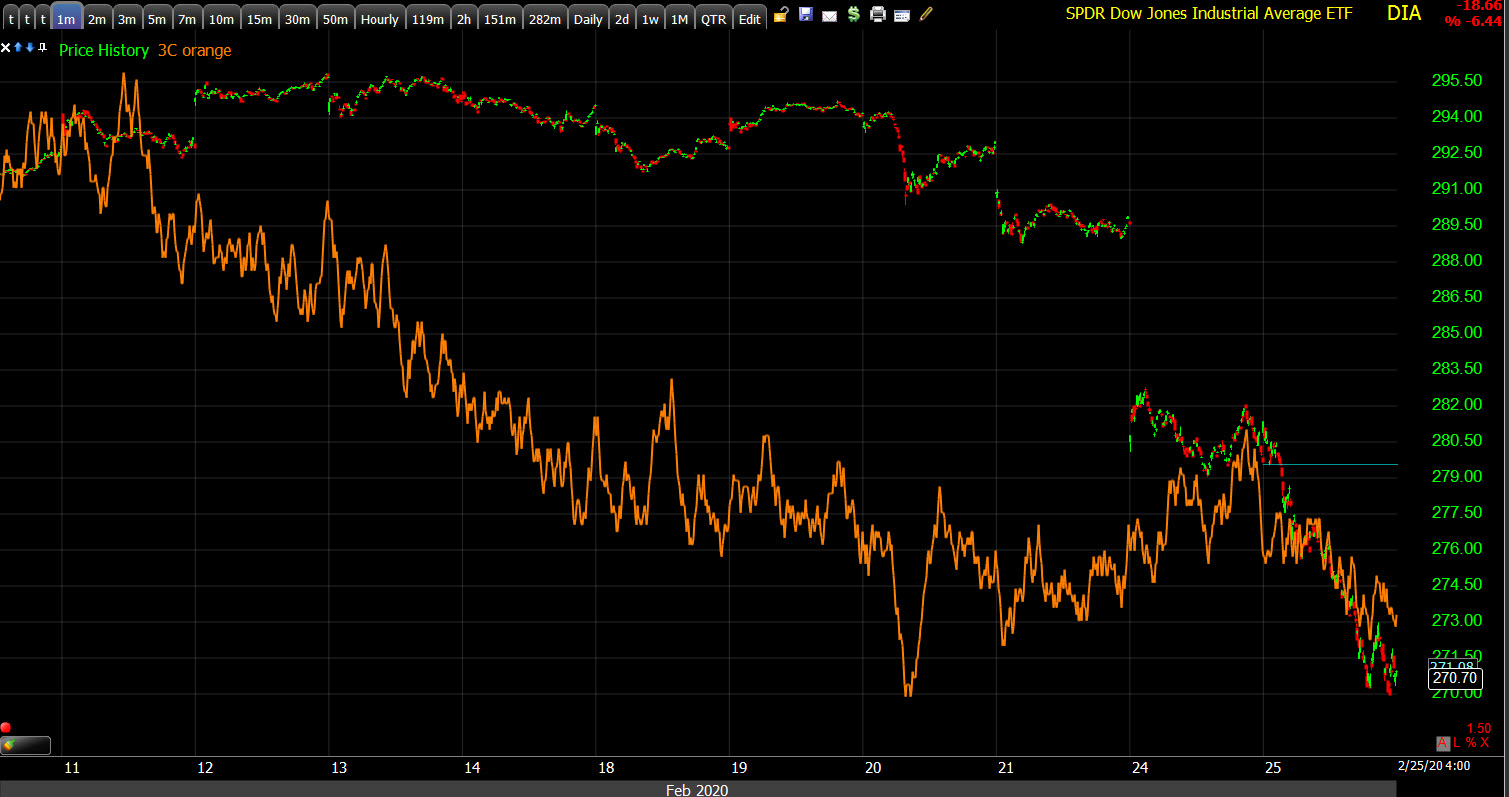 DIA (1m) 3C looked better Monday for a potential short term low and consolidation.
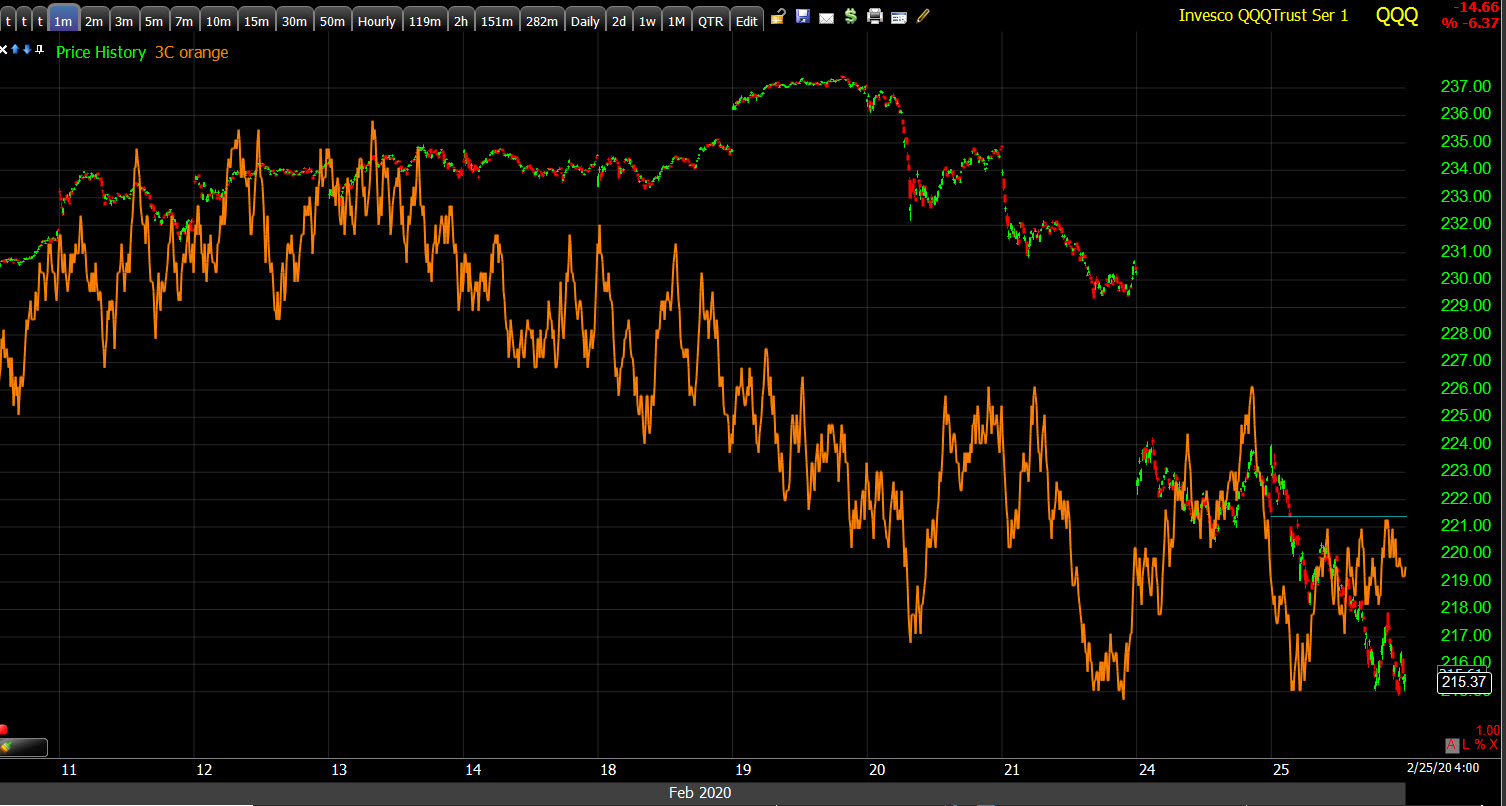
QQQ (1m) also looked better Monday afternoon, at least until the close when 3C dropped again. There is potential for a positive divergence, but I would not call this one.
One final 3C chart of interest, TLT. My second leg target for TLT is in the $153.50-$153.75 area, it made more progress toward that today- at an all-time record high by the way.
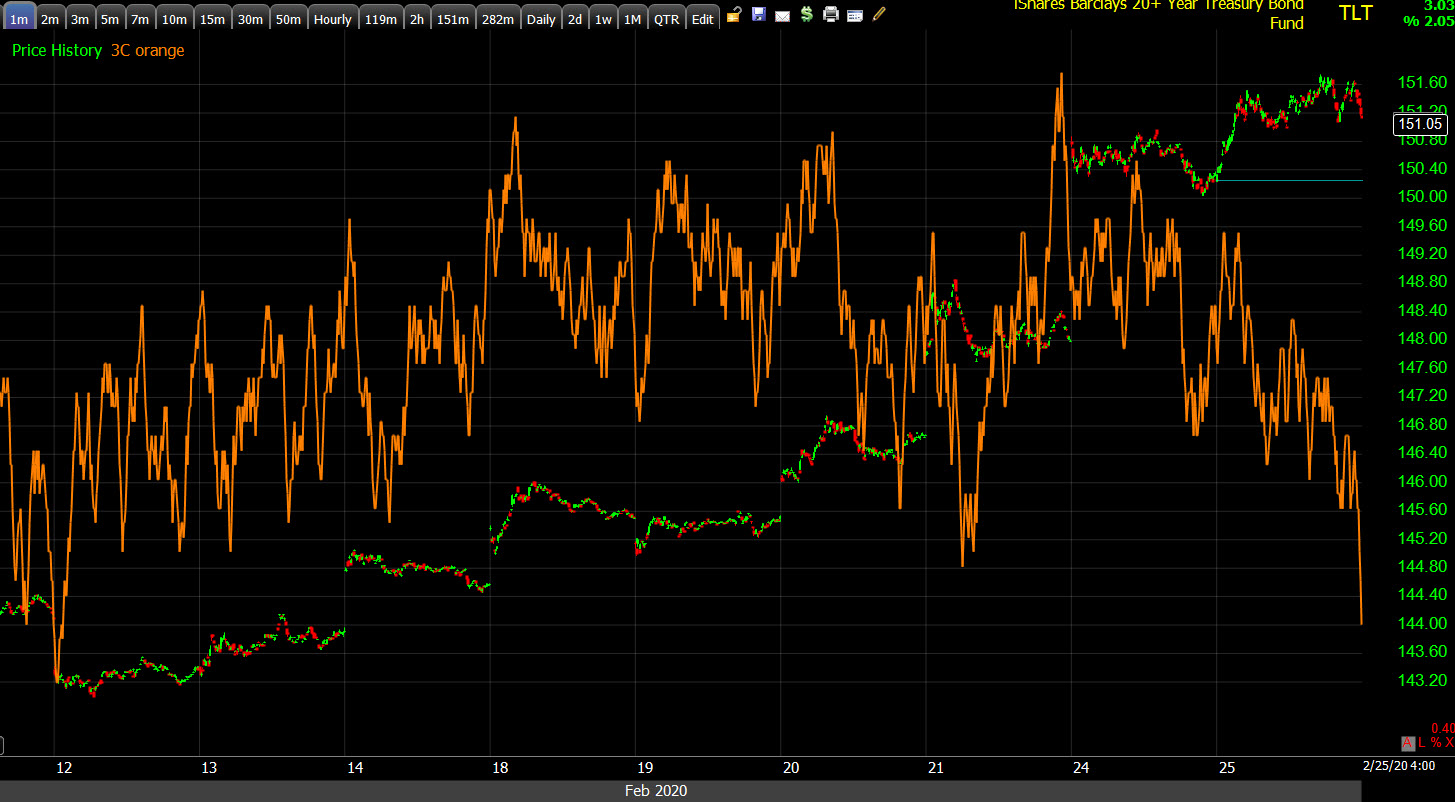 TLT (1m) this looks like profit taking as TLT nears the target. If the 3C chart turns down even more tomorrow, then I think we’re getting to a near-term market low, especially if volatility/VXX follows suit.
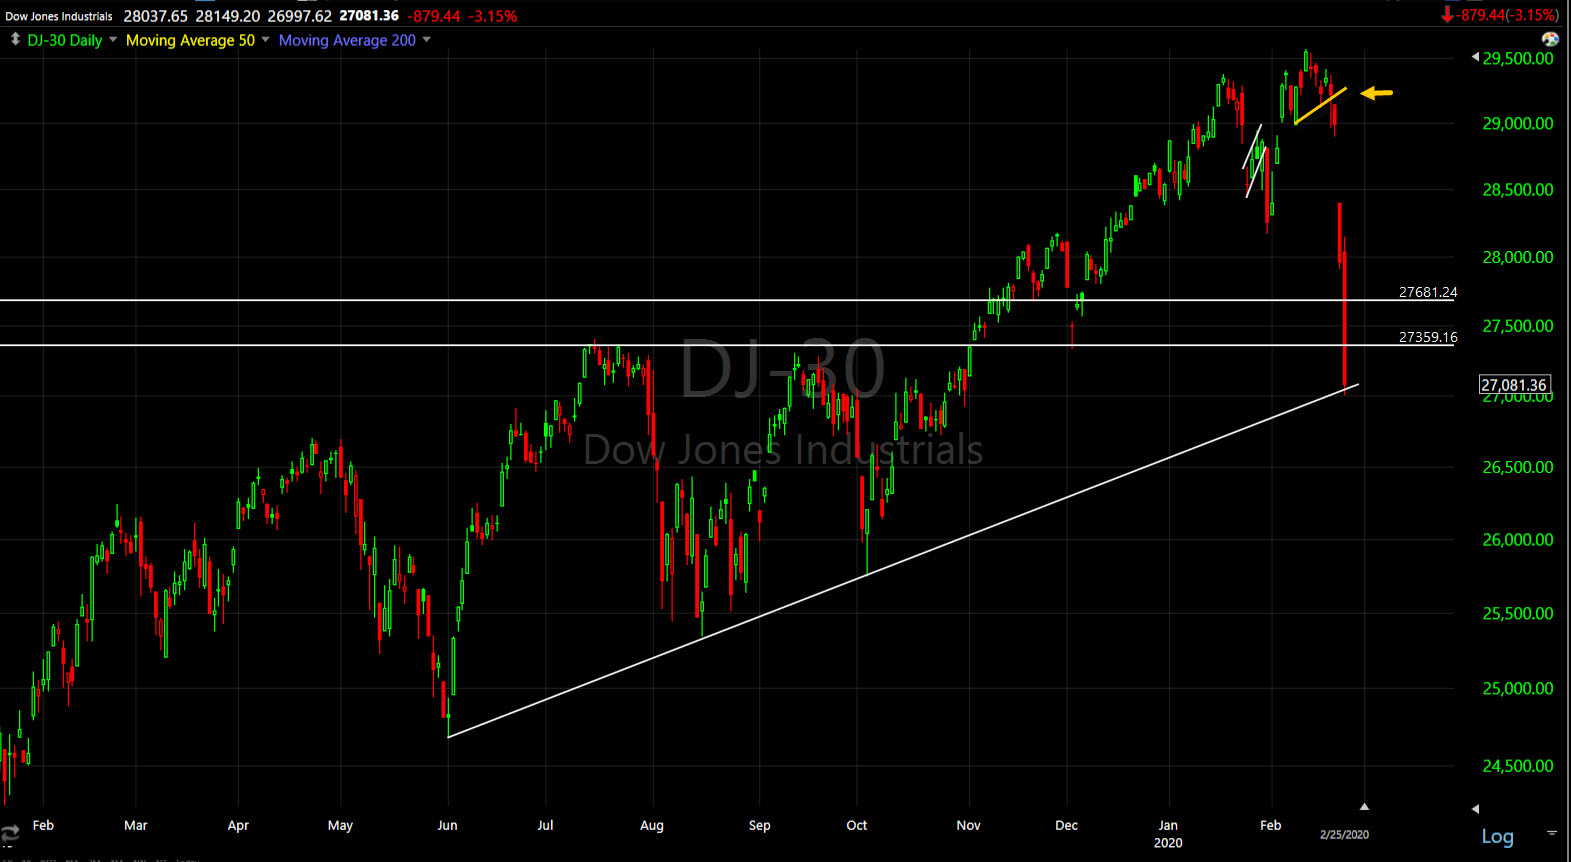 Dow (daily) While the Dow closed on the trend, it’s too early to say if that’s coincidental or support.
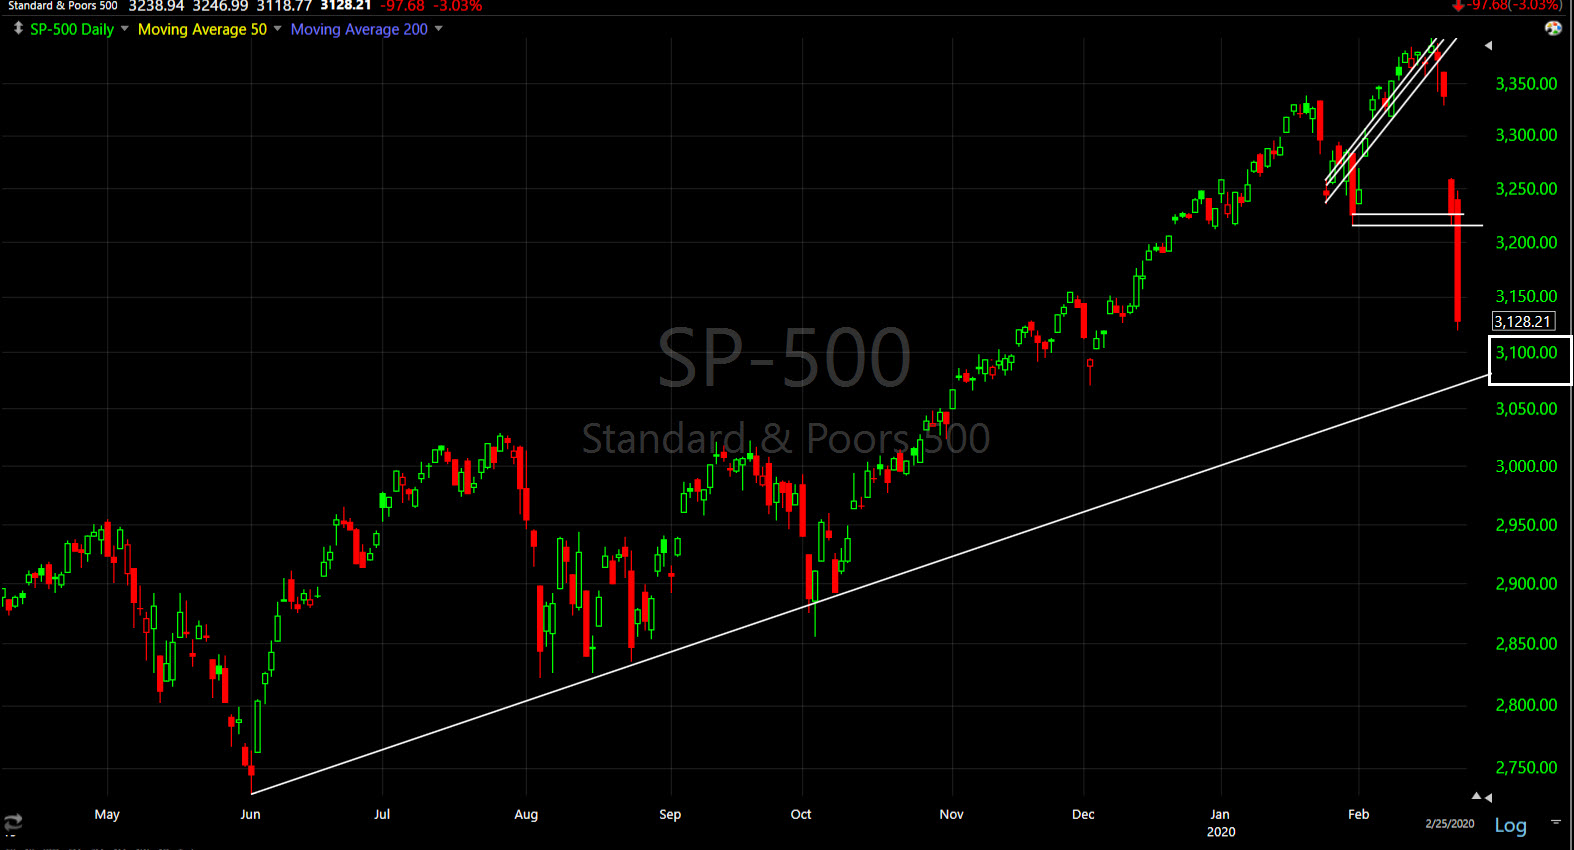 SP-500 (daily) I’m not sold on this trend line as it can be adjusted a little either way, but it’ similar to the Dow trend above and the whole number (psychological) $3100 level does have a parallel on the longer term charts.
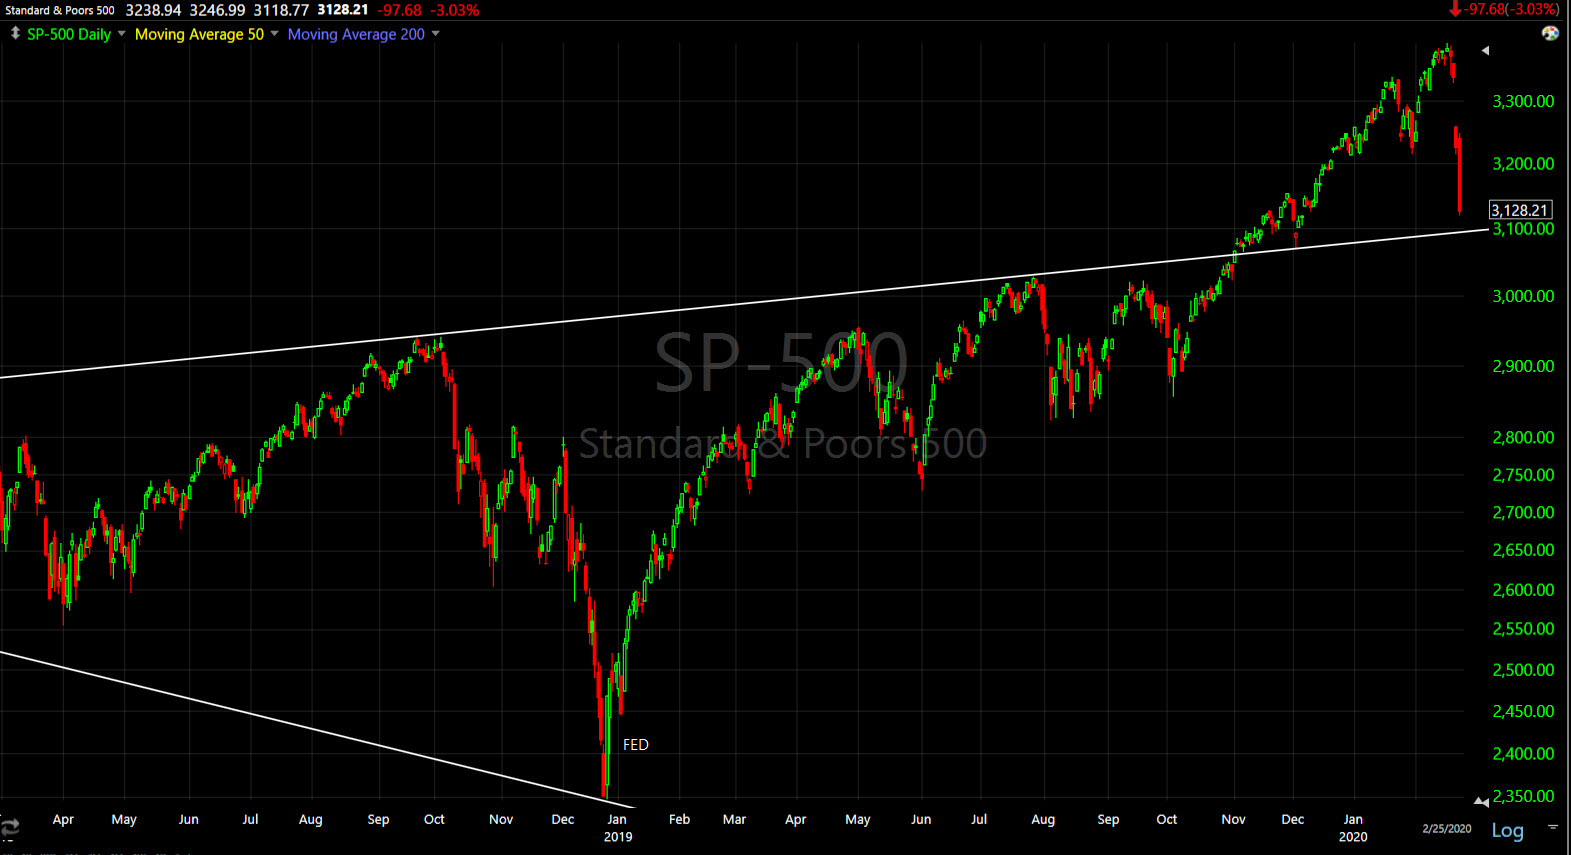
SP-500 (daily) the broadening formation that was in place right up until the Fed started repo operations and QE, expanding its balance sheet by more than $400 billion dollars, comes in right around $3100. This is a major trend line on weekly charts so I think it has pretty decent probabilities of getting at least a short-term reaction (support). The level is less than 1% lower for the S&P and given that Gold nearly hit its upside target, and TLT is fairly close to its, this level looks pretty reasonable to me. I think it’s the most interesting and probable level of support for the S&P and broader market.
Overnight
S&P futures are up +0.35% and reflecting a small consolidation off afternoon lows.
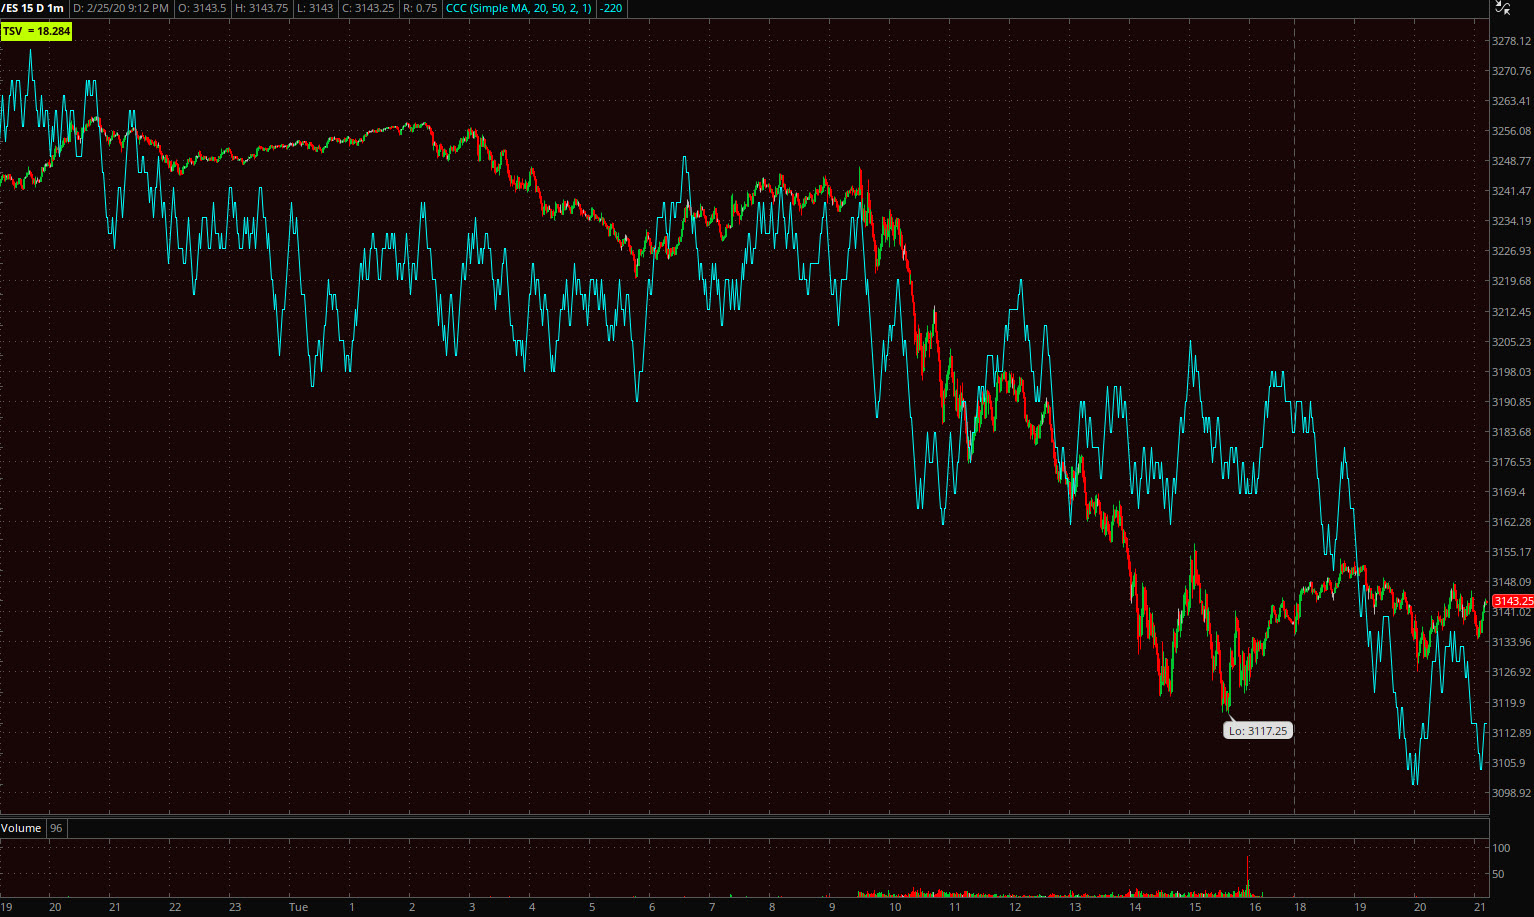 ES (1m) consolidation off session lows. 3C is not constructive tonight.
However, VIX futures are not confirming well. Safe haven assets and volatility really didn’t do much today compared to yesterday. VIX was trading unchanged as the S&P was down 1% Tuesday morning.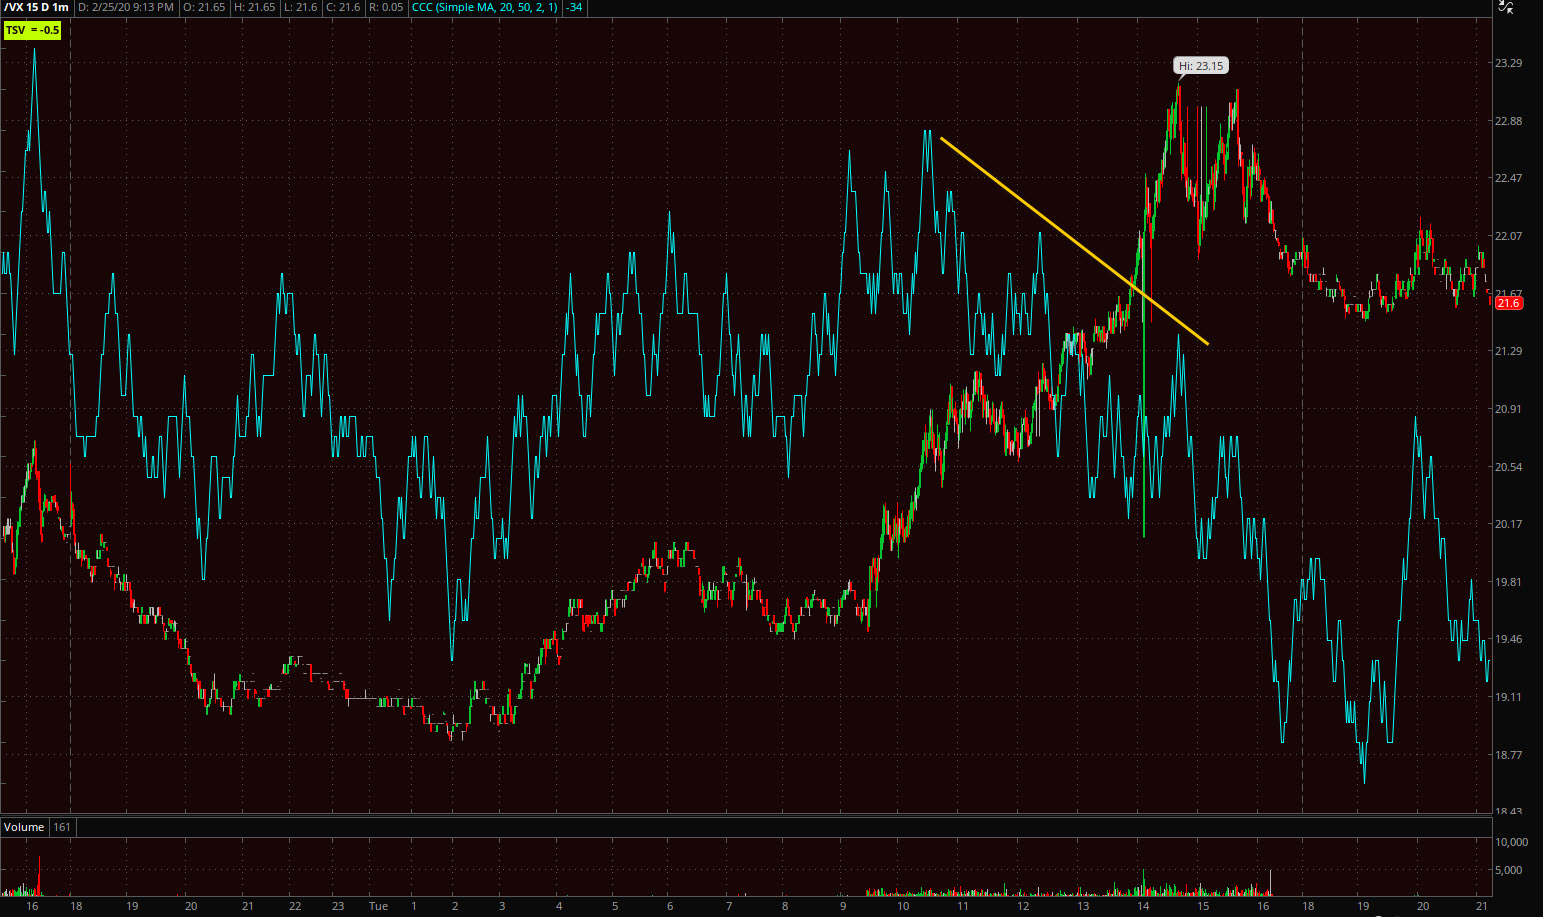 VIX futures (1m) not confirming the afternoon highs.
Crude futures are up +0.75% to $50.328, nearing the $50.50 level on my radar.
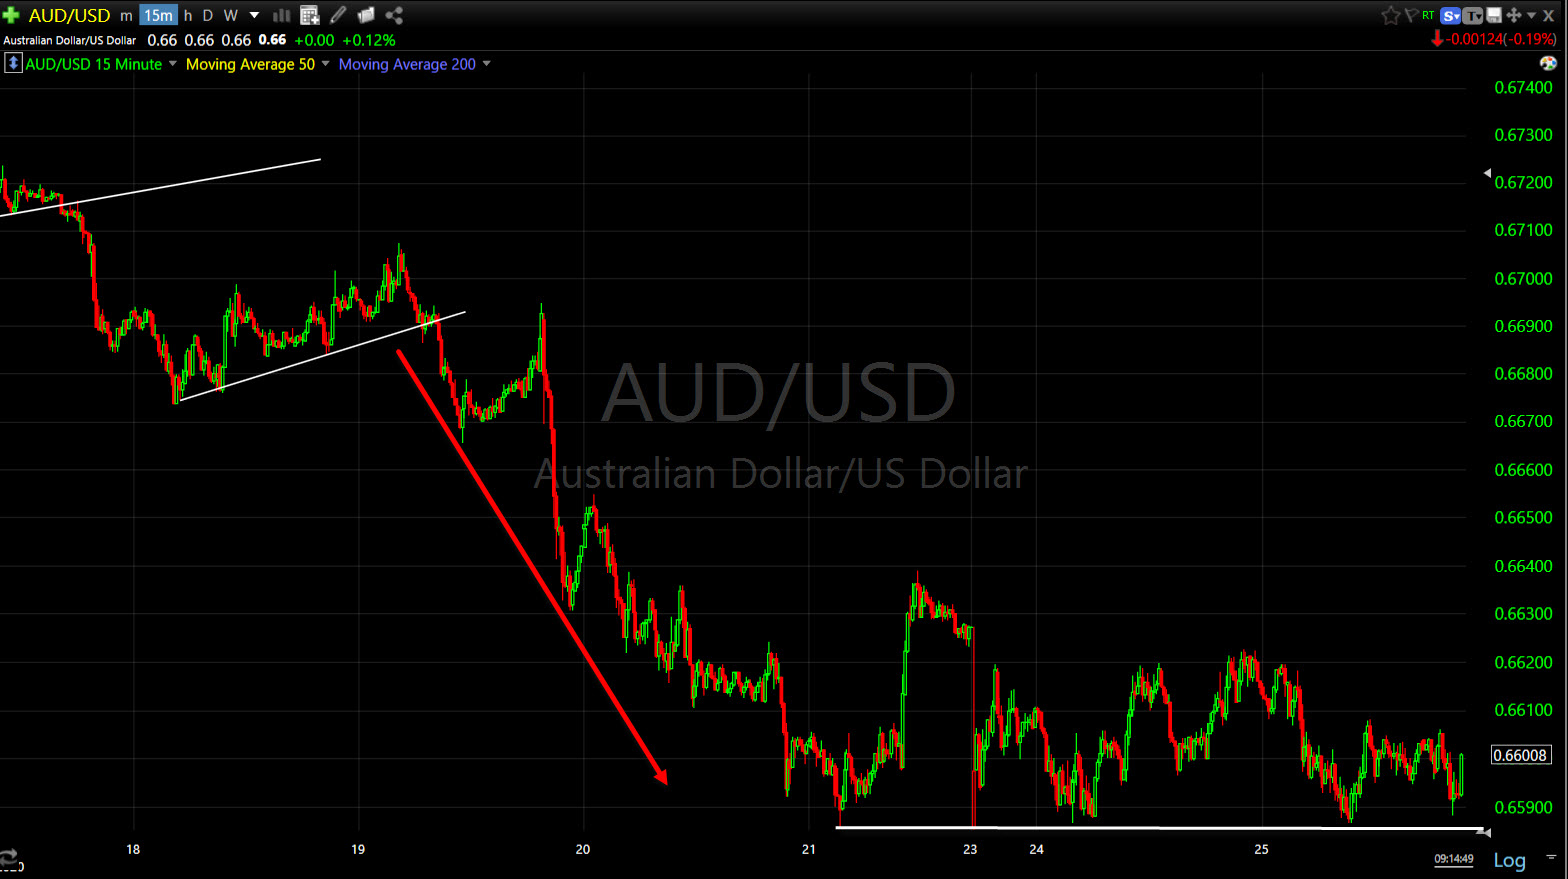
AUD/USD was among the assets warning last week as the Aussie led stocks lower (gold and bonds higher) at the red arrow. For context, the low has not been seen since 2009. However, the pair has not made a lower low this week.
Investors will receive New Home Sales for January and the weekly MBA Mortgage Applications Index on Wednesday.