Daily Wrap – February 4th, 2020
The People’s Bank of China pushed out massive liquidity for the second day in a row, or the second time in roughly 24 hours. The People’s Bank of China will also reportedly issue cuts to its key lending rate and reserve requirement ratios for banks to help offset the negative economic impact resulting from the coronavirus. Today’s stimulative measures followed moves by China’s securities regulator on Monday to limit short selling and stop mutual fund managers selling shares unless they face investor redemptions.
If my numbers and math are correct, the PBoC injected 1.2 trillion yuan Monday, of which 1 trillion was rolling over maturing liquidity, and 400 billion yuan (net) today or approximately $86 billion (USD) in 24 hours. The Fed’s recent balance sheet expansion has run at a pace or around $100 bn a month.
Chinese stocks were down -3% before the PBoC’s actions put in a sharp and sudden v-shape bottom. The Shanghai Composite ended +1.34% higher. Global markets were lifted by the flood of liquidity and perhaps a feeling that the reaction to the corona virus was overdone (not my opinion), and central banks have investors’ backs. The major European indices closed firmly higher. Germany’s DAX gained +1.8%, UK’s FTSE +1.6%, and France’s CAC +1.8%.
Additionally, the Fed injected $94.45BN in liquidity Tuesday morning in the form of overnight and term repos. The demand for Fed liquidity this morning was nearly unprecedented, with $59.05BN in securities submitted by dealers for $30BN in term repo available and maturing on Feb 18. The demand for liquidity compared to what was provided made today’s repo the most oversubscribed since the first term repo issued at the depth of the September repo crisis, which saw $62BN in submissions for $30BN in liquidity. The takeaway is that despite months of Fed repo operations and balance sheet expansion, at least one (or more) entities seems to be in dire need of cash.
The market shrugged off Alphabet’s (-2.6%) earnings miss, although it weighed on the Communications sector (down -0.4% this morning), but even Communications rallied to end more than 1% higher, and was a key pillar of support this afternoon as most other sectors went sideways or dipped.
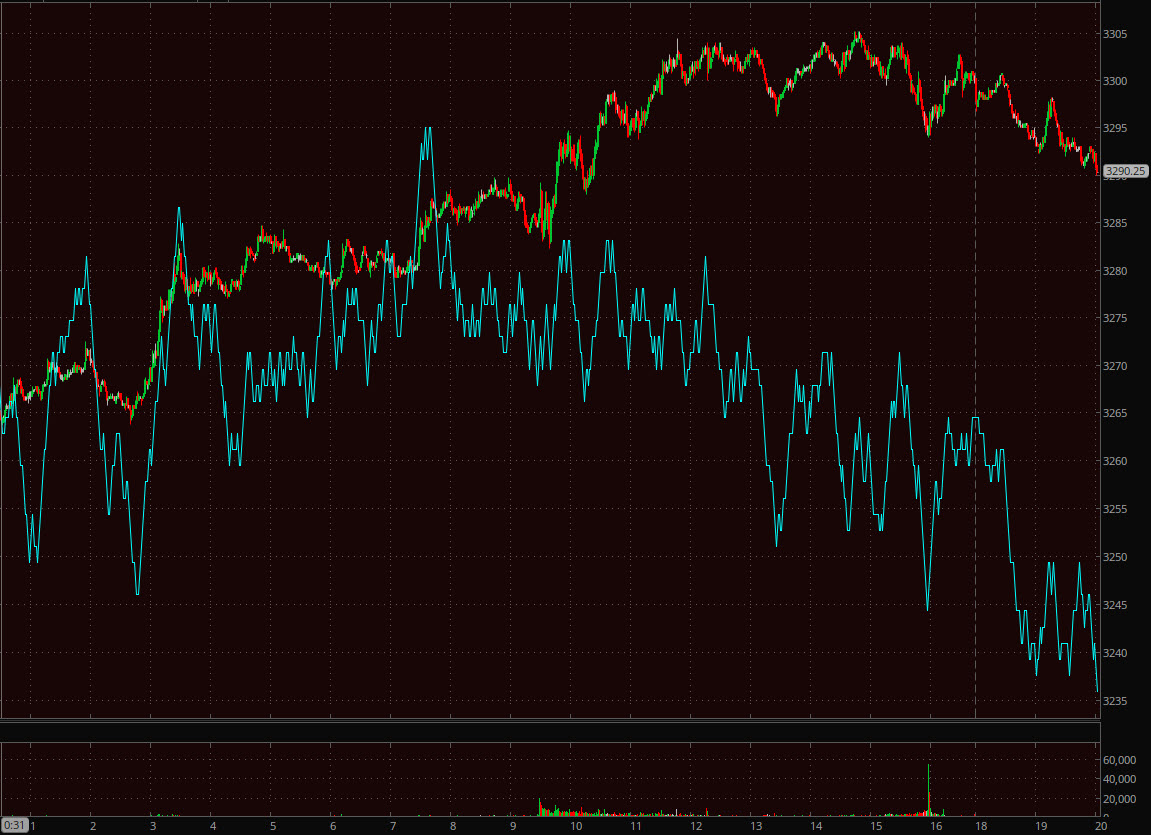
The most shorted stocks squeezed again, even more sharply than Monday morning.
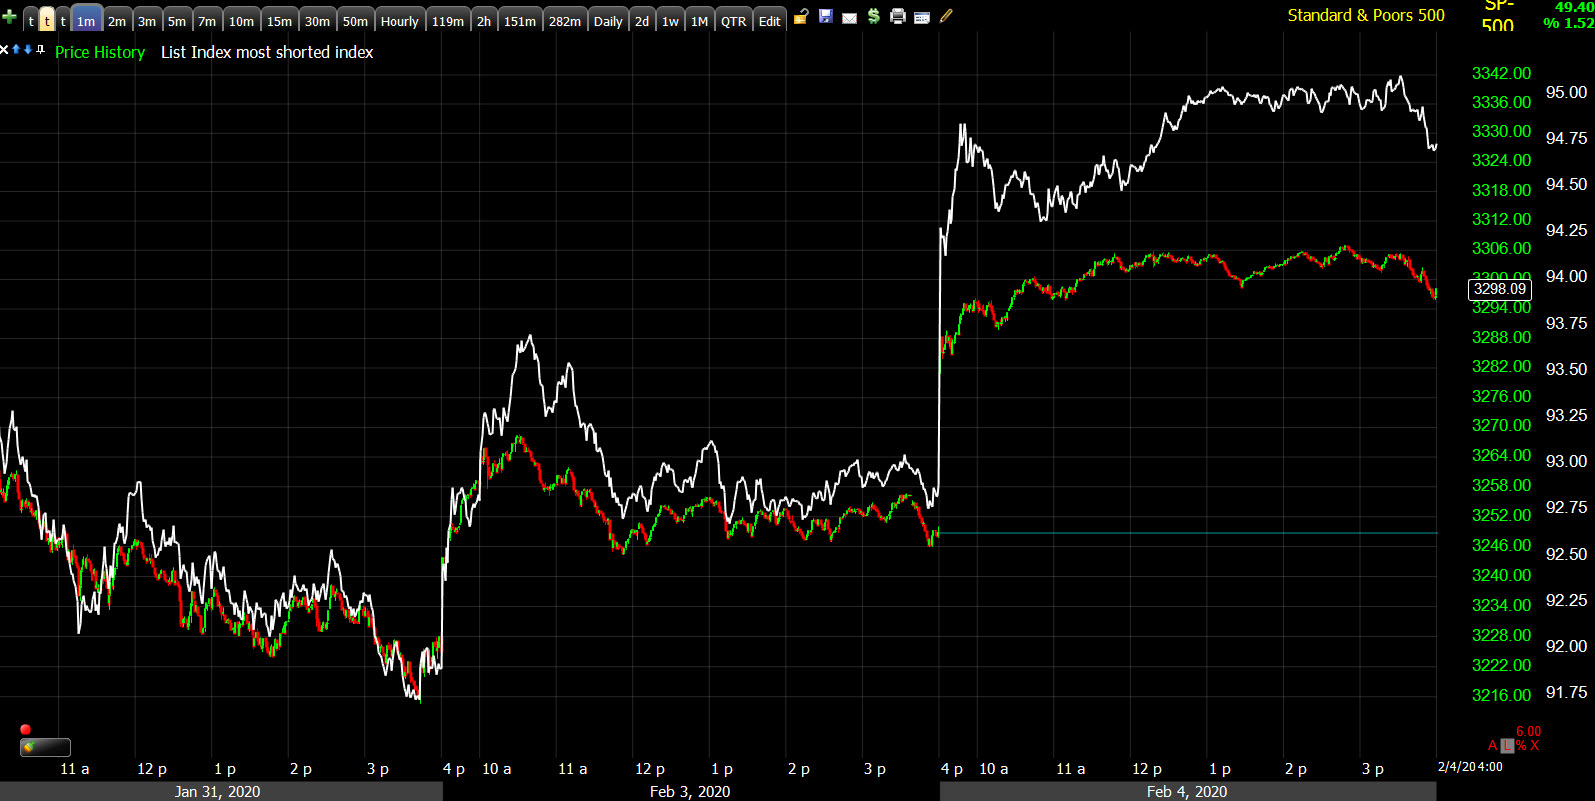
SP-500 (1m) and Most Shorted Index. The bulk of the squeeze was at the open, but continued higher into the afternoon.
Today’s economic data was limited to Factory Orders, which increased 1.8% m/m in December, better than consensus (+1.2%) following a downwardly revised 1.2% decrease (from -0.7%) in November. The year-over-year reading is negative at -0.4. Despite the beat, the key takeaway from the report is that it reflects generally weak levels of business spending, evidenced by the -0.8% decline in nondefense capital goods orders excluding aircraft.
Averages
A common occurrence in a liquidity driven rally is that the averages (and S&P sectors’) percent changes are nearly identical as seen today. NASDAQ 100 outperfomred with leadership from the Technology sector. Apple (AAPL +3.3%) and Microsoft (MSFT+3.3%) were the apparent levers or fulcrums for the tech-driven gains. The two stocks’ percentage gains are identical as well.
S&P 500 ⇧ 1.51 %
NASDAQ ⇧ 2.28 %
DOW JONES ⇧ 1.44 %
RUSSELL 2000 ⇧ 1.50 %
The DJIA has moved back into positive territory for the year, +0.94% inclusive of today’s gains.
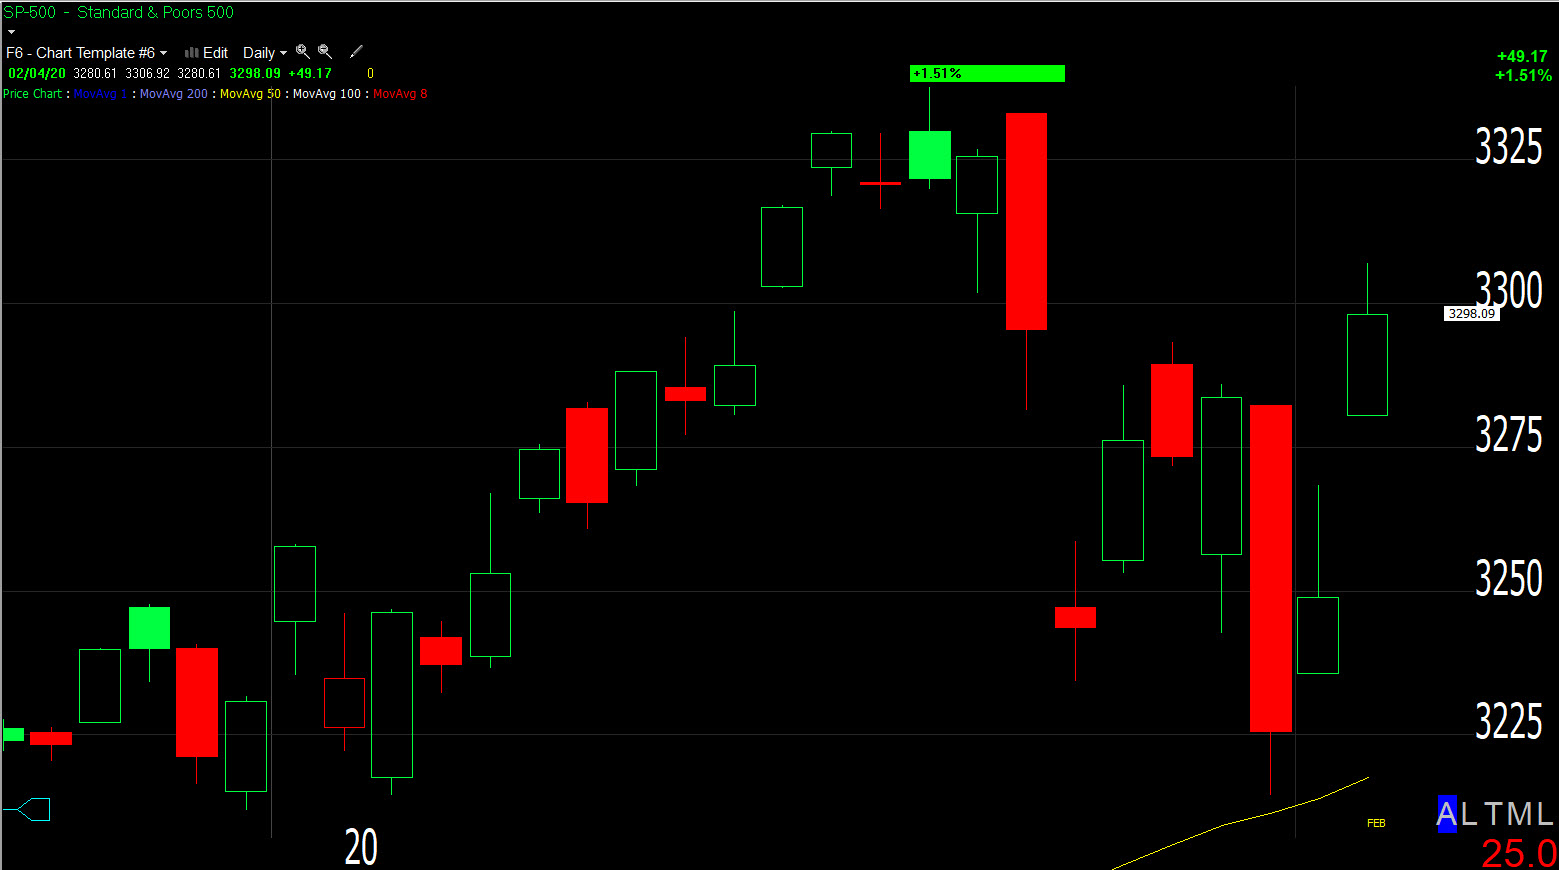
SP-500 (daily) ended up where I thought it would be during last week’s consolidation ($3300). The S&P filled last Monday’s gap, although it was not that large that it was a major issue in my view. S&P closed off session highs leaving an upper wick like yesterday. Remember that Monday’s candles were inside days (reversal candle).
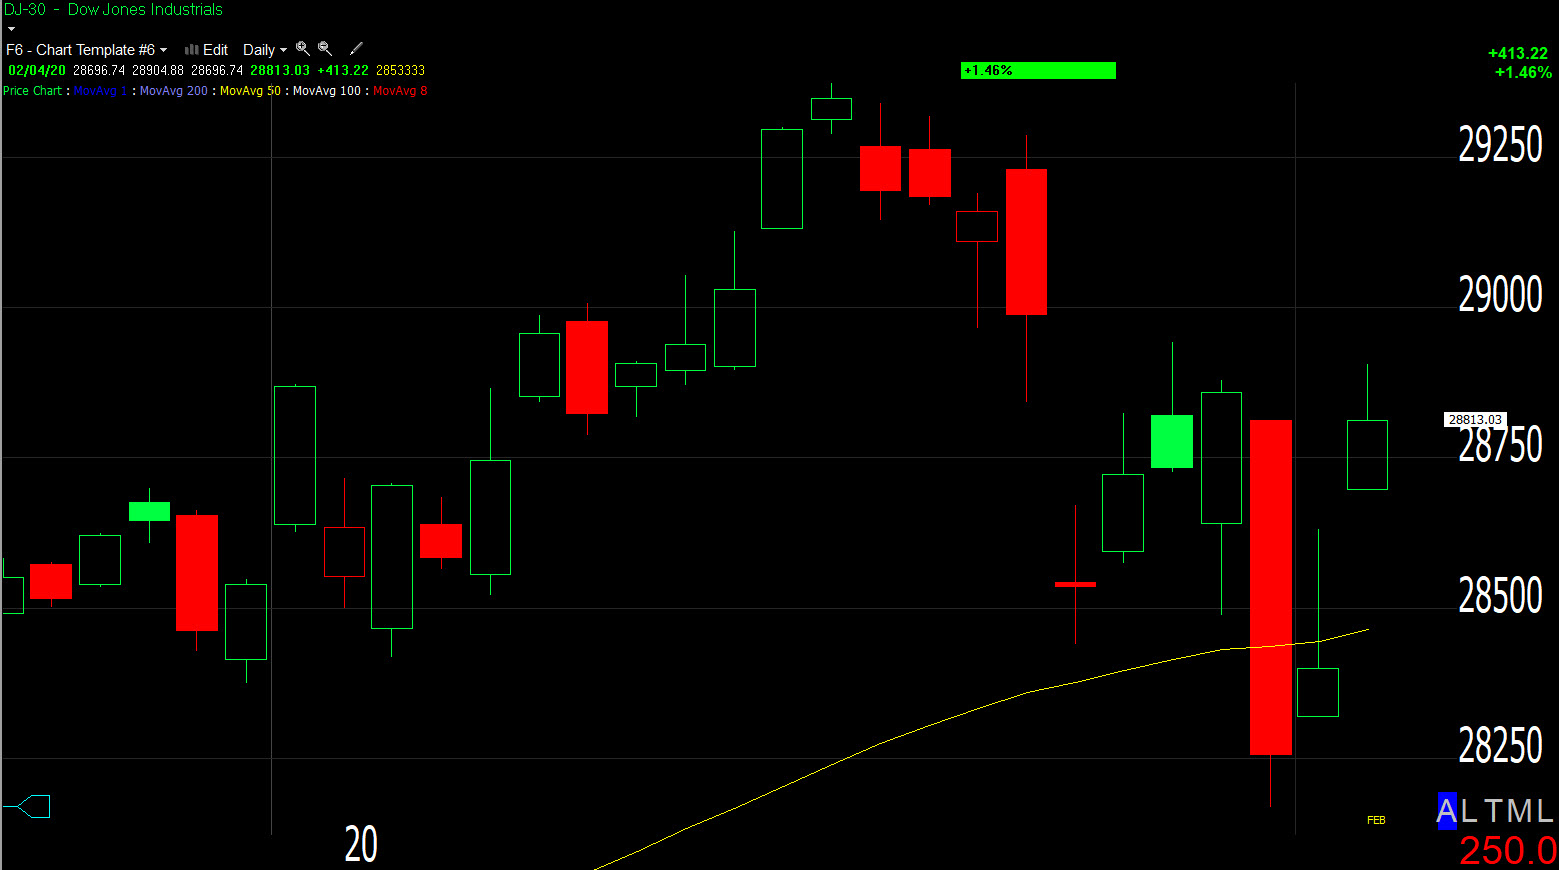 Dow (daily) fell short of closing last week’s gap, or retaking 29k, which I thought it may do ahead of President Trump’s State of the Union address tonight.
 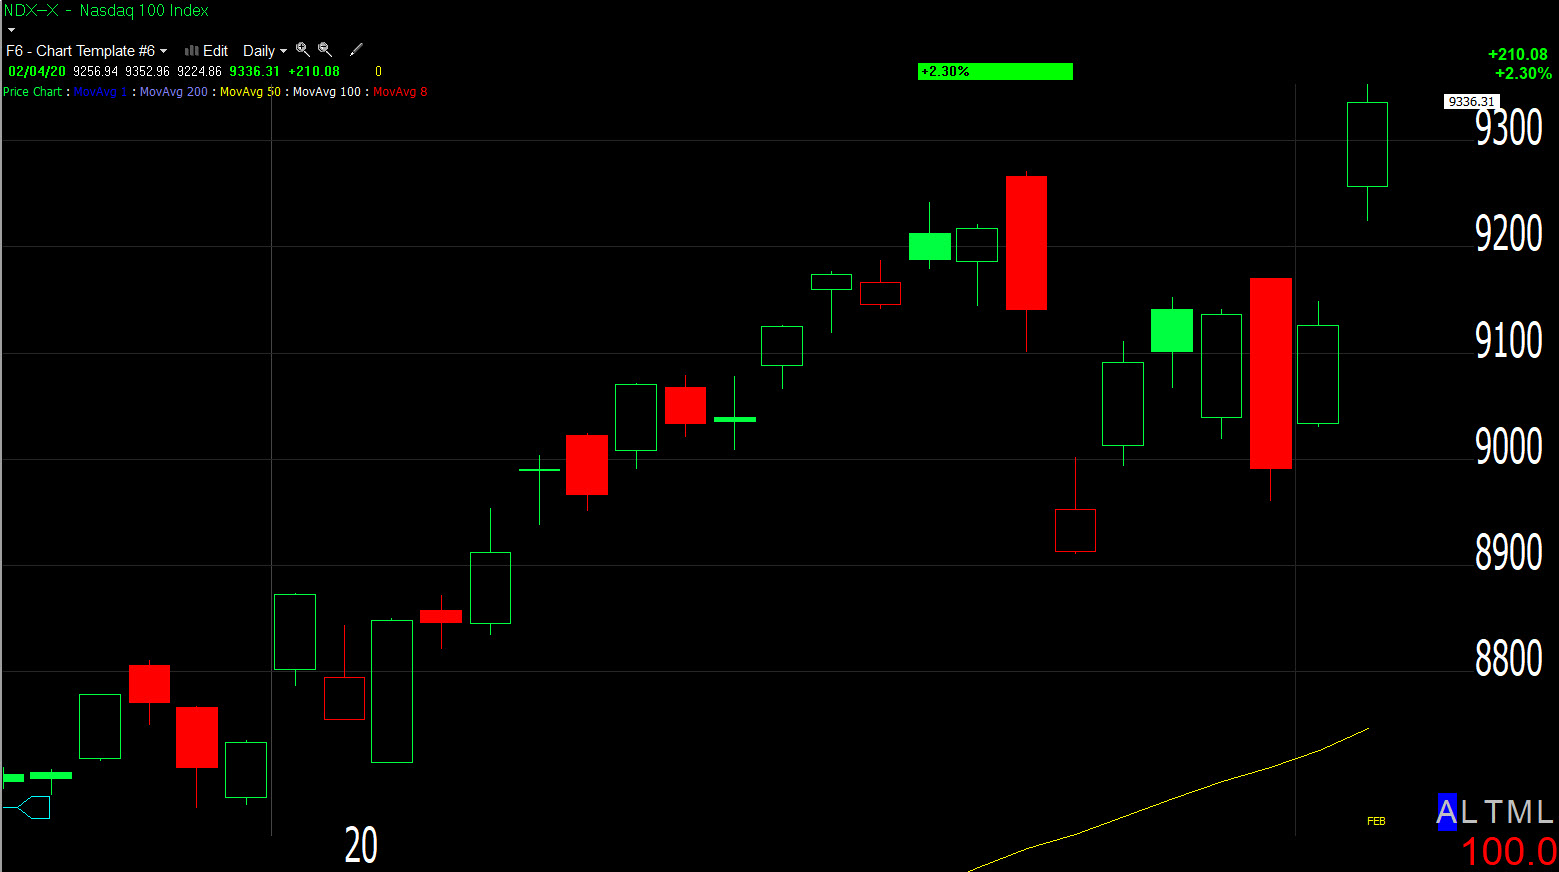 NASDAQ 100 (daily) made a new closing high. NASDAQ and Technology will be the last to go, they’re the most popular and crowded trades. I’ve notice this trend the last few years. I prefer to be short small caps at the start of an expected decline, and then switch to NASDAQ after a consolidation and before the start of a second leg down.
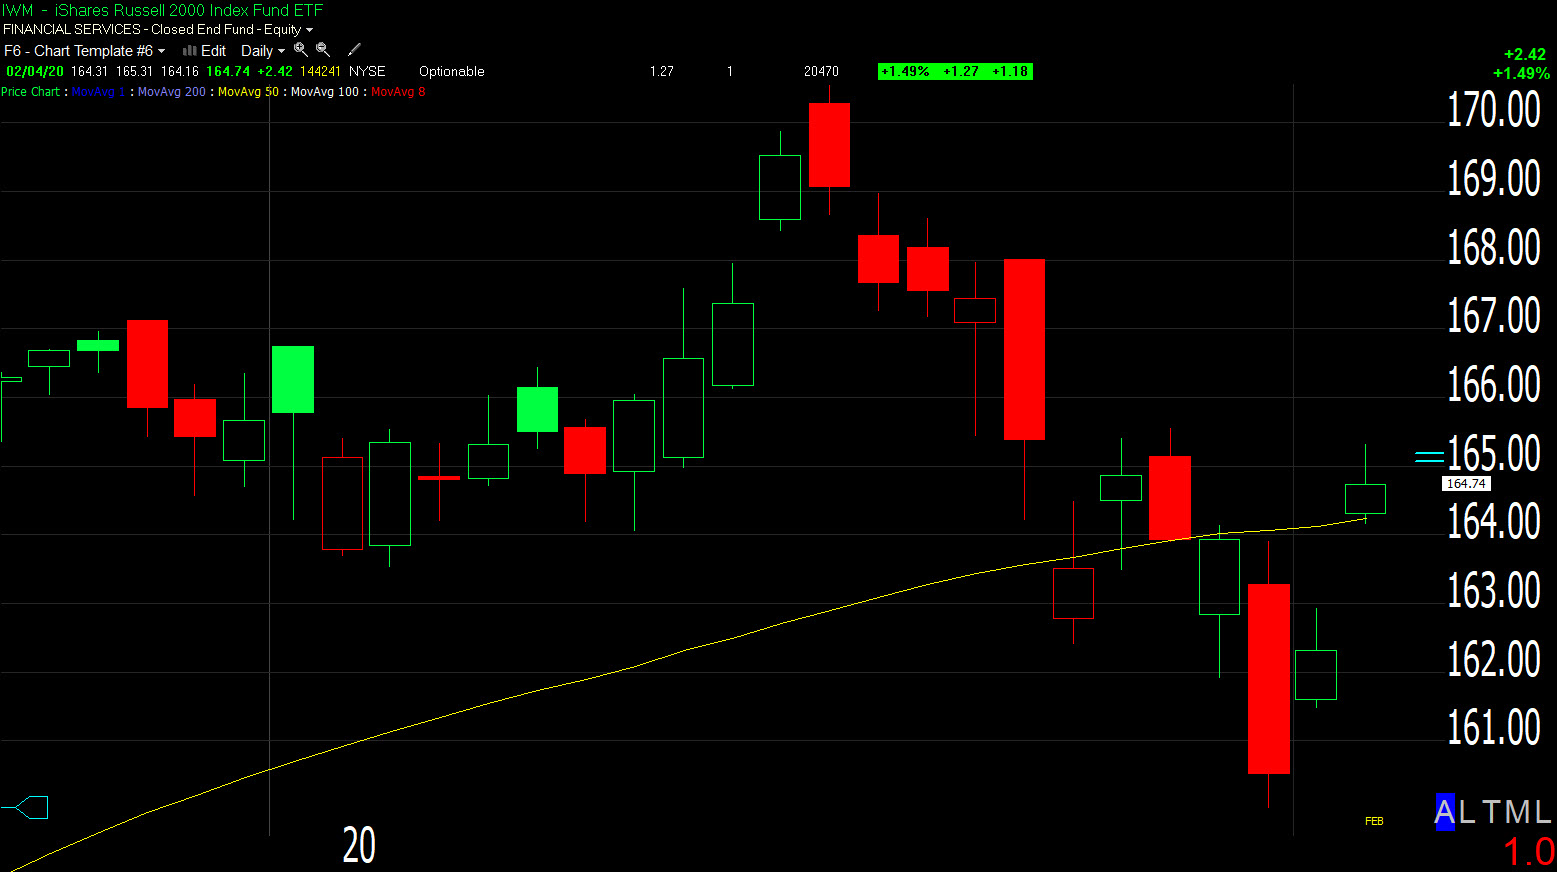
IWM (daily) closed above the 50-day moving average. IWM filled Monday’s gap last week, but as you can see, today is little more than a corrective bounce within the context of the last 2 weeks.
S&P sectors
Cyclical sectors did most of the heavy lifting amid the risk-on rebound, the most heavily weighted S&P sector, Technology, was the clear standout leader despite Alphabet’s earnings. Other decent performers are the Materials and Health Care sector, two of only 3 sectors to have reached second leg downside targets. The rate-sensitive Utilities sector was the lone loser, as the selling in the Treasury market drove yields higher. However, Energy was a clear laggard as crude’s weakness continued.
Materials ⇧ 1.77 %
Energy ⇧ 0.36 %
Financials ⇧ 0.96 %
Industrial ⇧ 1.89 %
Technology ⇧ 2.62 %
Consumer Staples ⇧ 0.60 %
Utilities ⇩ -1.00 %
Health Care ⇧ 1.76 %
Consumer Discretionary ⇧ 1.82 %
Real Estate ⇧ 1.30 %
Communications ⇧ 1.04 %
Semiconductors +3.1% were an area of relative strength after the group was one of the worst performing, losing more than 7% last week.
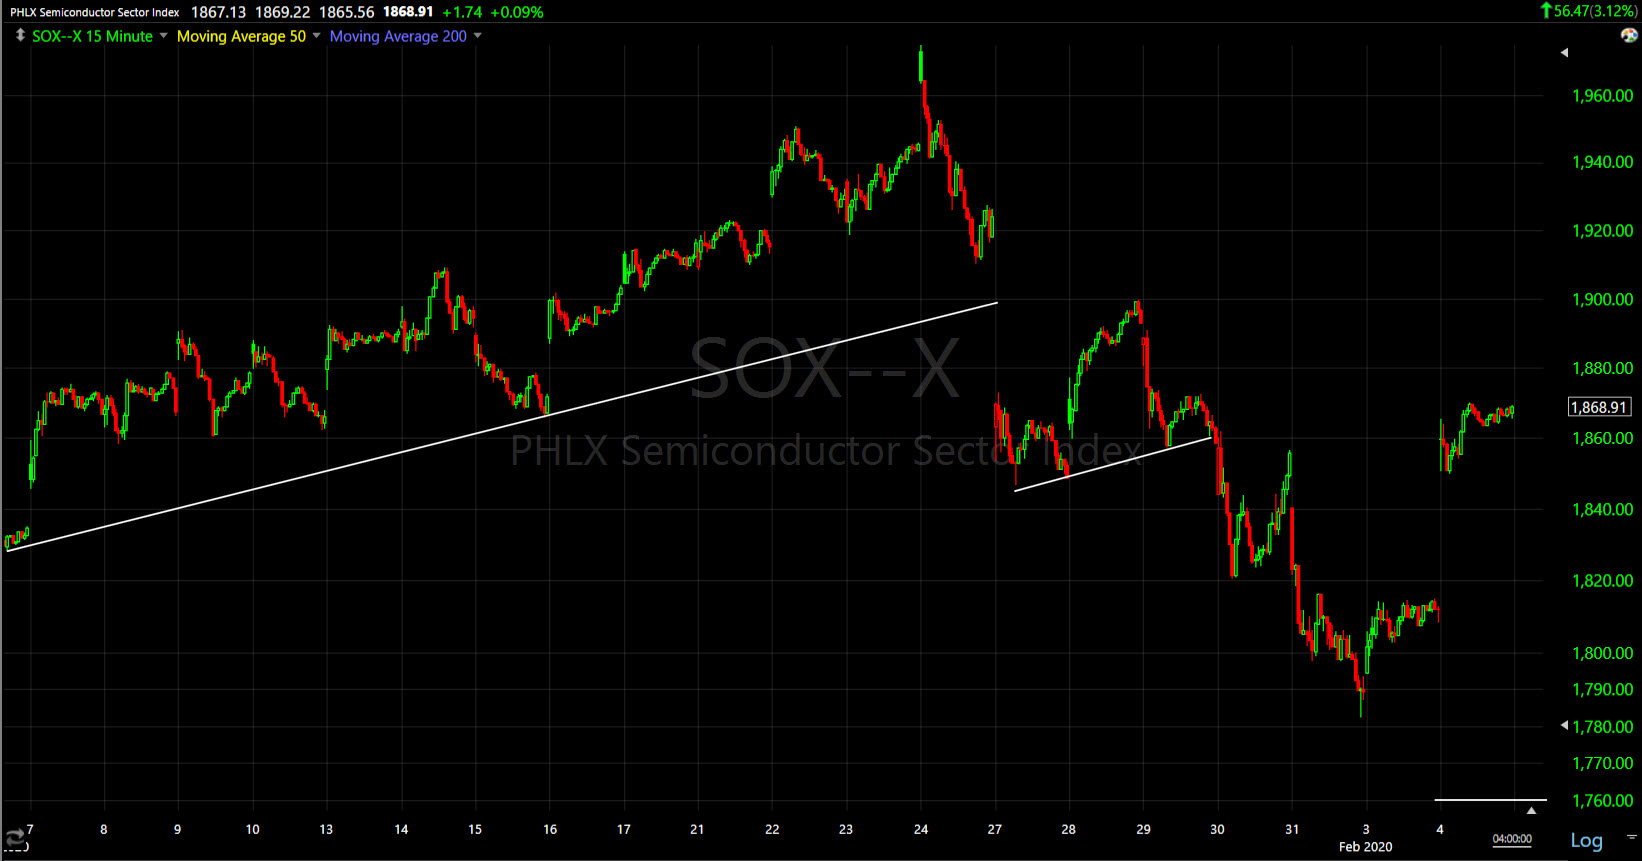
Philly Semiconductor Index (15m) fell short of its second leg target, but even with today’s strong performance, it’s still a lower high. There is a pretty sizable gap above.
Today’s price action just widens the disparity between S&P sectors and the averages and clouds the overall picture. I think posting some charts is the best way to demonstrate that and to give some perspective.
For some sectors today’s price action is along the lines of an oversold bounce, especially those that already met second leg downside targets.
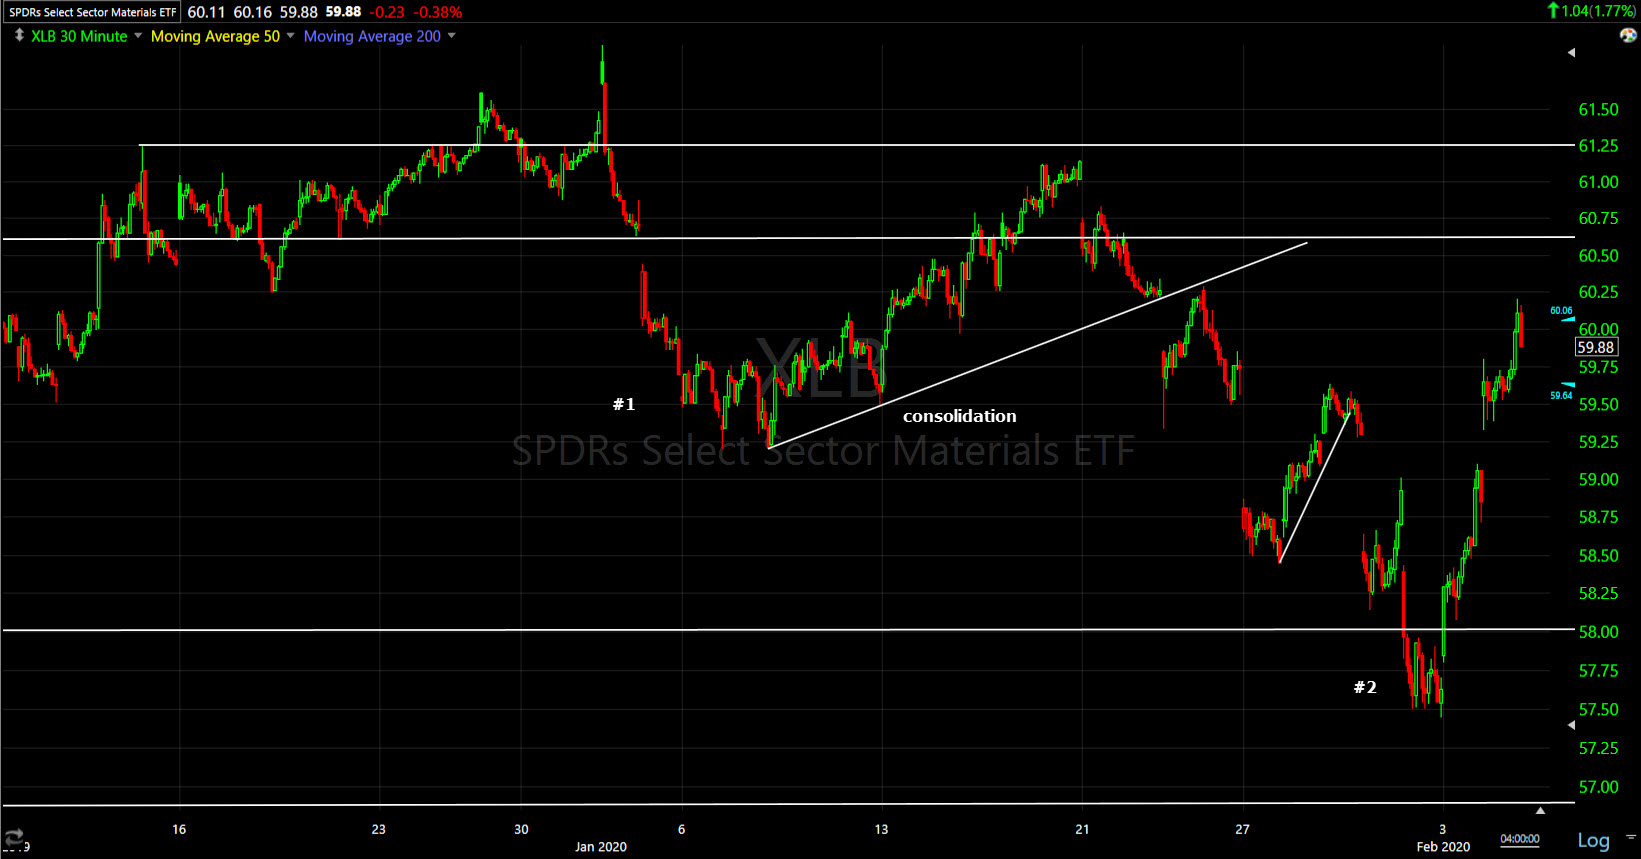 Materials sector (30m) completed a second leg down. The bounce this week off a support zone is impressive, but doesn’t change the technical outlook for this lightly weighted, growth sensitive sector unless it trades above $61.25 ( a higher high).
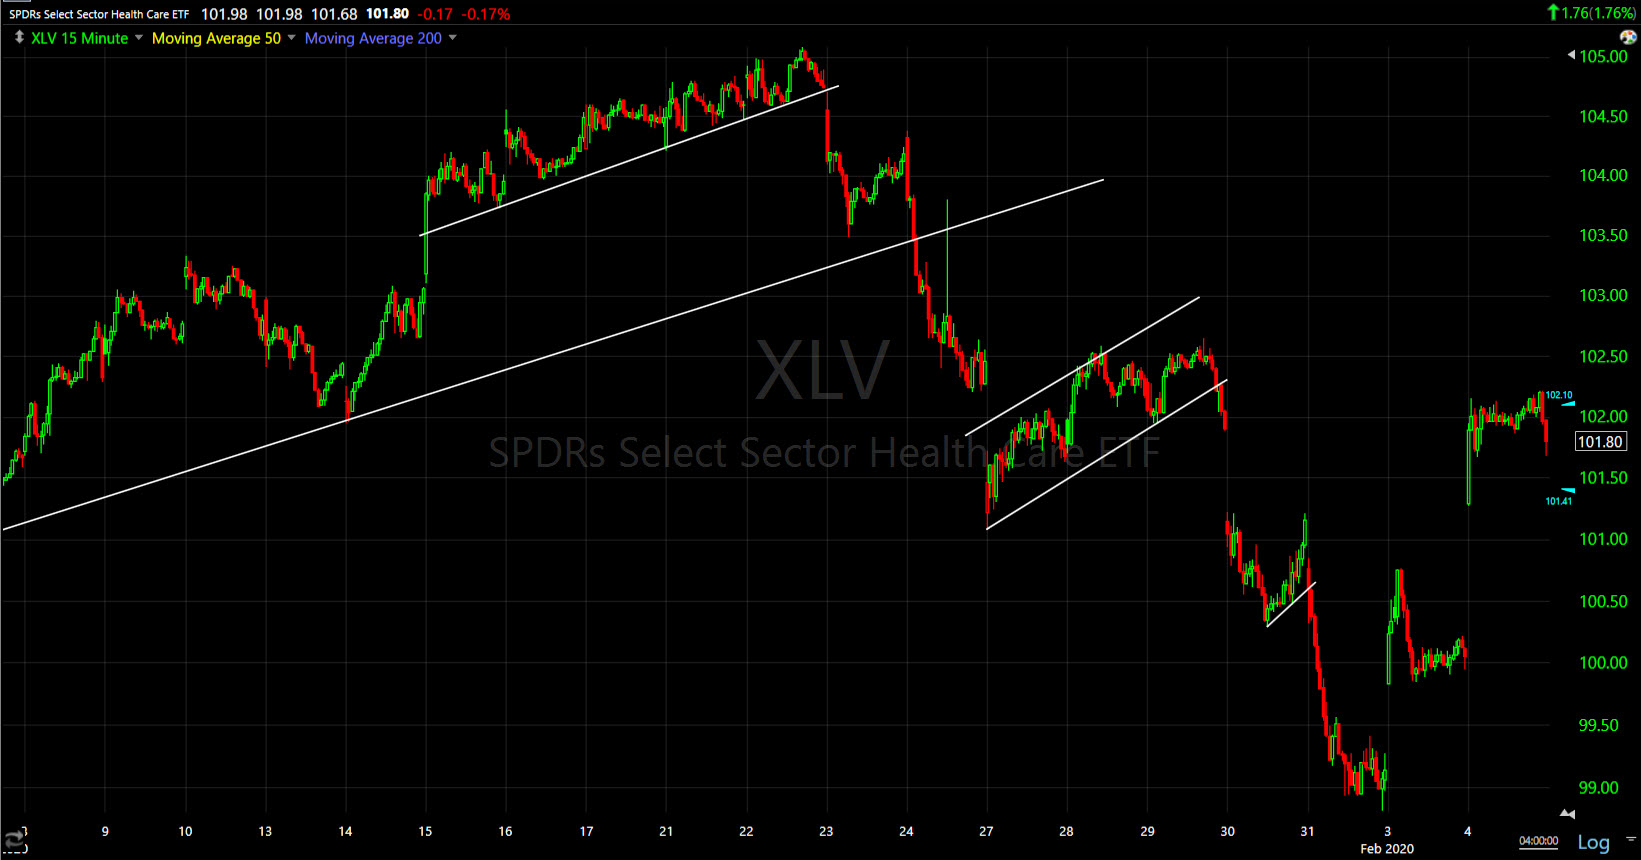 Health Care (15m) also met a second leg measured move target. The week’s gain is pretty typical of an oversold or dead cat (dead bat) bounce. The diagonal trend line (broken) is significant, it’s the primary trend from October. Thus far the technical outlook is unchanged with a bounce to a lower high.
Some others sectors have not met their second leg targets yet, and their technical outlook is unchanged in light of today’s rally.
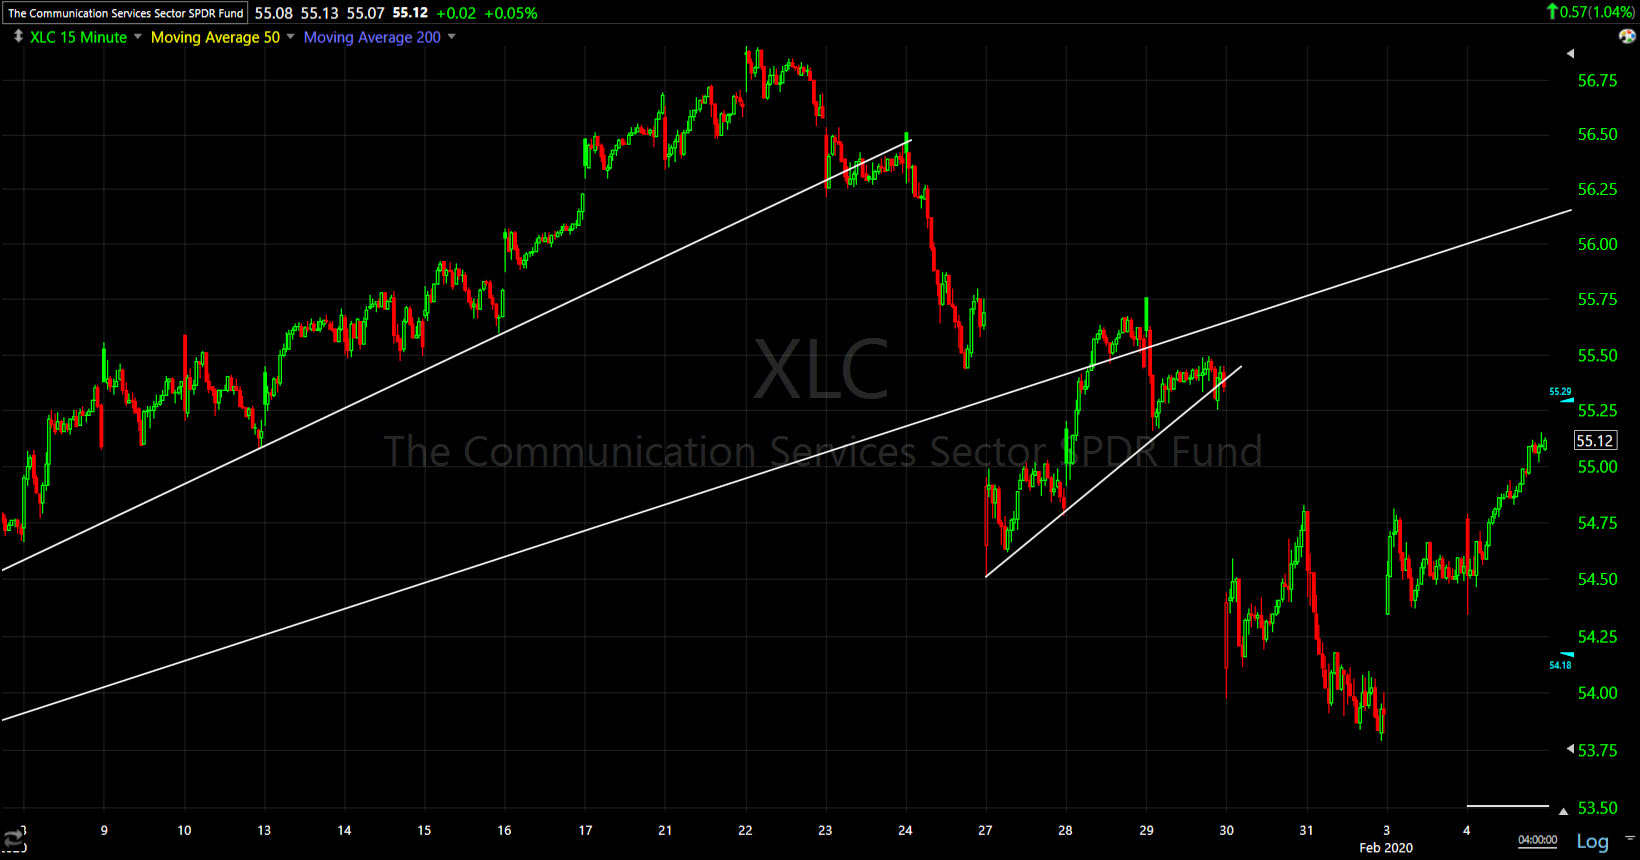 Communications (15m) is making lower highs and lower lows. This week’s price action is similar to last week’s – a drop, a correction to a lower high, and another drop. So far today’s price action is a bounce to a lower high, filling some of last week’s gap. The 2nd leg target is below near $53.50.
![]()
Dow Transports (15m) another series of lower highs/lows and a bounce to a lower high below the key 10,950-11k level.
There are a few sectors that are still within last week’s consolidation zones.
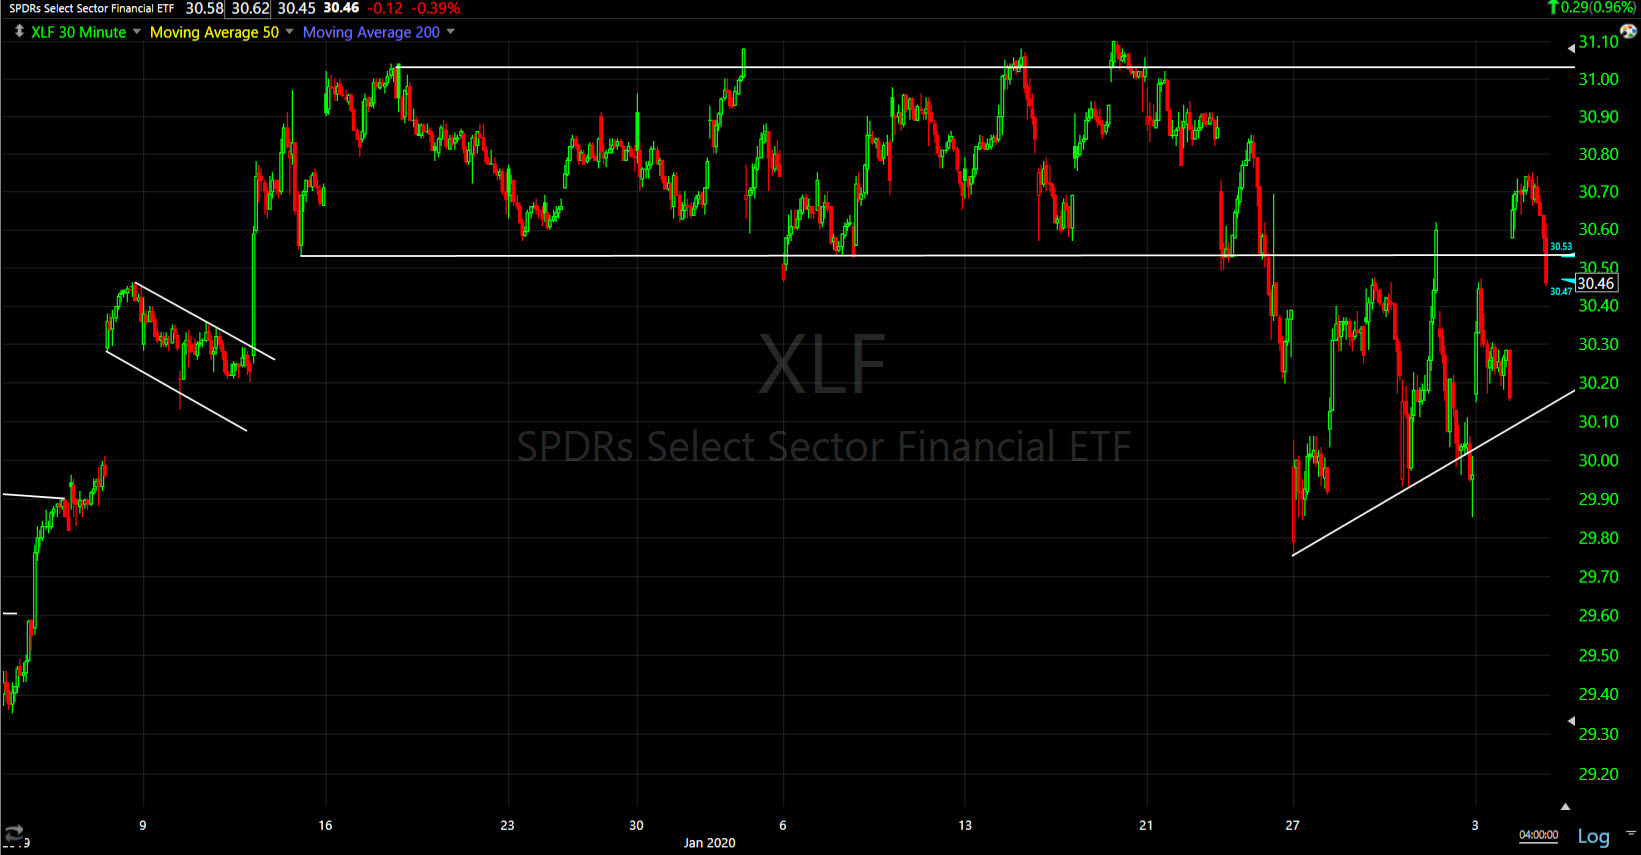 Financial sector (30m)
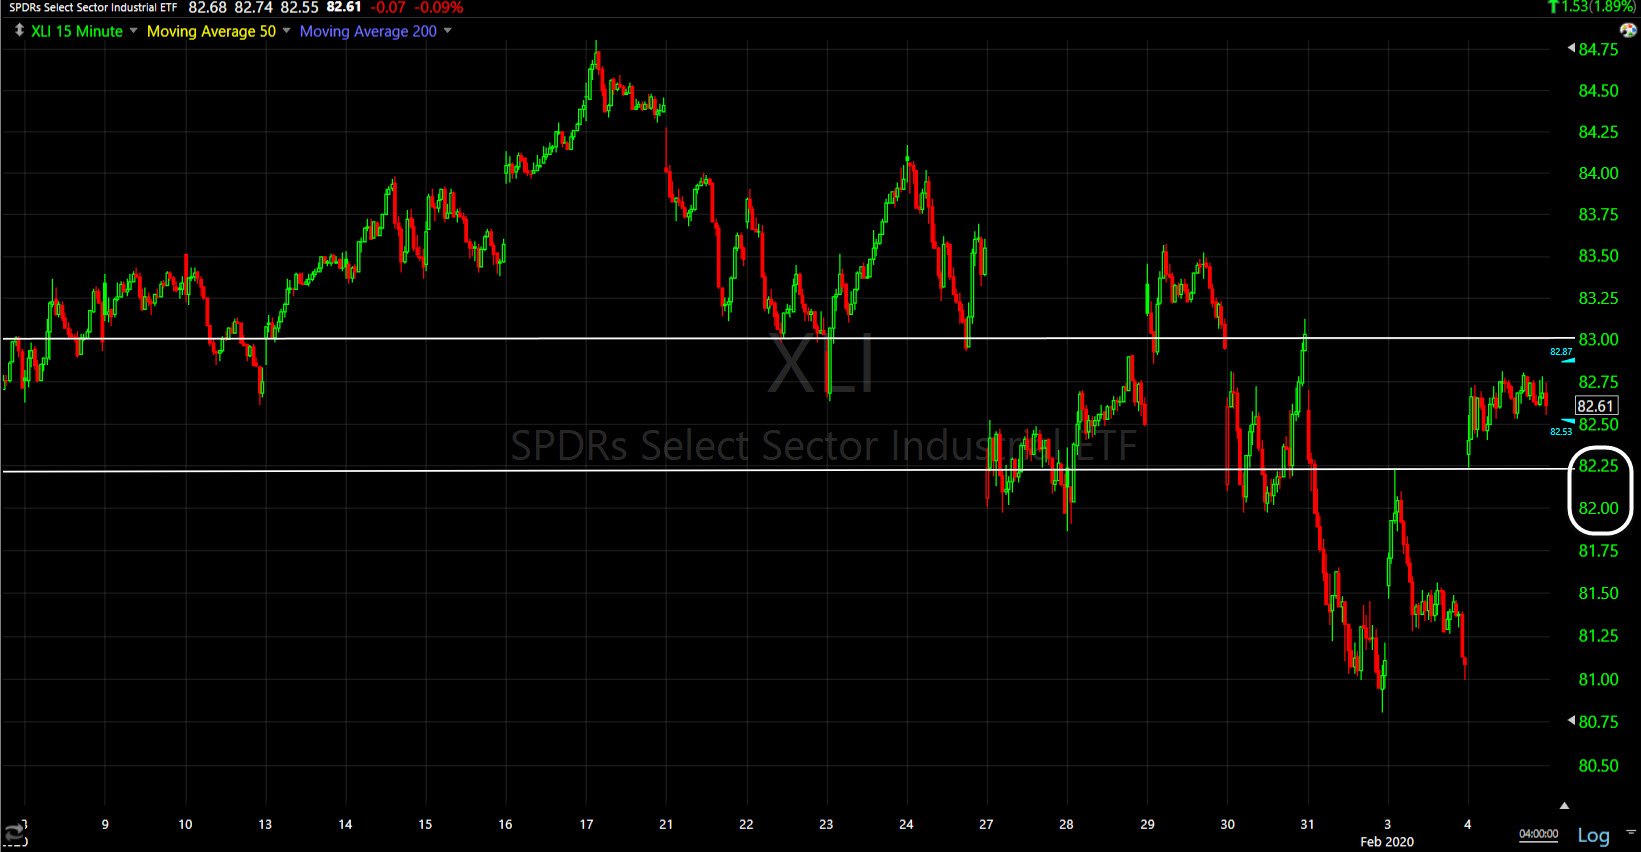
Industrial sector (15m) is a bounce to a lower high, but I consider it stronger or more significant being since it’s above the $82-$82.25 support.
Then there are a couple of sectors that are outliers.
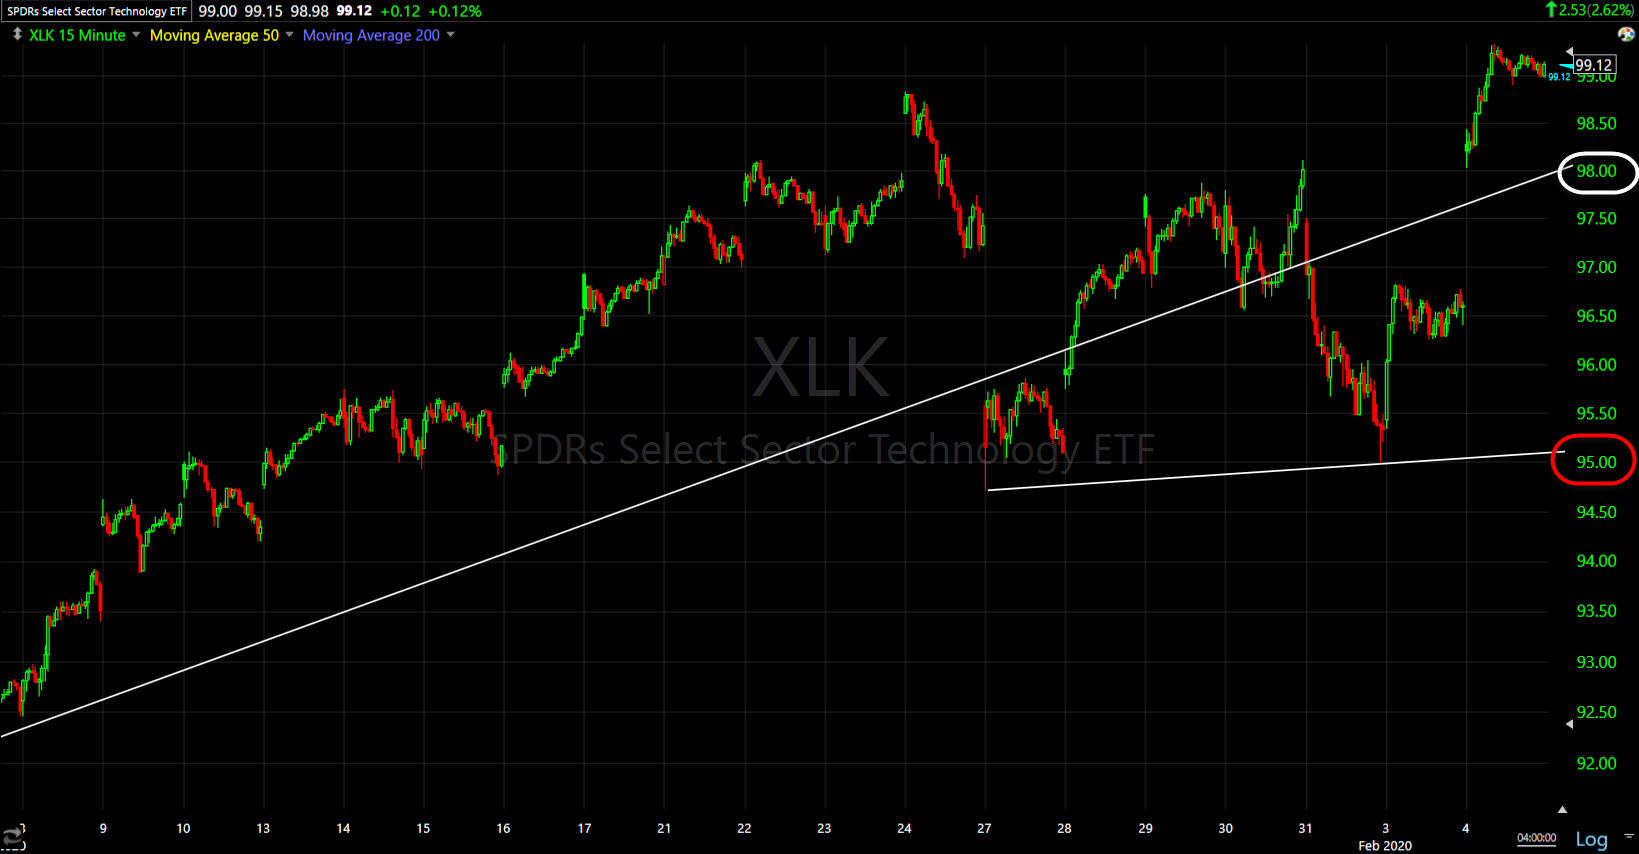 Technology (15m) I cleaned up the trend lines here as the December/January trends near $98 and local support near $95 are the key levels. It has been my expectation that Technology will be the last sector to drop. It’s the most heavily weighted and influential sector for the broader market. Apple and Microsoft were driving the sector today, which is why I was paying close attention to what was happening on their charts.
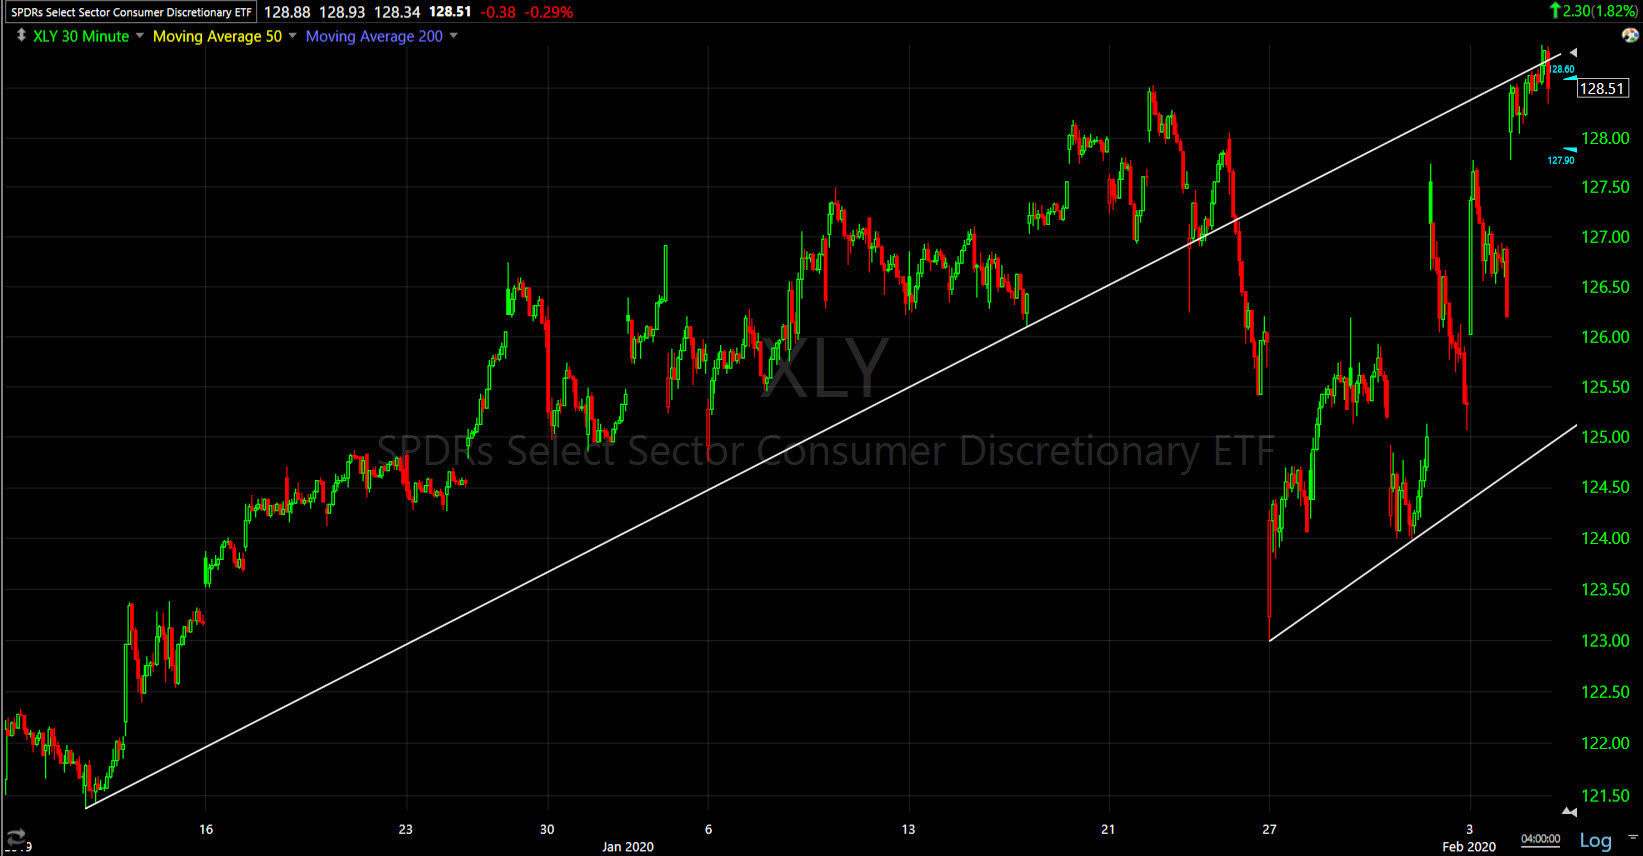 Consumer Discretionary (30m) another FANG-heavy sector (AMZN is the most influential component). It’s back-testing its primary up trend, but made a higher closing high today like Technology.
On the other side of outlier…
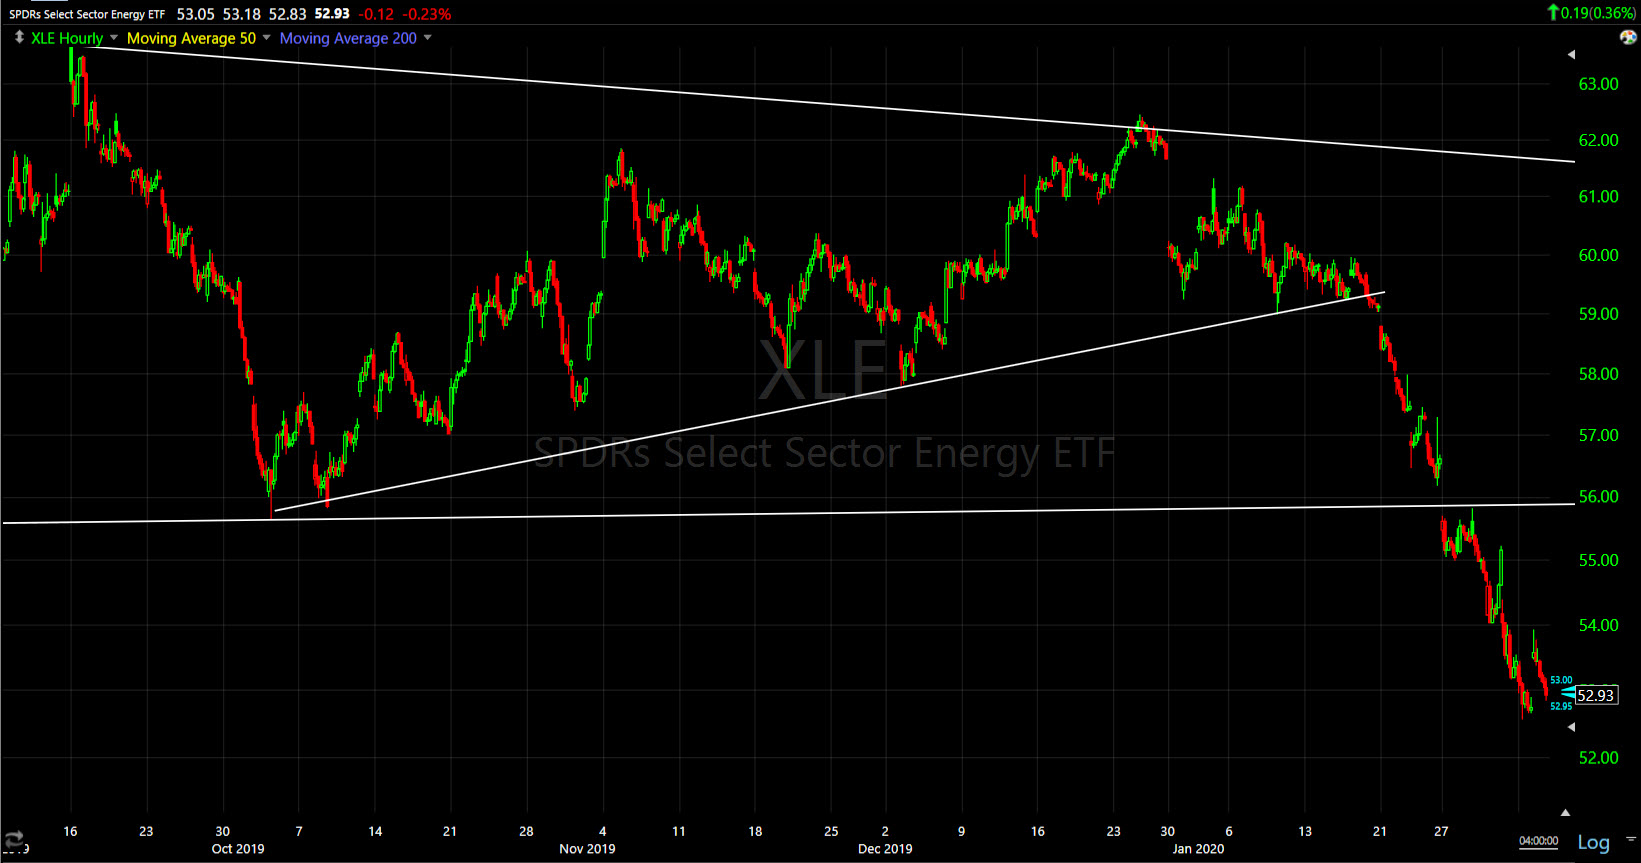
Energy (60m) at the lowest level since the 2016 global slowdown. Keep an eye on Crude as it will have an influence on this sector. See the update from earlier today, it’s linked below.
Internals
Advancers (2058) outpaced Decliners (822) by a margin of 2:1 on heavier volume of 933.6 mln. shares.
The Dominant price/volume relationship came in at Close Up/Volume Down, which is the most bearish, but due to the heavier overall volume on the day, Close Up/Volume Up was the second most dominant relationship, which is the most bullish.
With advancers more than 2:1 over decliners, a majority of S&P sectors closing higher, and the Close Up/Volume Down price-volume relationship, today registers as a 1-day overbought. However, the heavier overall volume diminishes the reading’s importance.
Market breadth didn’t improve much despite today’s broad participation. It was the mega-cap stocks and mega-cap tech stocks that led the market as illustrated below.
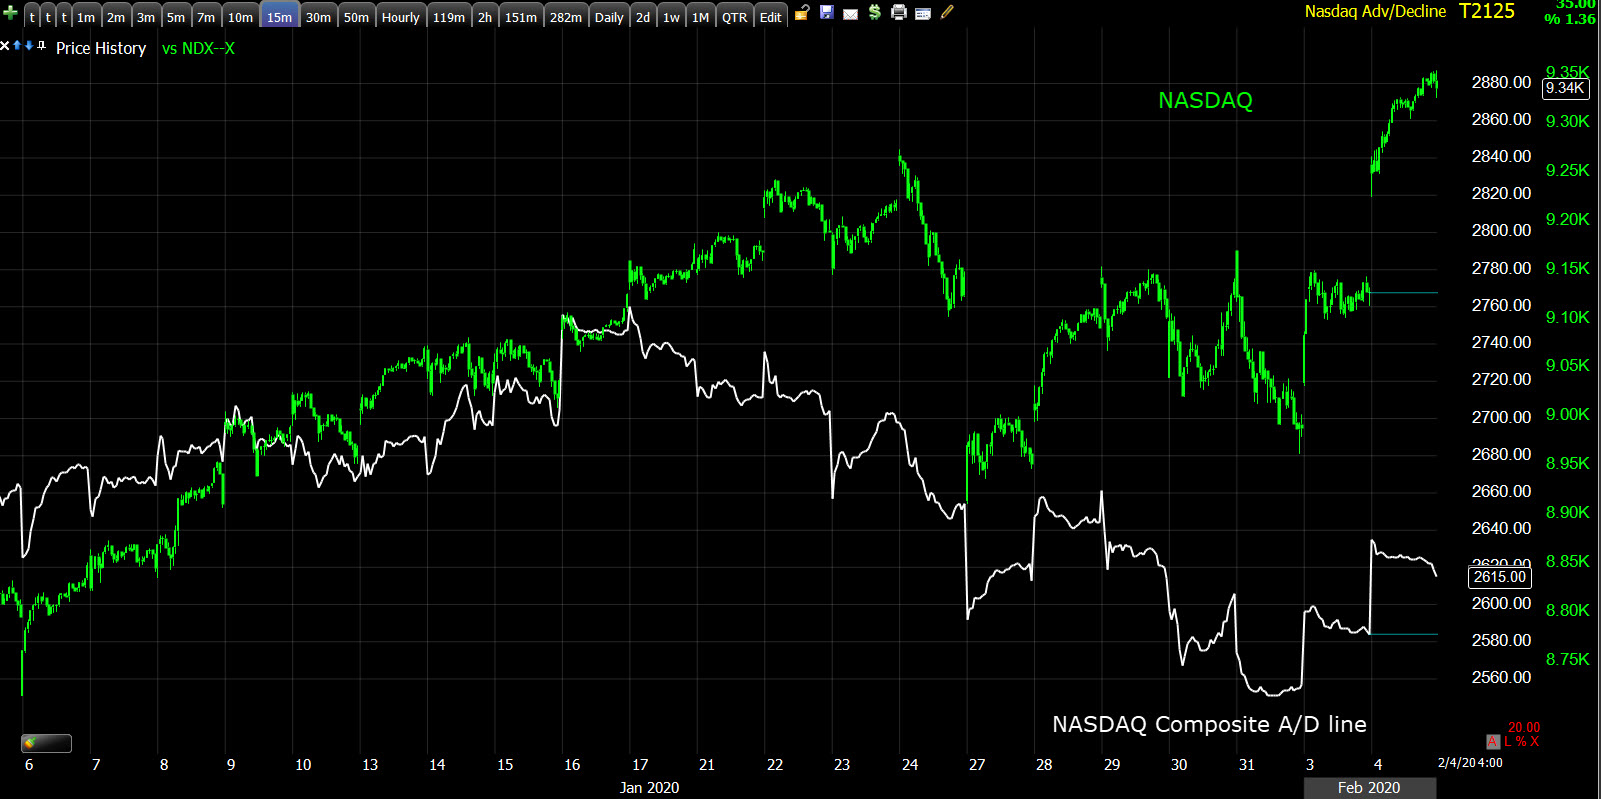 NASDAQ 100 and NASDAQ Composite’s Advance/Decline Line (15m). The NYSE’s A/D line is nearly identical.
To put a little finer point on the breadth situation…
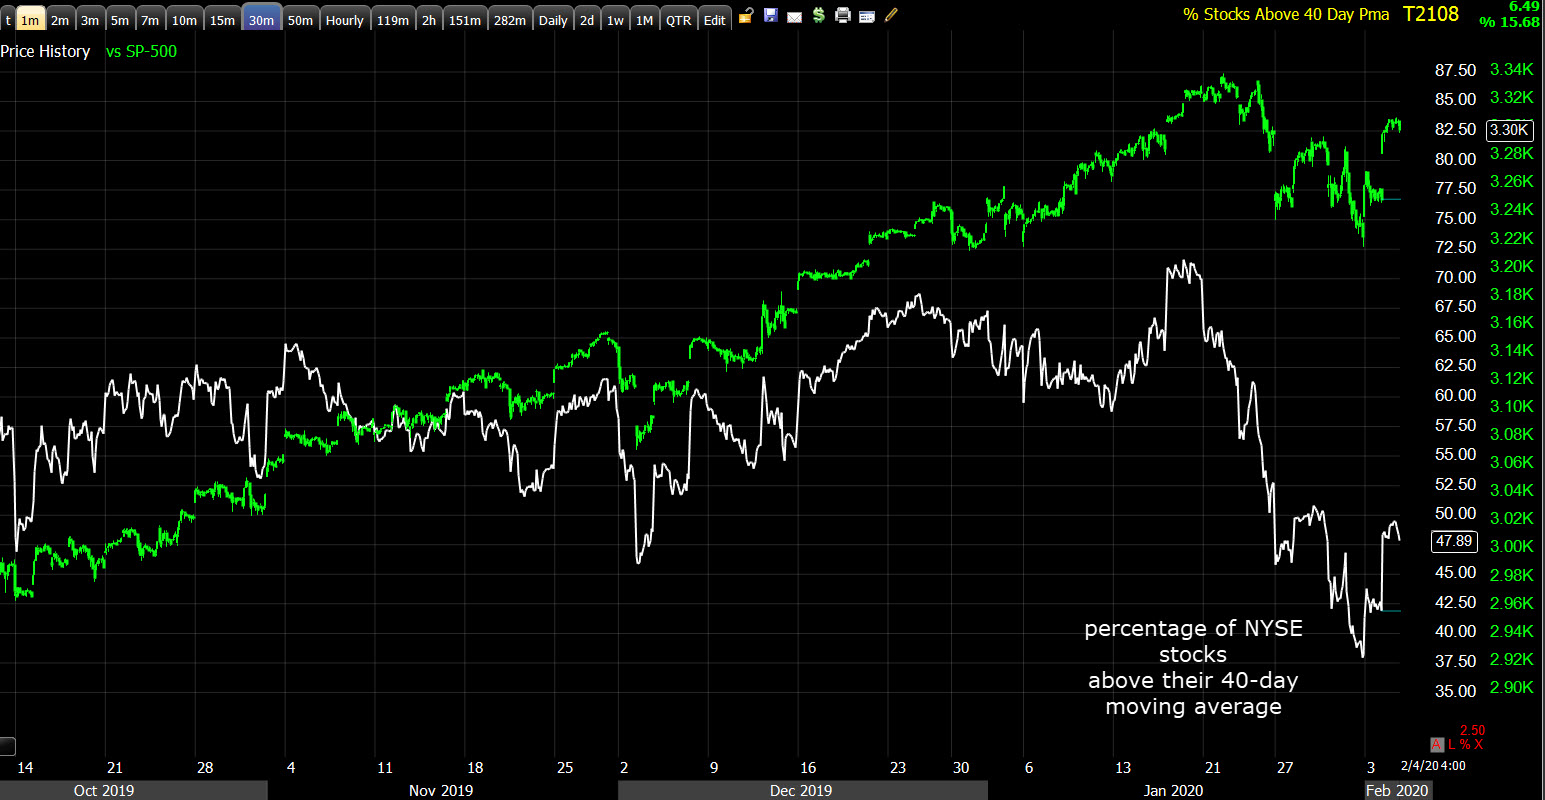 SP-500 and percentage of NYSE stocks above their 40-day moving average. Yesterday’s low reading was the lowest since the end of September. Today’s advance didn’t change the lower high/low trend here either.
What today did do is alleviate oversold conditions.
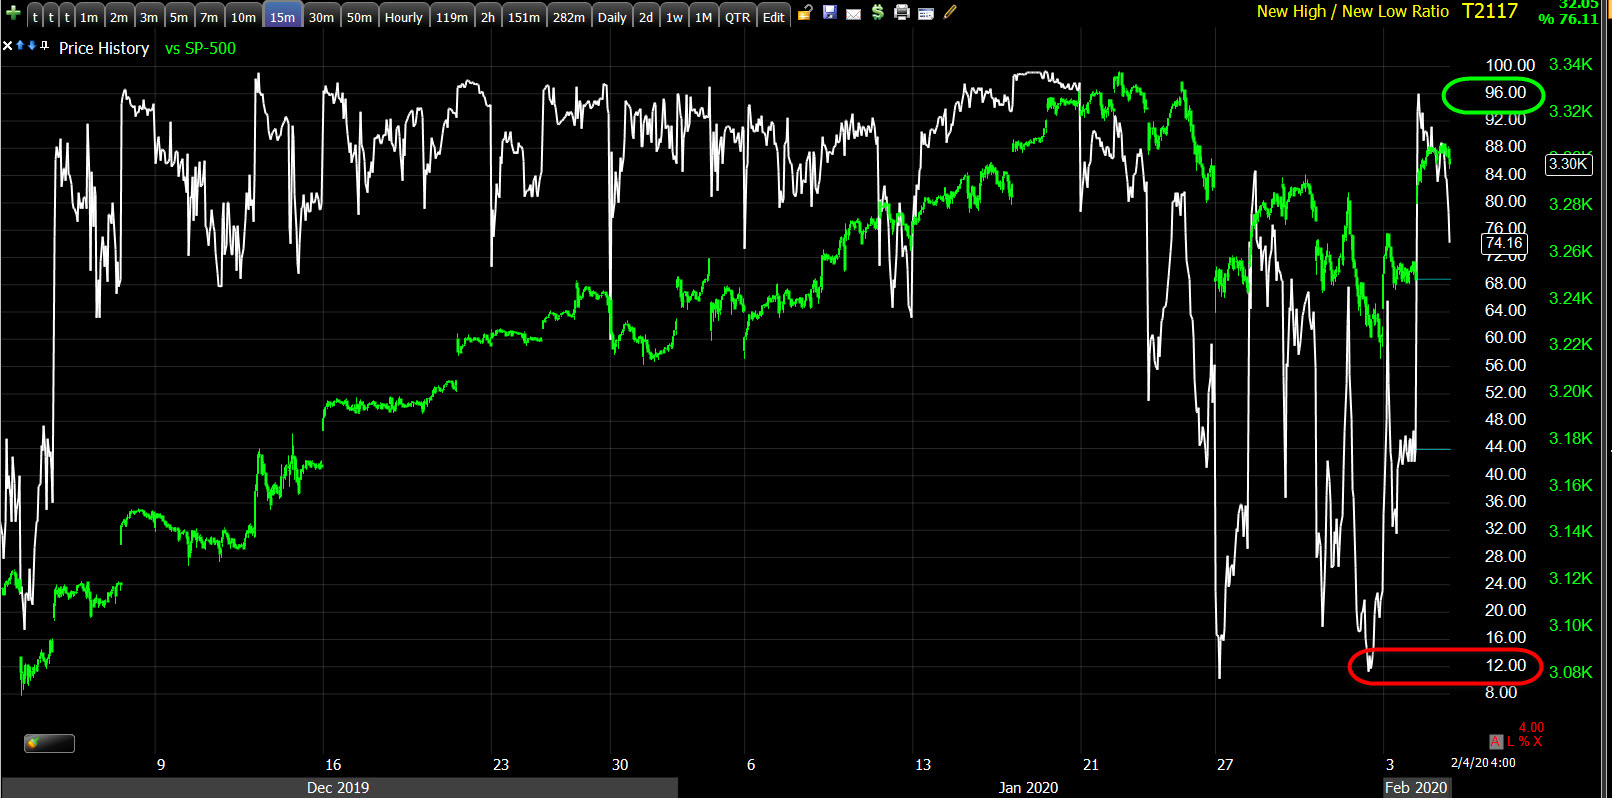 SP-500 (15m) and NYSE New High/Low Ratio – the indicator hit the lowest (most oversold) since October 8th, in one day it moved to overbought. I do not like entering new short positions when this indicator is in deep oversold territory.
Treasuries
Safe haven assets including treasuries were sold. The 2-year yield rose six basis points to 1.41%, and the 10-year yield rose eight basis points to 1.60% in slight curve steepening trade. Still, today was little more than a correction and does nothing to close the huge divergence between bond yields and stocks.
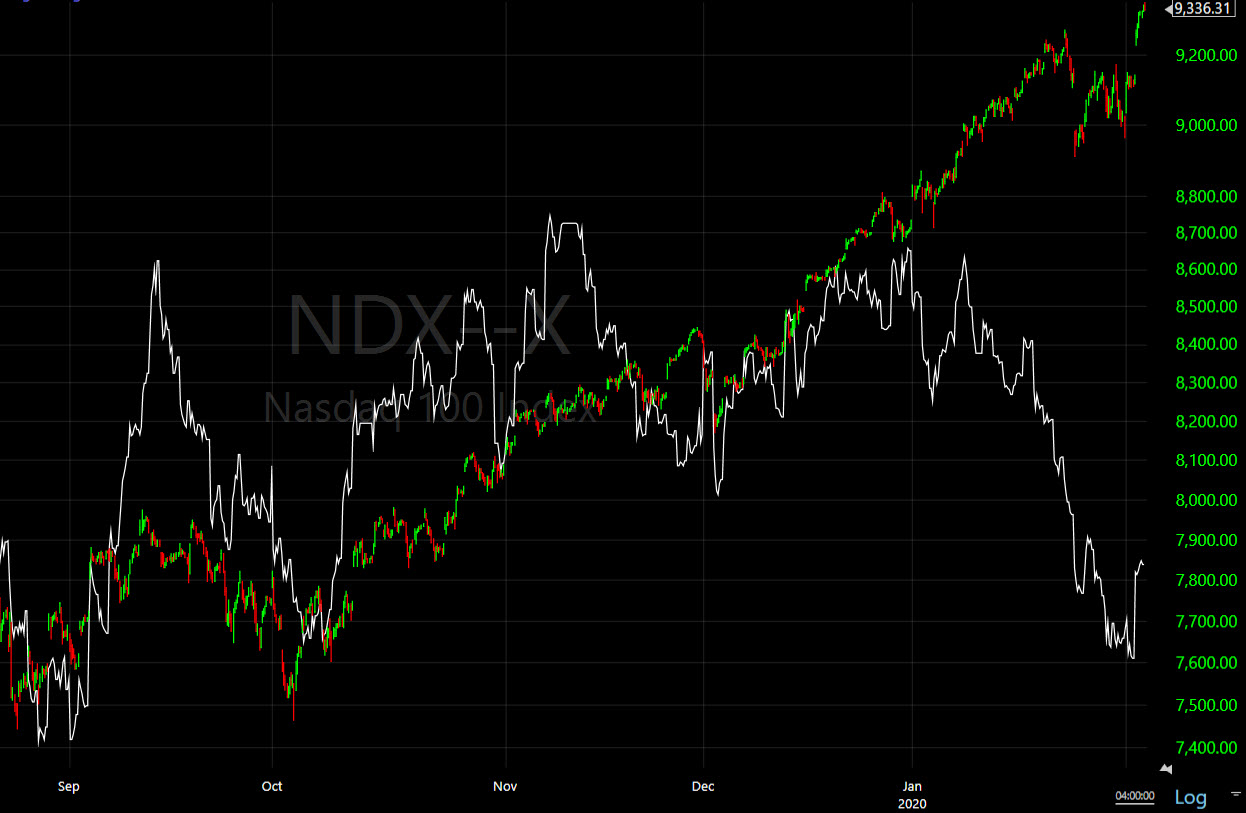
NASDAQ 100 and 30-year yield where the divergence is the widest.
Currencies and Commodities
The U.S. Dollar Index advanced +0.1% to 97.94.
The Chinese Yuan rallied after the PBoC’s easing, enough to get it back above $7 and head off potential complaints from the U.S. Treasury over charges of competitive devaluation…
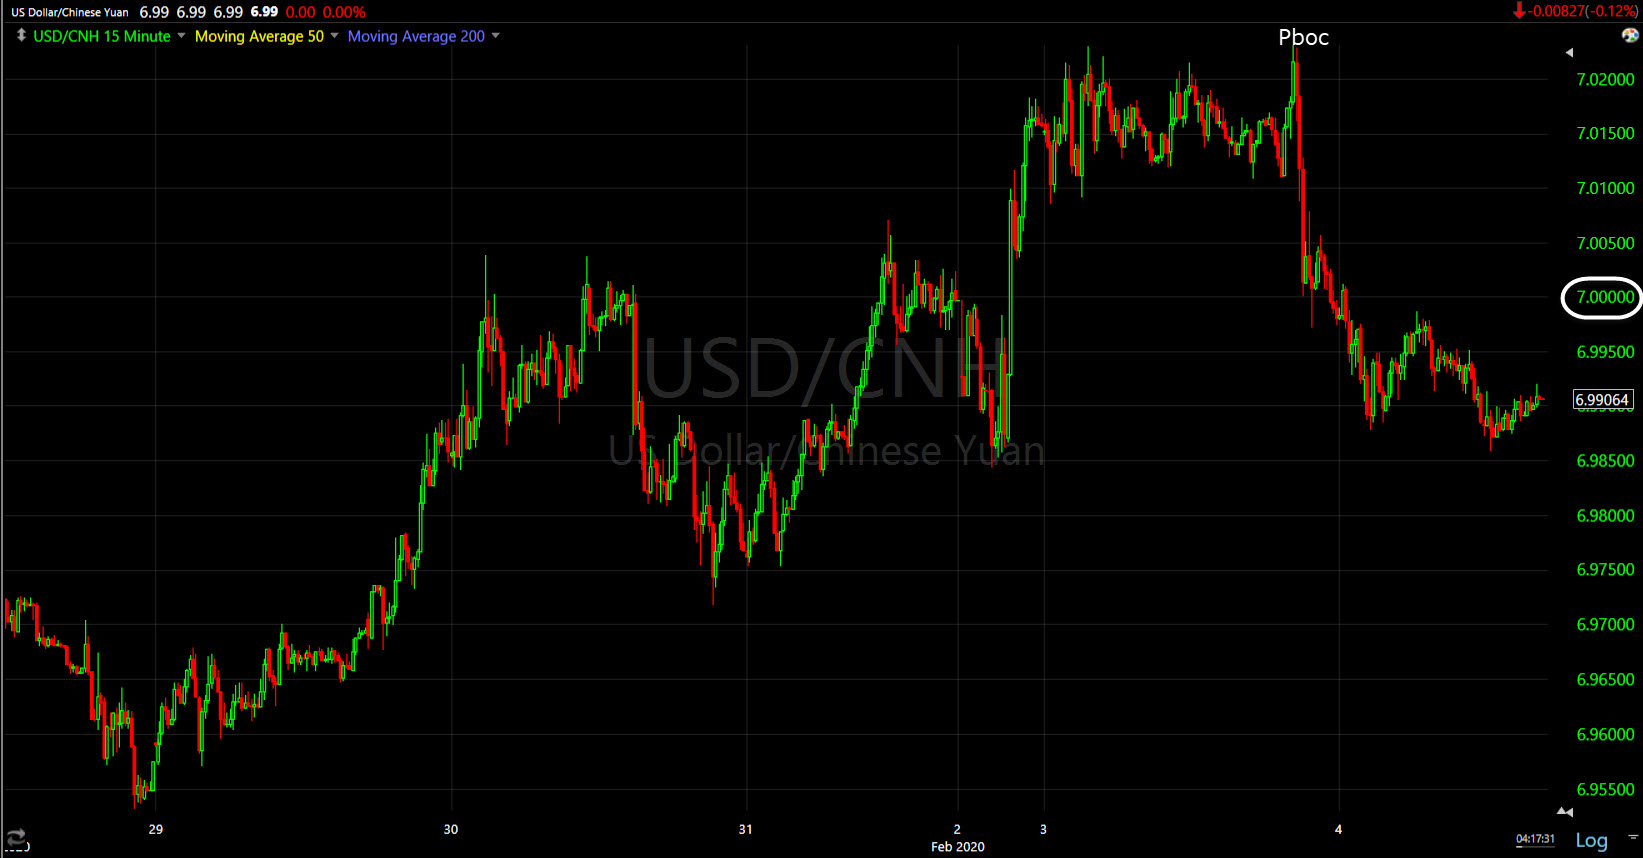 USD/CNH (15m)
It was not a meaningful move otherwise, which highlights that today’s market gains were much more liquidity driven, rather than diminishing concerns about the corona virus’ impact on growth.
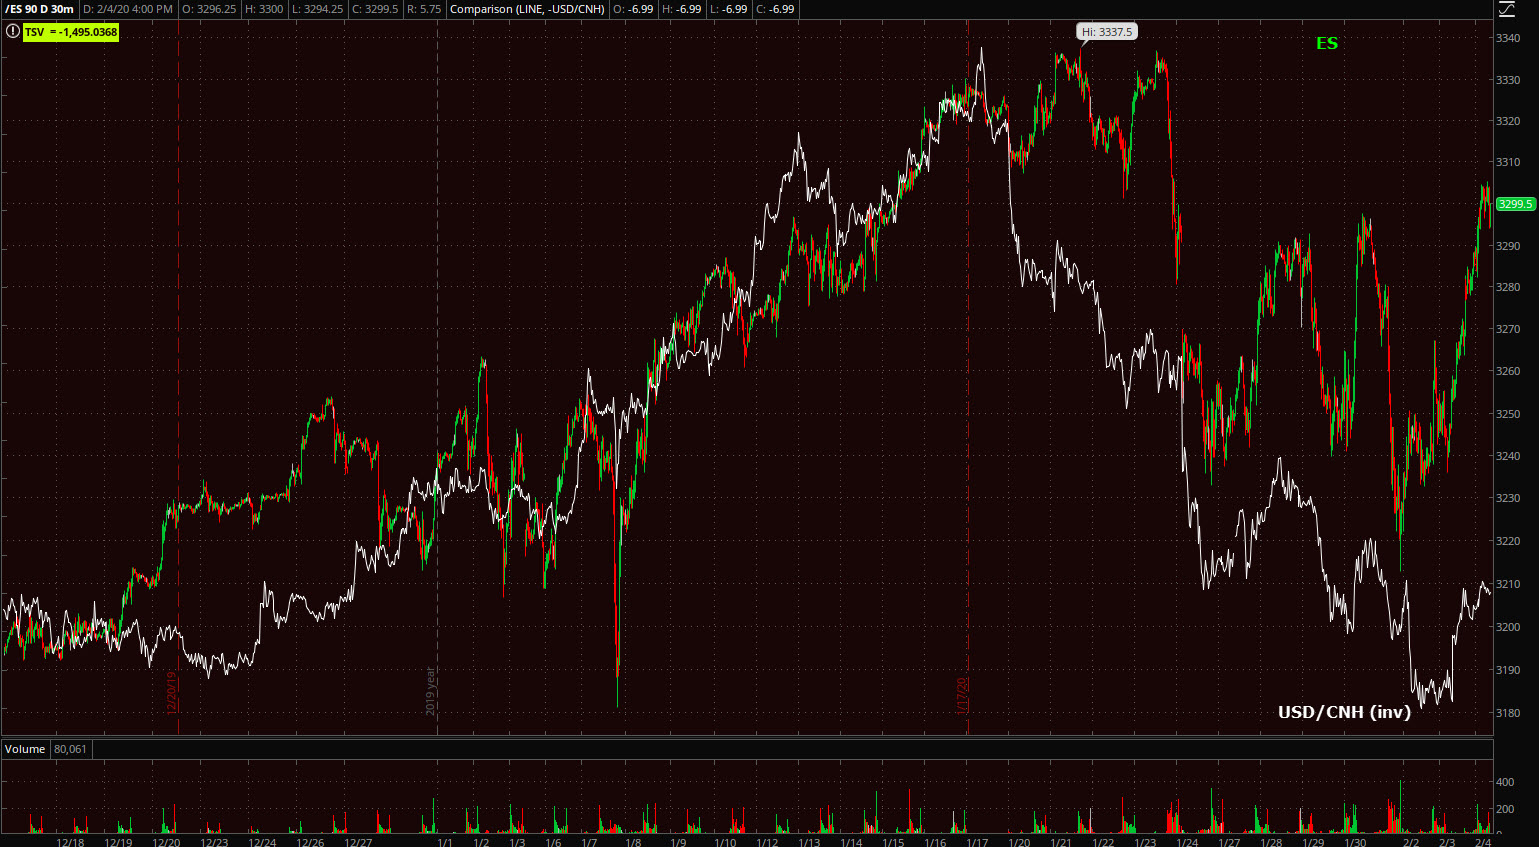
S&P futures (30m) and USD/CNH (inverted). Both move up together after the phase I trade deal in mid-December as economic tensions deescalate. The Yuan shows weakness likely related to the Corona virus about the same time as small caps’ and cyclical sector weakness, leading the S&P lower. S&P made a higher high relative to last week, the yuan made a lower high.
In another sign that today’s stock gains were liquidity driven rather than a materiel reassessment of the virus’ potential impact… WTI crude gave up a +2.9% intraday gain and fell further into what the financial media label as bear market territory (loss of 20% or more). Crude ended -0.9% to $49.61/bbl. Crude is at a level where it has found support over the last 8 months. It closed a little below the level (WTI $50.50 area) today, but it’s not that far from it. I put out an update earlier today – Crude Update– whether you trad crude or not, it’s probably a good idea to be aware of the level as it could have a big technical impact going forward, and is a reflection of a big expected economic impact moving forward (like Copper).
Gold futures fell -1.7% to $1555.70/ozt. as safe haven assets were sold today. I was just saying last night that I do not want to chase TLT, Gold and VIX, rather I’d prefer a pull back.
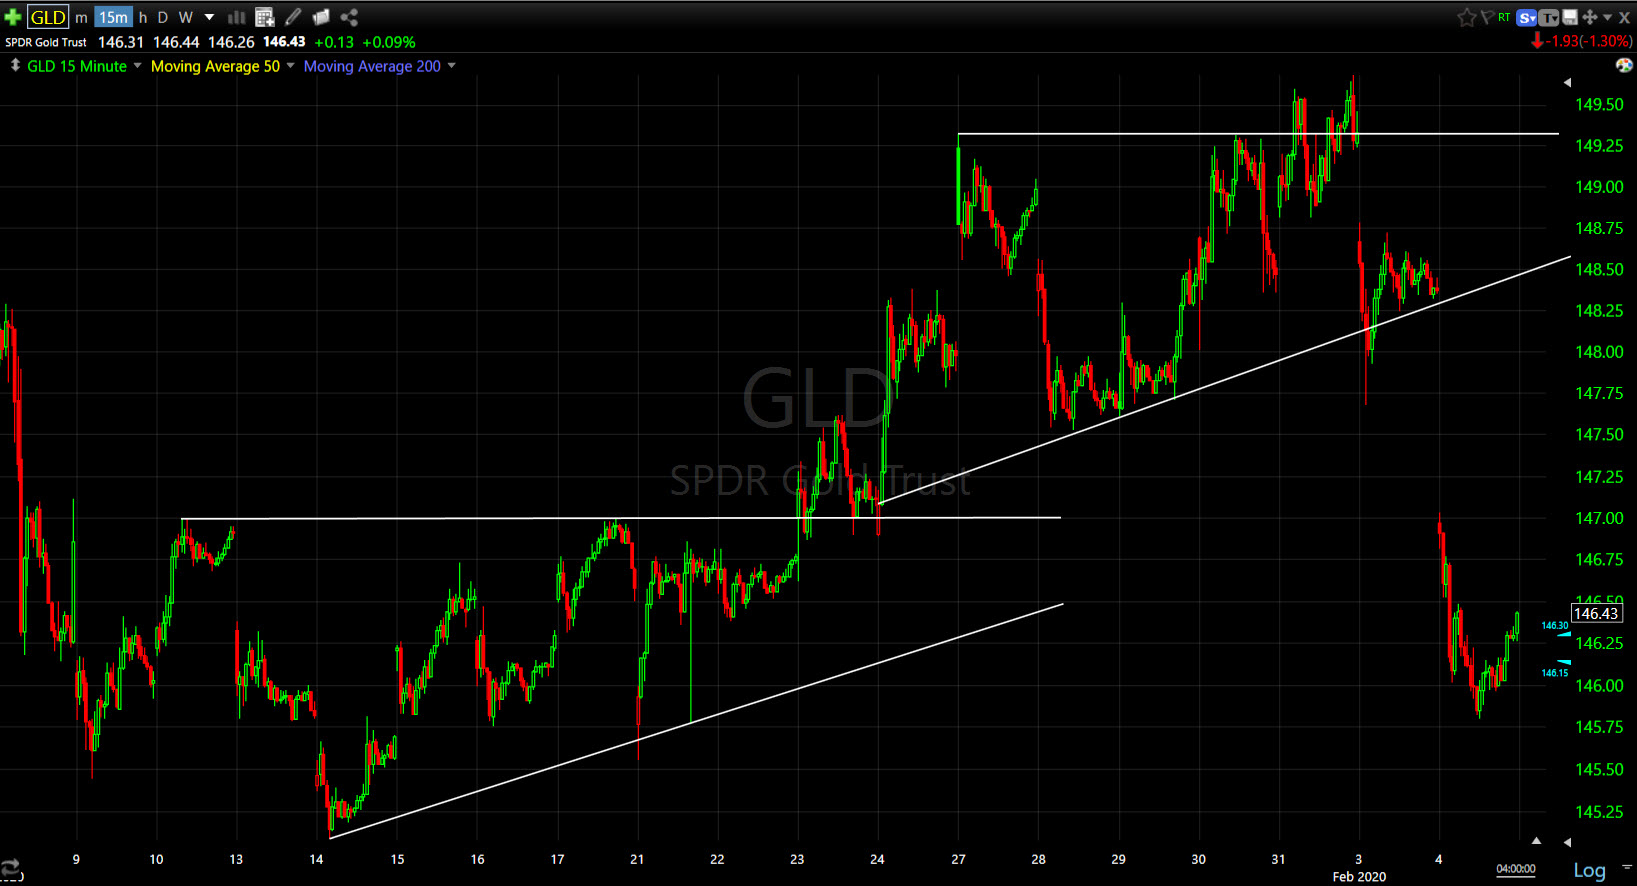
GLD (15m) the exodus from the safe haven trade is obvious on GLD’s chart above, breaking under last week’s triangle consolidation. There was some activity on 3C charts this afternoon starting with volatility, then gold and Treasuries. The signals are not strong enough for me to act on, but it’s a start. I’ll wait and see what develops in terms of price action. If there’s a consolidation with a bearish bias, then Gold could have another 1.75% to 2.5% of near term downside.
Summary
Liquidity is really the key word today as central banks are taking on the economic cycle, the boom-bust cycle, global warming, and a potential pandemic viral outbreak. They sure seem to be confident of their omnipotence. If they have to expend hundreds of billions of dollars in crisis-era programs when the stocks market is just off record highs, it makes me wonder what they’ll have to do when there’s an actual recession and unemployment is moving up since they are the ones who have fueled the market’s addiction to liquidity. In the PBoC’s case, the response is reasonable if not expected. They’ve actually tried to be more responsible as it relates to encouraging debt and risky behavior over the last year. Still I’m not sure that printing money can offset the disruption in global supply chains that’s expanding every day. That’s what the divergence between stocks on one side, and commodities, currencies and the bond market on the other side, is really about.
The most notable developments were 3C charts this afternoon, primarily NASDAQ/QQQ starting with this post Intraday Update – AAPL/MSFT/QQQ.
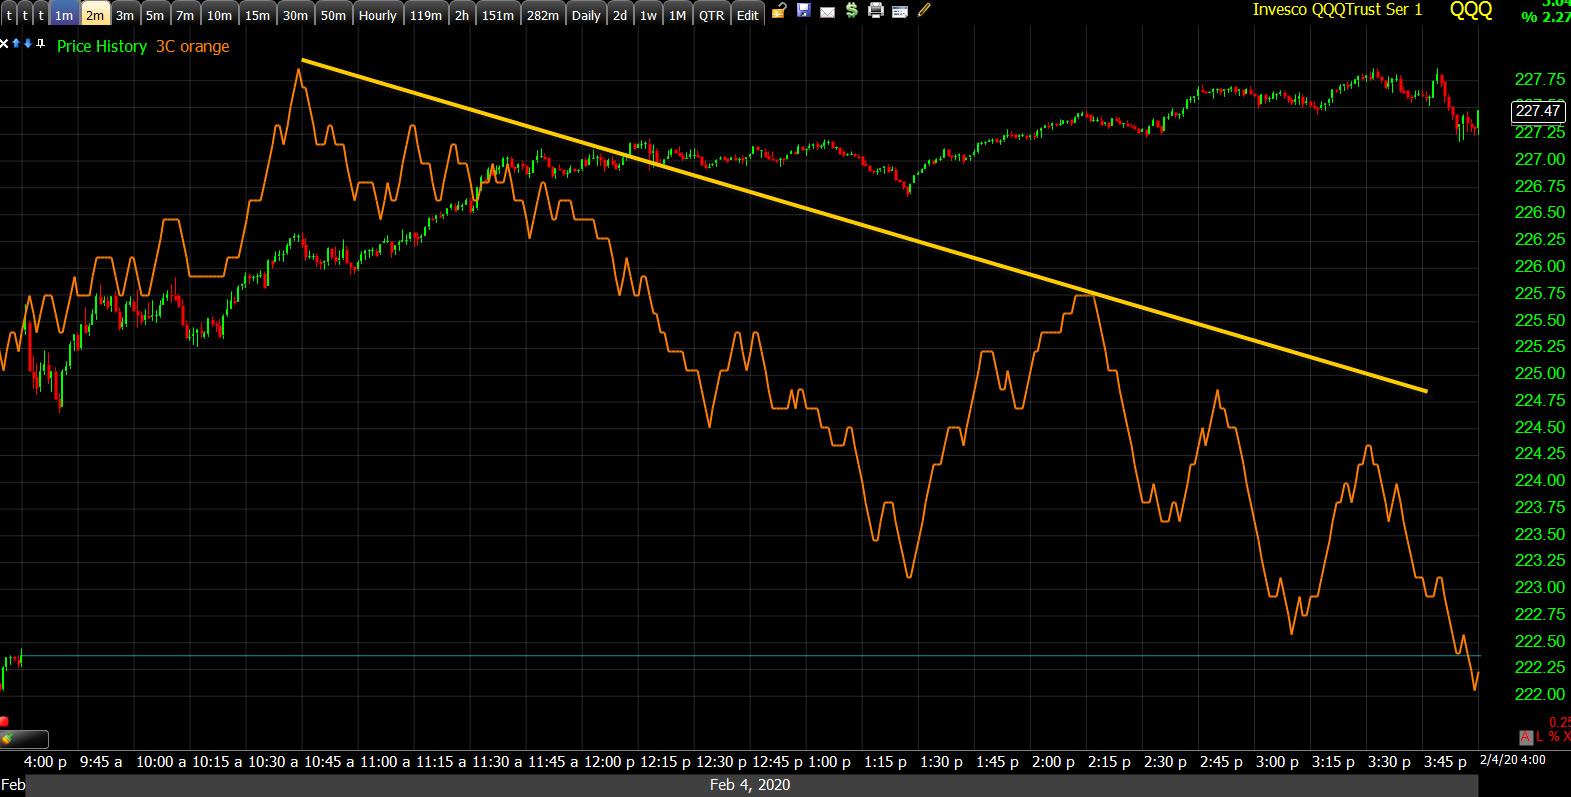 QQQ (1m) moved from confirmation of opening gains, to non-confirmation and border line leading negative. NASDAQ 100 futures did not do a good job confirming on Monday, or today. Russell 2000 futures looked the best, confirming from Sunday’s futures’ open.
The other averages weren’t as interesting as QQQ, but showed some of the same weaker tone this afternoon.
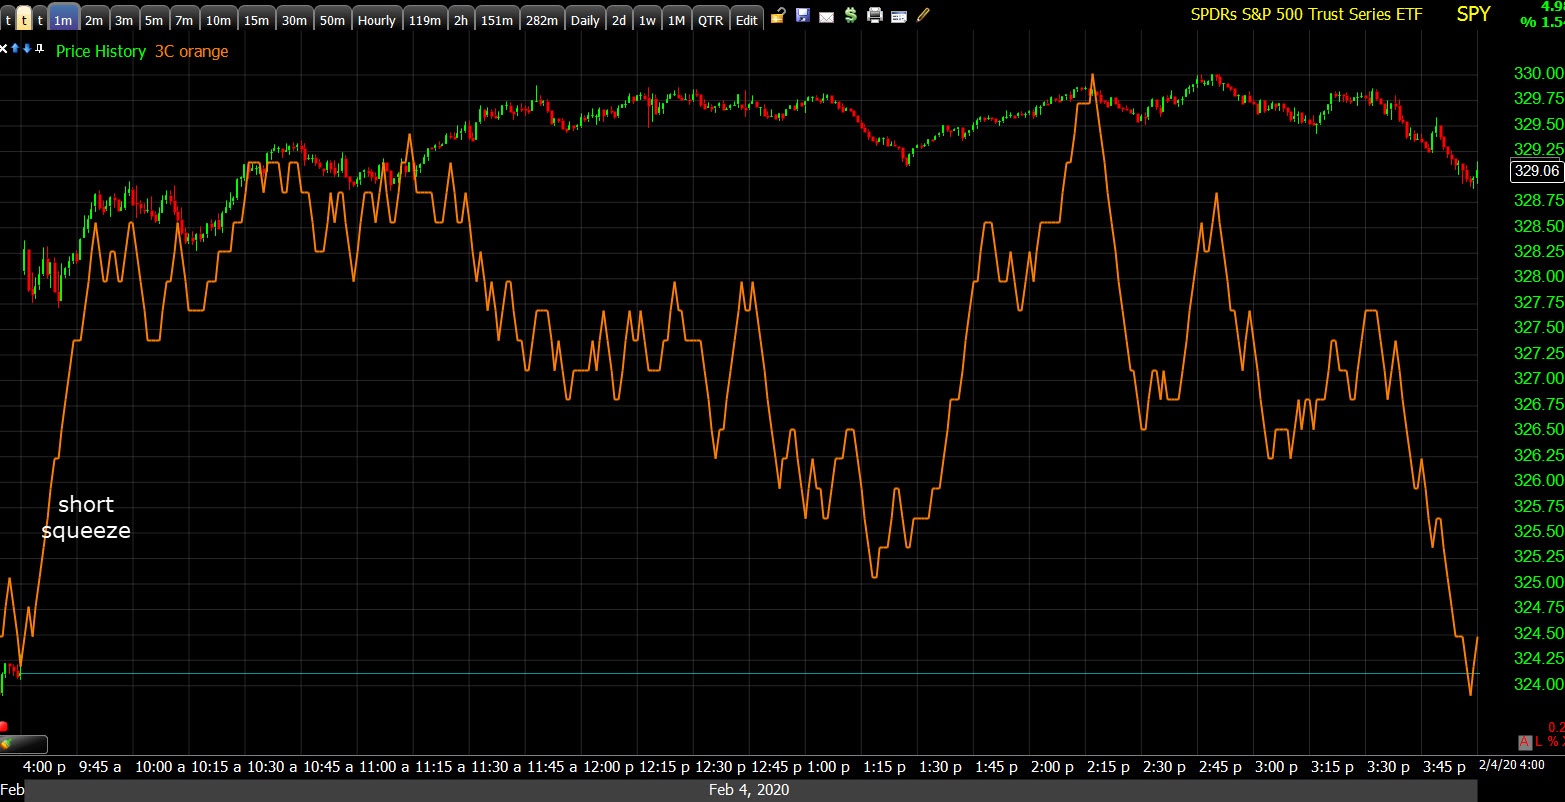 SPY (1m)
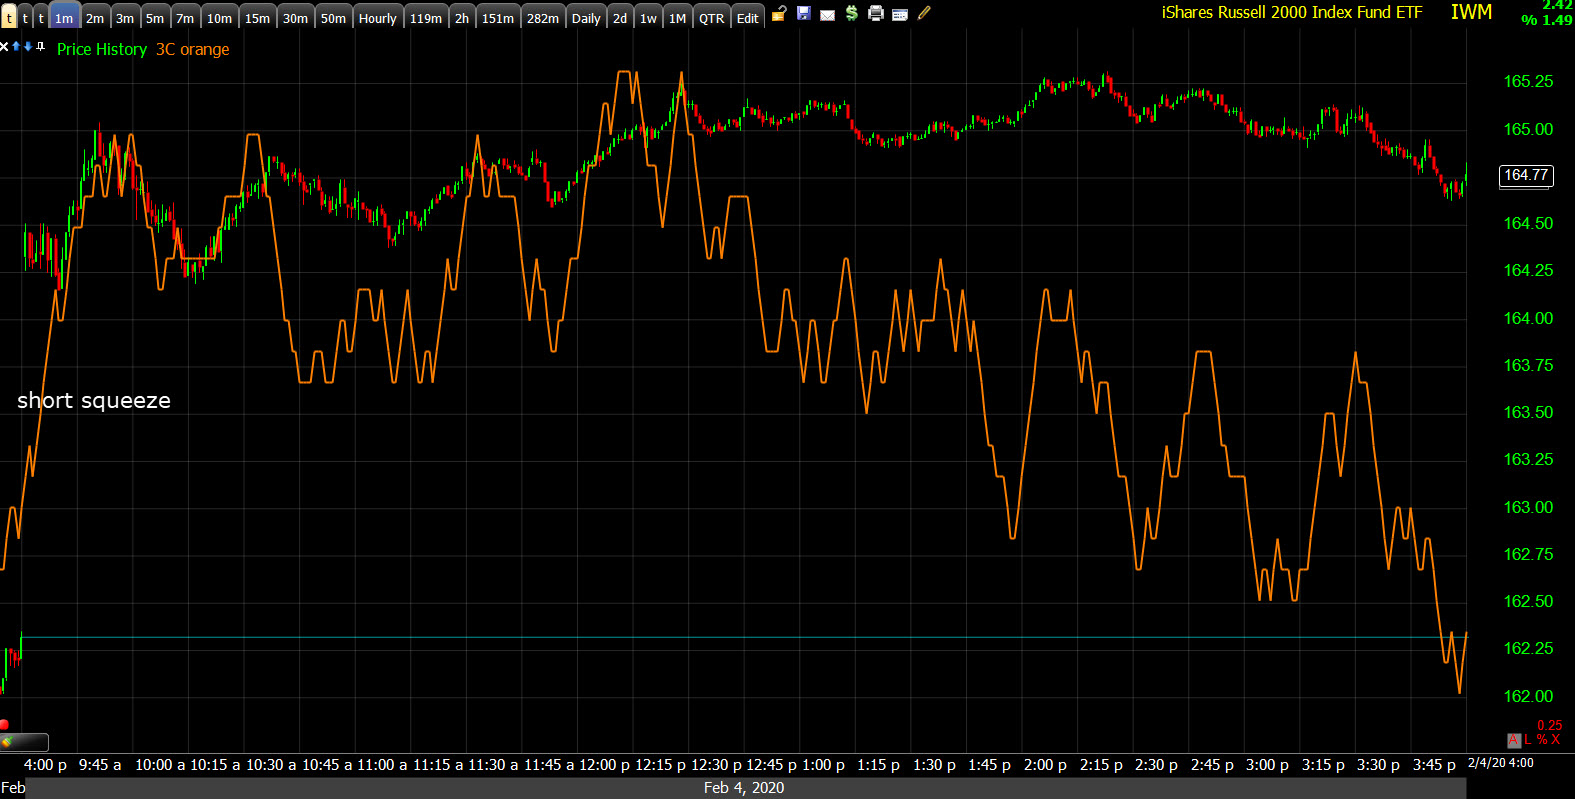 IWM (1m) confirmed better than the others the first half of the day, then fell off this afternoon.
VXX produced some interesting signals as well.
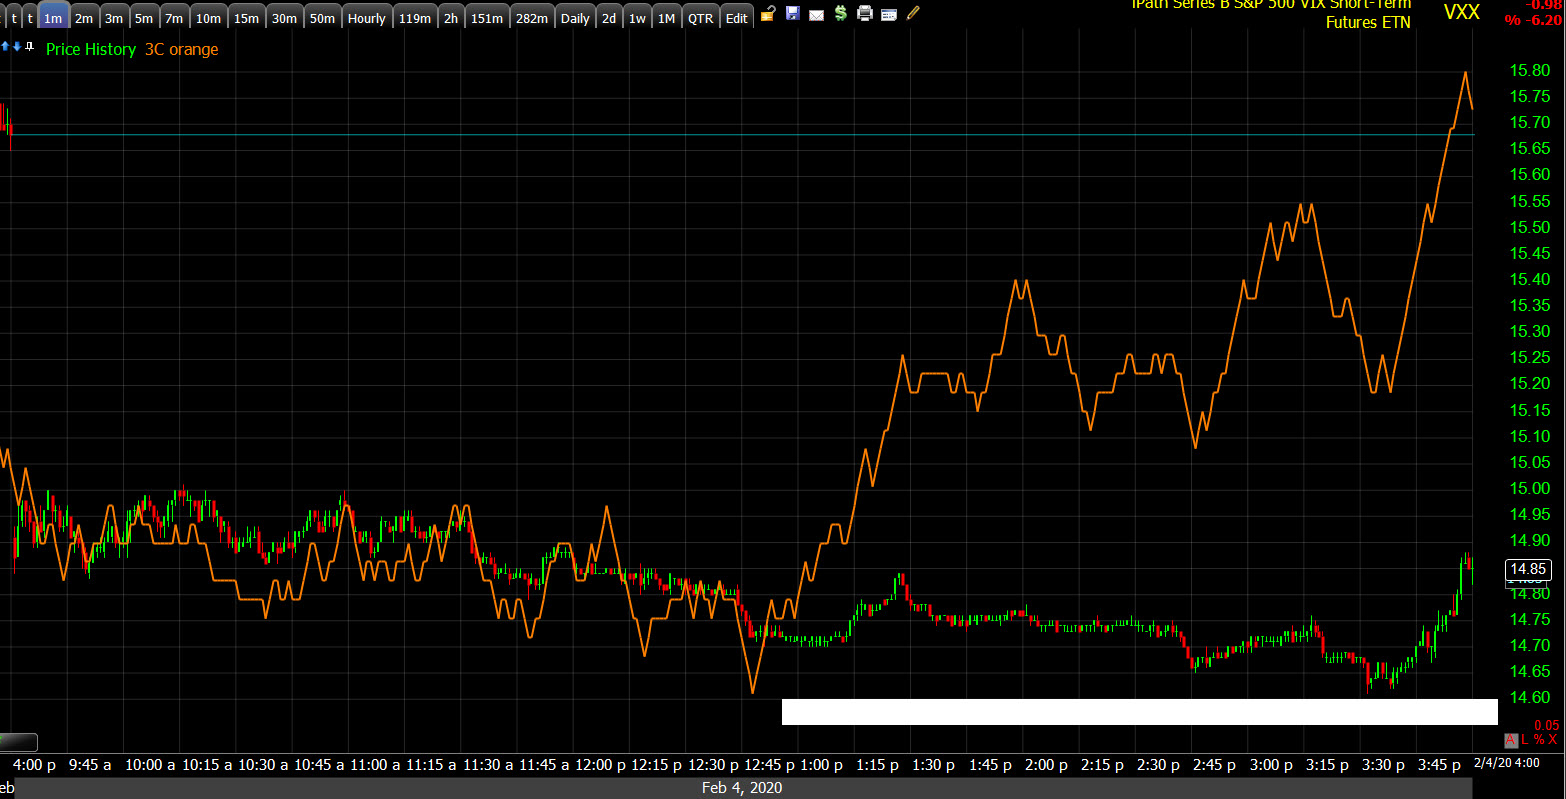 VXX (1m) positive divergence this afternoon after QQQ’s negative divergence started, covered in the next post – Intraday Follow Up.
After VXX, Gold and Treasuries and their ETFs saw some improvement. It was not that notable that I would mention it here, except that it occurred after the QQQ and VXX signals.
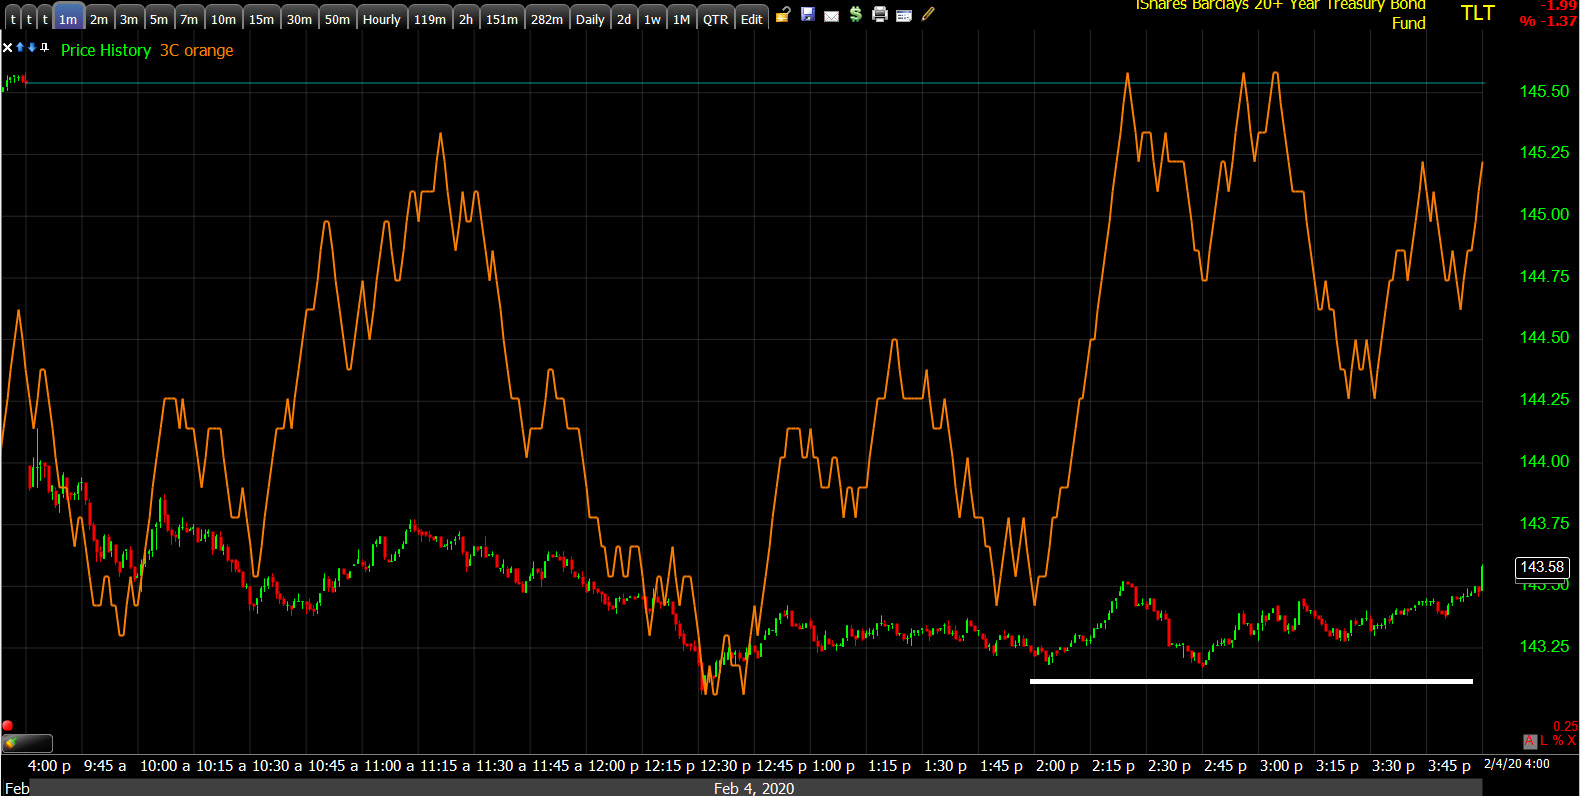 TLT (1m)
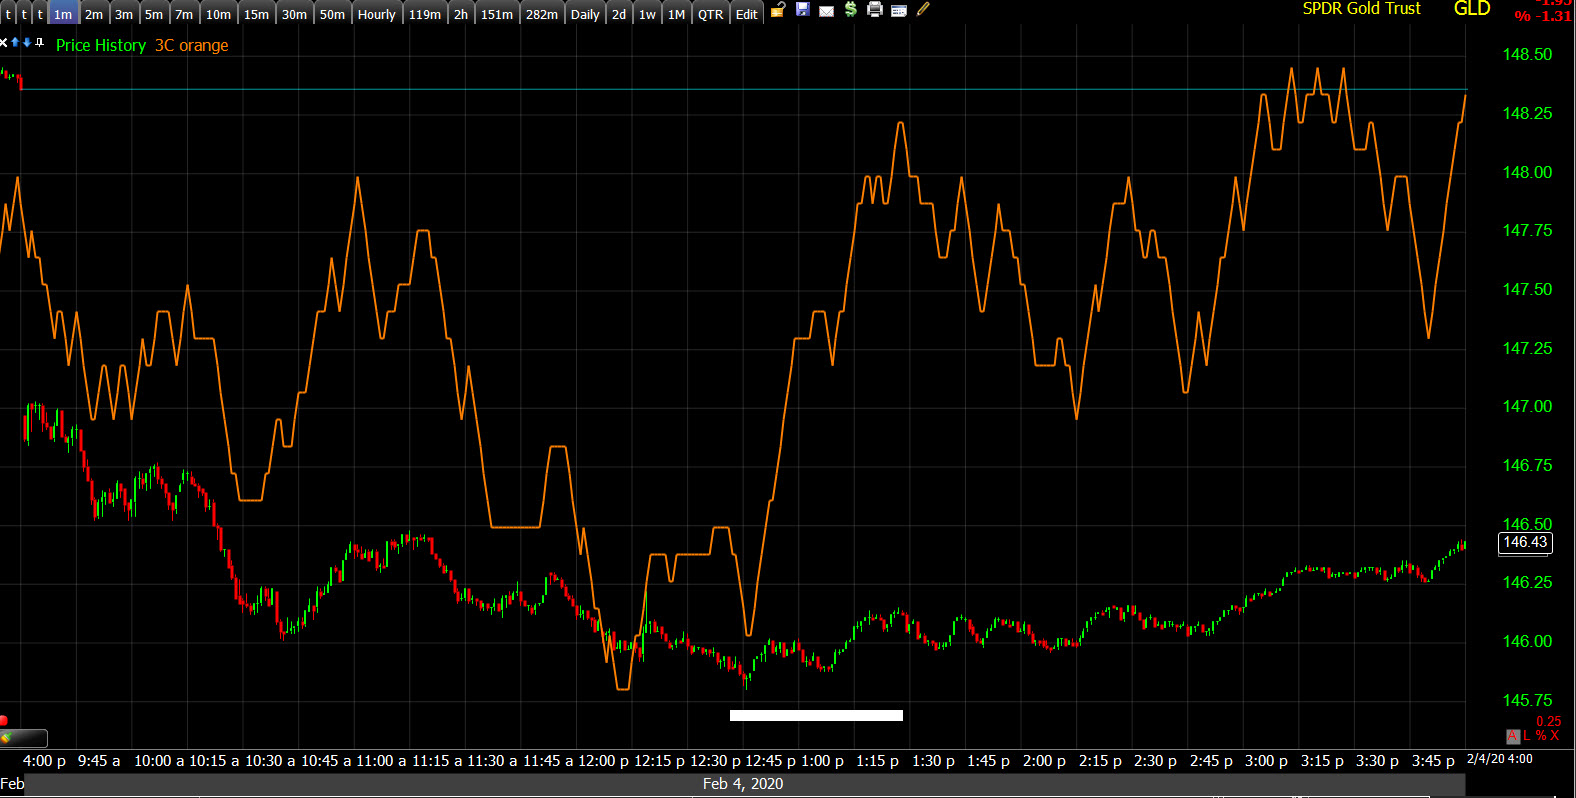 GLD (1m)
Overnight
S&P futures are down -0.25%. Index futures’ 3C charts mirror the QQQ, SPY, IWM cash session developments.
ES (1m) not confirming into the afternoon and borderline leading negative tonight.
The slightly more defensive tone in places like gold and treasuries this afternoon is mirrored in futures tonight.
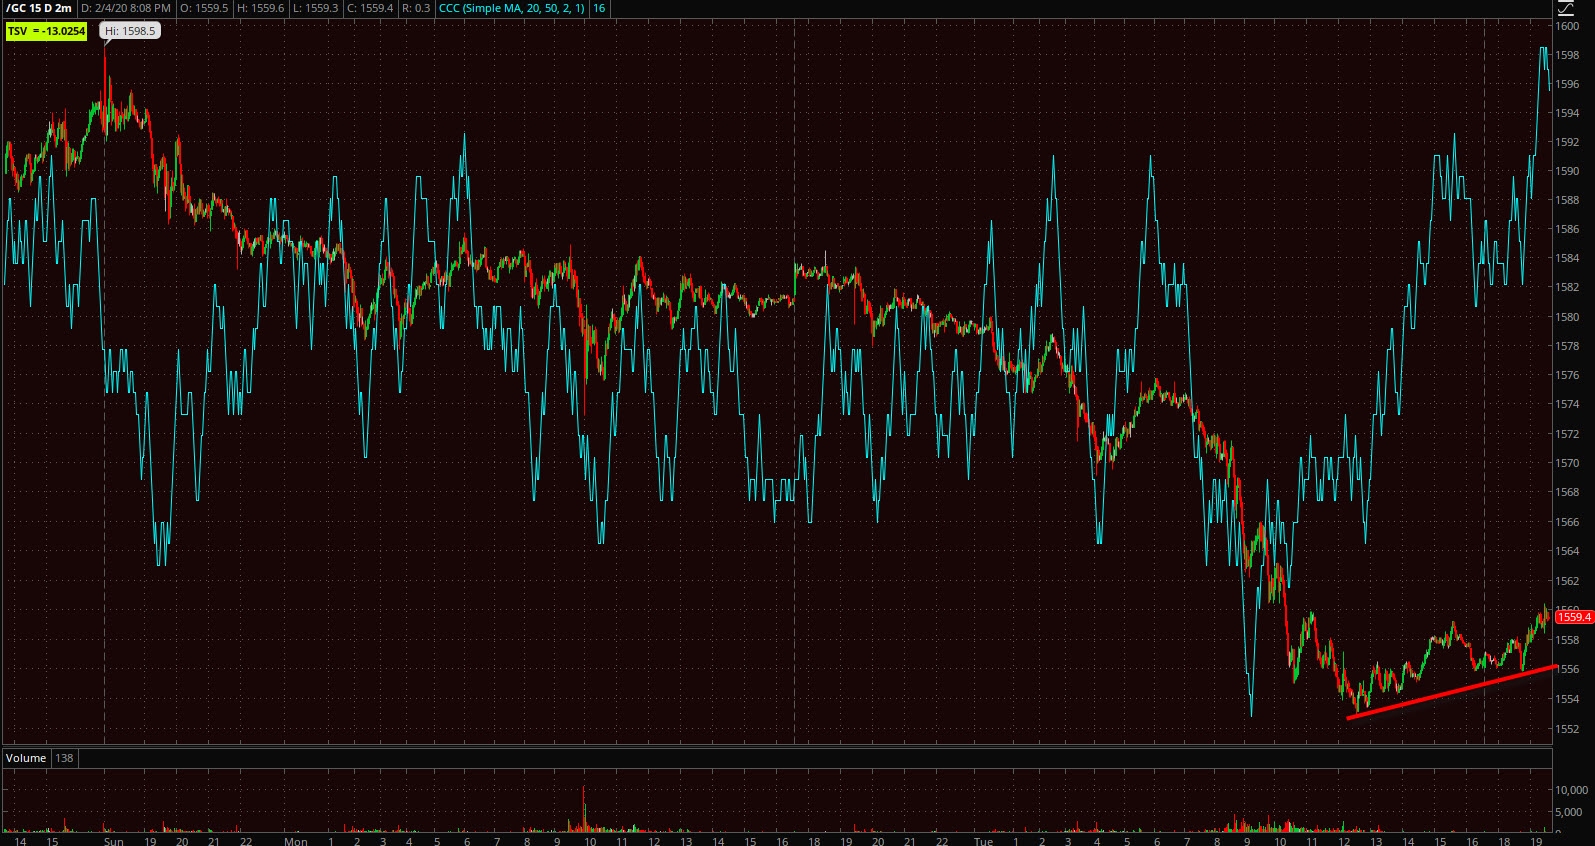 Gold futures (2m) positive 3C signal during the cash session, however it’s not enough for me to overcome the presumption that price action is a consolidation (bearish) following today’s decline with a decent probability of more to go. I’d feel better either buying after more of a pull back, or seeing price stabilize and 3C improve more.
You can use USD/JPY as a quick reference for risk sentiment.
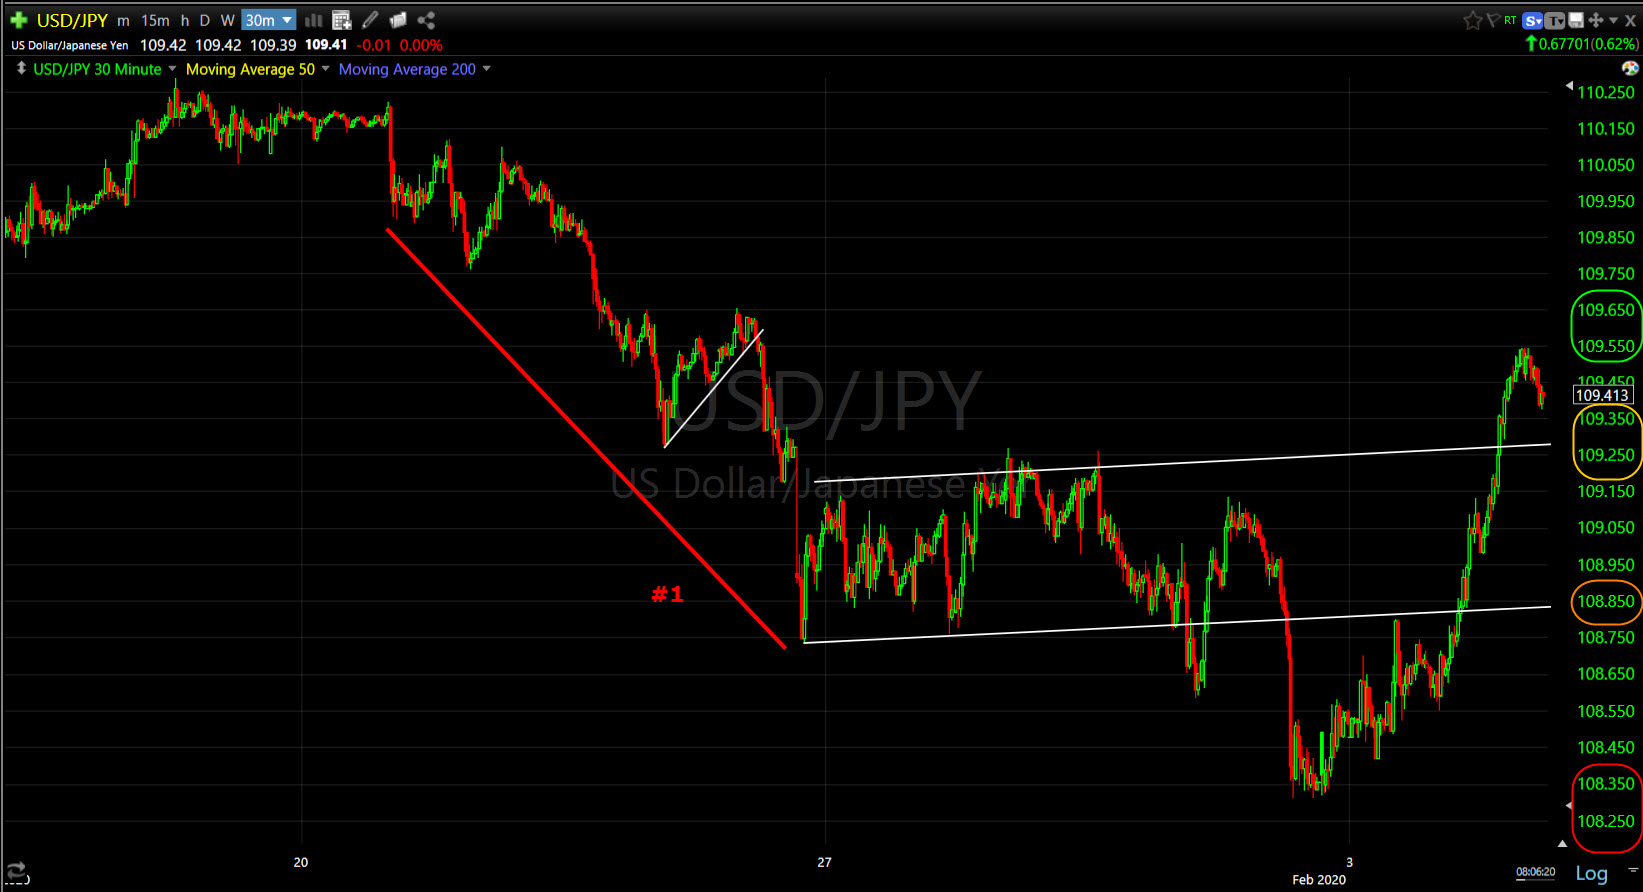
USD/JPY (30m) to the left is the first leg down. Then last week’s bearish flag consolidation mirroring the major averages, and the start of a second leg Friday. Monday’s price action was only a minor bounce to back-test the bottom of the flag (resistance), but that was blown through today amid the risk-on sentiment and selling of defensive assets.
Investors will receive the ISM Non-Manufacturing Index for January, the ADP Employment Change report for January, the Trade Balance report for December, and the weekly MBA Mortgage Applications Index on Wednesday.