Daily Wrap – Fed Ridiculousness
This morning we saw the modest lift in stock prices that I refer to as the “FOMC Drift” with a strong bias toward value stocks over growth, but by the close, one thing was certain – the FOMC and Powell were more hawkish than the market anticipated.
As expected, there was no change in the Fed funds rate which is still 5.25% to 5.50%. In fact, there was virtually no change in the FOMC policy statement from July. All of the nuggets, as suspected, were in the Summary of Economic Projections (SEP) and the Fed’s Dot-Plot.
As I wrote in the Pre-FOMC Update,
“I think the market’s attention is going to be focused on the dot-plot and the 2024-2025 projections. I’m guessing they will be higher as the Fed pushes back on market pricing of rate cuts in 2024 as the Fed needs the market to take seriously the “Higher for longer” message, even if that’s not ultimately what happens. The Fed hasn’t gone through the trouble of hiking rates this aggressively to only have the effect blunted by a market that’s pricing in rate cuts and easing financial conditions. The question is, how hard does the Fed push back?”
The answer… Pretty hard and in many cases to the point of unreasonable absurdity. The Fed’s Dot-Plot cut out 50 basis points of rate cuts for 2024.
Rates markets have already been discounting the higher for longer message from the Fed since the July FOMC, but more notably since September, which has seen financial conditions tighten significantly (not helpful for stock prices), while at the same time, macro surprise data has disappointed. As you read on, you’ll see that these facts are contradictory to the SEP, Dot-Plot and what Powell said in his press conference.
As I wrote in the Afternoon Update,
“Powell’s press conference was hard to watch without feeling a bit bad for him [embarrassed] as between the SEP, Dot-Plot and what he was saying, it was riddled with contradictions and what would appear to not be well thought-out policy/answers, although I think it’s more an issue of just being caught between a bunch of data forecasts and a view he may hold, that just don’t jibe.”
I didn’t think I’d be alone in tis assessment and was glad and humbled to see comments from Mohamed El-Erian after the close, signaling he got the same vibe as I did,
“I worry that the economic and policy signals coming out of this Federal Reserve press conference may come across to many as both confused and confusing.”
More on the FOMC today:
- The median fed funds rate estimate for 2023 was unchanged at 5.6% implying one more 25 bp hike this year, but the median estimate for 2024 was 5.1%, versus 4.6% in June, meaning the Fed’s projections in the SEP envision cutting out 50 bp of rate cuts for 2024 (and 2025) since the June SEP, a signal the Fed expects, or is trying to get the market to believe that rates are to stay higher for longer.
The Dot-Plot for 2024 removes 2 rate cuts.
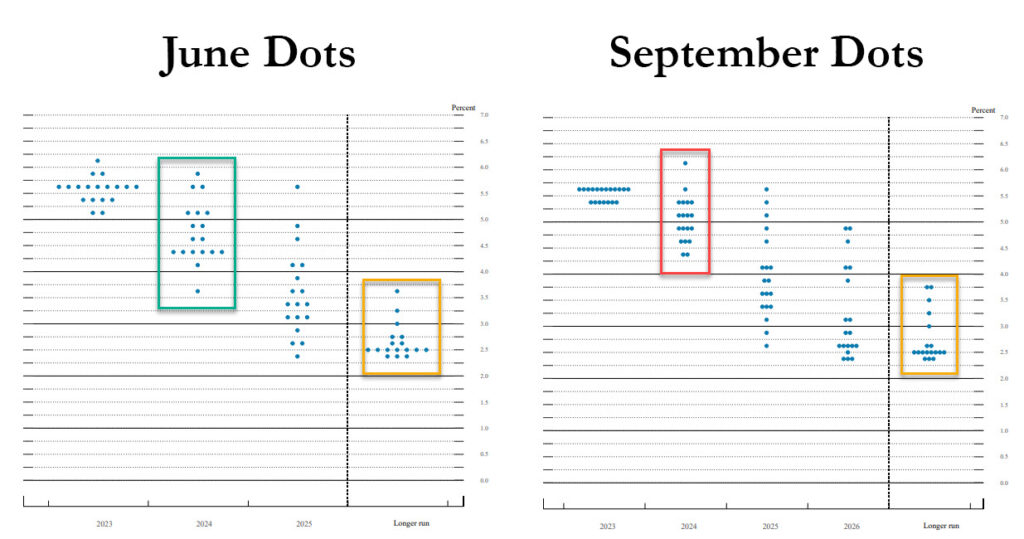
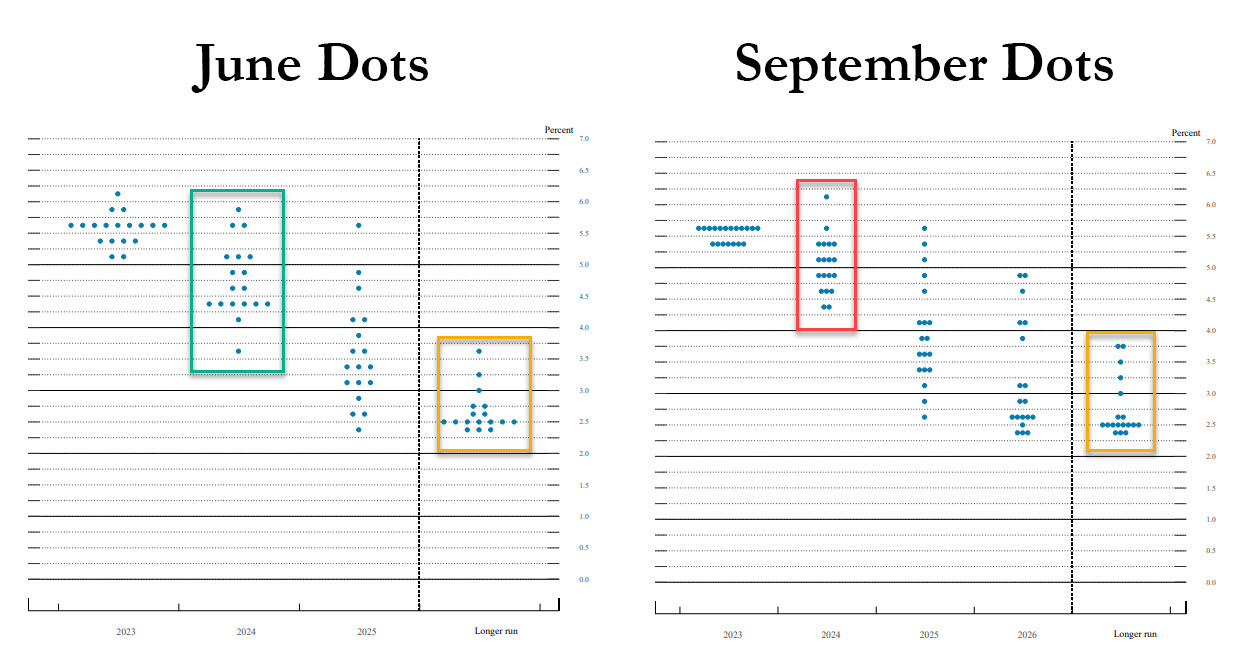
This is the “higher for longer” narrative that I wrote I thought was likely.
- The median estimate for 2025 was 3.9% versus 3.4% in June (removing two 25 bp rate cuts), and a median estimate of 2.9% was introduced for 2026. The longer-run fed funds rate estimate was maintained at 2.5%, leaving the market to infer that the Fed is going to stay committed to its 2.0% inflation target rather than raising it as some suspect in a reflection of doubts the Fed can’t meet their inflation target. These doubts are not unfounded as the Fed failed to meet its 2% inflation target (undershooting) for years before COVID/inflation. In other words… The Fed’s credibility is strained.
- While the Fed’s SEP forecast higher rates, they also forecast lower unemployment and higher economic growth, which is an oxymoron. I know Powell is smarter than that, way smarter, but the dot-plot doesn’t represent the Fed’s unified position or forecast, it represents each individual member’s views, which is why I think it was so damn painful to watch Powell try to reconcile the two in his press conference. Refer to the Mohamed El-Erian comments above.
- Powell said that, “tighter credit conditions could weigh on economic activity, but uncertain.“ Is this the understatement of the century? Most everyone I know that’s making less than $100k a year are in dire straits, having had to make ends meet in 2023 by relying on credit cards, while credit card interest rates are at perverse, some might even say usury levels. Now making ends meet with Credit cards has put them in an even worse situation. For Powell to say, “tighter credit conditions could weigh on economic activity, but uncertain.” is inexcusable. Anyone living outside the ivory towers knows this is a debilitating fact of their financial lives, not to mention that economic data has already proven that this is an unstainable burden hung around the necks of the majority of Americans.
- The SEP’s median unemployment rate projection are 3.8% to 4.1% next 2 years (see charts/data on this in the summary section below).
- Powell was asked why, if inflation has not materially changed, have yields been on the rise so significantly sine the last meeting. Powell gave a bunch of possibilities, admitting he wasn’t sure, but did not touch on the most obvious reason – that U.S. debt levels are unsustainable and Saudi Arabia and China have been dumping U.S. Treasuries over the same period. I’m quite sure he knows that, but wouldn’t even mention it.
- The Fed acknowledges job gains have “slowed” but says they “remain strong”. Keep reading because this is just a part that speaks to the ridiculousness of Powell’s press conference.
Reviewing today’s economic data:
-
- The weekly MBA Mortgage Applications Index rose 5.4% with refinance applications jumping 13.0% and purchase applications increasing 2.0%.
- The weekly EIA crude oil inventories showed a draw of 2.14 million barrels versus last week’s build of 3.96 million barrels.
Averages
Most of the averages, save for the NASDAQ-100, held gains all day up until the Fed. Stocks settled into a steady decline in the late afternoon, led by the mega caps as yields made a massive jump off session lows, that left the S&P 500 just above the 4,400 level, which happens to be a wall of puts ($4500 a wall of calls).
S&P-500 ⇩ -0.94 %
NASDAQ ⇩ -1.46 %
DOW JONES ⇩ -0.22 %
RUSSELL 2000 ⇩ -0.90 %
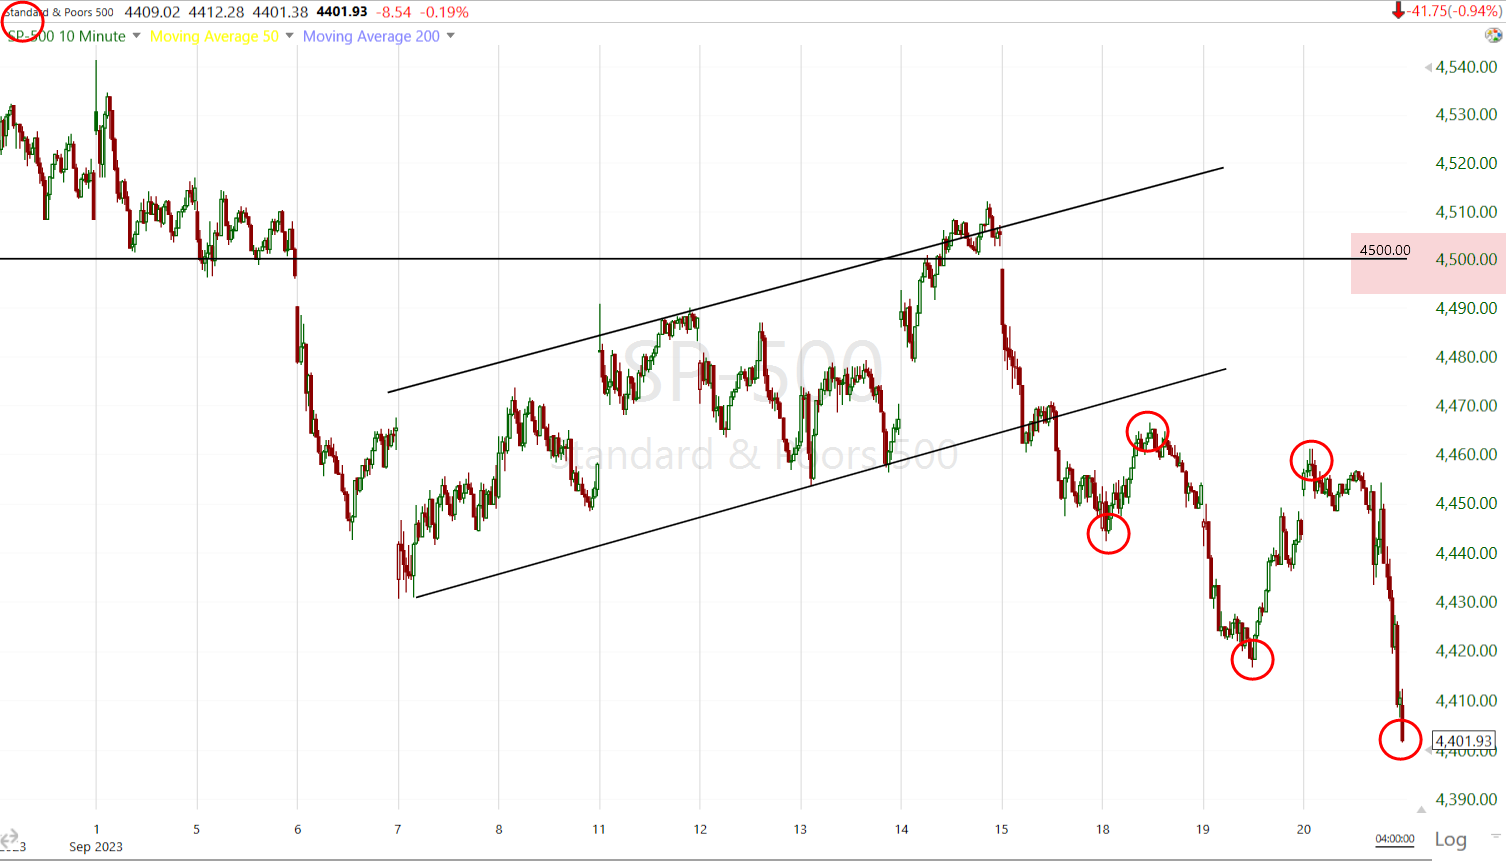
SP-500 (10m) a few notes- 1) the short term trend of lower highs/lower lows (red circles) remains intact since the failure at $4500 last week and the subsequent break of the bear flag. A trend of lower highs/lower lows is the very definition of a down trend (short term basis). However, the S&P settled at $4401.38 where there’s a wall of puts. On a more bearish note, it settled at session lows and that’s never a good look for prices.
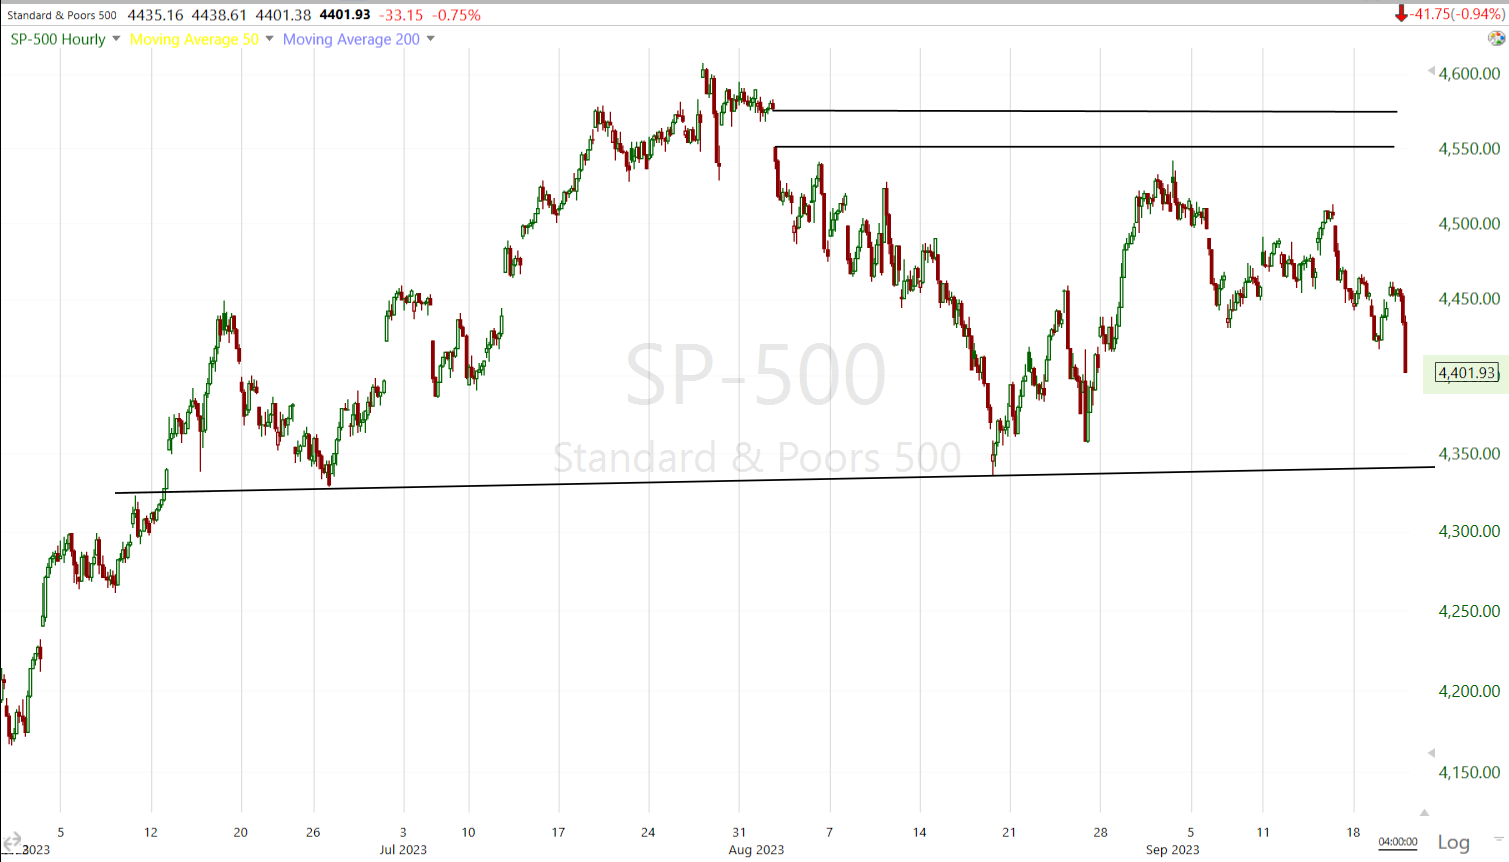 SP-500 (60m) given the FOMC today, that meant the first two days of the week were likely to be low conviction as we already saw, but as pressed in the weekend video update, it doesn’t matter much to me how/when we get there, but the next major stop for price is the H&S neck line currently around $4341, or just -1.35% lower from today’s close.
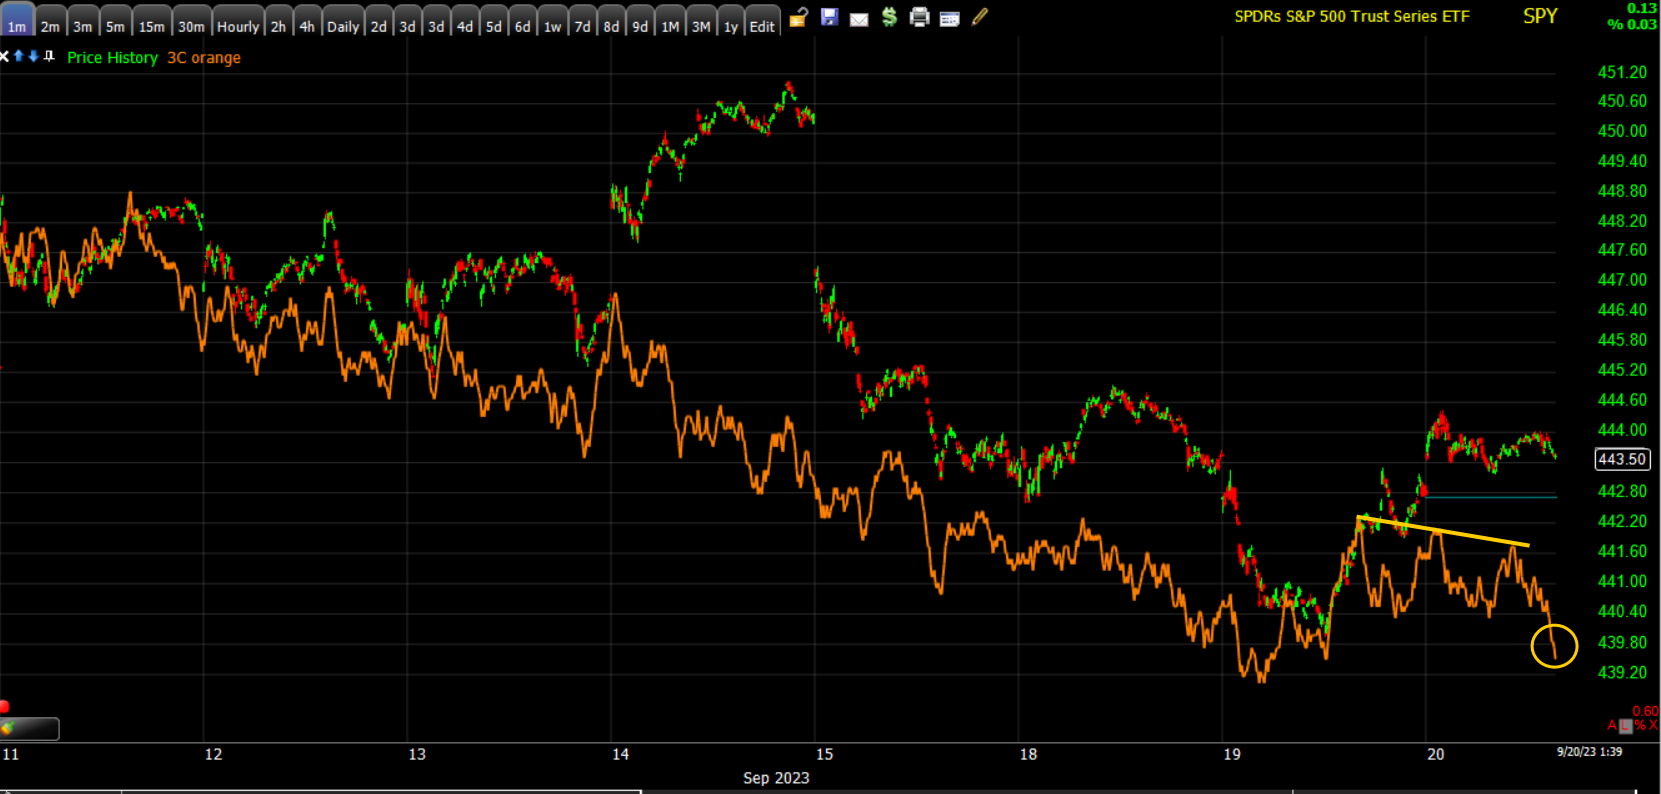
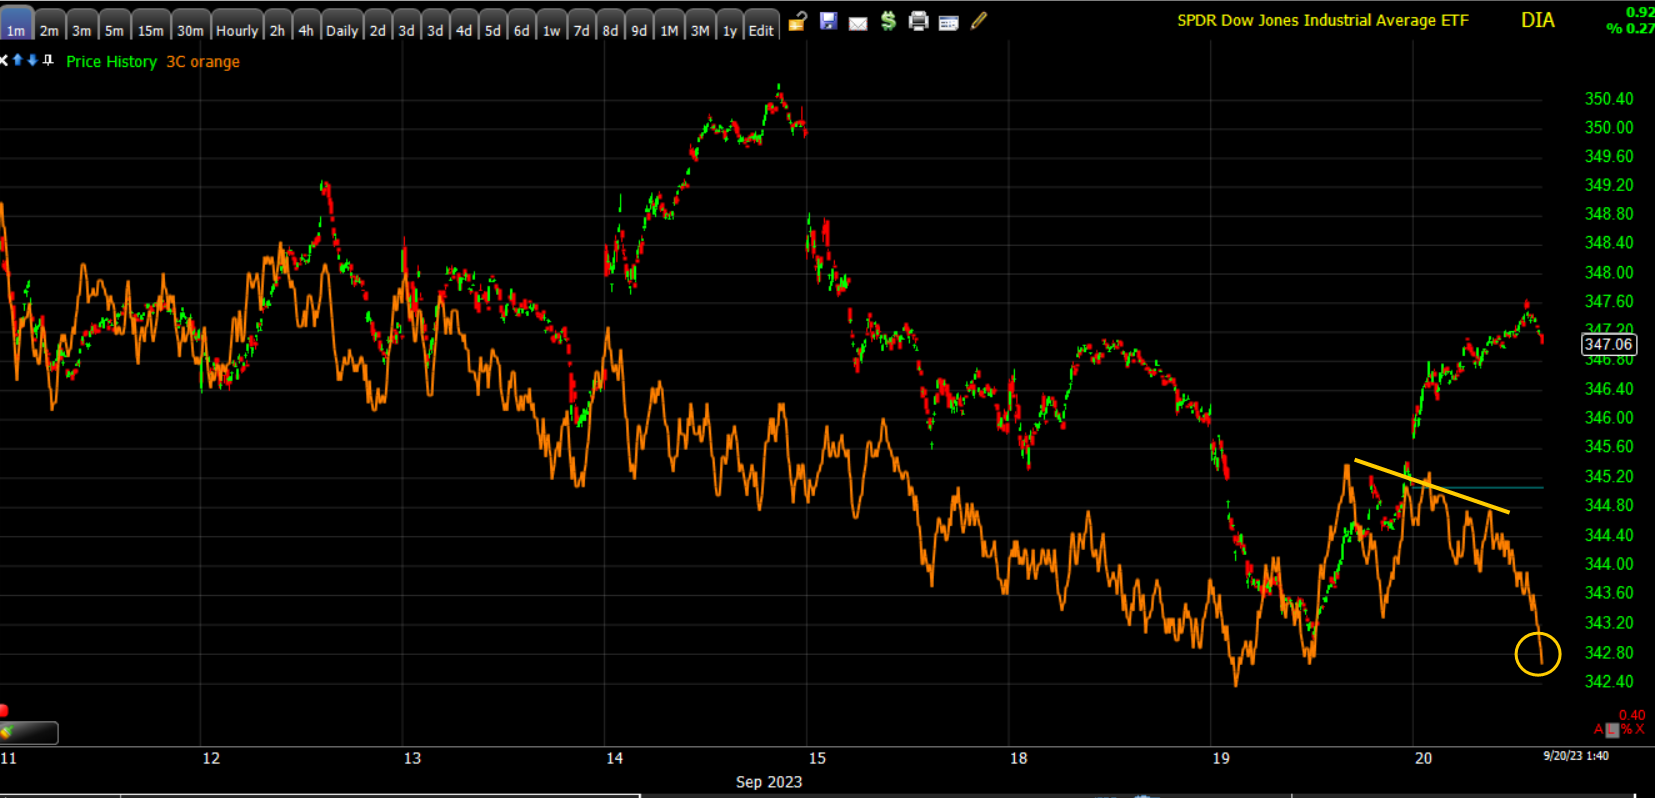
SPY 3C charts showed buyers’ conviction fading ahead of the FOMC as noted in the Pre-FOMC post and with the SPY’s and DIA’s 3C charts used as examples. Nothing unusual there ahead of FOMC uncertainty. What is interesting is that the 3C charts had a more positive disposition (not positive, just more positive) as the close as the S&P neared the $4400 wall of puts.
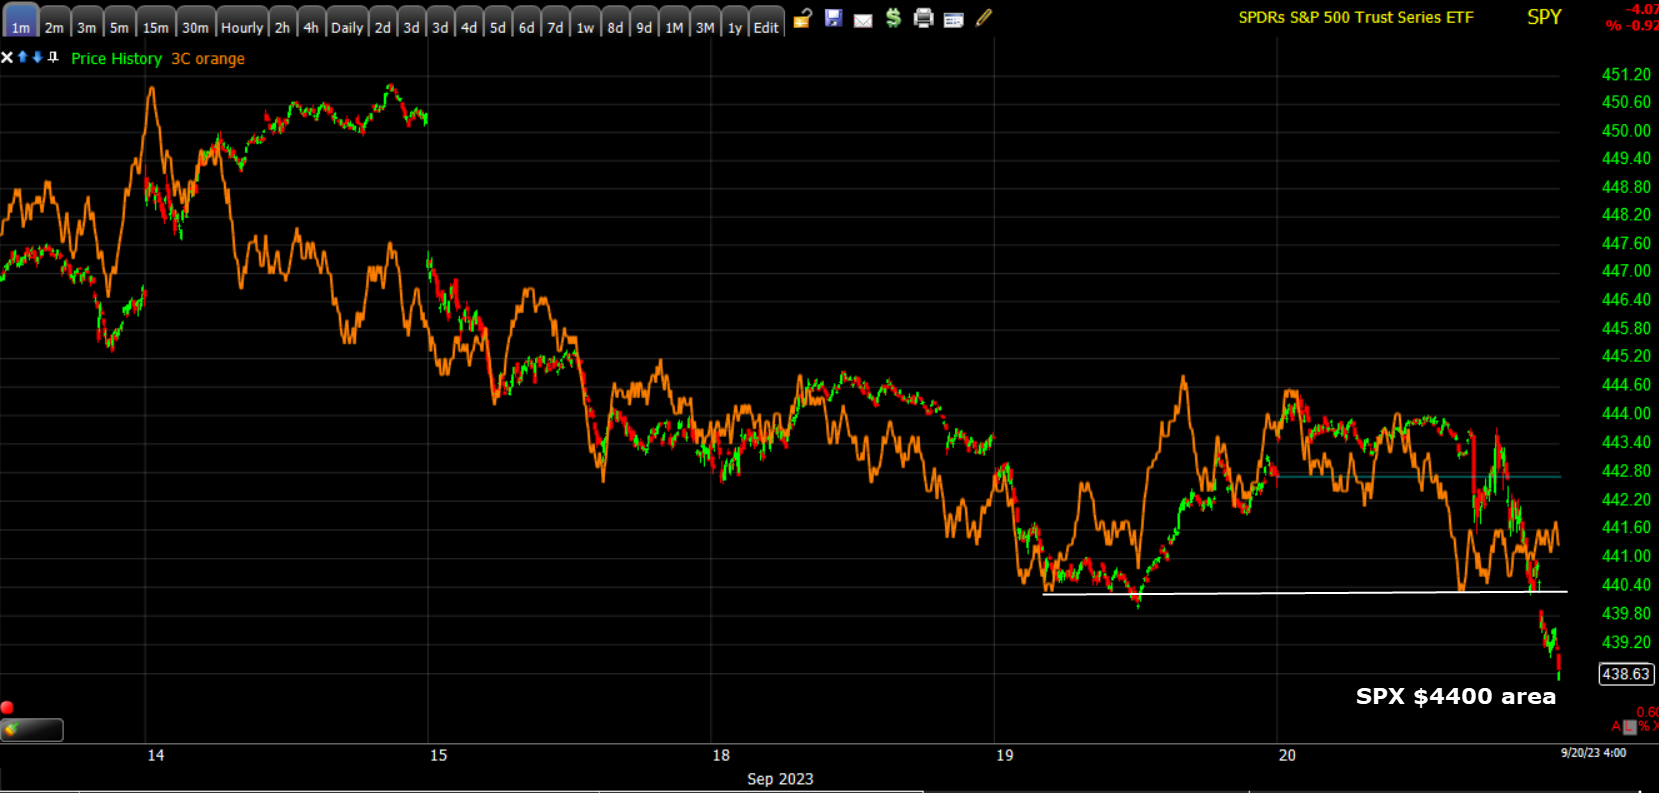 SPY (1m) 3C with a very modest relative positive divergence that I’m sure is connected to the wall of puts at SPX $4400. To be clear, I’m just pointing this out as a learning expiernece . It is NOT a meaningful signal projecting anything more than a brief stop in the area due to the wall of puts.
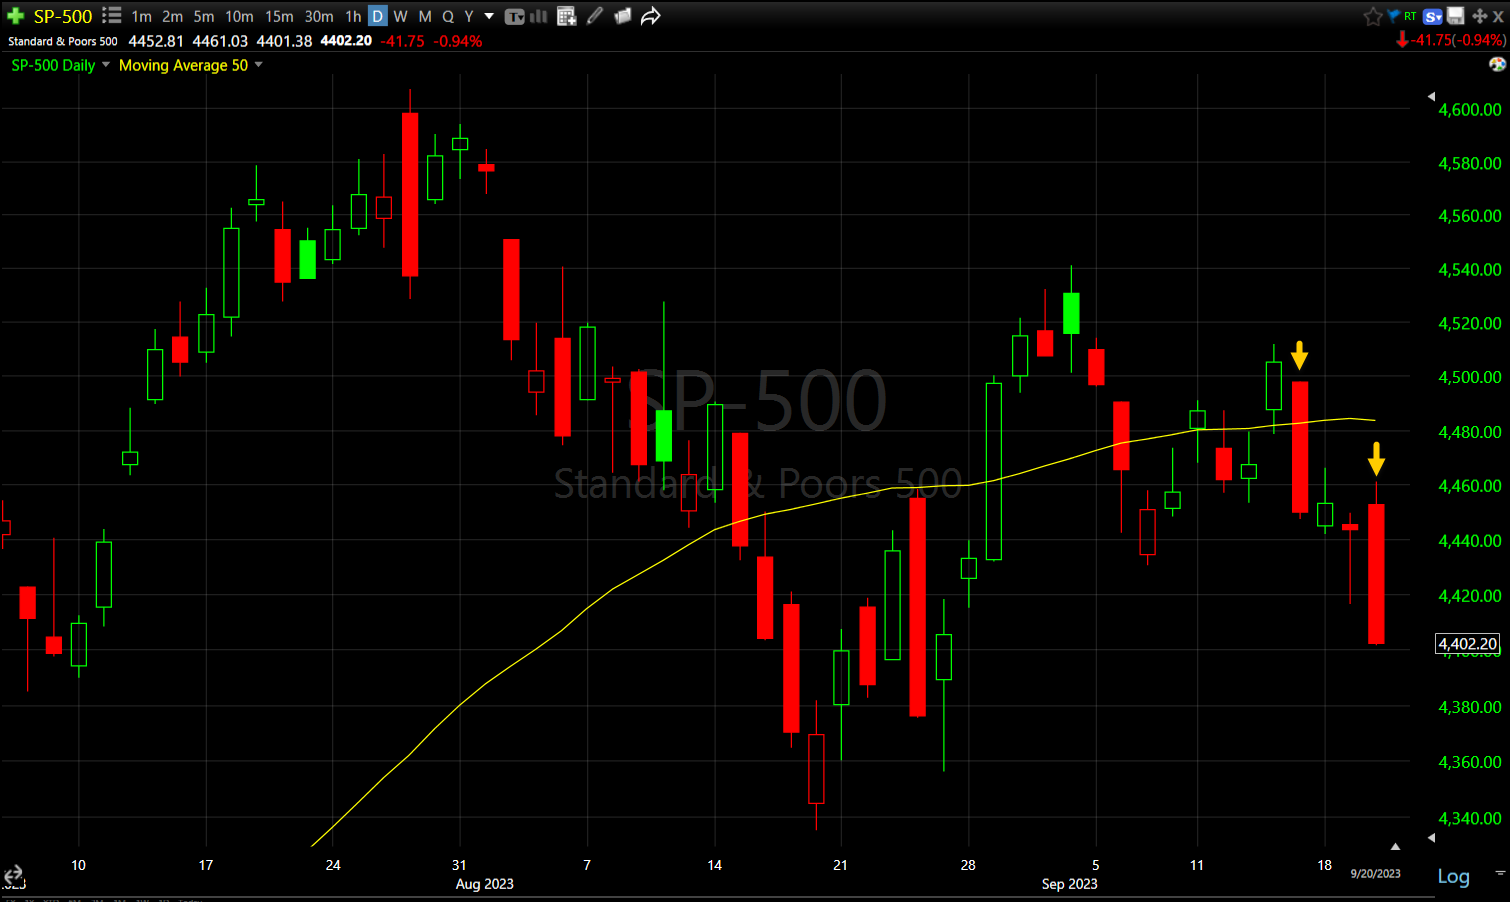
SP-500 (daily) other than 2 days of treading water this week ahead of the Fed, we have 2 big, ugly price candles. The first breaking the bear flag last week, the second a bearish engulfing candle making a lower low since the break of the bear flag. Also note the close at session lows.
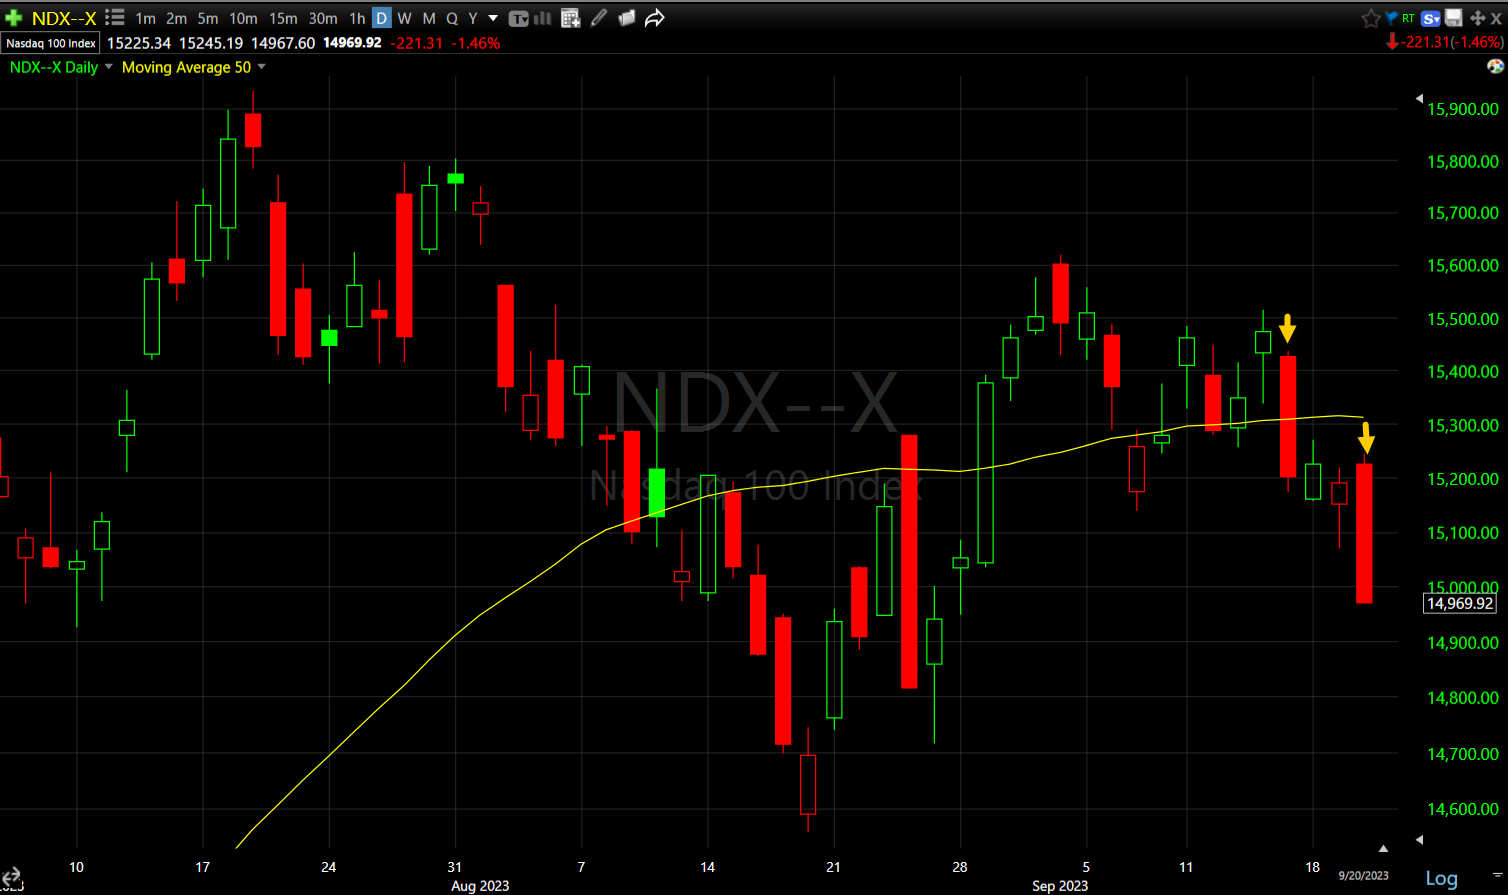 NASDAQ-100 (daily) has the same theme, including a bearish engulfing candle today.
![]()
Dow Transports (daily) were the first major average/sector/group to break below the H&S neck line, but is currently finding technical support at the 100-day. As I’ve said a few times this week, I think it’s likely that all of the averages move down to their neck lines before we see really ugly downside breaks form the H&S tops.
Another average joined Dow Transports in moving down to the H&S neck line today…
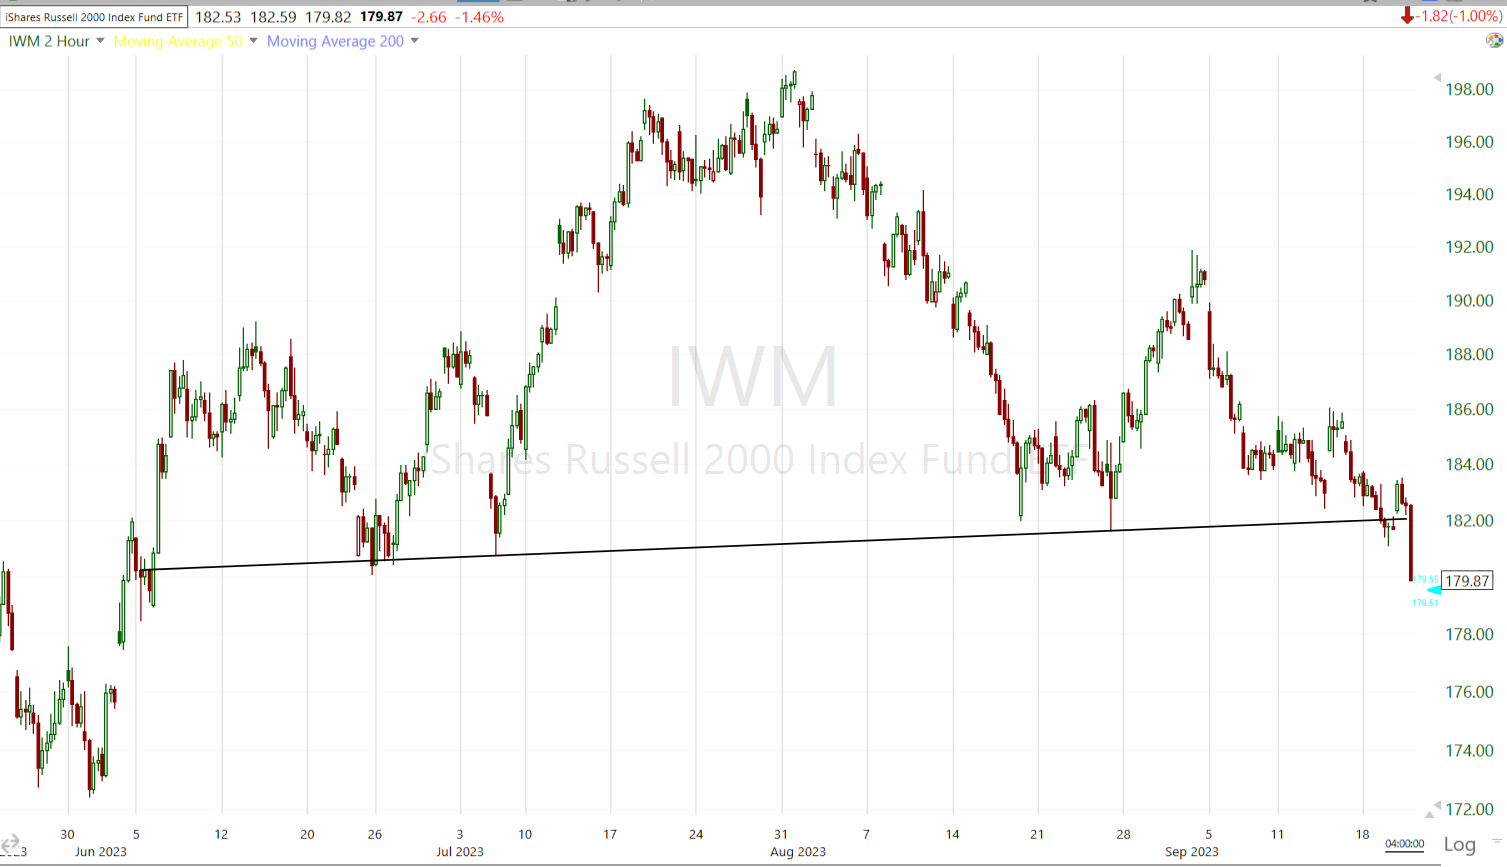 Small Cap IWM (2H) with price slicing below the neck line.
Shorts have kept up pretty steady selling pressure in my Most Shorted Index since the S&P’s failure at $4500 last week.
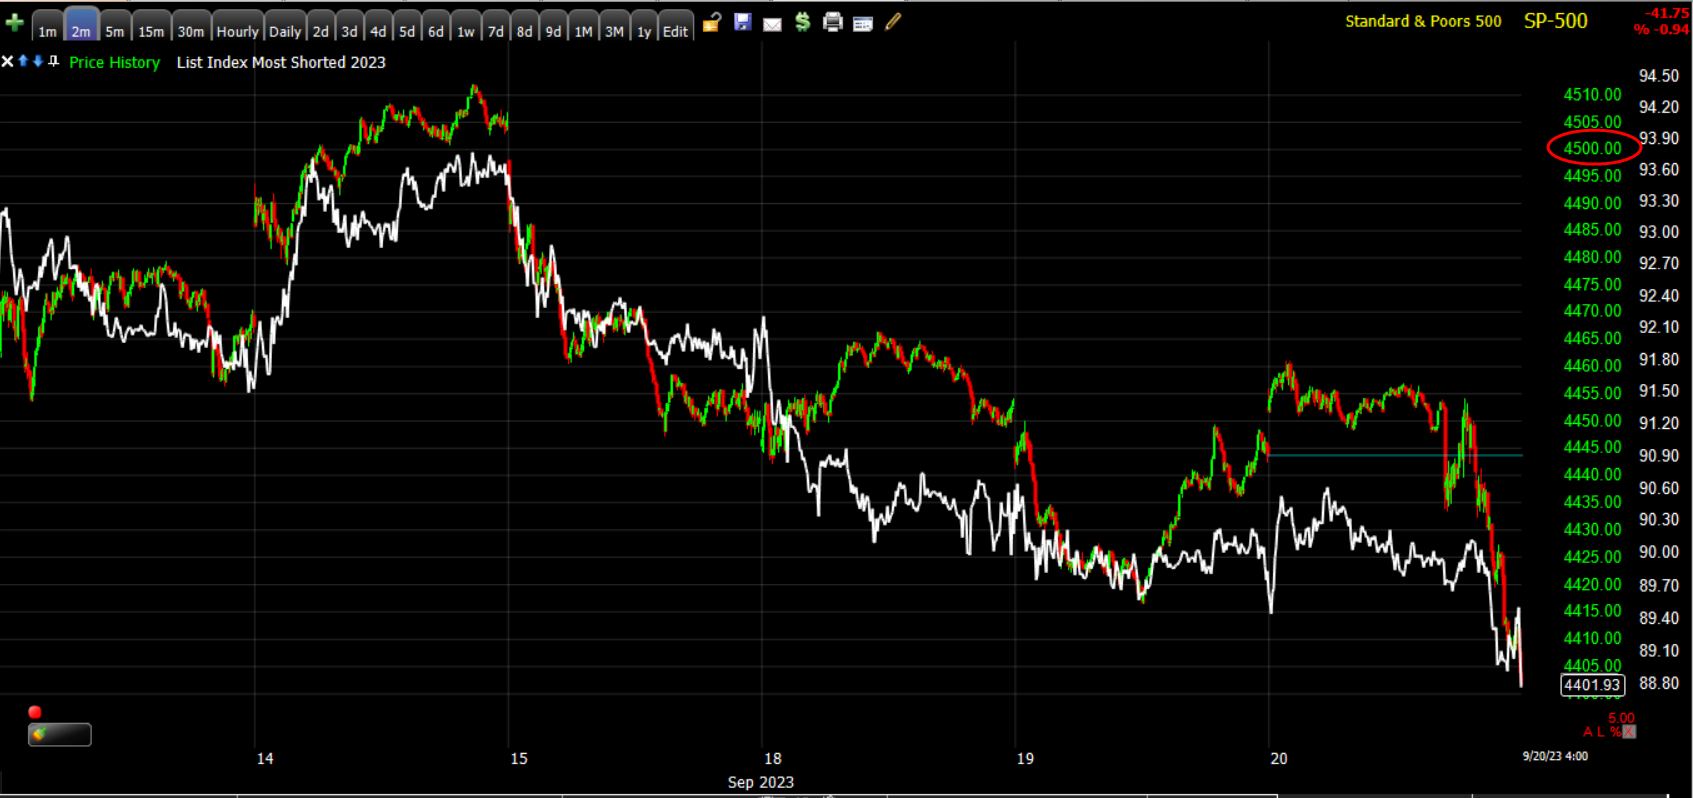 SP-500 (2m) and my Most Shorted Index (white). Even on modest market bounces, the shorts have kept the pressure on.
VIX (+7.3%) acted more normally on the day considering the S&P’s loss, but is still lagging in relative performance terms since the low volatility decline from broken bear flags.
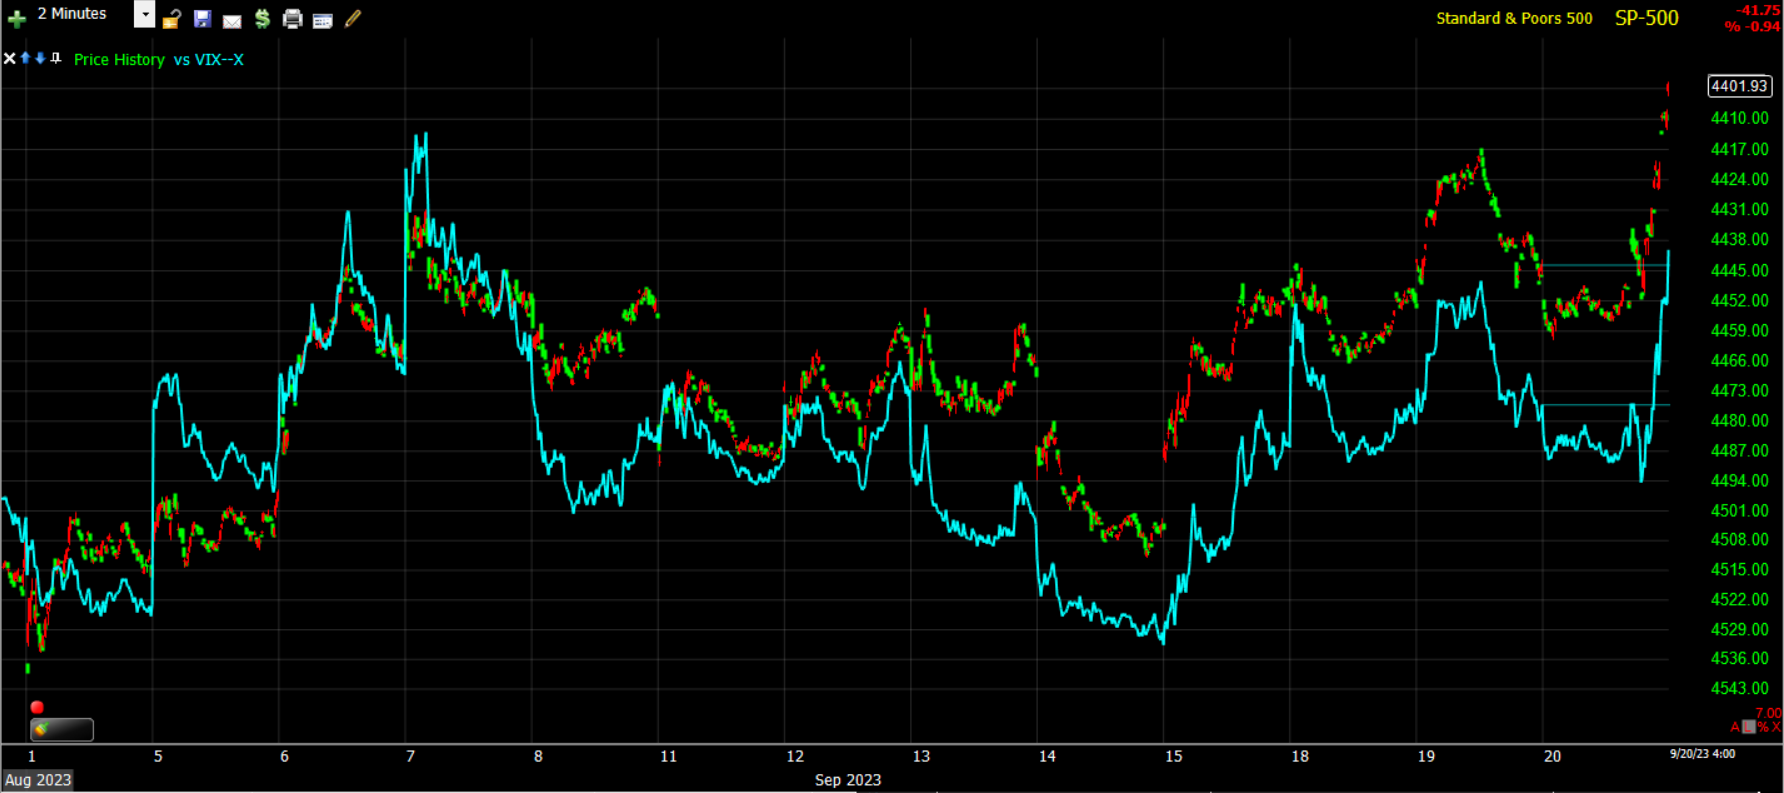 SP-500 (2m) with price inverted for easier comparison and VIX (blue).
VVIX gained +5.4%.
The Absolute Breadth index ended the day at 16, nearing the high probability long volatility signal with a close below 14.
S&P sectors
Most of the day 9 of 11 S&P sectors were higher favoring Value style factors. At one point all 11 sectors were up, although most had modest gains. By the close only 4 of 11 sectors held modest gains of no more than two-tenths of a percent, and notice they are all defensively oriented, or bond proxy sectors (Consumer Staples, Utilities, Real Estate, Health Care). With yields higher on the day, this isn’t bond proxy correlation, it’s risk-off tone starting to hide out in the defensive areas.
As of the Early Update the mega-caps (MGK -1.6%) were trailing the S&P Equal Weight Index (-0.4%) by 85 basis points. This was somewhat strange as lower yields like this morning, usually benefit the mega-caps and growth style factors over value, but value dominated and growth/mega-caps lagged. At first I thought this was due to the significant divergence between yields and mega-caps that suggests with high conviction that mega-caps/NASDAQ/Tech stocks catch down to bonds (or yields on an inverse basis), but as the day wore on, I suspect there was inside information, or smart money acting smart and knowing that the FOMC was likely to be hawkish. By the close and as yields surged higher after the FOMC, the mega-caps trailed the S&P Equal Weight Index by 120 basis points. That makes sense as yields rose, but also made sense due to the catch-down of mega-caps to higher yields, but more importantly, suggests smart money had a good idea of what the Fed’s SEP and Dot-Plot would reveal – a more hawkish stance than previously prices in. There’s additional evidence of this on the 3C chart of Fed-sensitive 2-year UST futures today (see below).
The mega-cap heavy Technology and Communications sectors were at the bottom of the leaderboard along with the cyclical Materials sector.
Semiconductors (SOX -1.75%) underperformed the Tech sector as we saw at the end of last week, the semis were starting to lead Tech lower. Now the semis (SOX index) are the latest group to move down to the H&S neck line.
Materials ⇩ -1.05 %
Energy ⇩ -0.93 %
Financials ⇩ -0.69 %
Industrial ⇩ -0.39 %
Technology ⇩ -1.57 %
Consumer Staples ⇧ 0.10 %
Utilities ⇧ 0.09 %
Health Care ⇧ 0.01 %
Consumer Discretionary ⇩ -1.00 %
Real Estate ⇧ 0.19 %
Communications ⇩ -1.36 %
Semiconductors join the Dow Transports, Small Caps, the Home Builders and Retail sectors at the H&S neck line, which is exactly the forecast given as the next significant event for the broader market.
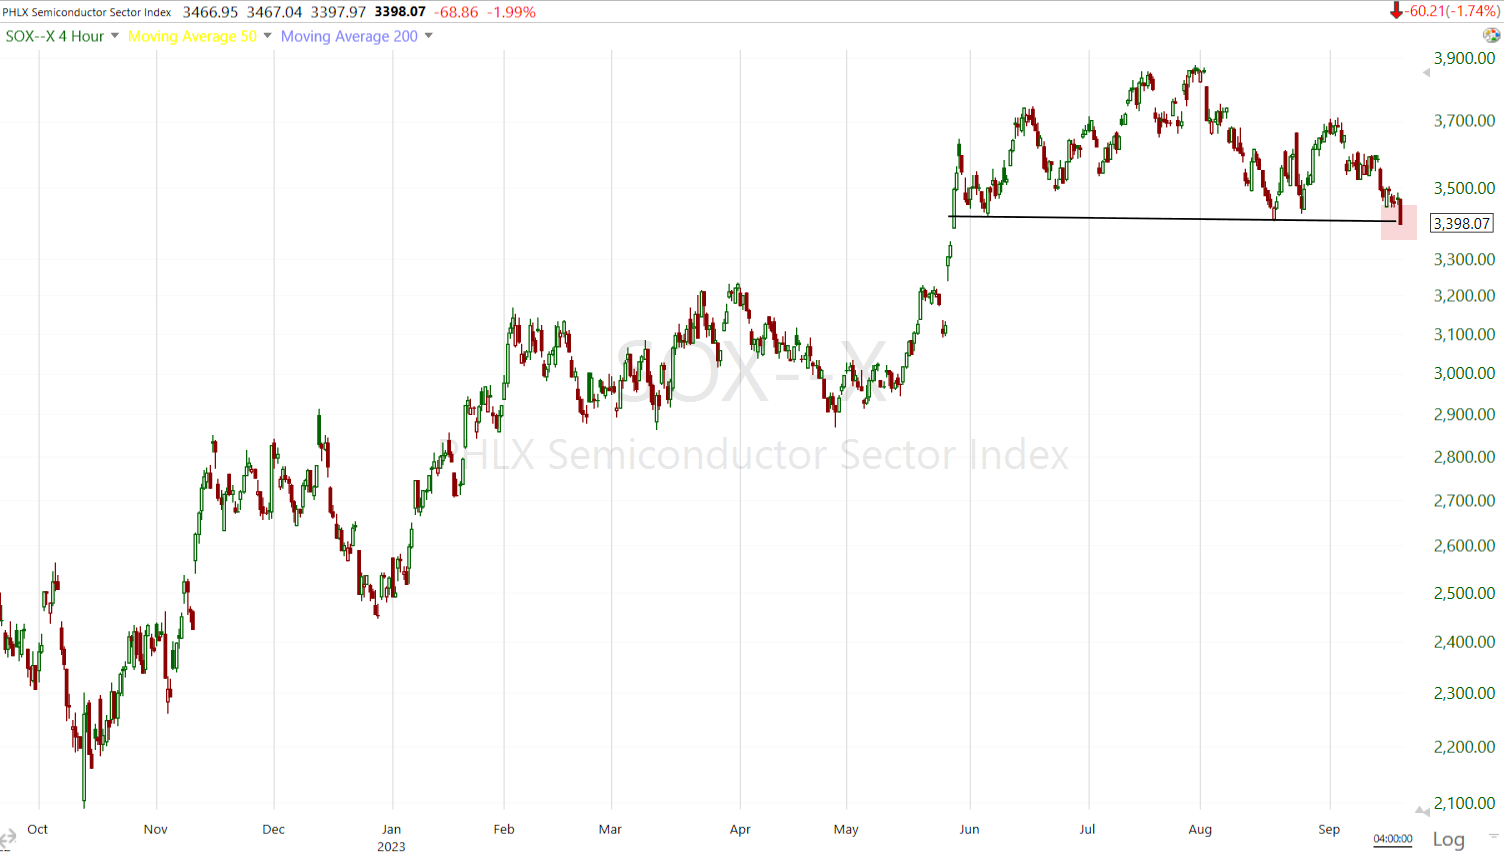 SOX (4H)
Regional Banks ended -0.9% lower as their bear flag break down, but has not been an impulsive second leg down, but it has been a steady short term trend of lower prices.
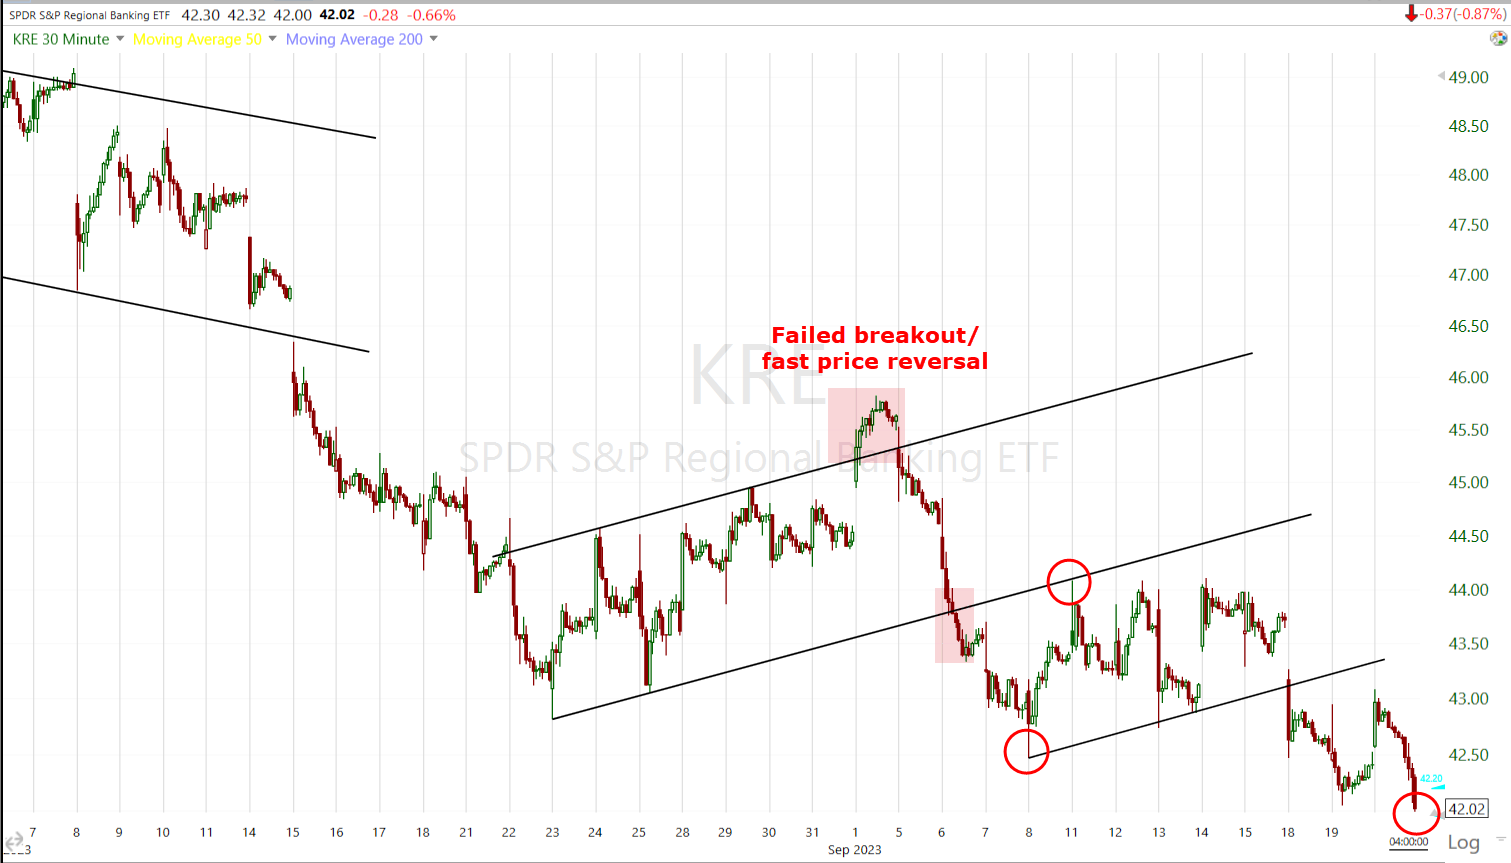
Regional Banks (30m)
The sharply flattening yield curve post FOMC didn’t help matters for the banks as a flattening curve weighs on banks’ net margin interest income (borrowing at short term rates and lending at long term rates which weighs on banks in periods when yield curves are flattening or inverted)…
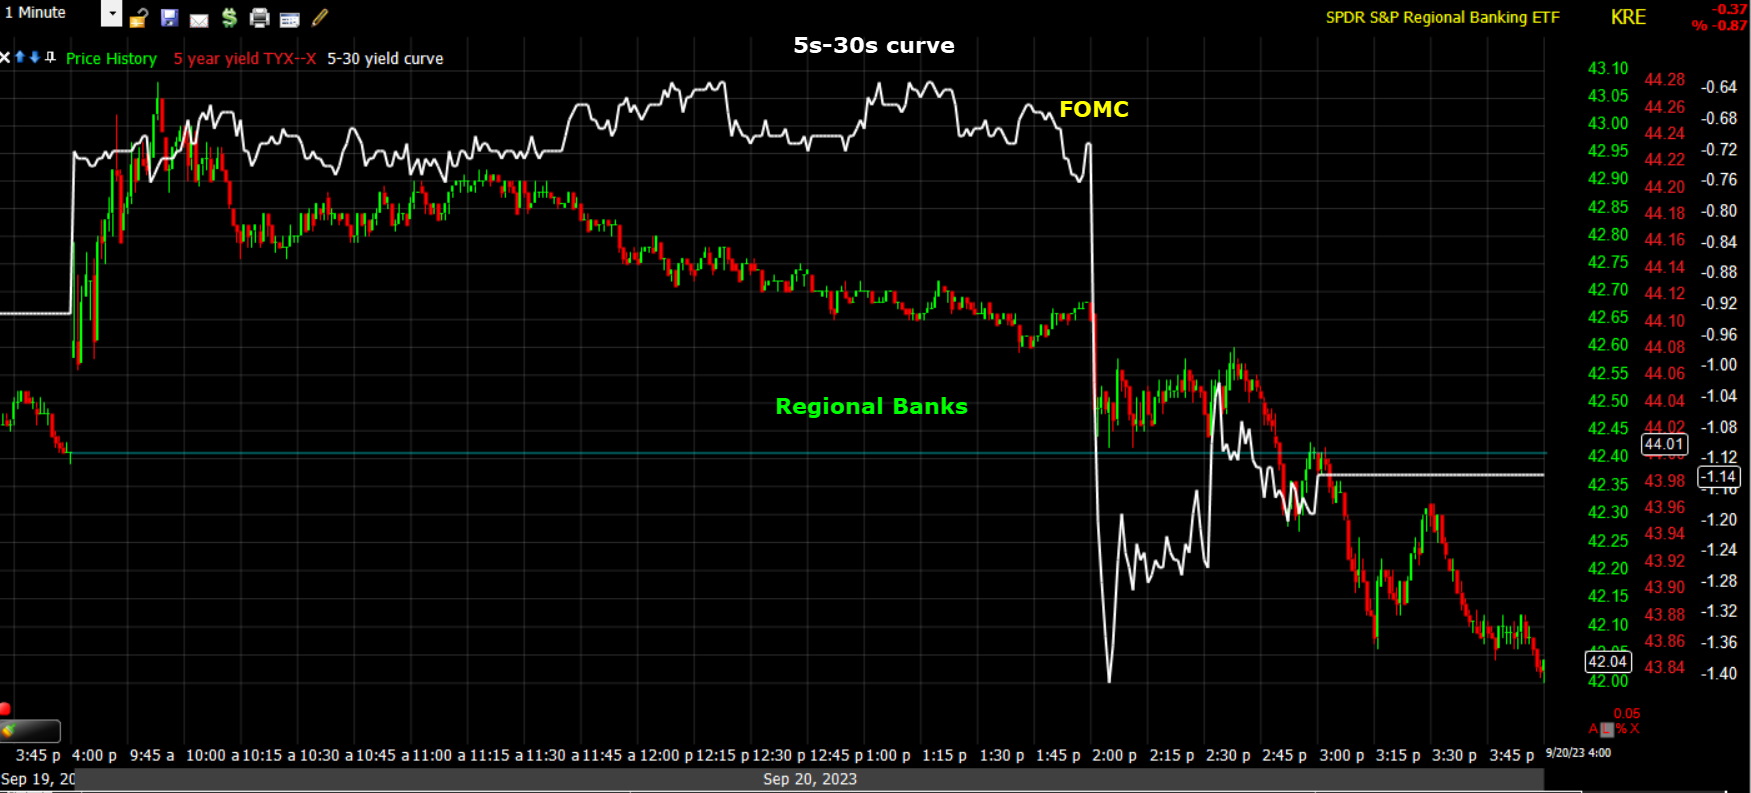 Regional Banks (1m today) with the 5 s-30s yield curve flattening sharply upon the FOMC, dragging Regional Banks from a gain on the day, to a loss.
Regional banks join Dow Transports, the Retail sector and Home builders in having reached the H&S neck lines.
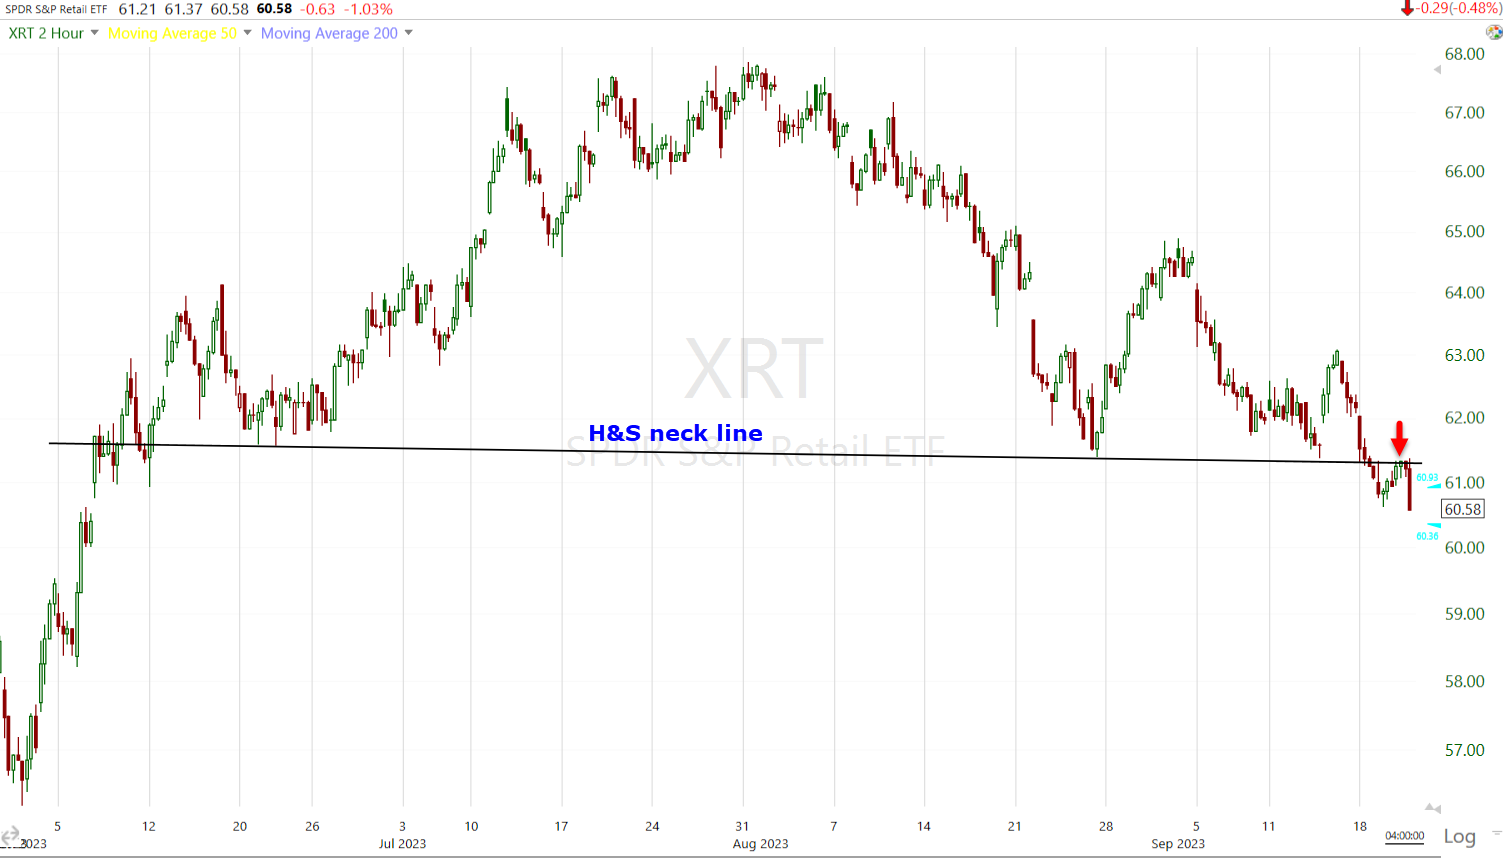 Retail sector (2h) including a back-test of former support (neckline) now resistance (red arrow).
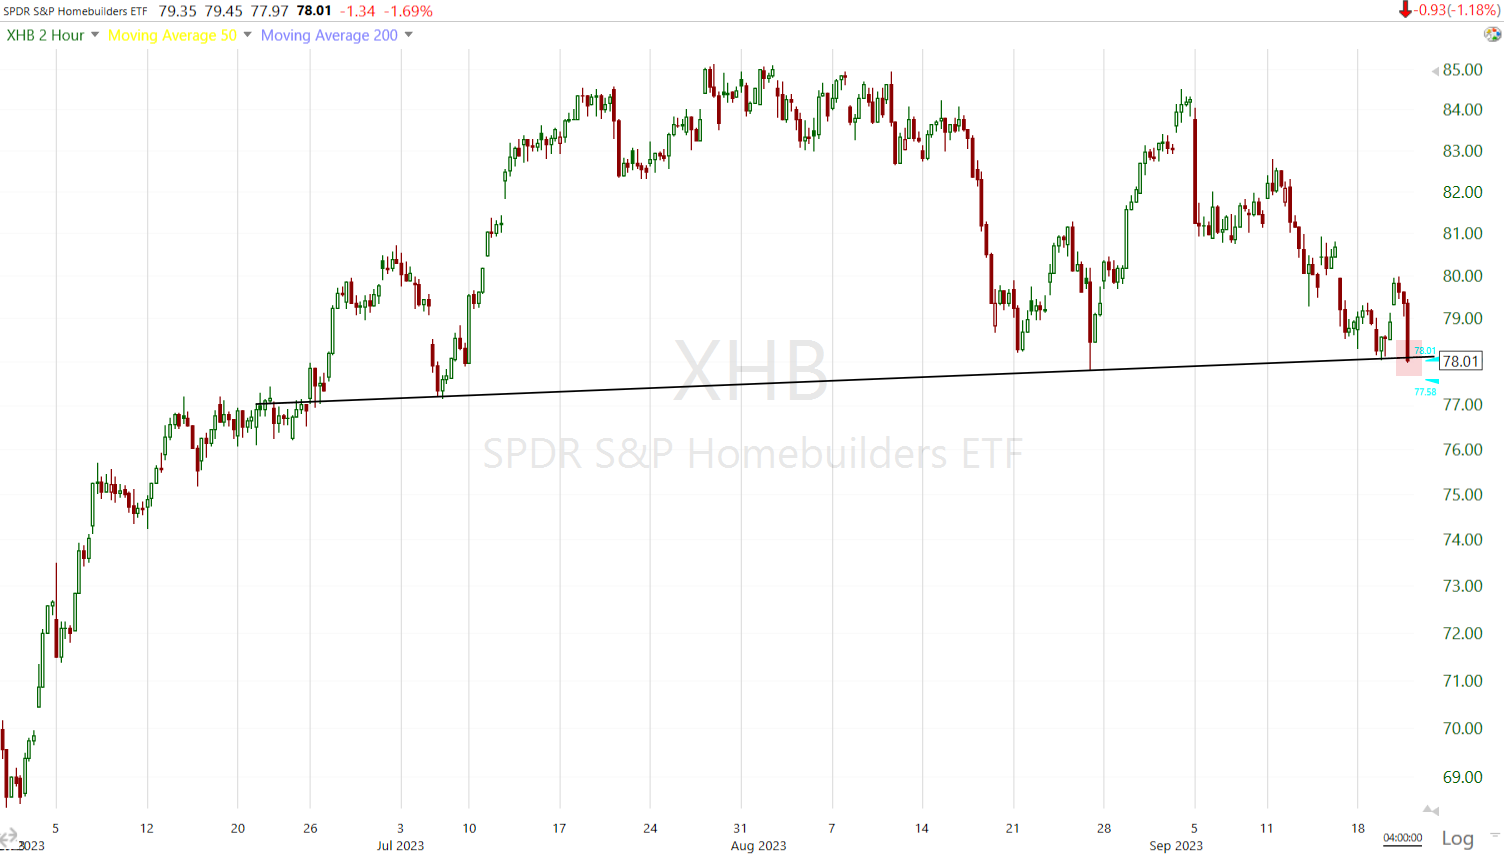
Home Builders (2H) just starting to crack below he neck line.
Internals
Earlier today advancers were better than 3-to-1 over decliners, until the Fed. By the close the advantage advancers (1115) had was wiped out with decliners )(715) having an edge, but less than 2-to-1 which rules out 1-day oversold internals. NYSE volume was light at 767 mln shares, which also rules out 1-day oversold internals
There’s no Dominant price/volume relationship today and therefore no 1-day oversold conditions signaled by internals.
Treasuries
Treasuries were mixed on the day – and very volatile – with the short-end dramatically underperforming which doesn’t exactly send out the “soft landing” signal that the investors have been relying on to justify their current bullishness. The volatility was quite intense with the Fed-sensitive 2-year yield jumping 14 basis points off session lows.
The 2-yr yield, at 5.05% just before 2:00 p.m. ET, settled at 5.13%. The 10-yr yield, at 4.32% just before 2:00 p.m. ET, settled at 4.35%. As we go out further on the curve (more long term economically sensitive- not to mention U.S. debt burdens becoming unsustainable), the 30-year was 4.04% just before the Fed, and ended at 4.04% in curve flattening trade.
Fixed income represented the “higher for longer” narrative the Fed is pushing by the front ending higher, and a weaker economy signaled by the long end with little movement, which made a lot more sense than Powell’s presser. After all, the longer the Fed keeps rates elevated, the more economic growth damage it does.
The Fed sensitive 2-year yield jumped to a new high not seen since July 2006.
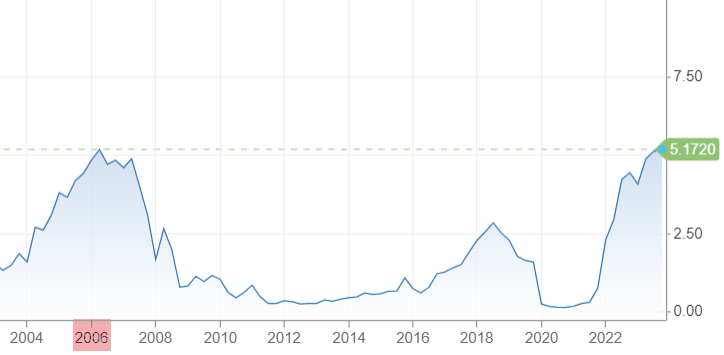 2Y
2Y
All of the concepts in my analysis are fractal, which means if you understand the concept, you can apply it to intraday charts as a day trader or scalper, or if you are a long term investor, you can apply them to daily/weekly charts and the concepts hold all the same. This is why I focus so much time on sharing the concepts with you, not just the information. The more you hear a concept and see it in multiple assets and timeframes, the more the concept sticks. My goal has never been to have subscribers rely on me for their analysis, but to give you the tools to do so for yourself if you choose to and have the time. This next chart is a great example of the concept of reading price action – or a century ago, known as , “reading the tape”, but this time on a macro basis. We’ve seen a lot of bullish, and more recently bearish, price patterns this year. Most have been on intraday charts of stocks. Here’s the same price consolidations, except from a longer term perspective of a 2-day chart, and rather than in equities, applied to rates…
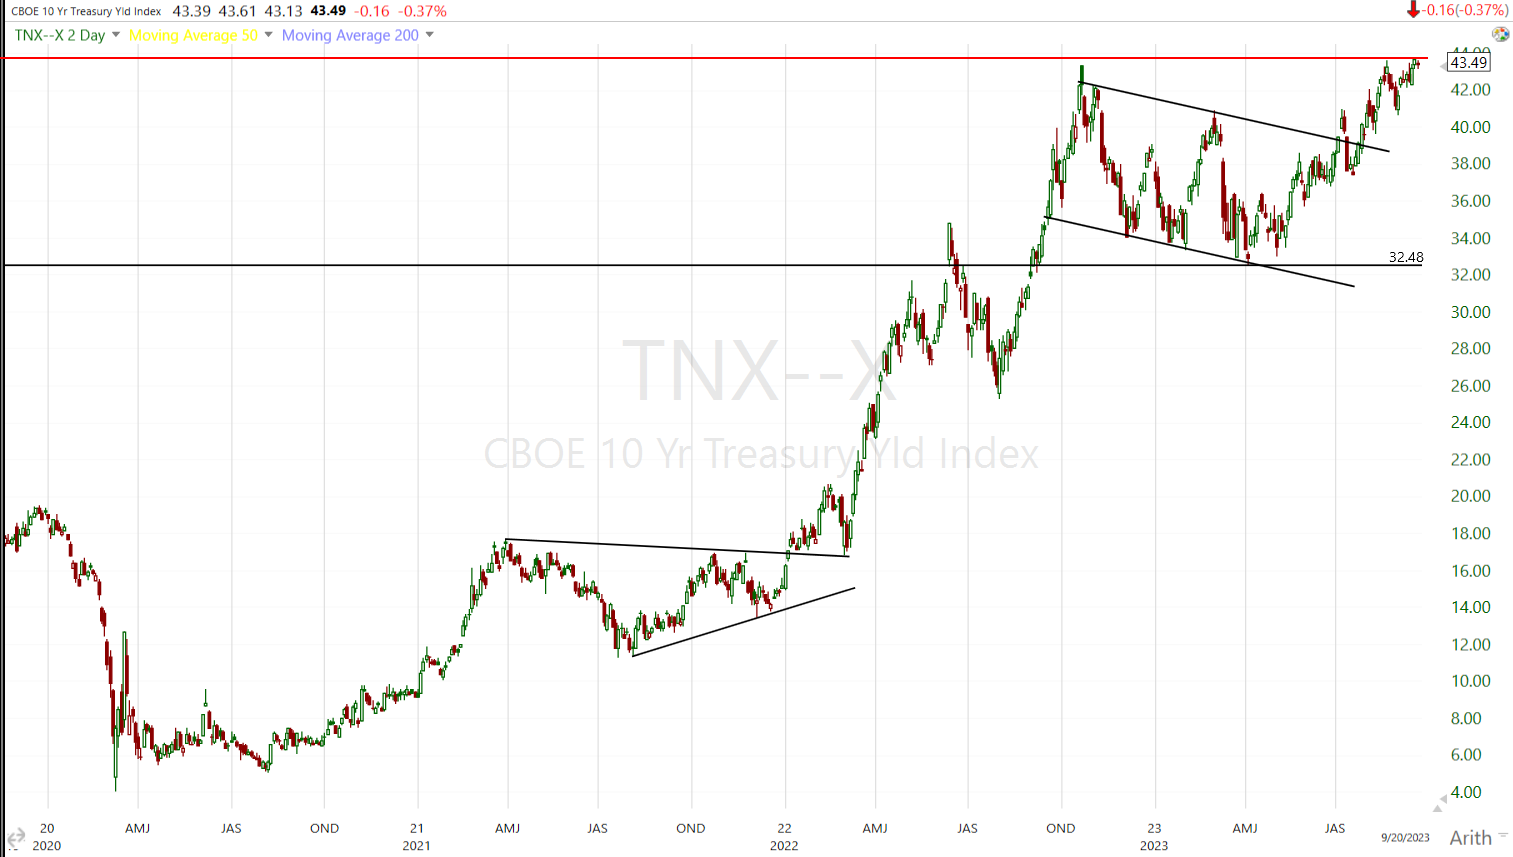 10-year yield (2 Day) breaks out to the highest since 2007 and you know by now that stocks, in the current macro environment, don’t like higher yields. The current relationship with yields is specific to the inflationary environment. It’s not a constant. There are scenarios when higher yields are a bullish signal for stocks, such as coming out of an economic recession as higher yields can reflect improving economic growth prospects, so just know that the relationship is not a constant, but dependent on the macro economic backdrop.
Notice the bullish ascending triangle in 2021 on the chart above (we’ve recently saw a bullish ascending triangle in crude oil break out last week). That’s followed by a huge bull flag, and break out. Many of you have been with me for years and some of you may remember the huge bull flag in yields heading in to October 2018. Then Powell said something the market didn’t like in early October about the neutral rate being higher, the 10-year yield broke out above the bull flag and the stock market saw a big decline. The S&P lost -20% between early October and late December, all due to the Powell comments, which sent rates higher, which were reflected as a probability well in advance of the actual event by the price pattern. In fact it was one of the primary reasons I was forecasting a sharp market decline to come in summer 2018, well before I had any idea of what the catalyst to cause it would be.
I may not have known what the catalyst would be to cause rates to spike and stocks to sell-off ahead of the 2018 sell off, but I could recognize the bull flag in yields that suggested it was a high probability. Said another way, some very well connected, informed money with deep pockets did know and their knowledge was reflected on the chart of yields. If technical analysis is properly employed to its potential, that’s what we get. We may not know who left the footprints in the sand or why they were walking in a certain direction, but we can see their footprints and we know what direction they are headed. We’re following the trail of smarter money.
High yield Credit (HYG -0.1%) was acting pretty well earlier today but fell on the Fed and higher yields.
Currencies and Commodities
As posted in last night’s Daily Wrap and this afternoon’s Pre-FOMC Update,
“Remember to be ware the knee jerk reaction in equities at the FOMC release, and we may several more during Powell’s presser. Watch the U.S. Dollar and yields. If they are higher, the message from the FOMC is more hawkish than priced in, and if lower, more dovish than prices in. These two markets are far more sophistaced than equities, so they give a better initial read. “
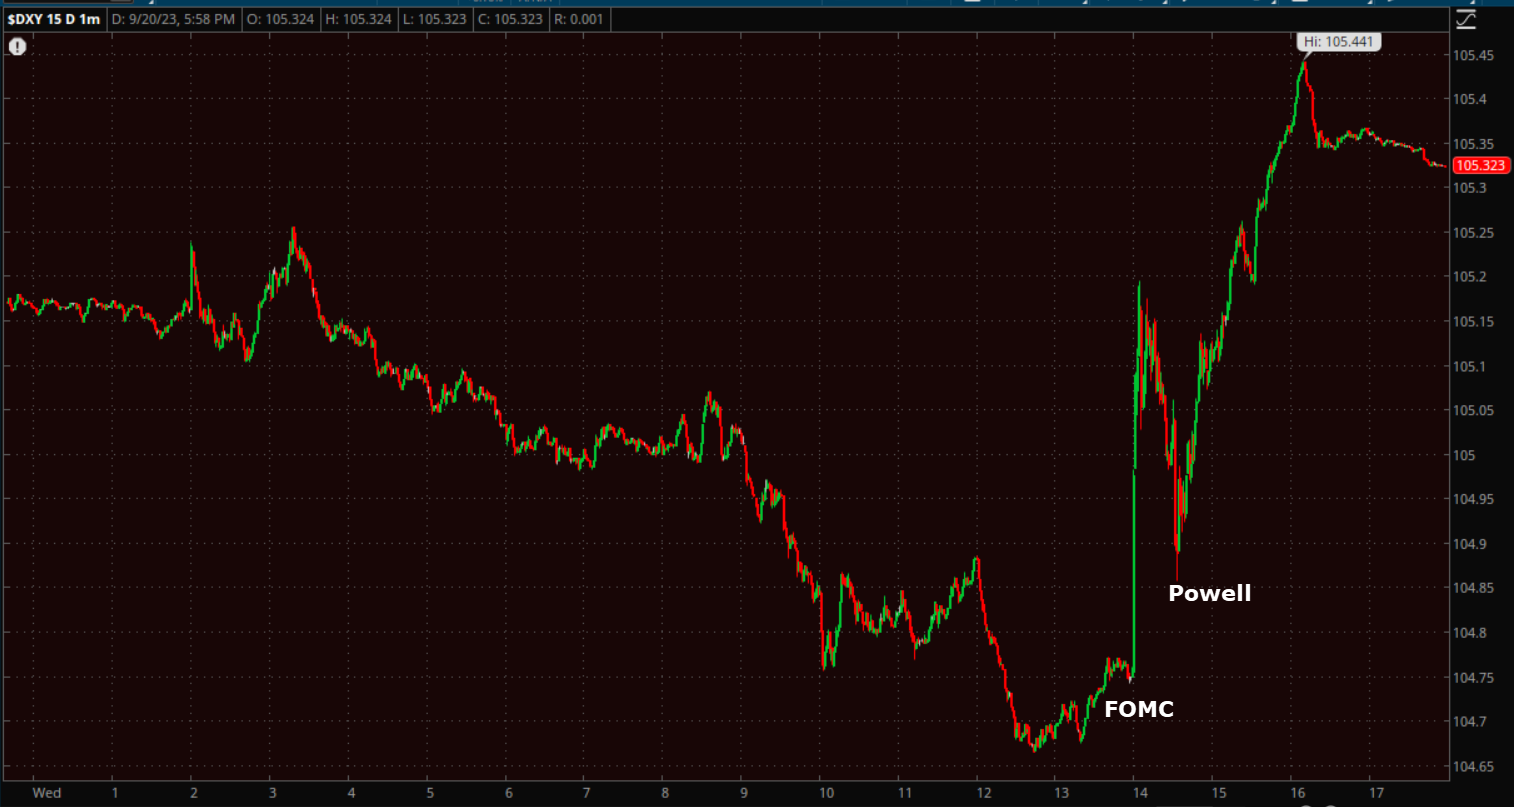 U.S . Dollar Index (1m) spikes hawkishly on the FOMC, then Powell’s presser as stocks declined.
WTI crude oil futures fell -0.8% to $89.75/bbl and natural gas futures fell -4.0% to $2.73/mmbtu.
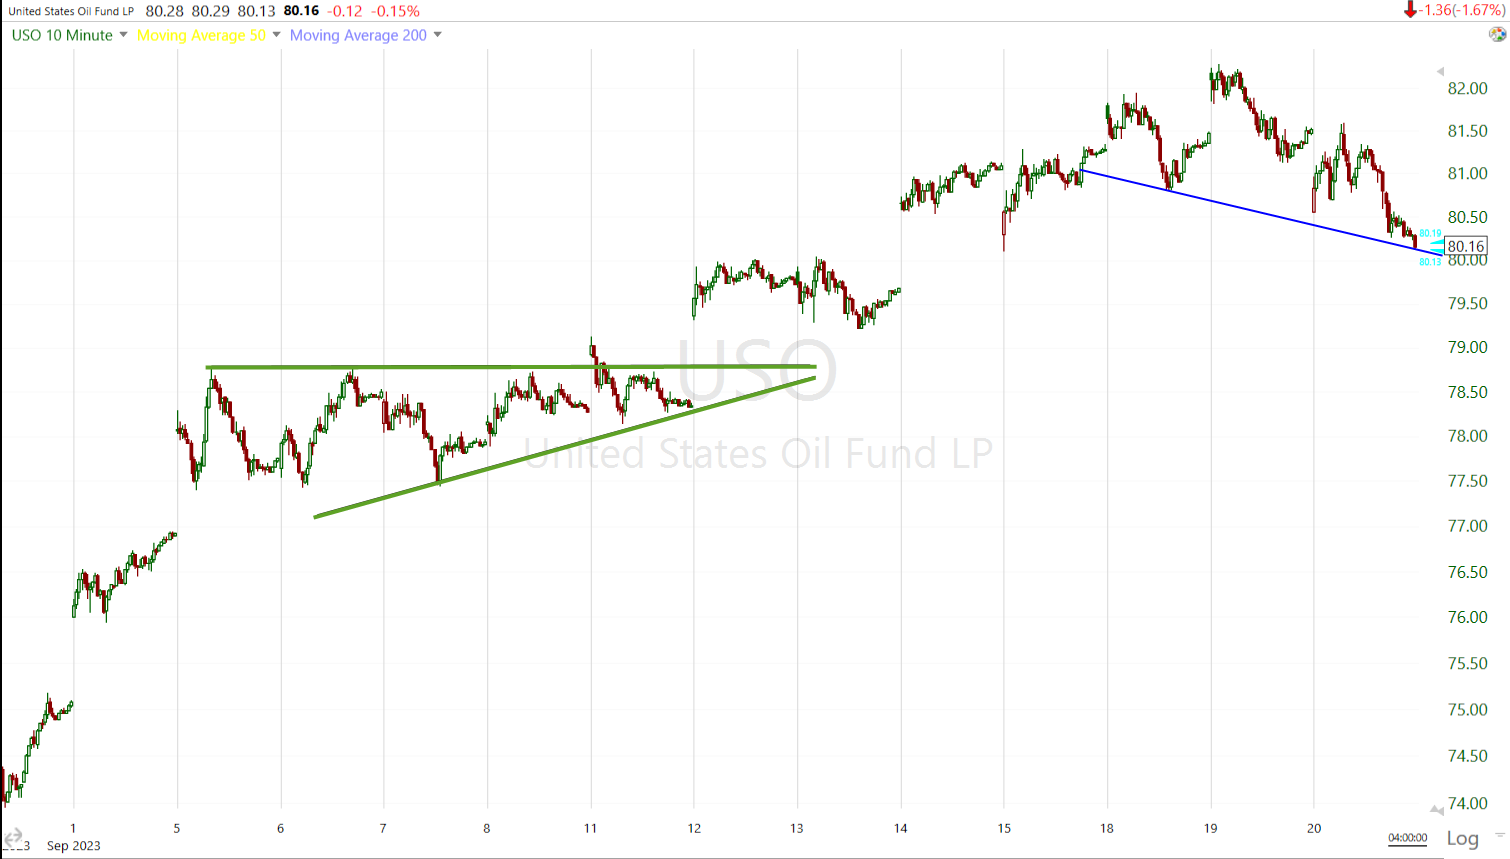
USO (10m) as I’ve said the last 2 days, this is the area I expect a bullish consolidation in Crude, and now we’re getting early signs of that in price.
Gold futures settled $13.40 higher (+0.7%) to $1,967.10/oz, ending higher for a fifth consecutive session, but this was before the jump in yields and Dollar.
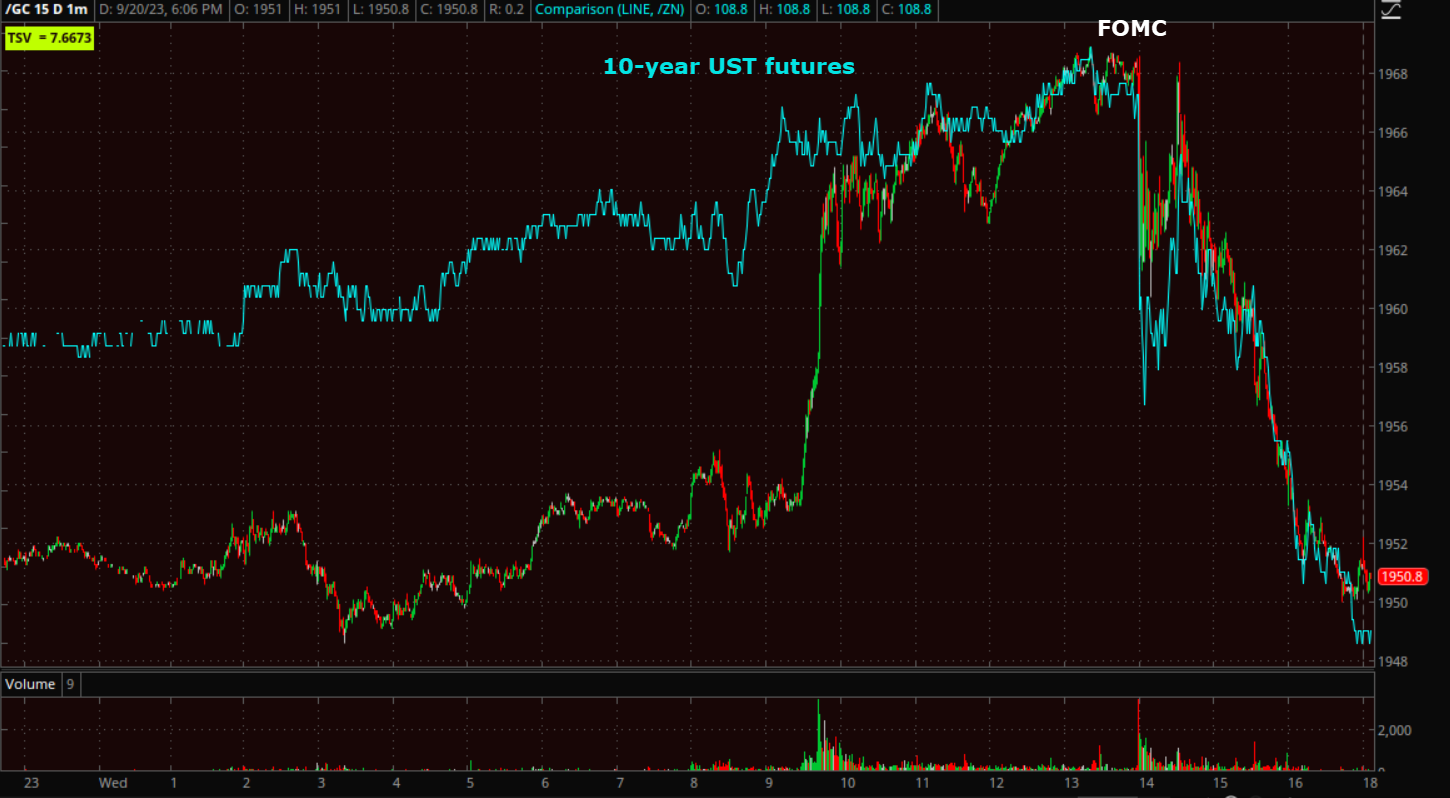 Gold futures (1m) and 10-year UST futures.
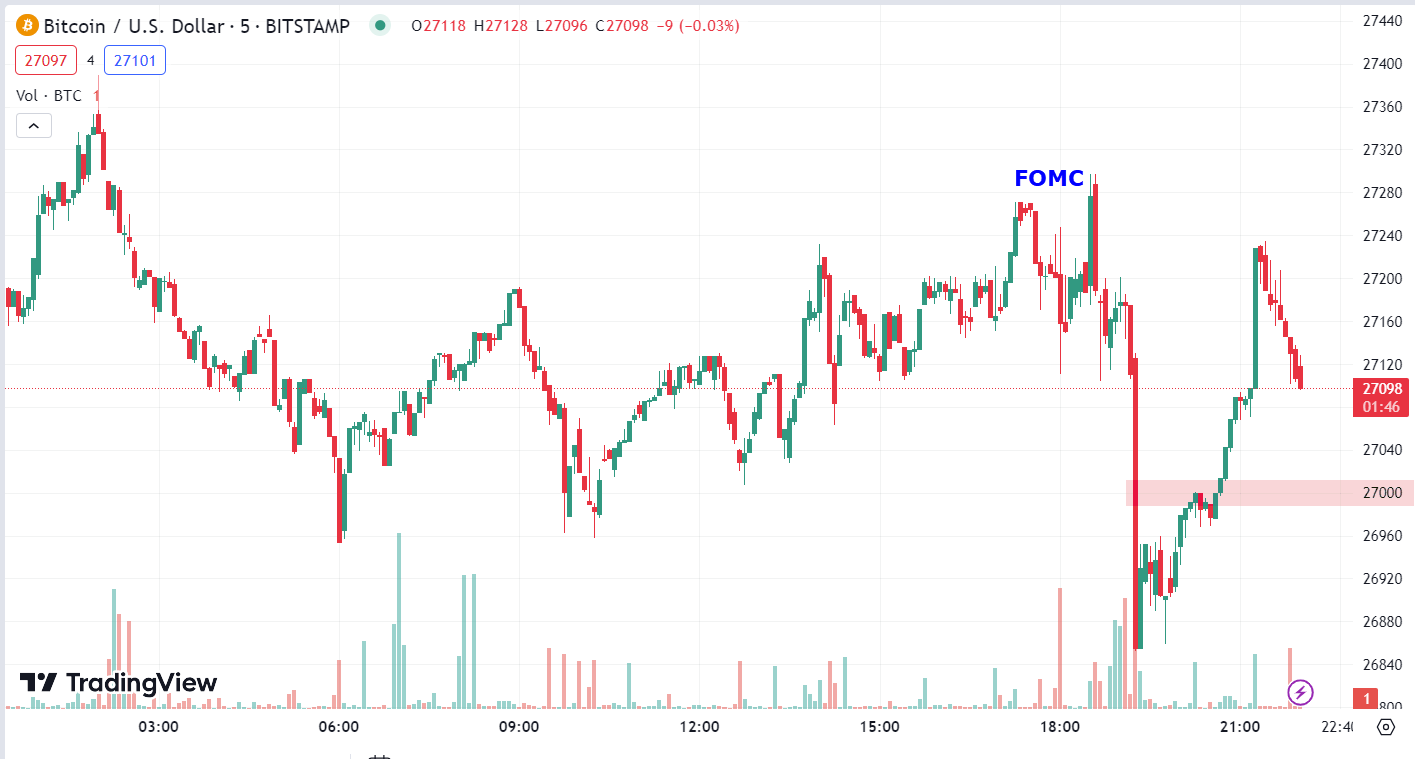
BTC/USD (5m) jumped above $27k, but risk of sentiment pulled it back below. It has since returned back above.
Summary
The two main takeaways from the FOMC today were, (1) Policy rates are being projected by the Fed to remain higher for longer and (2) Fed officials are not expecting to cut rates in 2024 as much as they were anticipating when they updated their forecasts in June. How much things change between a meeting, and they’ll continue to change. The Fed is pretty much groping around in the dark at this point, hoping they got it right, but not even Powell has any conviction in the “soft landing scenario”, to say nothing of the “No landing / no recession scenario” that bulls continue to cite as reasons behind their bullishness at this point.
*POWELL: WOULDN’T CALL SOFT LANDING A BASELINE EXPECTATION
*POWELL: WOULDN’T WANT TO HANDICAP LIKELIHOOD OF SOFT LANDING
Considering the mega-cap weakness the first half of today on lower yields (unusual), it almost seems as if a large fund or large funds had a head’s up, not wanting to buy stocks they knew would get hit hard on a more hawkish Fed. Usually I’d only mention this as a possibility because it’s impossible to know, but when I looked at the 3C charts of short term, Fed-sensitive 2-year Treasury futures today, I noticed 3C was far more negatively divergent at the 2-yr tenor than any other tenor, which again suggests that this was a large, well connected fund or multiple large funds (e.g.- Goldman Sachs/JP Morgan) with equity and bond trading, and in size.
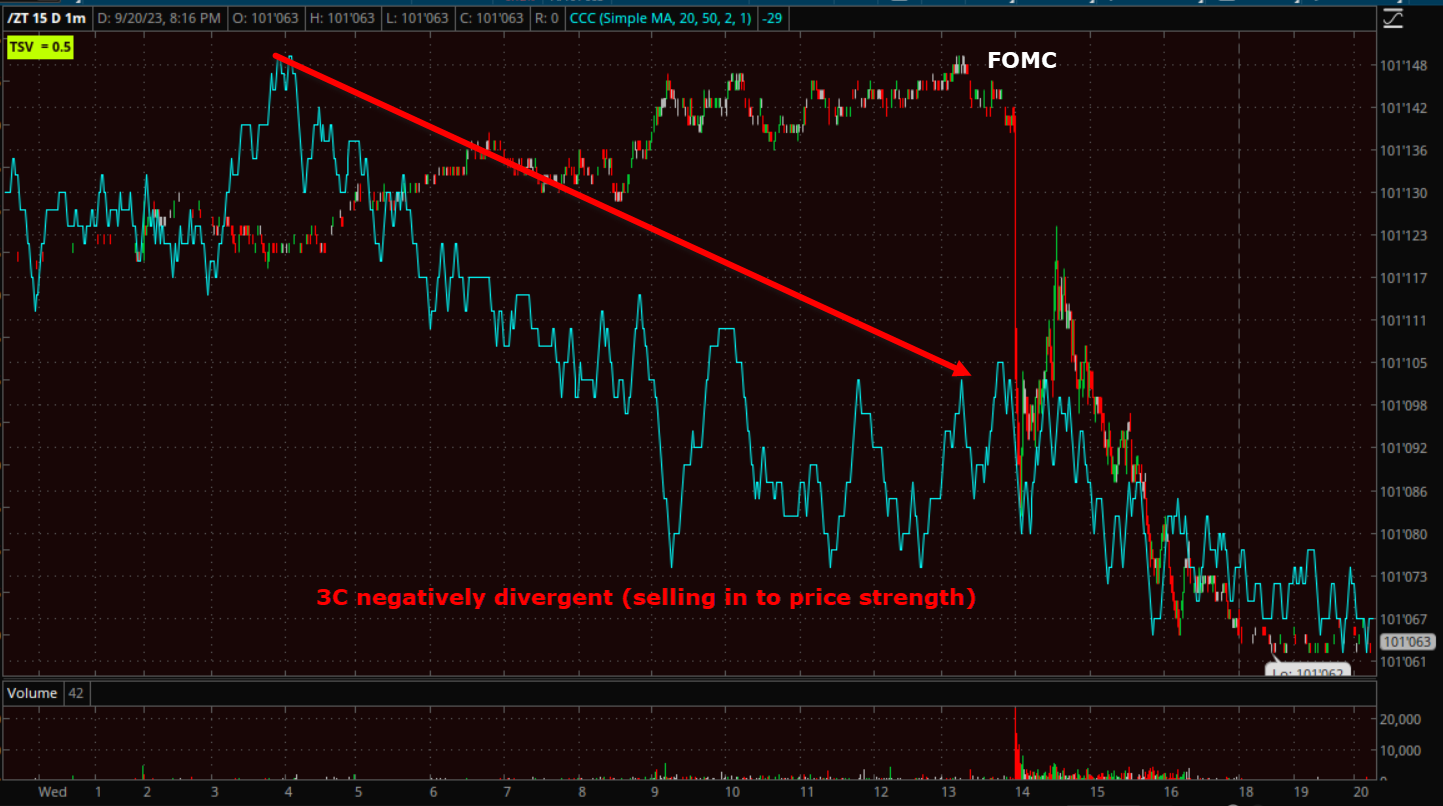 2-year UST futures (1m) and 3C.
Considering that, and the fact the mega-caps were notable laggards while yields were lower up until the Fed, suggests to me that someone knew something, whether due to a leak, or just putting the puzzle pieces together. There are some smart people working for these companies, and then some not so accurate. I’m not saying not smart, but bad calls like JPM’s Marko Kolanovic whose calls have been so off, he’s approaching Dennis Gartman notoriety as a contrarian indicator. If you’ve been with me for a few months, and many of you have been with me for years if not a decade or more, you know I’m not one to toot my own horn, but I find it suspicious that my calls have been FAR more accurate than someone like Kolanovic, and I’m not paid millions to do what I do.
As for the elephant in the room that most traders and investors are completely unaware of…
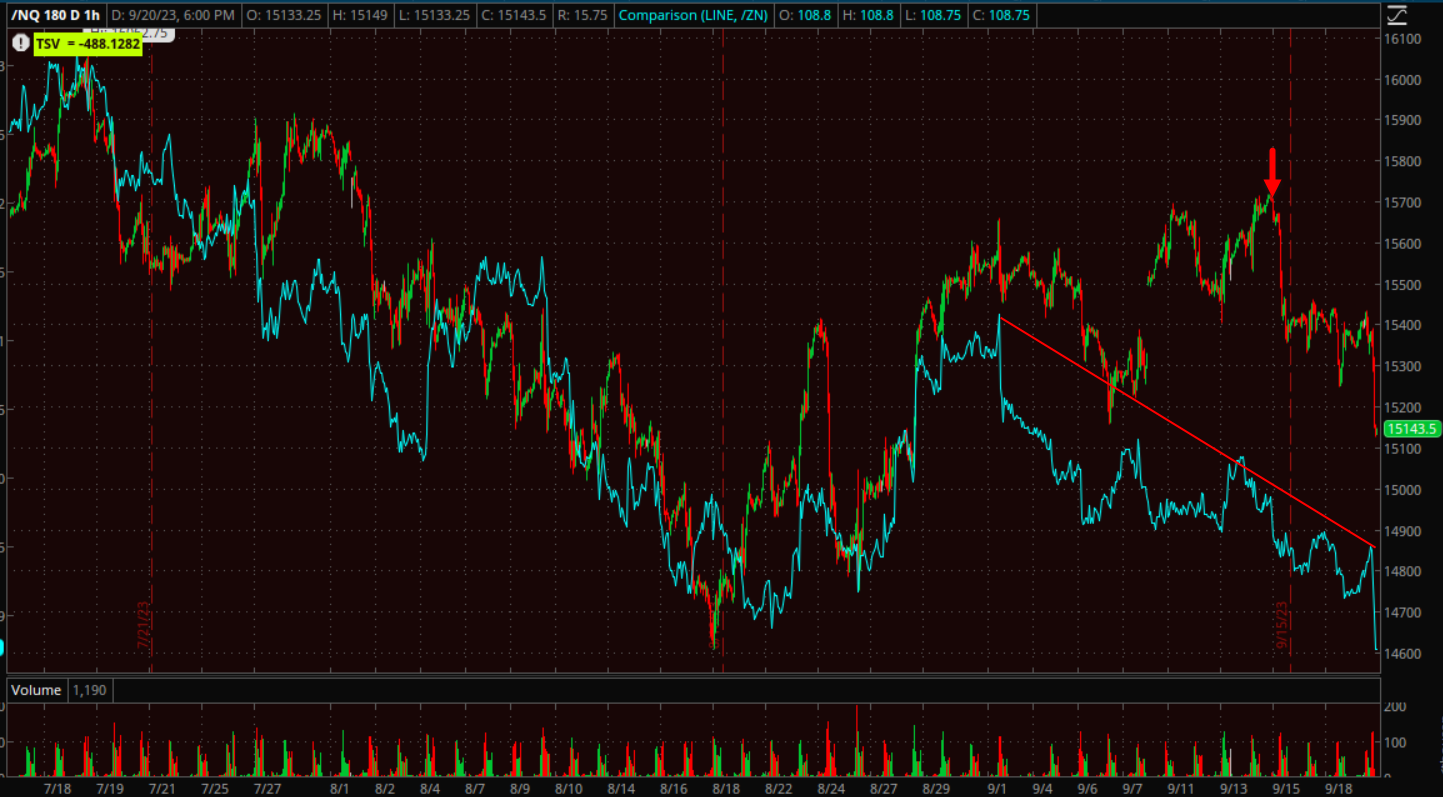 As I’ve been saying nearly every day for week, index futures (NASDAQ-100 60m) are being led lower by Treasuries, or more appropriate, higher TSY yields (which move inversely to TSY prices). Today we got a decent amount of catching down, but there’s more to go and if I just use a rough estimation, yields suggest that NDX and SPX should be moving down to their H&S neck lines as that’s where the inverse correlation with yields is leading them.
Employment data is not my favorite “leading indicator” for the economy as we often see the economy in recession well before the unemployment rate has moved up, and the economy is often well out of recession 12 months before the unemployment rate starts to come down. I know this is controversial as many claim the labor market is a leading indicator. I’ll not get into a long winded explanation here as to why I think that it’s not a great leading economic indicator as I have covered this in the past. However, I do respect Jeff Gundlach and he believes the unemployment rate crossing above its 3 year average is a strong leading indicator for recession, so while this is my first time looking in to this, I’ll certainly give the man the benefit of the doubt. Here’s what that looks like…
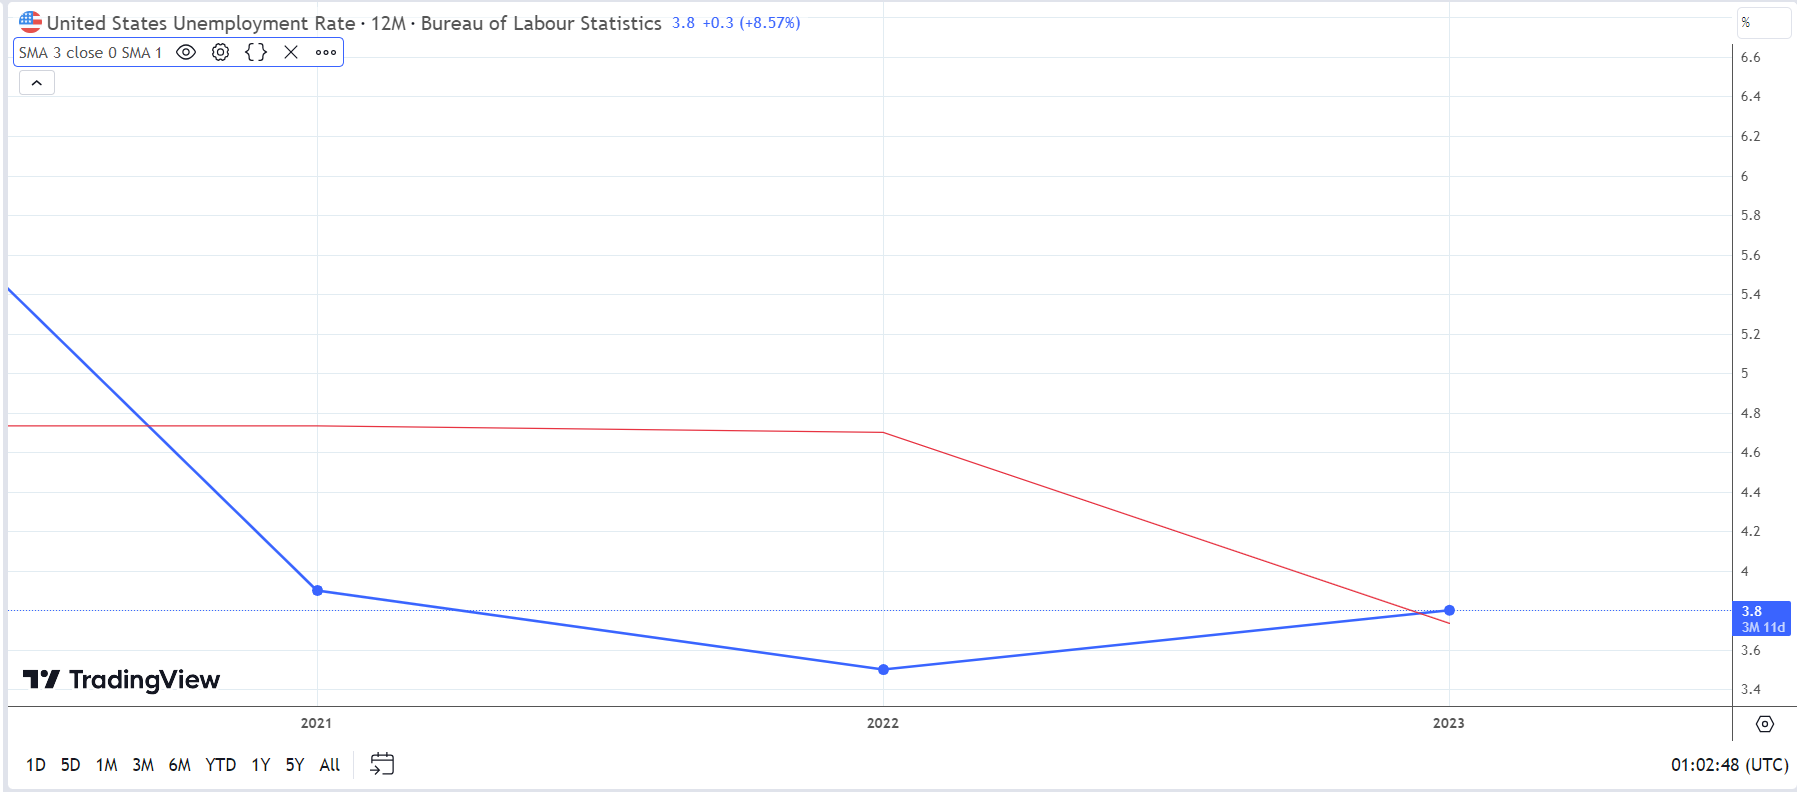 US Unemployment Rate (12 month) crossing above its 3-year average (red). This is another data point that stands in stark and incomprehensible contrast to the Fed’s view that the unemployment rate is set to come down the next 2 years, while they also project higher for longer rates. It makes no sense.
On average the U.S. experiences a recession 14 to 18 months after the yield curve inverts. The 2s-10s spread inverted in June of last year, and the Fed’s preferred yield curve — the 3 month less 10-year spread — inverted last October.
The Dot-Plot and SEP saw 2024 and 2025 rate projections each rose by a half-percentage point, cutting out 50 basis points of rate cuts for each year since the June meeting. Yet the Fed’s Median projection for economic growth in 2023 jumped to 2.1% from 1% in June; while the Fed significantly reduced unemployment forecasts and now expects the jobless rate to peak at 4.1%, rather than 4.5%. How does any of this make sense?
Even a reported from Bloomberg asked the question of Powell: “In June there was a 5.6% median forecast for the fed funds rate, since then the Fed doubled its growth forecast and lowered unemployment significantly” then asked, “How much confidence can Americans have in your forecasts?” SPOT On!
The Fed estimated that r* remains at 0.5%, and yet rates in 2026 — when US debt may hit $50 trillion — will be 3%. This means that blended interest on US debt will be ~$2 trillion, double where it is now. Sustainable? That’s a rhetorical question.
At least 8 months before the Fed even began its rate hike cycle, I said they would, and that Powell and the Fed were knowingly trading a recession for taming inflation. I’ve made mention numerous times this year the ways in which Powell has admitted as much. Today’s latest admission comes from Powell: “Monetary policies’ role is of suppressing demand”, which is yet another implicit admission that the Fed is more than willing to trade an recession for defeating inflation. I don’t disagree with the idea as inflation is much harder to deal with than a recession, but this should wake investors up to the fact that a soft landing is not probable, and while the Fed would like to see that outcome like a little girl would like to se a Unicorn, they know it’s not probable. An inverted yield curve has not failed to forecast a recession in the U.S. and the curves are the most inverted in 40 years. To go one step further, the S&P has never bottomed before the onset of a recession so the probability that last year’s bear market lows are the cycle lows are virtually nil.
To drive home the point of what the Fed wants to see, Powell said that the LAST JOBS REPORT IS GOOD EXAMPLE OF WHAT WE WANT TO SEE. The last jobs report was notably weak.
In short, the Fed is more hawkish with its forecast for rates, but at the same time signaled a ‘soft landing’ with higher growth forecasts. Yet no reasonable explanation as to how the Fed arrived there.
We’ll pick up the short term price expectations tomorrow morning. The S&P’s put wall at $4400 should provide some support, but the closes at session lows are ugly.
Overnight
S&P futures are down -0.3% tonight, while NDX and R2K futures are down closer to -0.4%.
The U.S. Dollar Index is up +0.4%, not good for stocks.
WTI Crude futures are down -0.75%, so this is looking more like the consolidation forecast at the half-way point of the upside measured move.
Gold futures are down -1%, remember they settled before the spike in yields/FOMC.
Bitcoin futures are down -0.1% at $27,025.
More ominously, the 2-year yield is up +7 bp and the 10-year up +9 bp.
Looking ahead, Thursday’s economic calendar features:
- 8:30 ET: Weekly Initial Claims (prior 220,000), Continuing Claims (prior 1.688 mln), Q2 Current Account Balance (prior -$219.3 bln), and September Philadelphia Fed Survey (prior 12.0)
- 10:00 ET: August Existing Home Sales (prior 4.07 mln) and August Leading Indicators (prior -0.4%)
- 10:30 ET: Weekly natural gas inventories (prior +57 bcf)