Daily Wrap – NASDAQ Larger H&S Top Forming
Index futures faded overnight gains, which likely had something to do with anxiety over China’s Evergrande and contagion concerns as Fantasia Holdings Group Co. didn’t repay a $205.7 million bond that was due Monday. Although yields were higher (10-year up 4 bp overnight), I don’t think that was the initial cause as demonstrated in the A.M. Update...
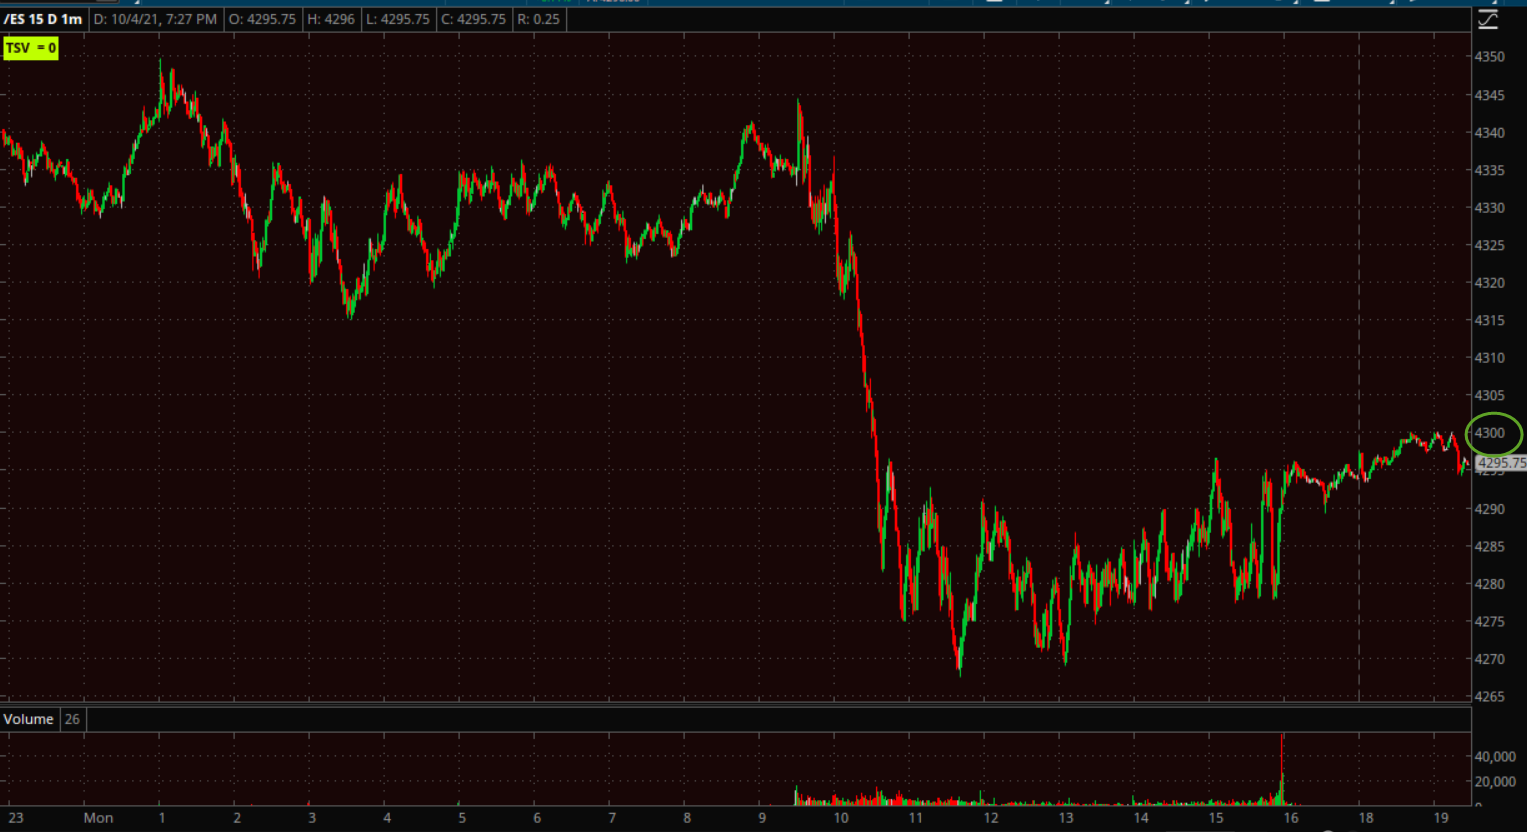
“Yields are up and Index futures are down, but it doesn’t look like yields were the catalyst for index futures overnight slide.
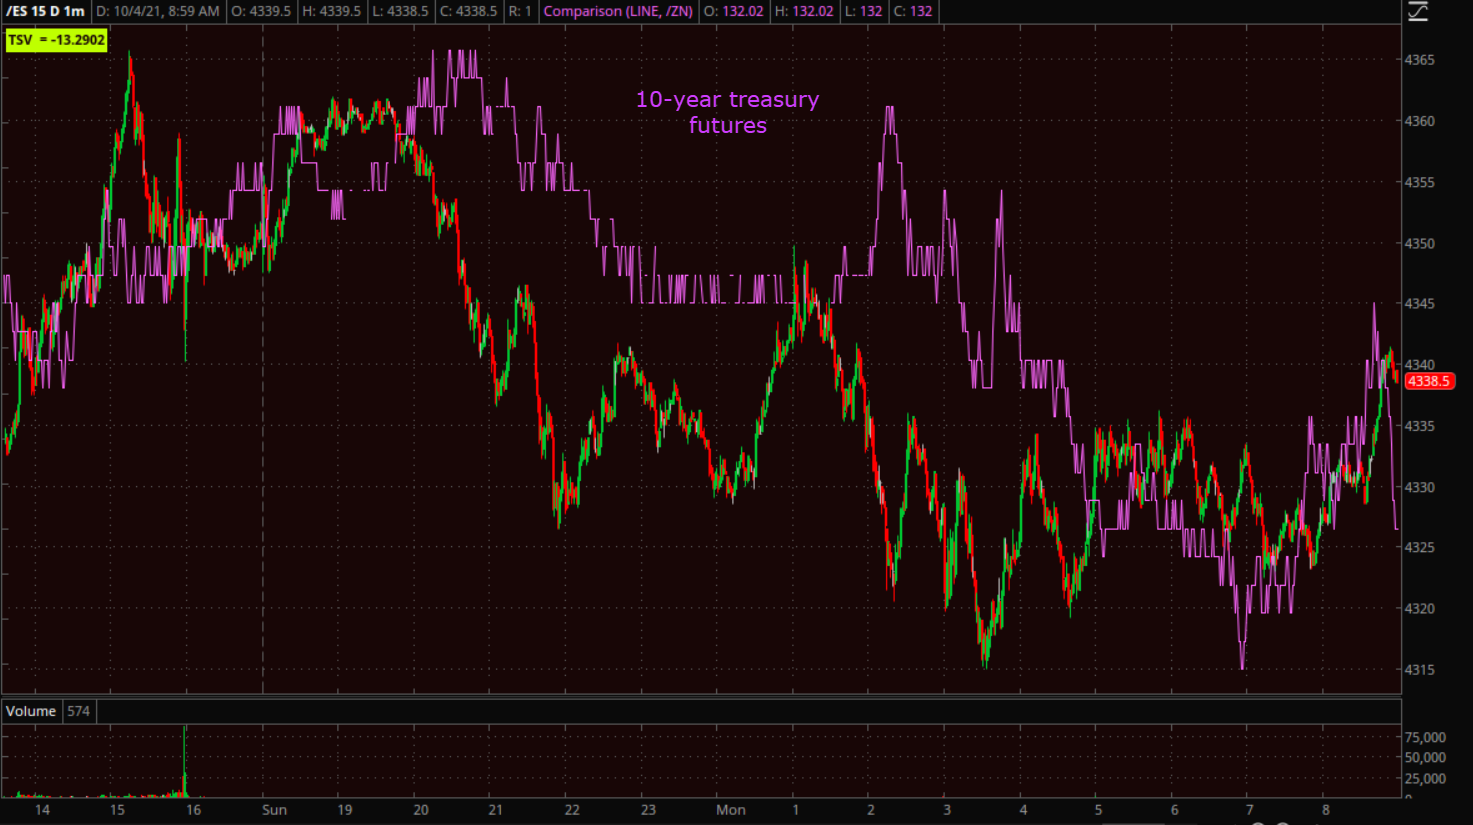 S&P futures (1m) started down before 10-year Treasury futures”
However, I also pointed out…
“Still, higher yields are a headwind, especially for large-cap Tech stocks. “
And that was spot-on as mega-caps were thrashed at the U.S. cash open dragging down the NASDAQ-100. It didn’t take long for the mega-cap losses to trickle over to the broader market. The FAAMGs (Facebook, Amazon, Apple, Microsoft and Alphabet) represent a quarter of the S&P’s market cap.
 NASDAQ-100 futures (1m)
In Washington, the House will reportedly delay its vote on the $1 trillion bipartisan infrastructure bill until a deal is reached on the larger reconciliation package. President Biden suggested the latter could be trimmed down to $1.9-2.3 trillion from $3.5 trillion. Separately, the USTR confirmed that current Chinese tariffs will remain in place.
Monday’s economic data was limited to Factory Orders for August, which increased more than expected, up 1.2% (consensus 1.0%) following an upwardly revised 0.7% increase (from +0.4%) in July.
Averages
NASDAQ-100 was the worst on the day, down as much as 2.65% intraday. Small Caps were best on a relative basis. Dow Transports (-0.3%) did relatively well which may be a positive sign for the Dow as we get further into the week.
S&P 500 ⇩ 1.30 %
NASDAQ ⇩ -2.16 %
DOW JONES ⇩ -0.94 %
RUSSELL 2000 ⇩ -1.08 %
After holding there Friday with a bullish hammer, NASDAQ-100 broke under its 100-day and posted its lowest close since June.
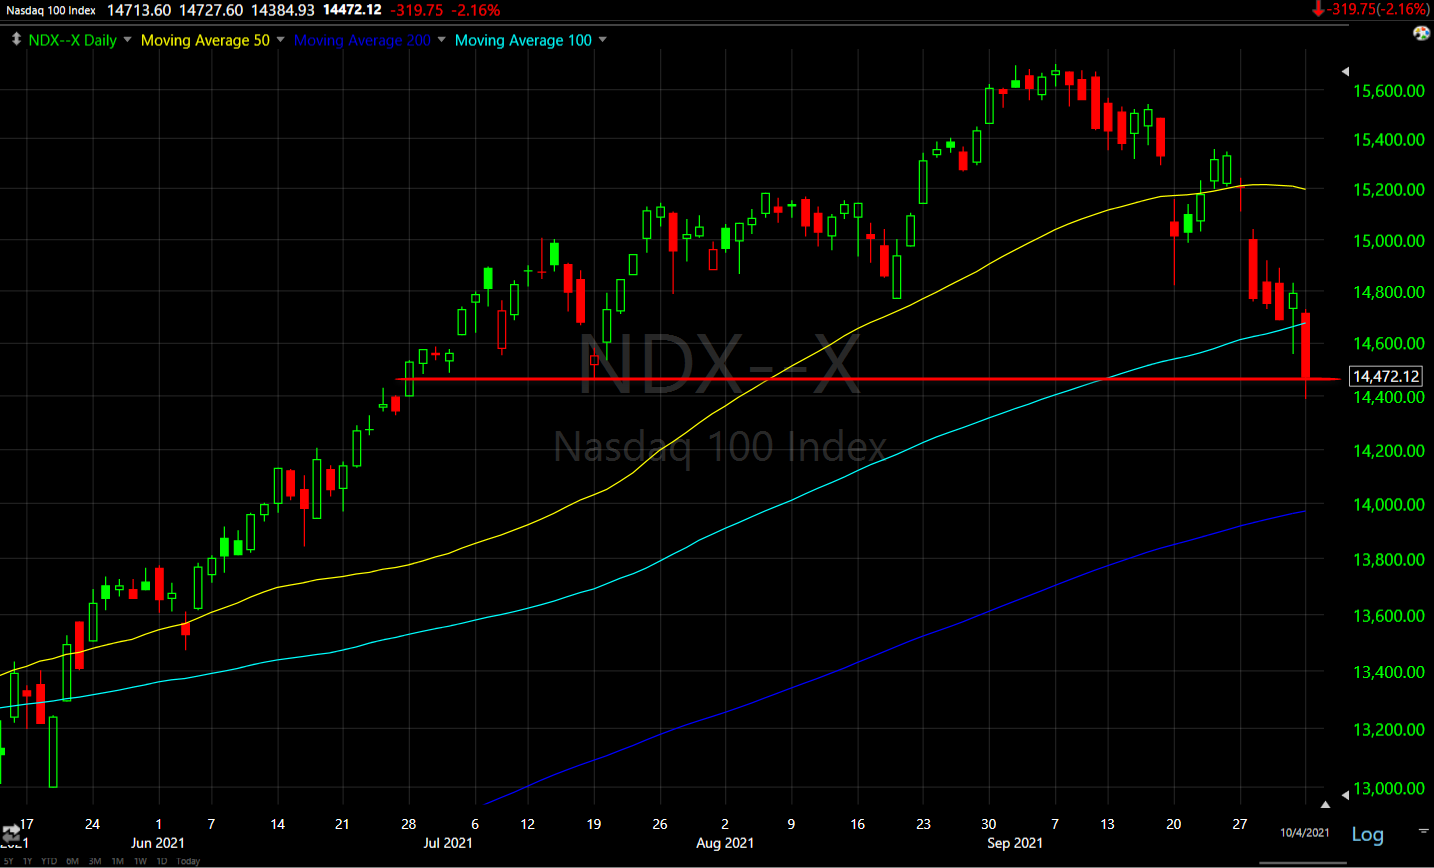 NASDAQ-100 (daily) w/ 50-day (yellow), 100-day (light blue) and 200-day (dark blue ) sma’s. In doing so, NASDAQ followed the S&P and Dow in tracing out and confirming the neckline of a much larger probable Head and Shoulders top, but I’d expect some better symmetry on the right side which would require a decent bounce from here.
After closing above its 100-day on Friday, the S&P-500 met resistance there again this morning…
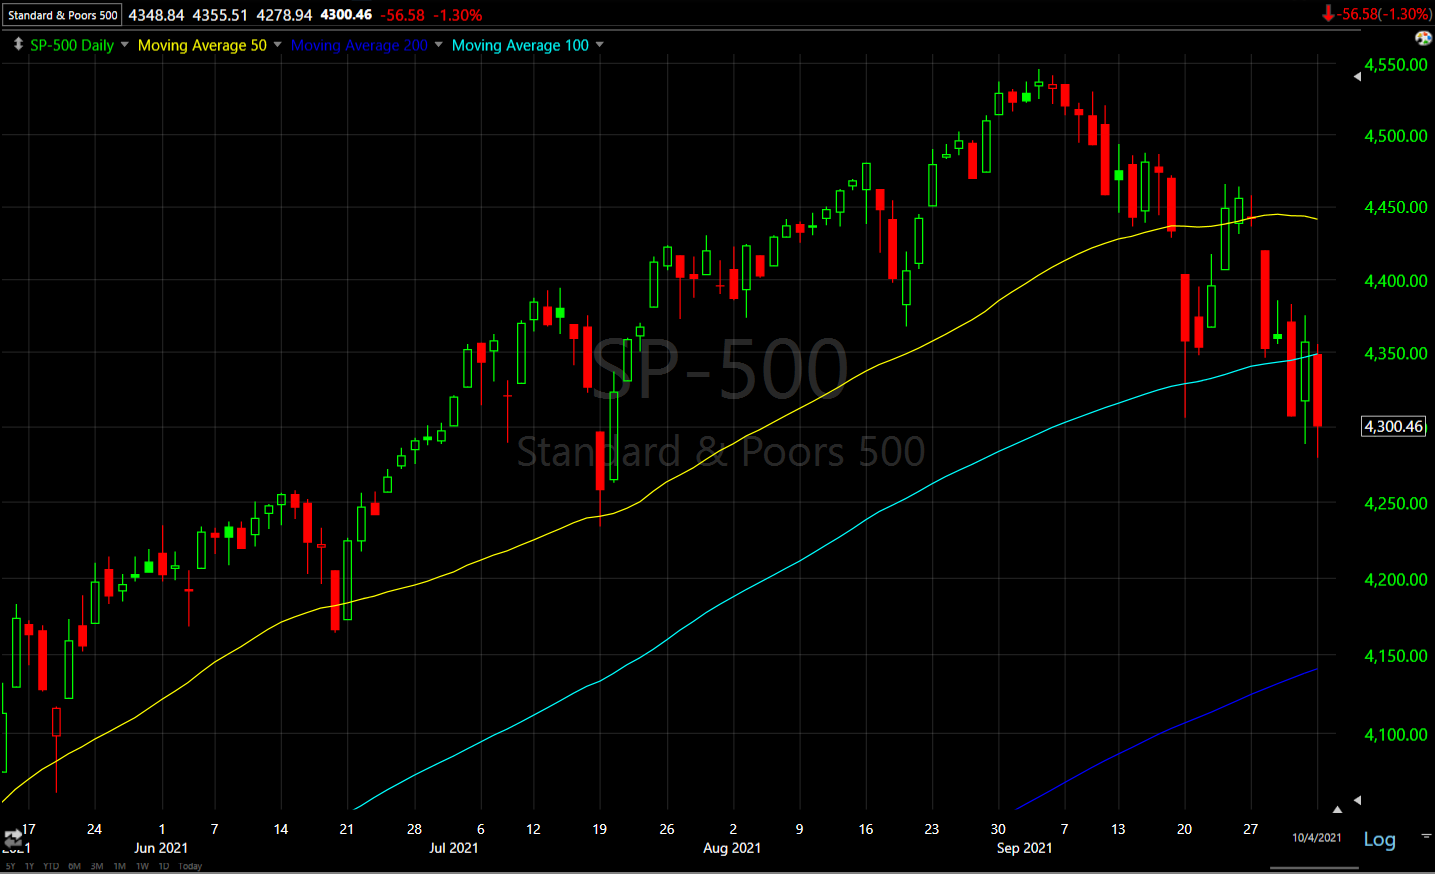 SP-500 (daily) w/ 50-day (yellow), 100-day (light blue) and 200-day (dark blue ) sma’s. And in doing so, tested and confirmed the neckline of a much larger H&S top. Over the last year the S&P has found ample dip buyers at tests of its 50-day (yellow). This has been the most serious, deepest and longest lasting break of the 50-day in the last year.
 SP-500 (60m) tracing out the neckline of a much larger H&S top right around the psychological $4300 level.
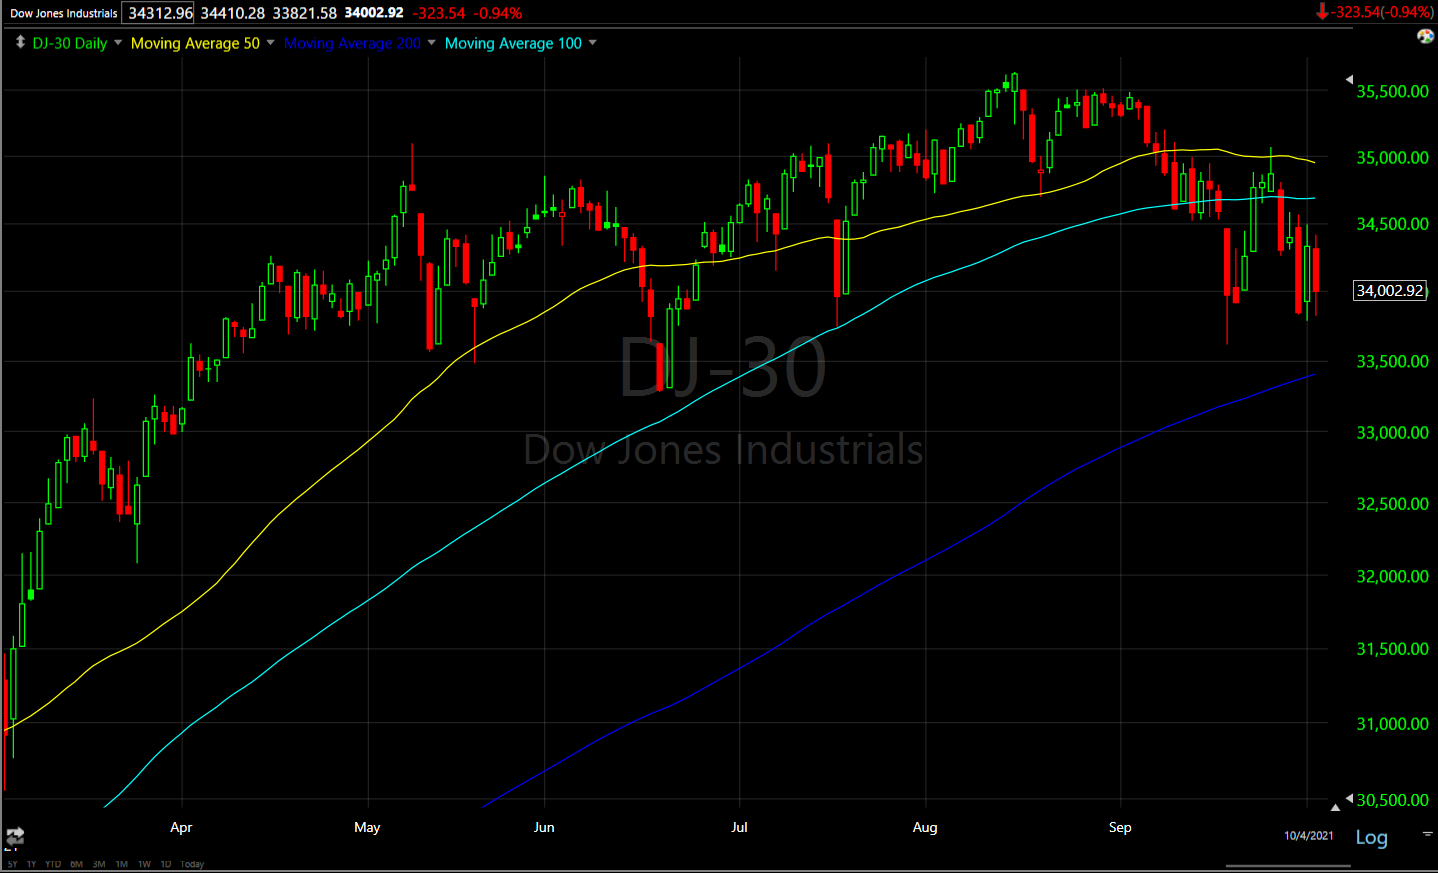 Since meeting resistance at its 50-day (yellow) and breaking its 100-day (blue) the Dow (daily) has no nearby technical support, but also is confirming the neckline of a larger H&S top after already putting in, and meeting the downside measured move of a smaller H&S top in September.
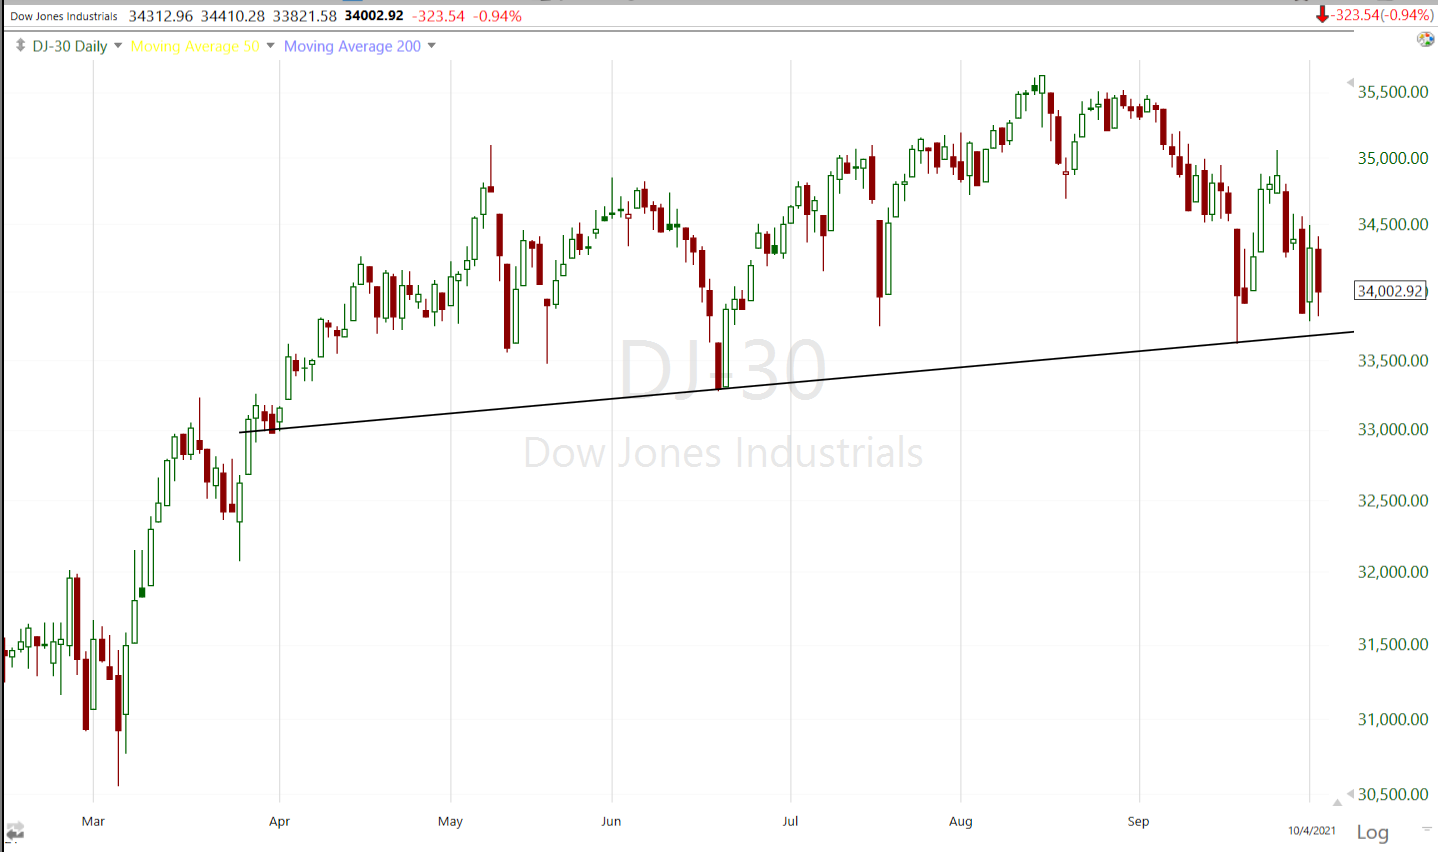 Dow (daily) there are a couple of interpretations of the neckline, like this…
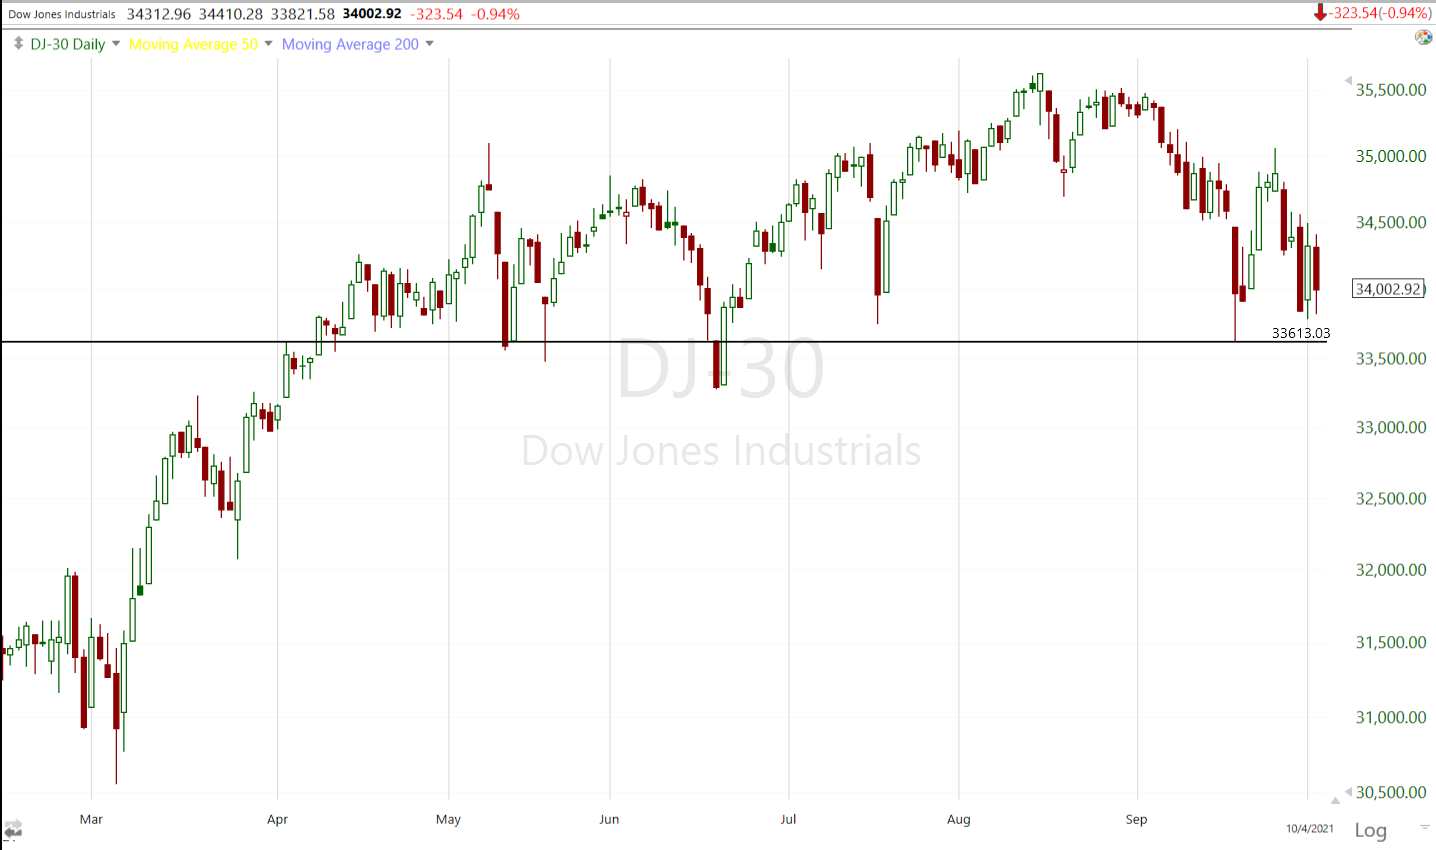
Or like this. Either way, volume is exactly what you’d expect to see in a H&S top and volume is just as important as the price formation itself for a H&S. Among price patterns, volume confirmation may be the most important in distinguishing a likely H&S top from an unlikely H&S price pattern.
Small Caps have a lot of technical levels all converging in the same area.
 IWM (daily) w/ 50-day (yellow), 100-day (light blue) and 200-day (dark blue ) sma’s all converging right around the initial 2021 toppy neckline. There are two potential necklines as well.
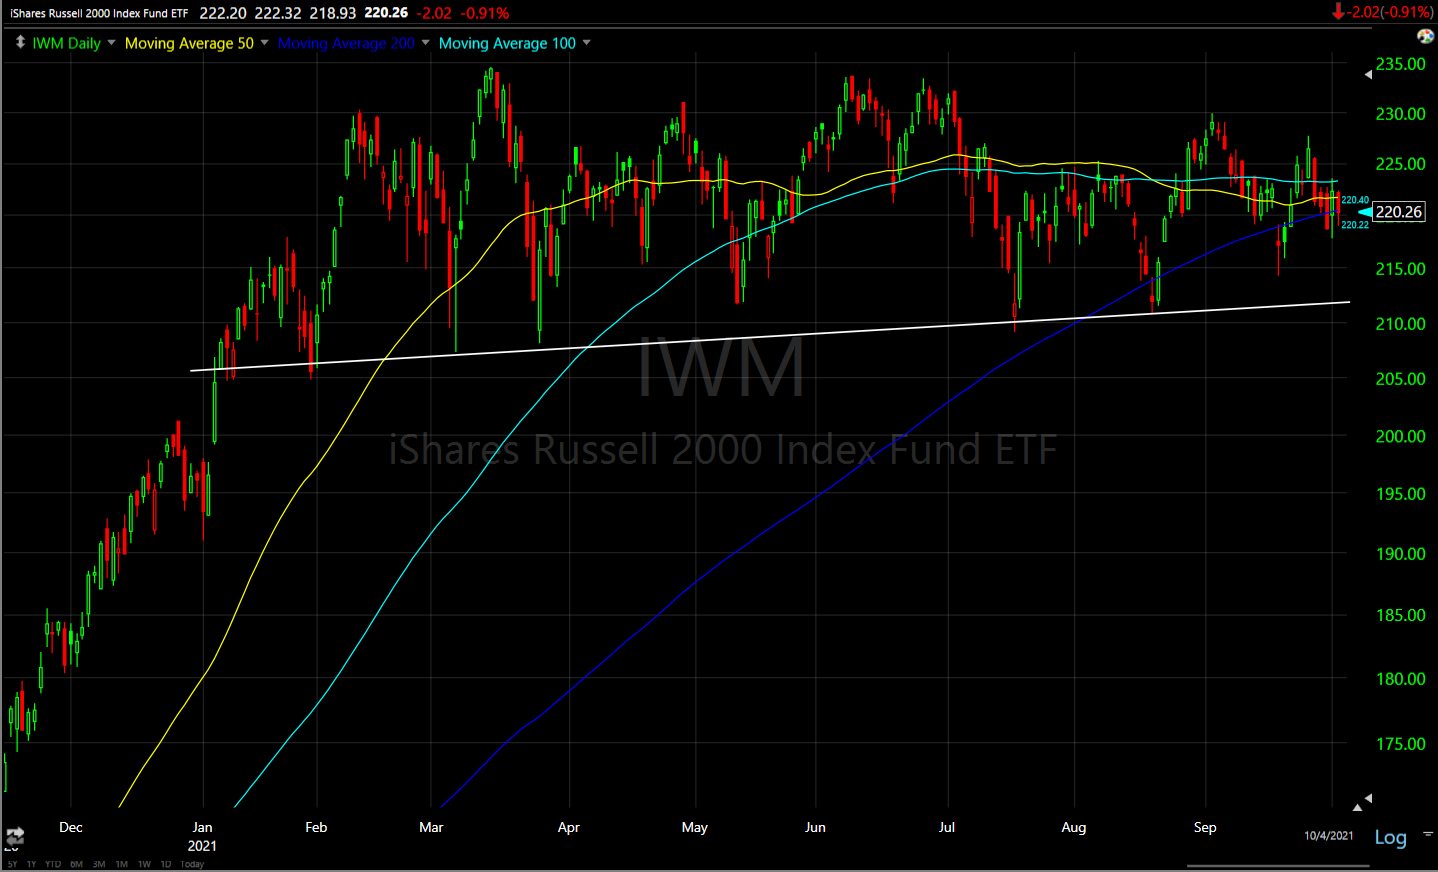 IWM (daily) this is the second that takes into account more recent price action, but price does keep gravitating to the original trend line above.
S&P sectors
Eight of the 11 S&P 500 sectors finished lower, led by the mega-cap heavy Technology and Communication sectors with losses over 2.0%. The Vanguard mega-cap growth index (MGK) was down -2.25%.
Facebook (FB -4.9%) was the big loser amid claims from a whistleblower that the company prioritized profits over safety, and Facebook, Instagram and WhatsApp all seeing major service disruptions throughout the day. Meanwhile, Amazon (AMZN -2.85%) gave back all of its gains for the year and is now down YTD. Tesla (TSLA +0.8%) bucked the trend of selling in mega-caps as the company reported a record number of deliveries (241,300 vehicles) in the third quarter.
Energy was the best performing sector. Energy stocks followed oil prices (+2.4%) higher after OPEC+ agreed to maintain its plan for gradual supply increases, which was on the bullish side of outcomes for oil prices. As the day went on a more defensive bias emerged with Utilities, Real Estate and Consumer Staples displaying relative strength as bond yields came off morning highs.
All things considered, Banks did reasonably well on a relative basis (KBW Bank Index -0.1% and Regional Banks +0.35%) as they tend to do well amid higher yields.
Materials ⇩ -0.44 %
Energy ⇧ 1.63 %
Financials ⇩ -0.87 %
Industrial ⇩ -0.54 %
Technology ⇩ -2.32 %
Consumer Staples ⇩ -0.30 %
Utilities ⇧ 1.38 %
Health Care ⇩ -1.52 %
Consumer Discretionary ⇩ -0.79 %
Real Estate ⇧ 0.11 %
Communications ⇩ -2.16 %
The semiconductor space was another weak spot after an observation from Marvell (MRVL -3.7%) that the semiconductor shortage could extend through 2022. The Philadelphia Semiconductor Index fell -2.5% to test to its 200-day sma for the first time in more than a year (May of 2020 shortly after the COVID crash).
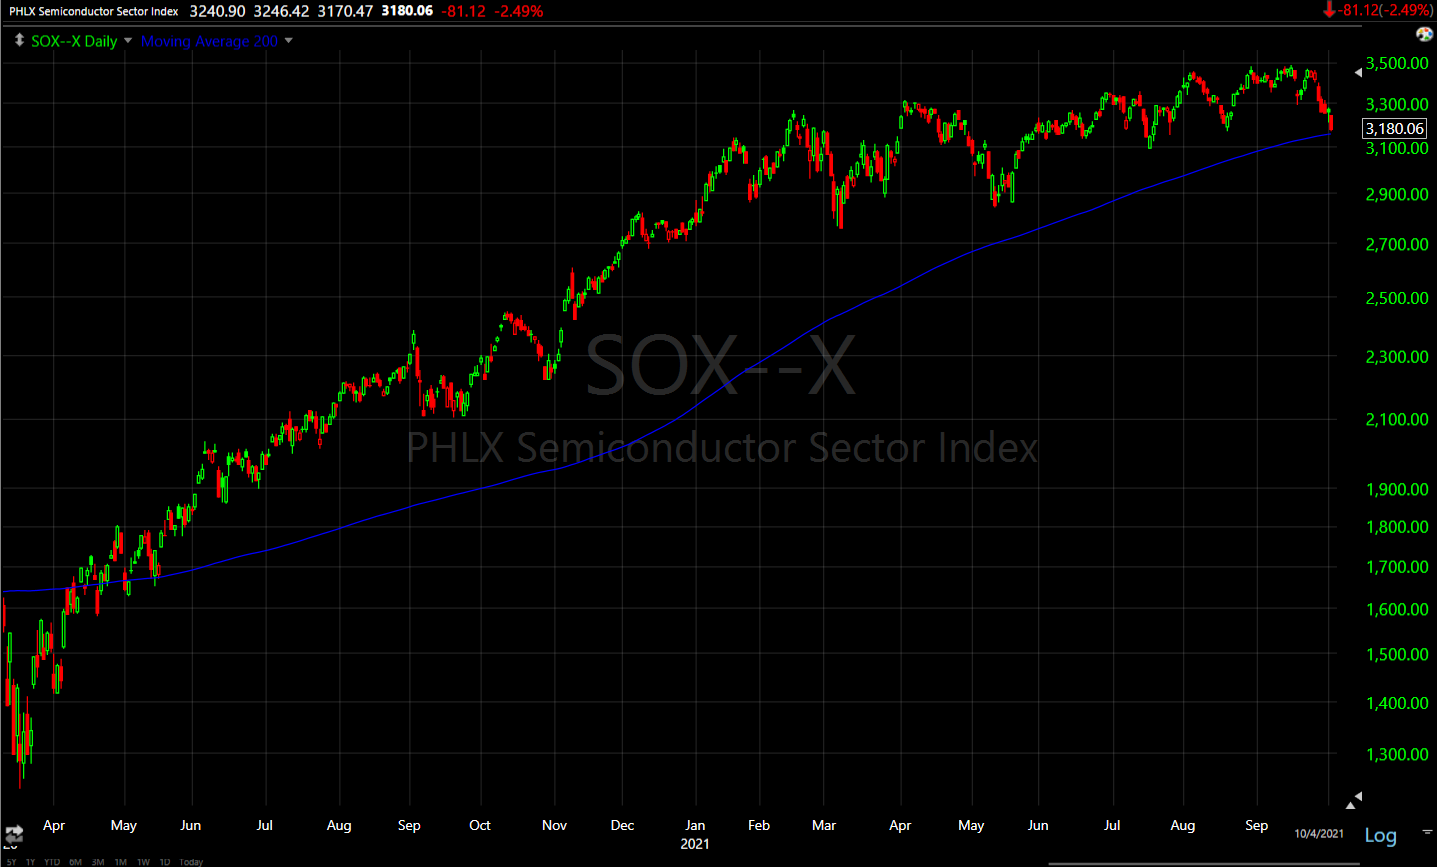 Philly Semiconductor Index (daily)
I’ve been looking through S&P sectors since there hasn’t been an leadership since the first week of September and most are in some large lateral trend. We’ve seen the lightly weighted Energy sector outperform recently, but that’s not a good sign for the broader market as it has surged on sharply higher Crude and Natural Gas prices which is inflationary. Even the Energy sector has a toppy H&S-like price pattern, but in its case, volume does not confirm. More broadly, I can only find one S&P sector that looks like it may still be in an uptrend (Consumer Discretionary), the rest have gone into lateral or toppy trends and/or broken key technical levels that have been formerly respected.
Internals
NYSE Decliners (2107) outpaced Advancers (1174), but just shy of a 2-to-1 margin, on heavier Volume of 1 bln shares.
The Dominant price/volume relationship is strong at Close Down/Volume Up, which is typical of a 1-day oversold condition. Sector performance also suggests 1-day oversold, but Decliners should be at least 2-to-1 (or greater) over advancers. It’s a tough call, but because of the price/volume relationship’s dominance, I’d say today’s internals are 1-day oversold. Breadth oscillators are right in the middle around 50 (on a zero to 100 scale) and not oversold, but not overbought either.
Unlike the September 21st market low, new NYSE 52 week lows are still increasing, albeit marginally.
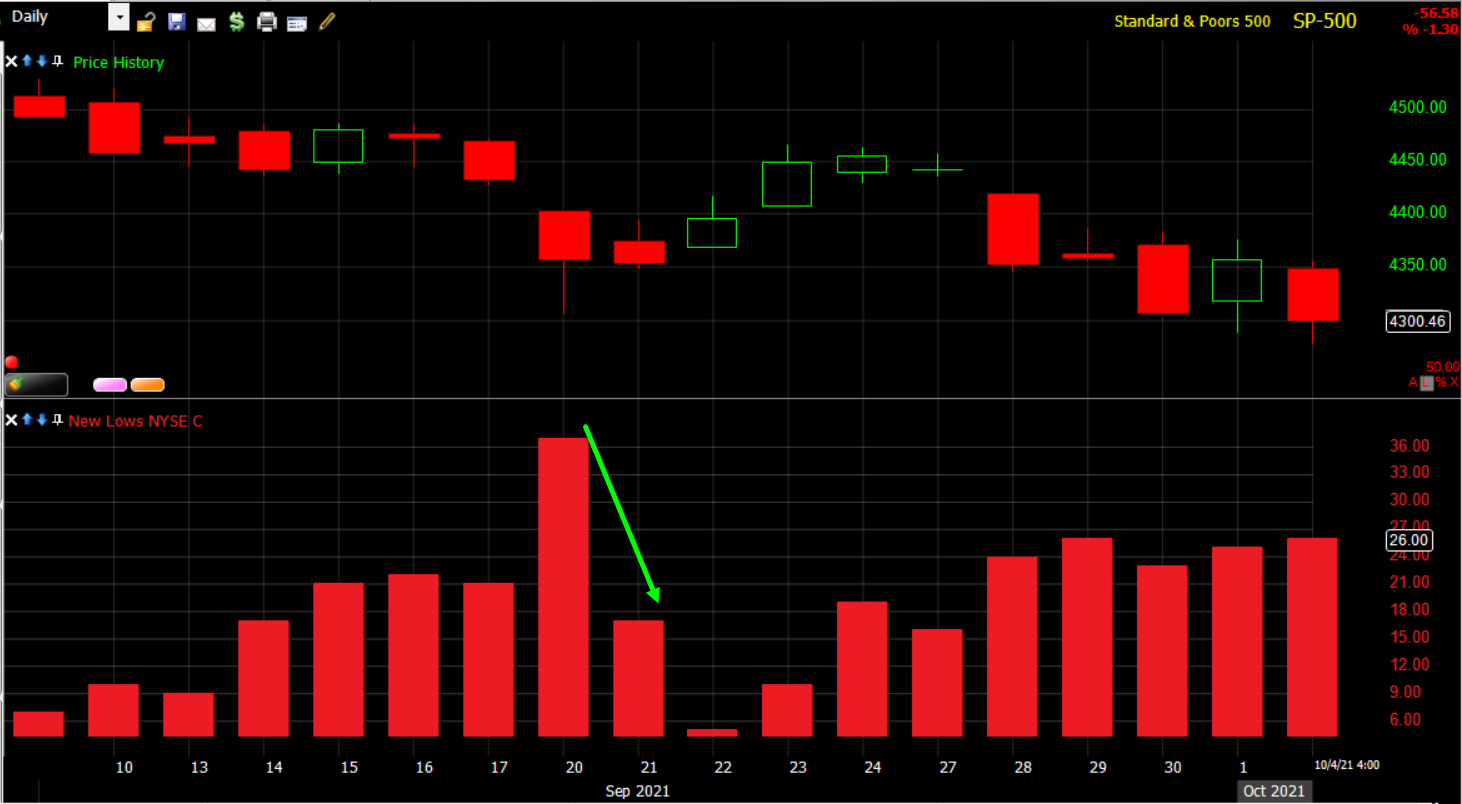 SP-500 (daily) and NYSE new 52 week low. New lows aren’t acting unusually, but it would be bullish if they fell on a down day (like at the green arrow).
On a more positive note, the NYSE Advance/Decline line is posting a positive relative divergence.
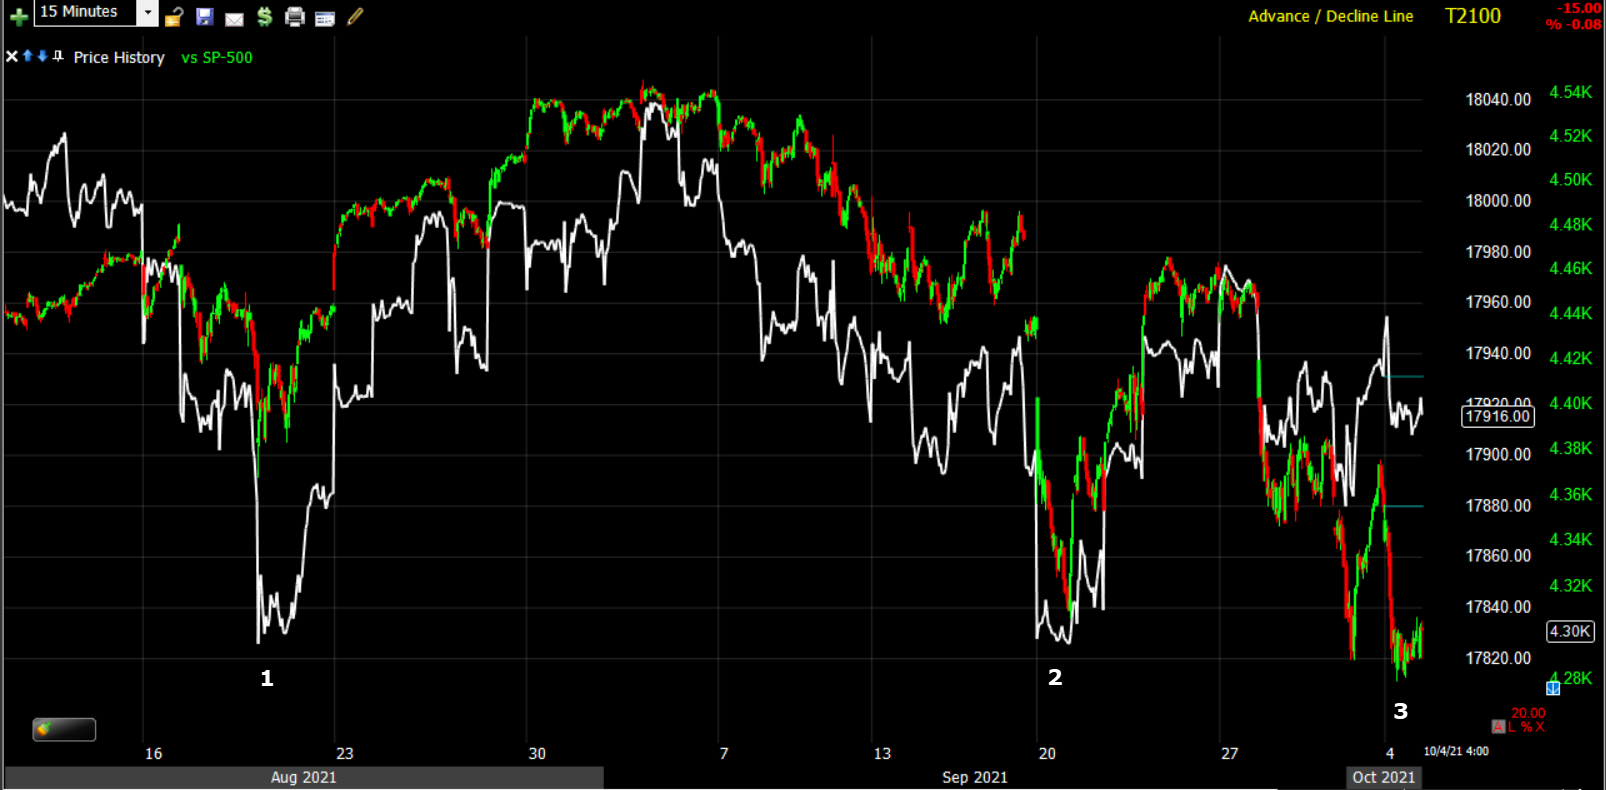 SP-500 (15m) and NYSE A/D line. The S&P has made 2 lower lows (#2 and #3) while the A/D line has made 2 higher highs, especially at #3 as the S&P tested its larger H&S neckline. This appears to be largely due to better relative performance of cyclical sectors as they tolerate higher yields better than mega-caps (unless the ROC is extreme like we saw last week and everything is taken down). The downside is that these sectors tend to be much more lightly weighted and less influential than the mega-cap heavy sectors.
On a quick side note, the Absolute Breadth Index is moving lower again down to 17 this morning (below 15 tends to see spikes in volatility soon after).
Treasuries
U.S. Treasuries settled mostly lower, meaning yields rose modestly, although spiked more substantially in the overnight session. The 10-year yield increased two basis points to 1.48% after touching the key 1.50% level shortly after the open, and the 2-year yield increased one basis point to 0.27%.
Yields are thus far consolidating bullishly (Treasuries bearishly) which suggests yields have another leg to the upside, which as we just saw, is a negative for the equity market, especially the mega-cap growth stocks. Higher inflation and Treasury yields makes the premium investors pay for high-growth stocks less attractive. Higher interest rates means higher discount rates for future earnings which many of the large and mega-cap stocks’ price multiples are based on.
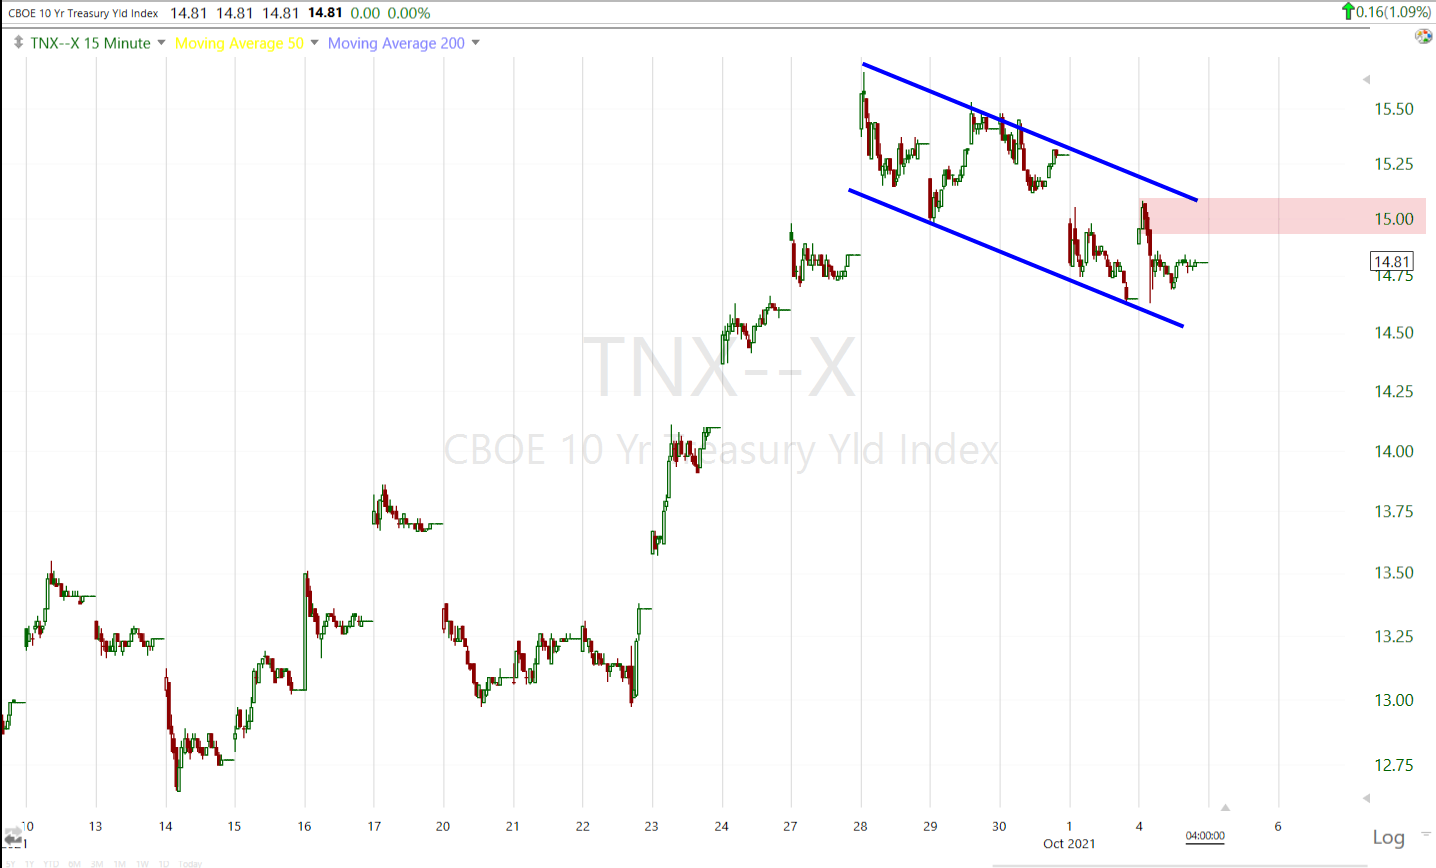 10-year yield (15m) since the rapid ascent higher after the FOMC, some technical levels were hit in the 10 and 30-year yields and they’ve consolidated/corrected since in what appears to be a bull flag. Note resistance intraday around the psychological 1.50% level.
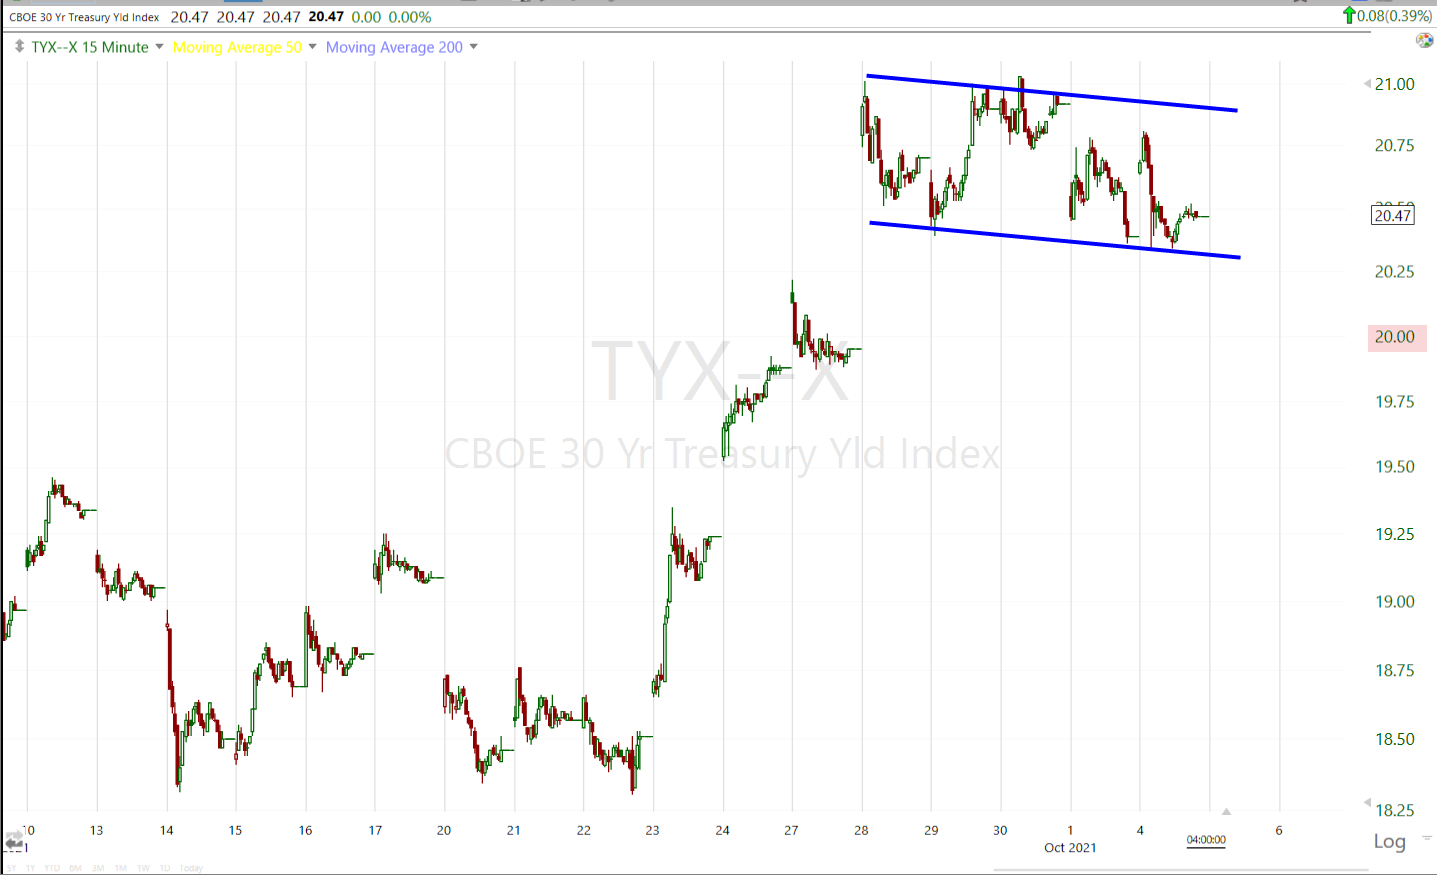 The 30-year yield (15m) looks similar in a bull flag suggesting a second, equal leg higher.
And as touched on in the Afternoon Update, TLT is trading in a bear flag under significant overhead supply with weakening 3C charts. ***Yields and bond prices move opposite each other.
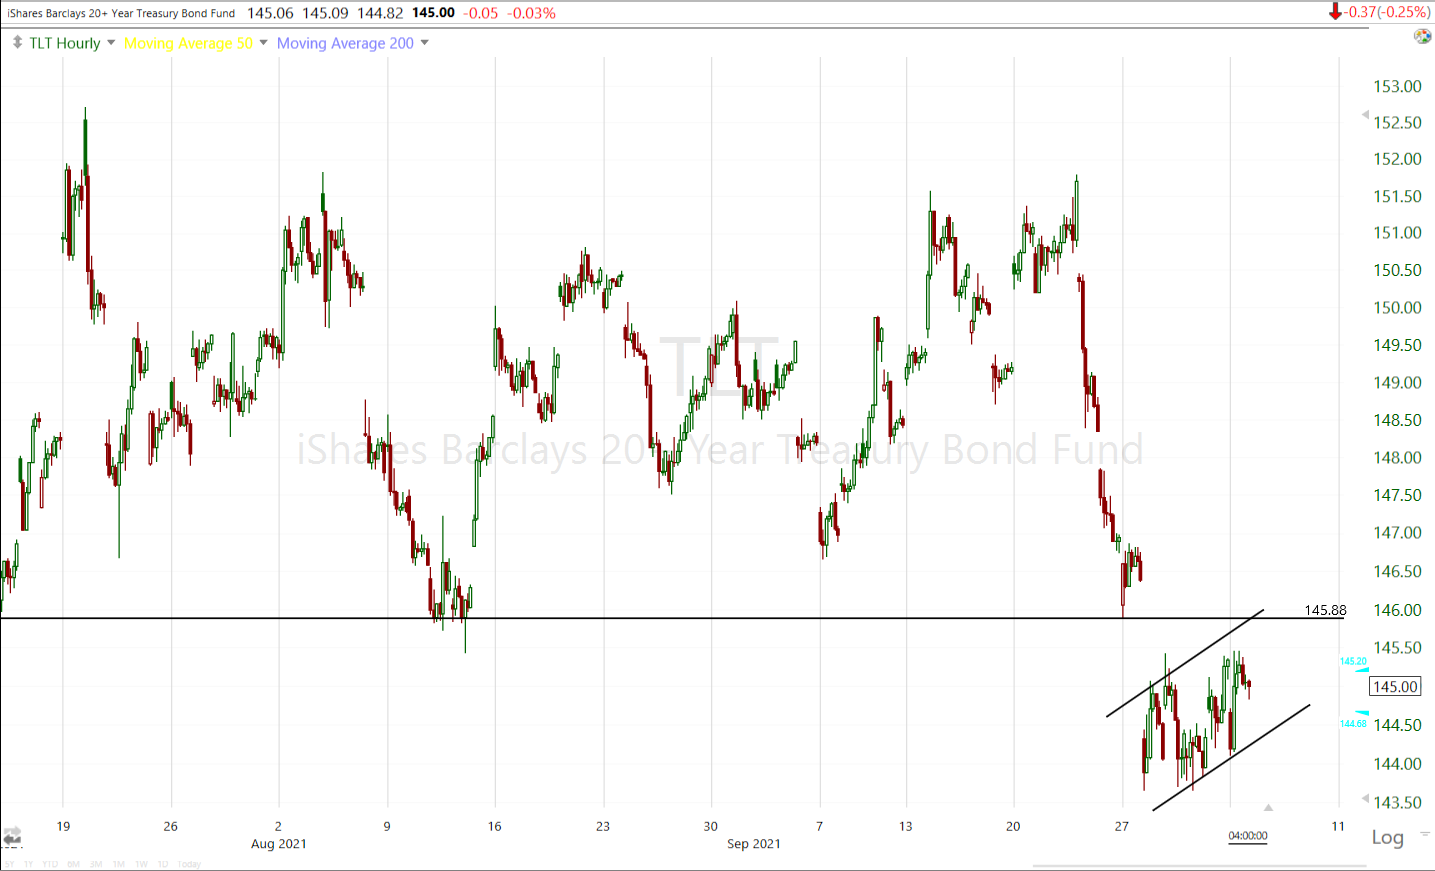 TLT (60m) bear flag
Credit showed more weakness today on an intraday basis, but it’s getting more worrisome on a trend basis.
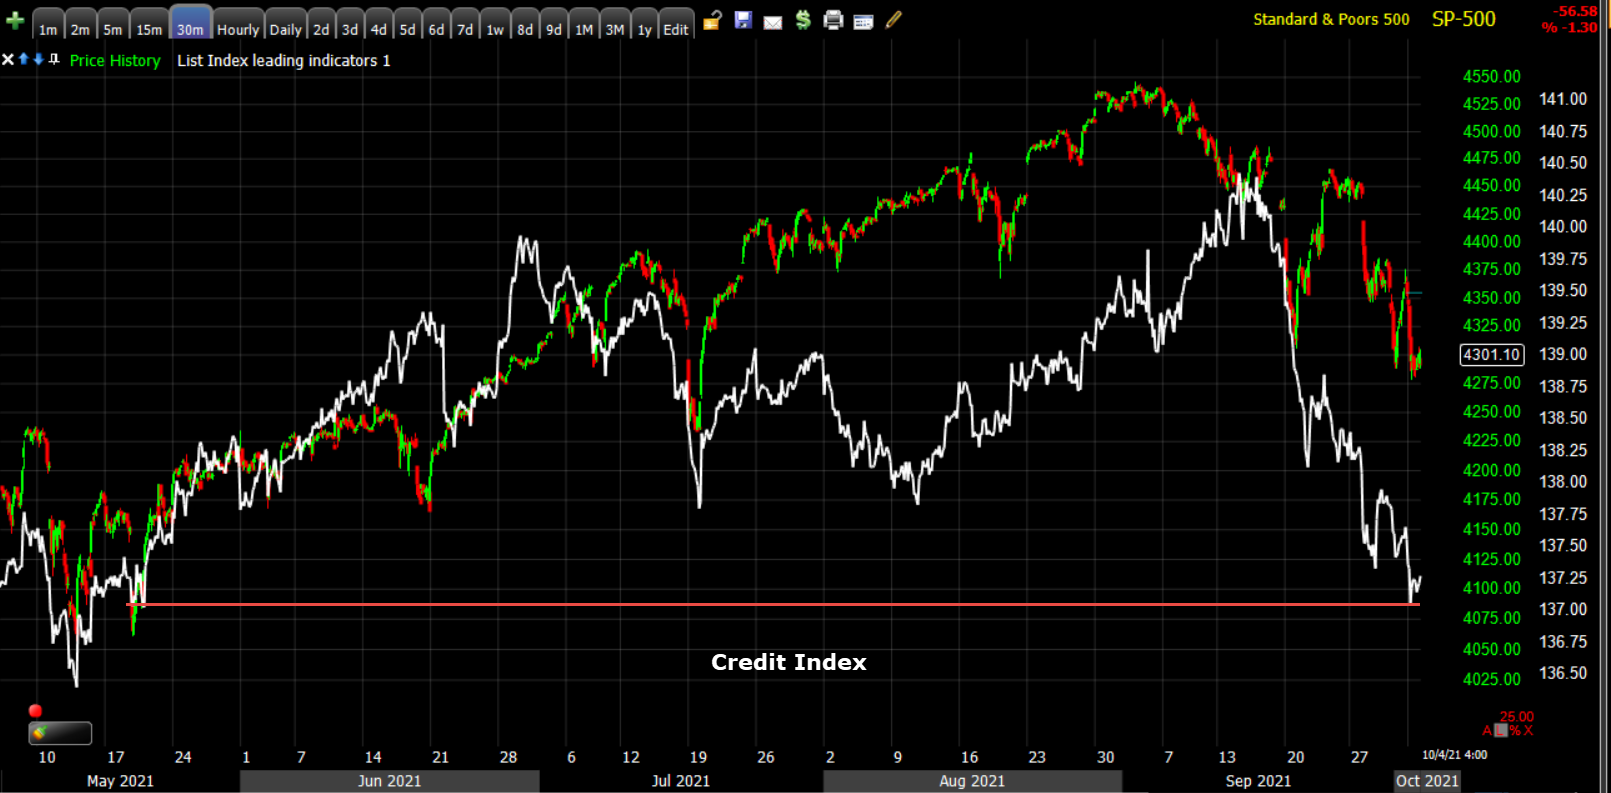 SP-500 (30m) and my custom credit index. There’s a very clear change in character with credit initially leading the S&P higher before the FOMC, then catching down quickly just ahead of the FOMC, and falling more since the FOMC. There’s no doubt that the spike in treasury yields has pressured credit, but rising Energy prices and Energy stocks often are a benefit to credit as much HY credit is issued in the Energy sector. It may not be an equal offset, but it is worth knowing. Given that, I think there’s also a clear element of risk-off sentiment among institutional traders that utilize credit, especially the extremely liquid HYG (high yield credit). My custom credit index is at the lowest since May when the S&P was more than 5% lower than today.
Currencies and Commodities
The U.S. Dollar Index decreased 0.3% to 93.78.
WTI Crude oil closed up +2.4% to $77.69/bbl after OPEC+ agreed to maintain its plan for gradual supply increases, which was on the bullish side of outcomes.
Natural Gas futures traded up more than 5% today with European nat gas trading even richer vs. U.S. nat-gas. Higher Energy prices are inflationary and ultimately not a bullish development for equities as inflation is what’s boxing in the Fed and forcing a taper sooner than most market participants expected.
Gold futures gained +0.5% to $1,767.60/oz on a weaker dollar and perhaps as tensions in China serve to fuel demand for gold as a safe haven asset.
Cryptos were volatile but ended higher. They may be emerging as an inflation hedge. Bitcoin was volatile but traded above $49,500 later in the day.
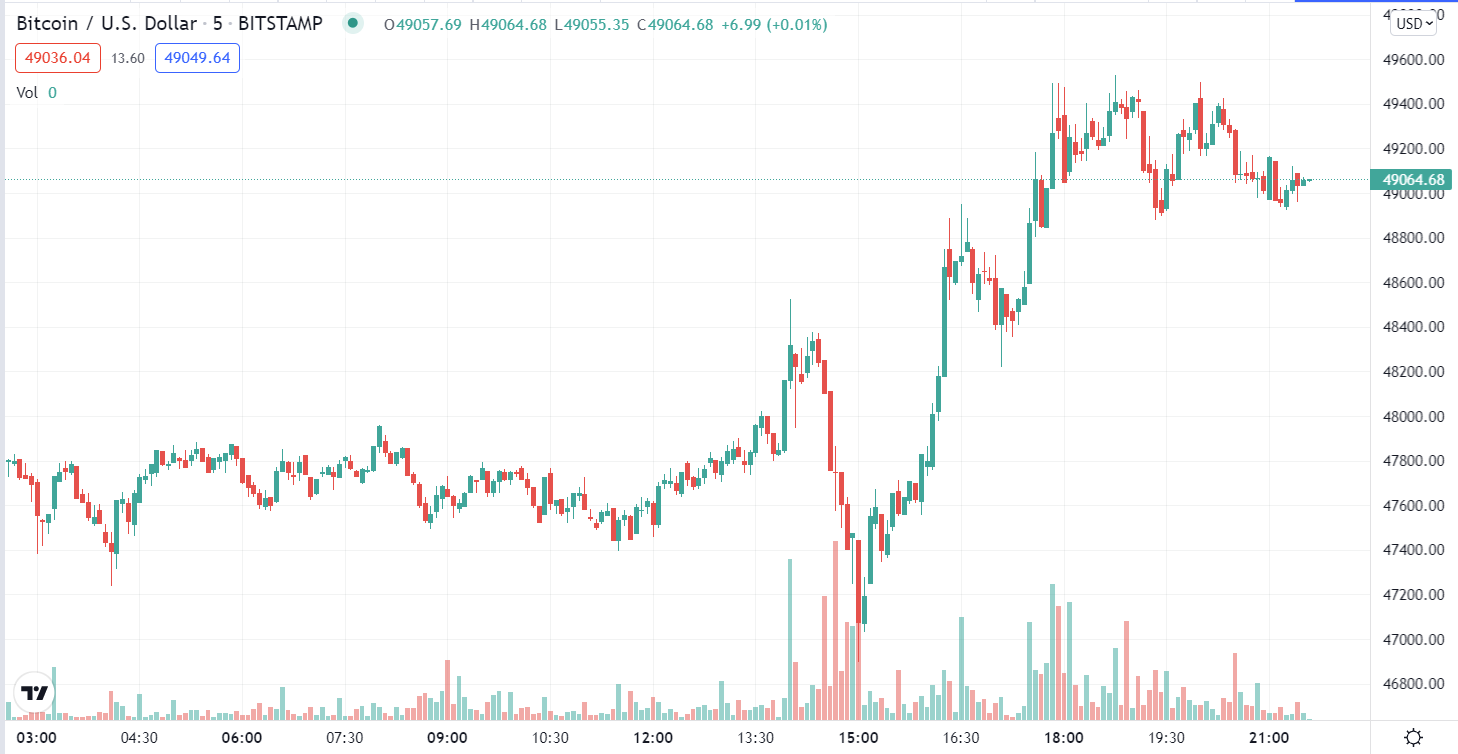 BTC/USD (5m intraday)
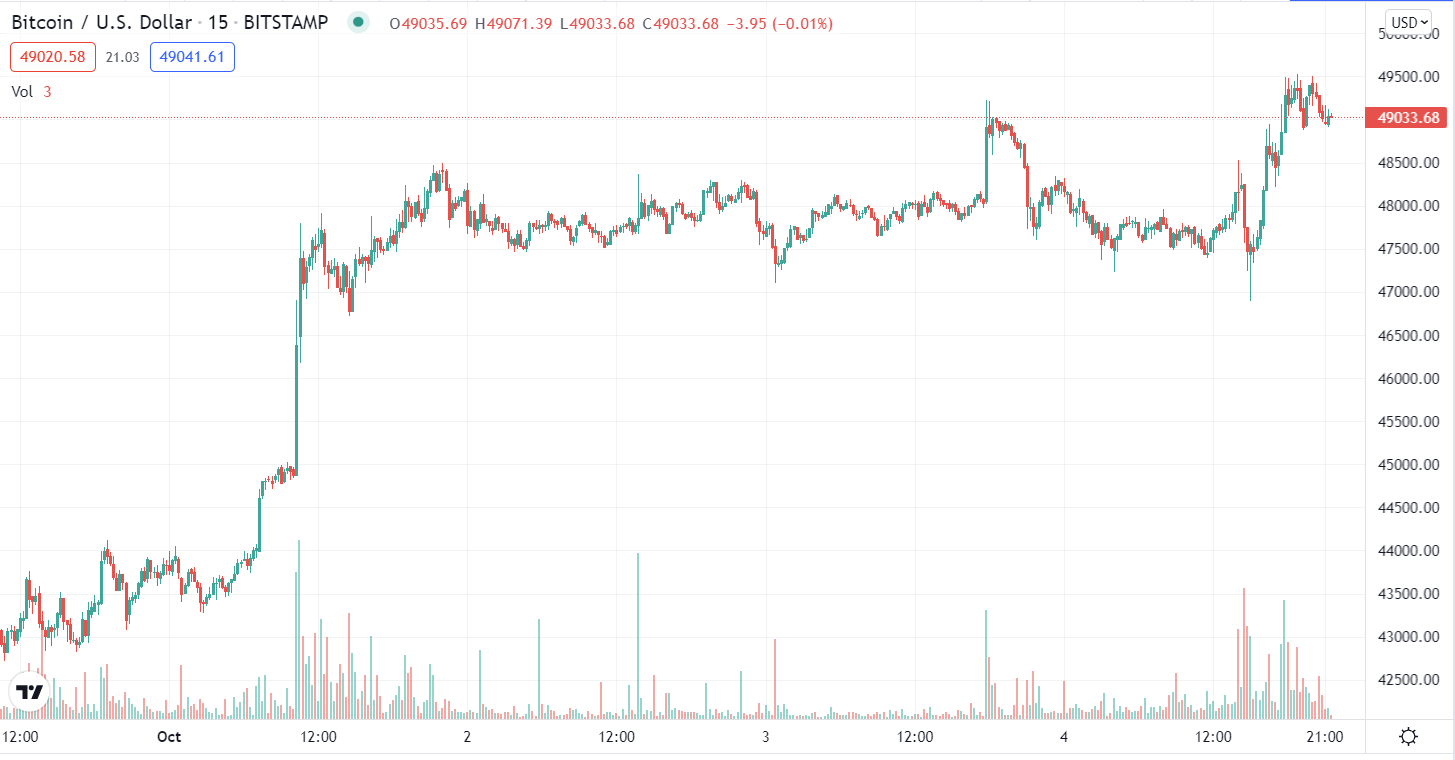 BTC/USD (15m)
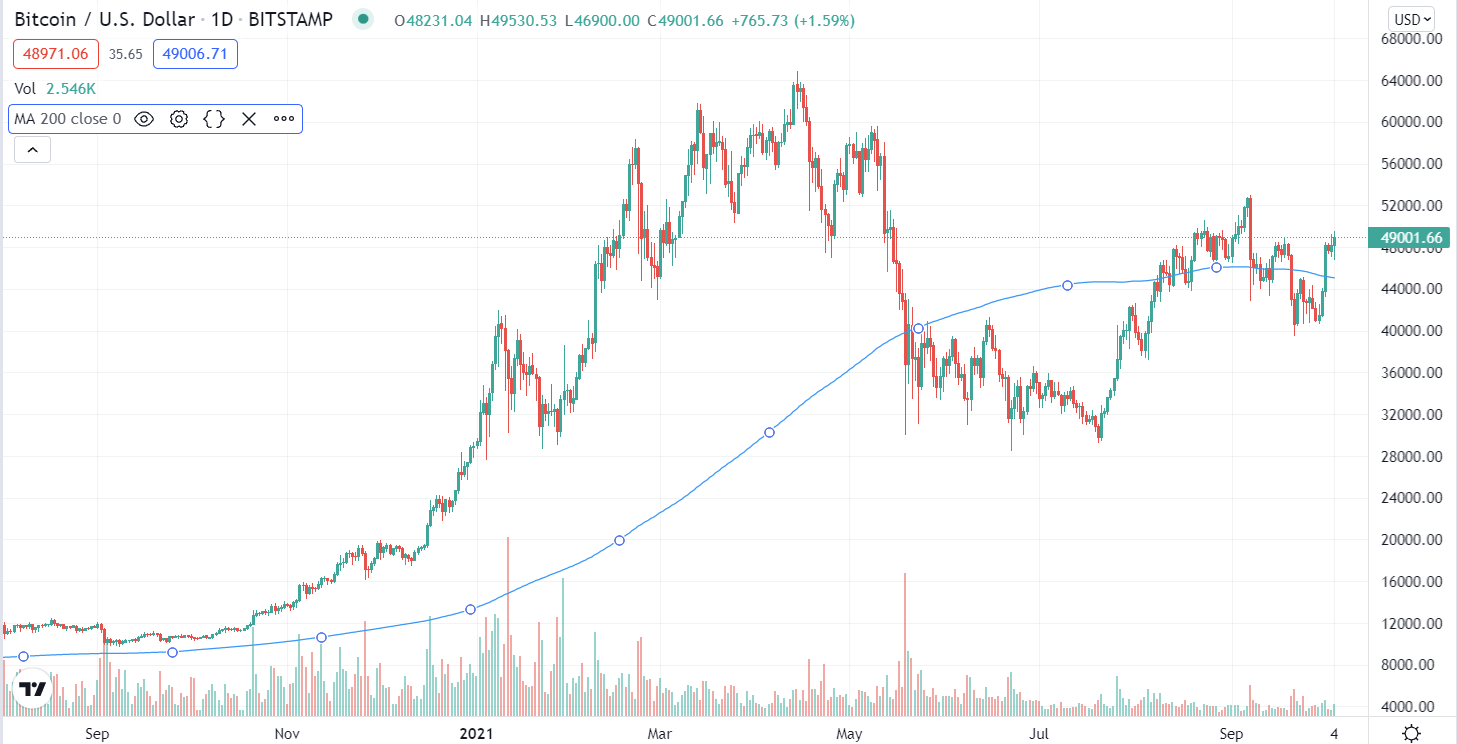 BTC/USD (daily) w/ 200-day sma
Summary
The market has a lot of concerns on its plate. Global stocks have dropped more than 5% from a record in early September. The anticipated reduction in Federal Reserve stimulus is one of the most potent risks, but others include spiraling energy costs stoking inflation (the reason for Fed tapering of stimulus). The Bloomberg Commodity Spot Index soared to an all-time peak. And as we saw today the possibility of slower growth in China due to Beijing’s property-sector crackdown and wider contagion. U.S lawmakers are also continuing their brinkmanship over the nation’s debt ceiling, with President Joe Biden and Treasury Secretary Yellen warning that the government is at risk of breaching the legal limit this month.
There may be some new quarter/month rebalancing of portfolios in play given we just started the 3rd quarter, but what I’m noticing is that technical levels are holding much less than usual, while price has been attracted to these larger H&S necklines and so far volume is confirming the H&S price patterns in the major averages which is crucial with a H&S top.
From a price perspective the main development today was the NASDAQ following in the Dow and S&P’s footsteps and taking a developing H&S top and tracing out and confirming the neckline of a much larger H&S top. Small Caps have had a toppy price pattern most of the year and have been at a standstill since February. Presently the two worst downside measured moves are in NASDAQ-100 and Small Caps with around -10% downside upon a break of their necklines.
Psychologically shorts are becoming more emboldened with short squeezes fading at the fastest pace I’ve seen this year, and dip buyers lacking confidence in a way I haven’t seen this year. From a purely technical price trend perspective, MACD is posting the most aggressive divergent sell signal since 2018 when the S&P plunged 20%.
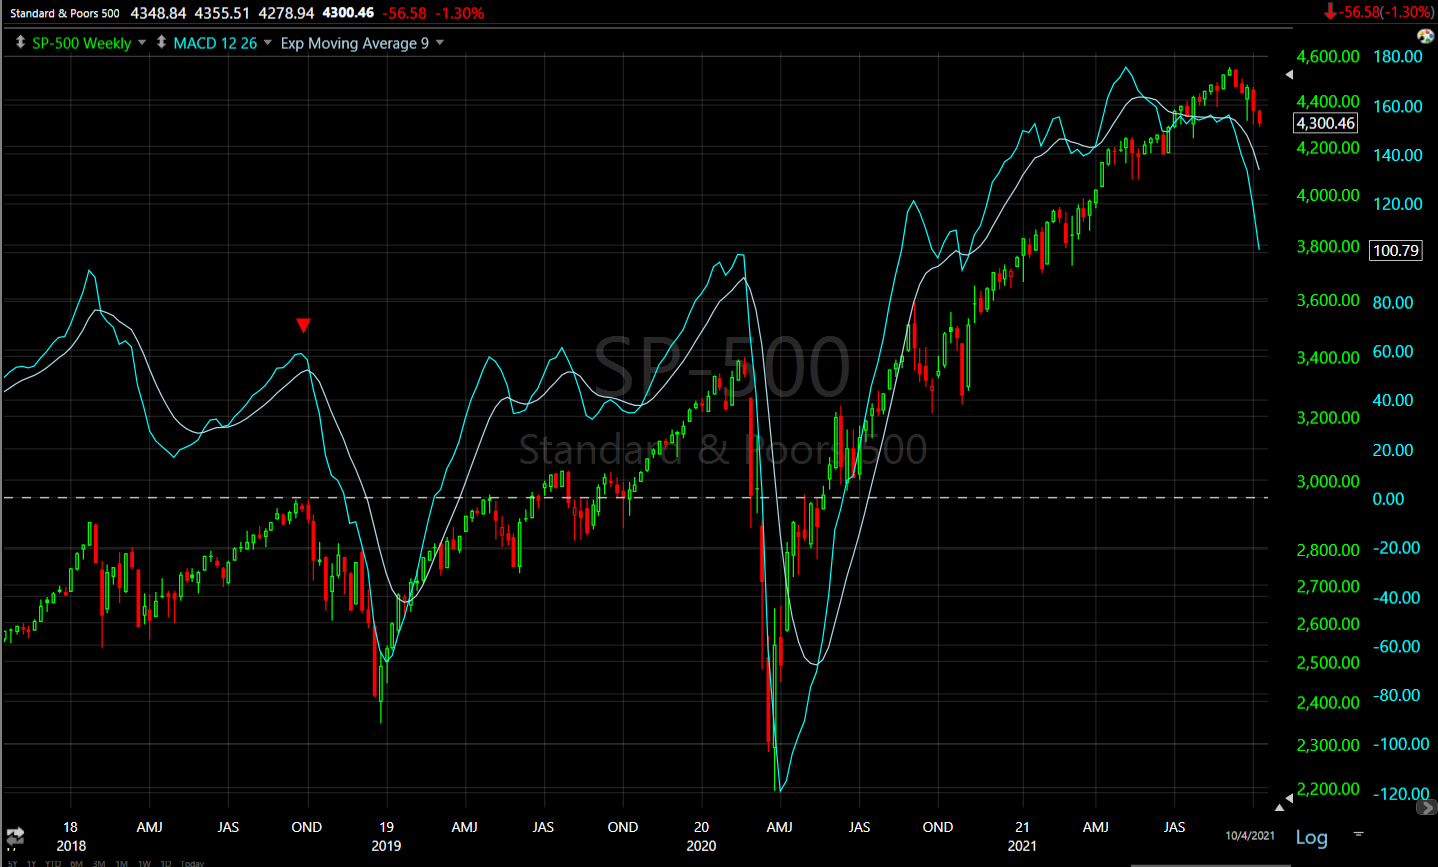 SP-500 (weekly)
While SPY’s 3C trend is posting the most aggressive negative divergence since just before the 2020 COVID crash.
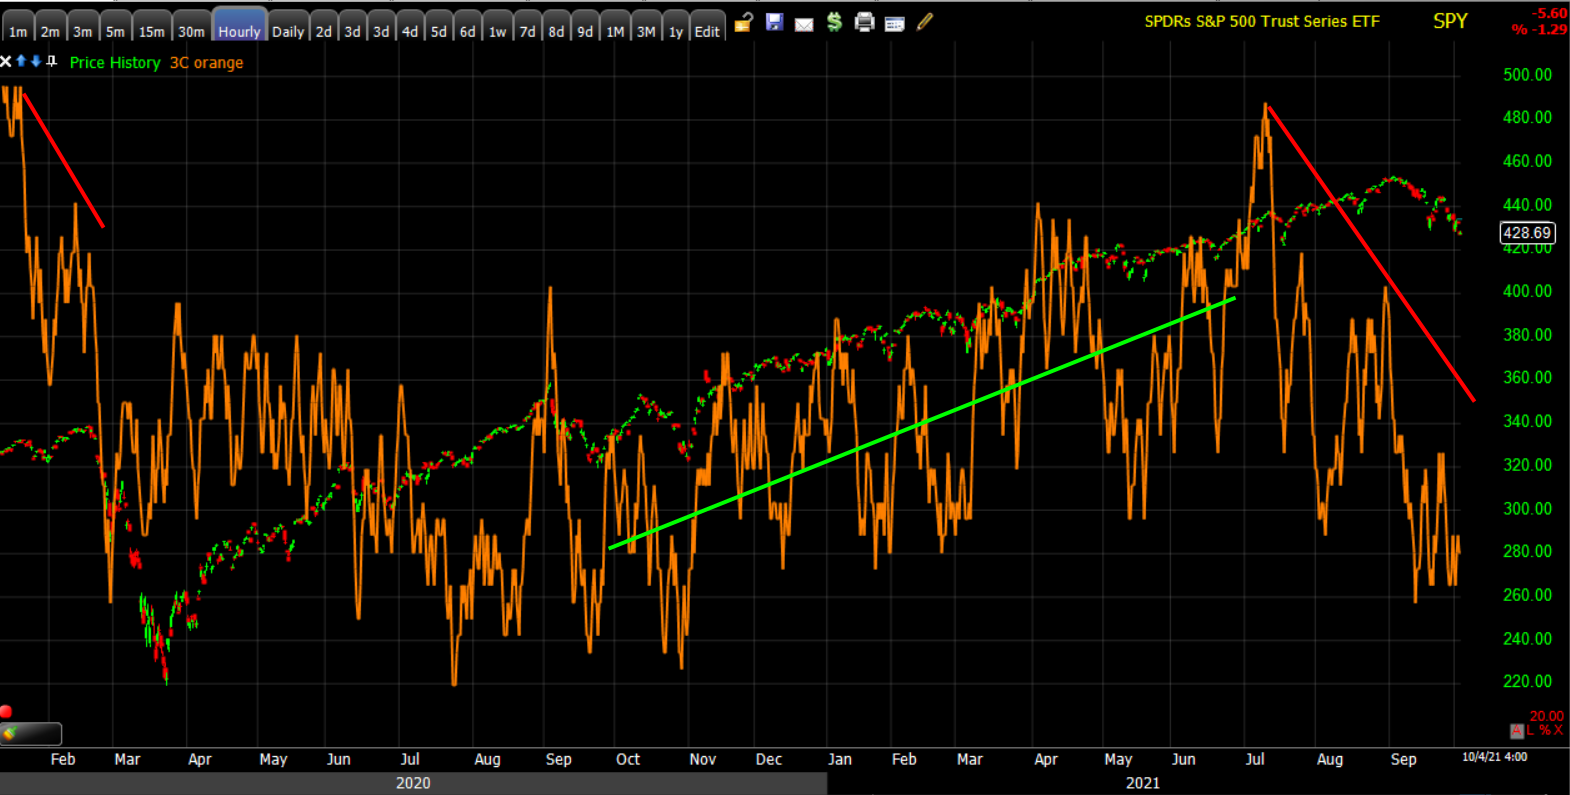 SPY (60m) 3C had been largely confirming the rally off the COVID crash lows (green) until the last couple of months, in the area of the H&S top forming.
Gaps love to be filled and given all of the major averages have now established and/or tested these larger H&S necklines, I still lean toward last week’s early gaps down being filled, which would give some symmetry to several complex H&S tops. The symmetry is not crucial, but common. Volume confirmation is crucial and thus far at the index level, is confirming. The Energy sector is one H&S price pattern that volume is not confirming. So I continue to look for that gap fill that forms a second right shoulder in a complex H&S top. I think that will offer an opportunity to sell into strength (and/or short into price strength). Yields, in my view, will be absolutely crucial. If they look to be breaking out to the upside again I expect stocks’ potential bounce/gap fill rally won’t have long.
The most significant economic data this week will be Payrolls on Friday. If Payrolls come in as expected or better, this will all but assure the Fed will be on track to start tapering stimulus which has been the number one driver of equity gains since the 2020 lows. Stocks may have a window from now until then to bounce and try to fill those gaps.
Overnight
Markets in mainland Chinese are closed through Thursday for the Golden Week holidays.
S&P futures are +0.1% and like the entire afternoon since session lows, price action is that of a weak bearish leaning consolidation around the neckline and $4300.
 S&P futures (1m) with $4300 in green. The other index futures have the same price action.
WTI crude futures are unchanged. Gold futures are +0.1% with a small bullish consolidation tonight following today’s gains.
On Tuesday, investors will receive the ISM Non-Manufacturing Index for September, the Trade Balance for August, and the final IHS Markit Services PMI for September.