Daily Wrap – Stock Market Analysis For April 19th, 2022
The market overcame a lot today – from a growth downgrade and inflation upgrade from the IMF, to a a spike in Treasury yields, and hawkish Fed-speak. At a virtual event by the Council on Foreign Relations (CFR) last night, St. Louis Fed President Bullard said of a Fed tightening cycle,
“First of all, that one was successful, and did set up the U.S. economy for a stellar second half of the 1990s, one of the best periods in U.S. macroeconomic history,”
“And in that cycle, there was a 75 basis point increase at one point. So, I wouldn’t rule it out.”
The market (STIRs) are pricing in 9 more hikes this year, suggesting potentially a 50 bps in May, June, and July then 25bps in Sept, Nov, and Dec. Notably the largest basis point rise in yields today as at the short end (Fed sensitive 2-year yield).
Index futures initially gave up overnight gains with the S&P futures falling below $4400 as bond yields jumped before the open, but saw a massive bid shortly after the cash open.
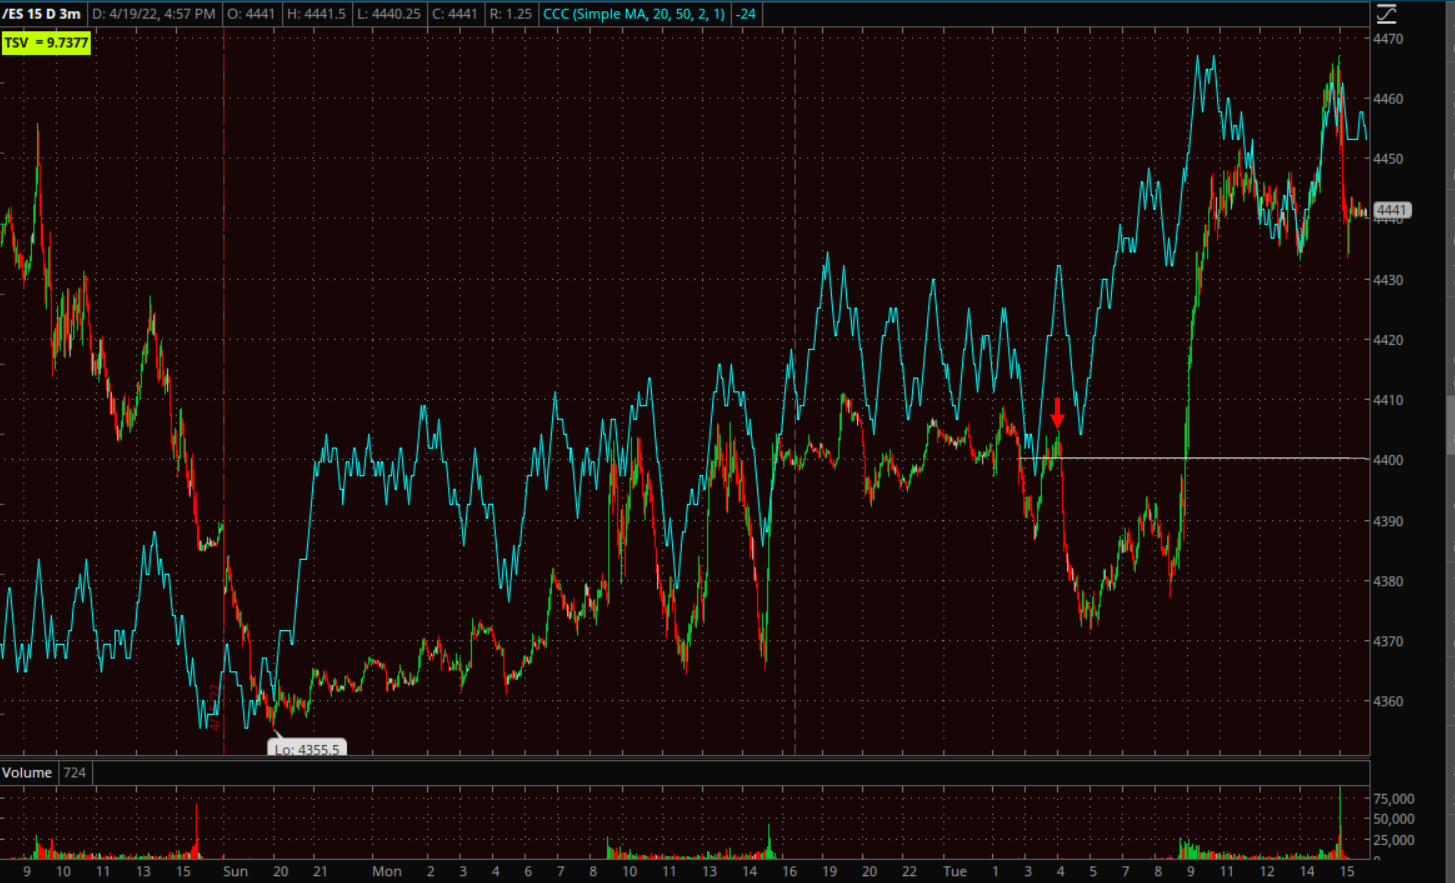 S&P futures (3m) dropping below $4400 in pre-market (red arrow) and soaring at the cash open.
Beyond a few improving signals noted yesterday such as NASDAQ-100 relative strength, semiconductors’ relative strength, SPY 3C positive divergence around S&P $4400, Bitcoin’s improving risk sentiment signal yesterday afternoon, etc… there was no catalyst for the cash market advance.
As suspected from 3C signals this afternoon, the averages moved into a bullish intraday consolidation, then most broke out heading into the close.
 SP-500 (2m) – that’s not only constructive intraday price action, but a few averages traded high enough to change the 3-week price trend from corrective/consolidative, to transitional with a bullish bias.
Averages
NASDAQ-100 surprisingly outperformed given the spike in yields, yet Small Caps outperformed also which sends a positive market signal. Also outperforming were Dow Transports (+2.75%) which tend to lead Dow Industrials and are telling us two different stories on two different timelines (short term and longer term).
S&P-500 ⇧ 1.61 %
NASDAQ ⇧ 2.15 %
DOW JONES ⇧ 1.45 %
RUSSELL 2000 ⇧ 2.04 %
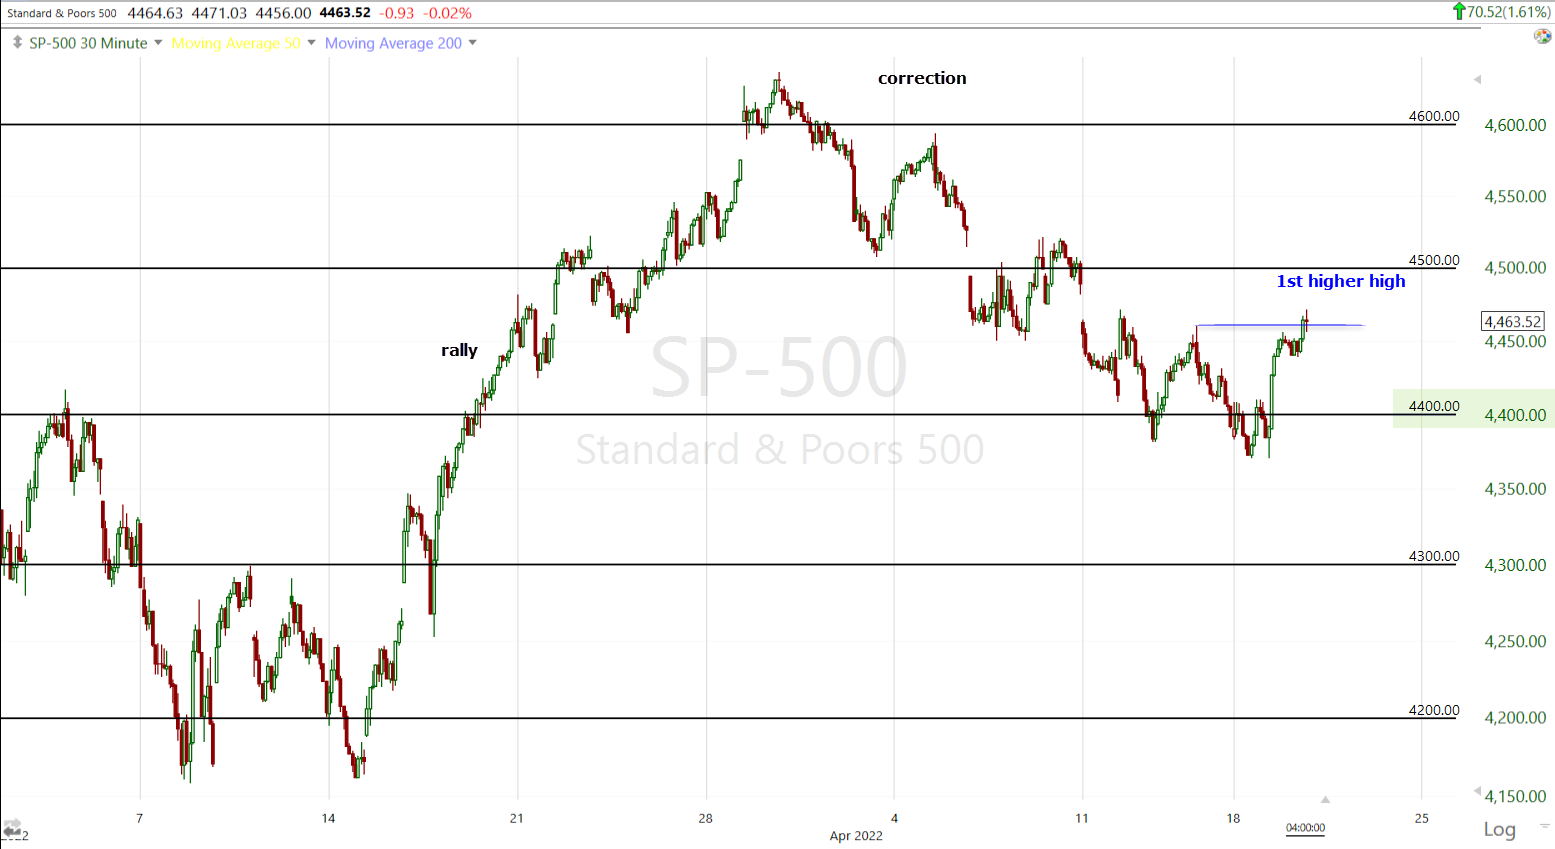
Both S&P and Dow disrupted the 3-week corrective/consolidative trend of lower highs/lower lows by trading above last Thursday morning’s high.
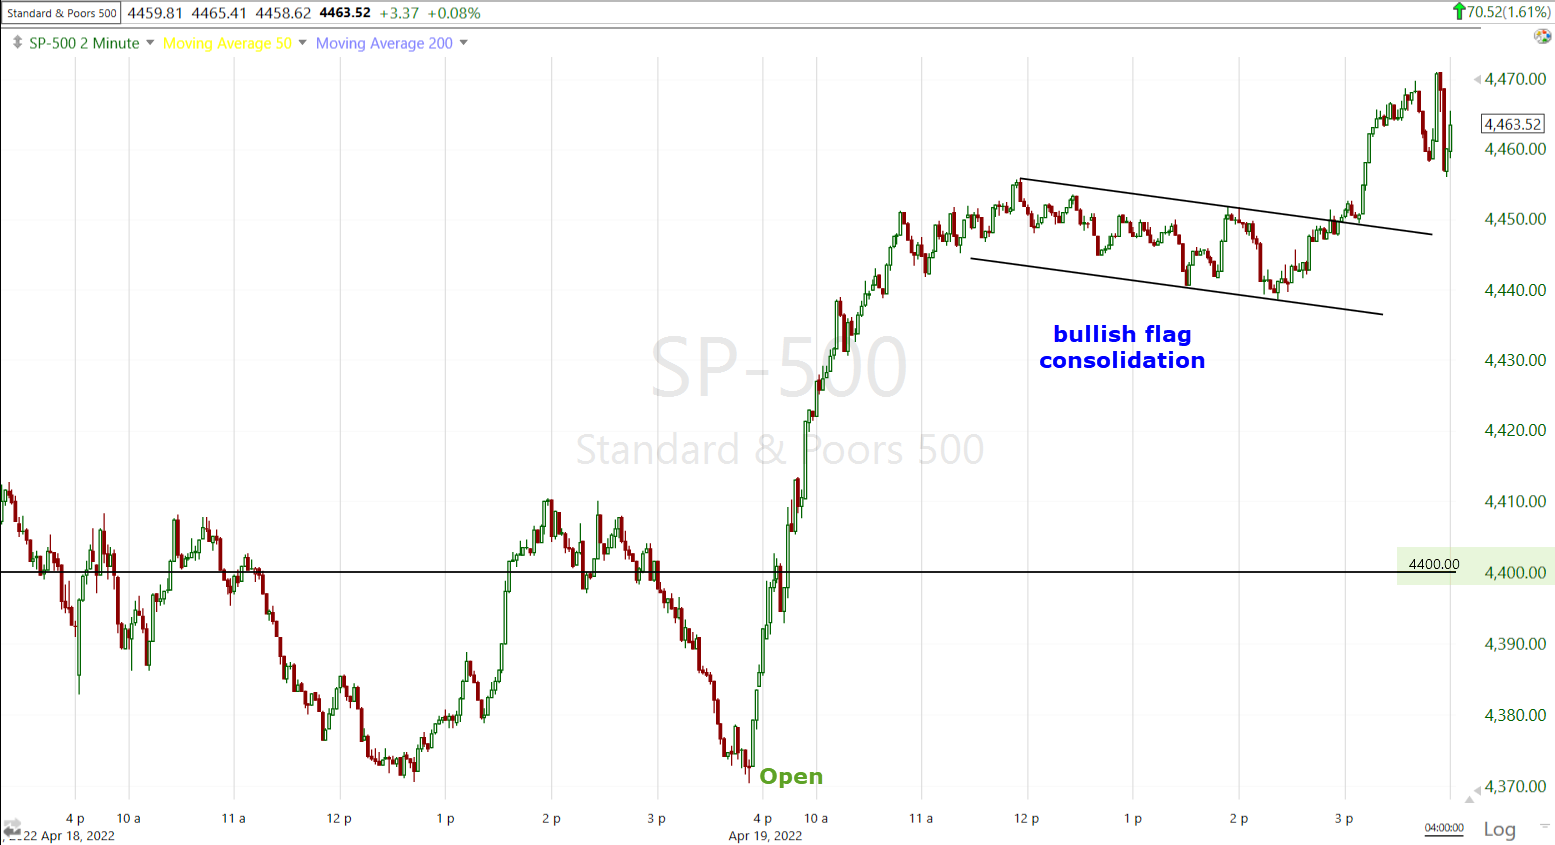
 SP-500 (30m) finding buying support as 3C suggested near $4400 and changing the price trend to transitional. If we look at the corrective consolidation as a bullish flag-like consolidation, then the second leg measured move is at least the initial $4750 I had been forecasting, but could be as high as $4800-$4825. The difference between $4750 and $4800/$4825 is immense in forecasting/measured move terms because if the S&P makes a new high it would nullify what is currently a large H&S top pattern that suggests longer term the S&P trades down toward $3500. I’m not going to spend too much time on that because we’re still a ways off even having to consider that with just 2 averages turning their corrective price trend to transitional.
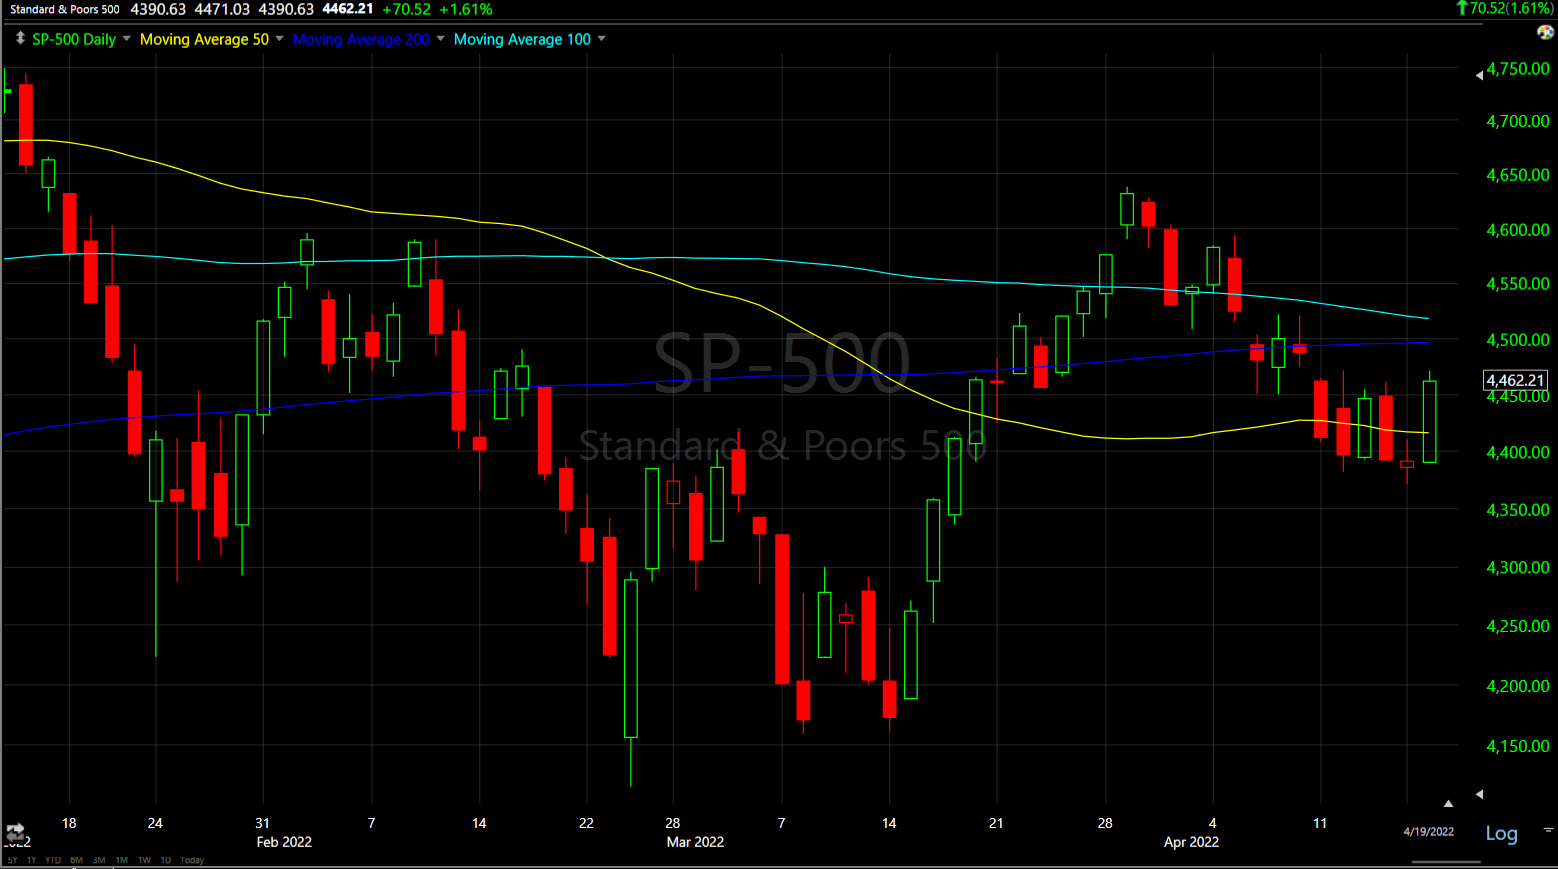 SP-500 (daily) – the S&P also managed to close above its yellow 50-day sma with the 100 and 200-day (light and dark blue respectively) looming above.
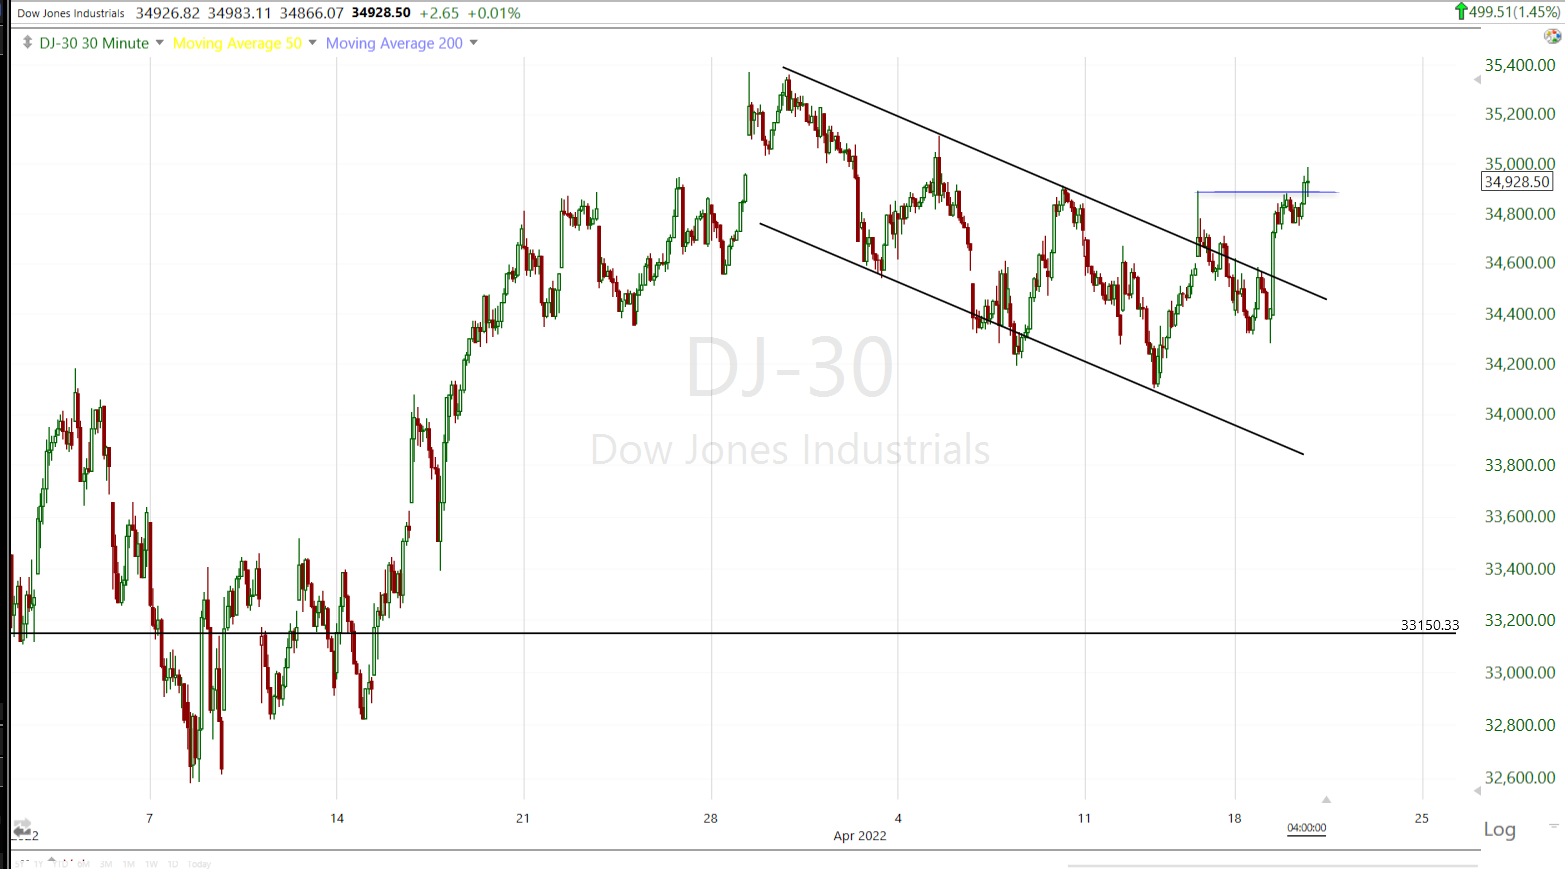 Dow (30m) also made its first higher high with what is looking like the most probable bull flag and now breakout from the bull flag.
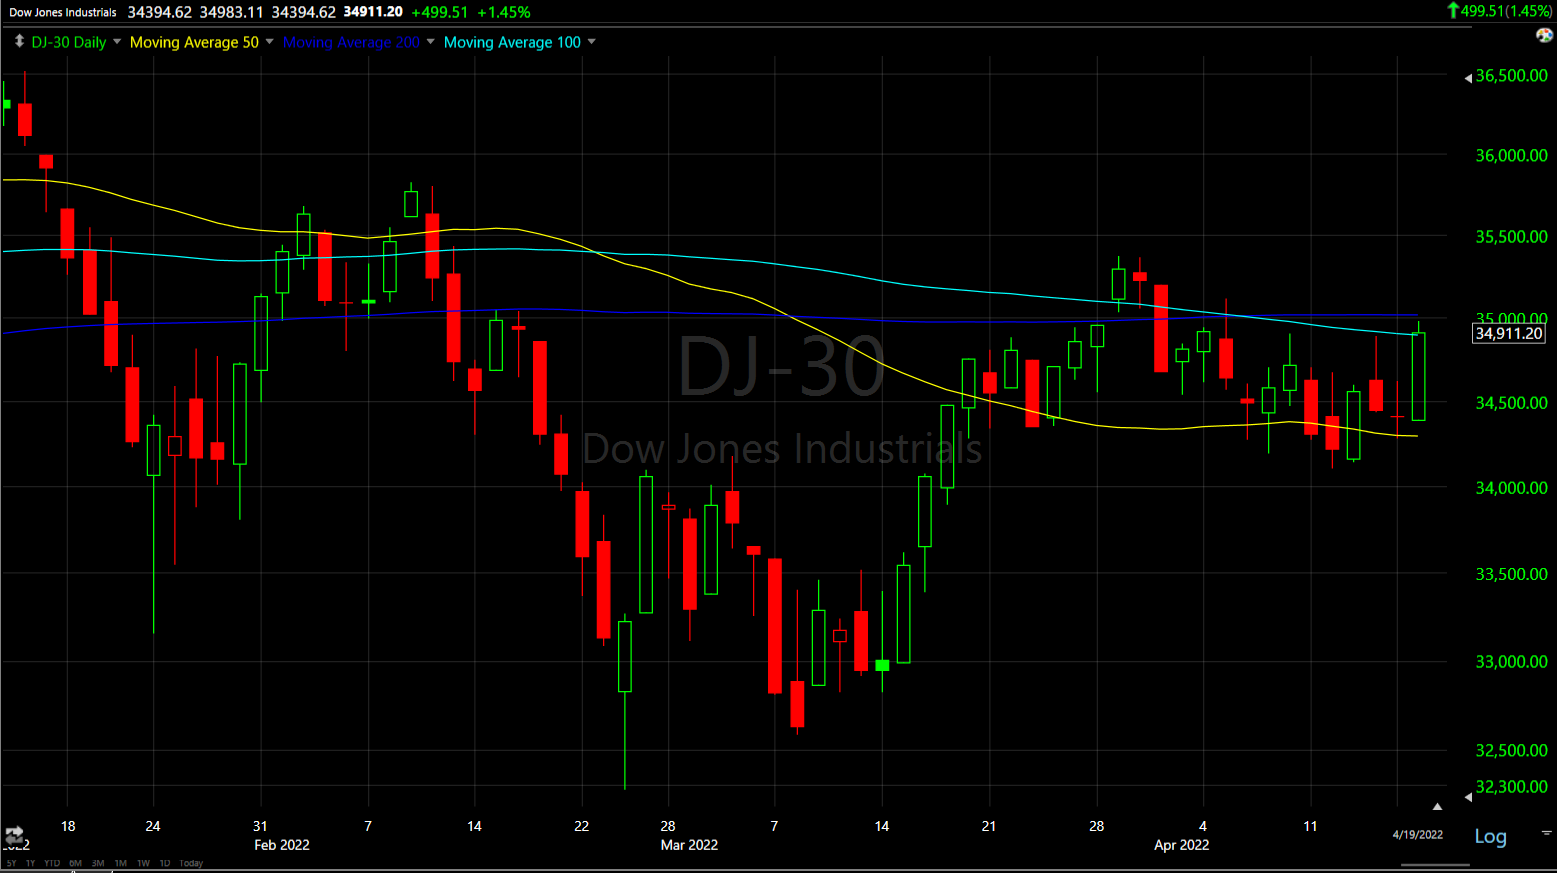 Dow (daily) did run into its 100-day sma (light blue) where it met some resistance toward the close.
![]() Dow Transports (30m) may be invalidating the bear flag consolidation, although today’s price action alone is not enough for me to say that with an exclamation mark.
Dow Transports (30m) may be invalidating the bear flag consolidation, although today’s price action alone is not enough for me to say that with an exclamation mark.
![]() Dow Transports (daily) do have a 50 and 200-day sma around $15,400 coming up, but look at the strength of today’s wide-bodied candle with an open at session lows and close near session highs.
Dow Transports (daily) do have a 50 and 200-day sma around $15,400 coming up, but look at the strength of today’s wide-bodied candle with an open at session lows and close near session highs.
As for the two different signals Transports’ relative performance have been sending, given Transports should confirm industrials and often lead them…
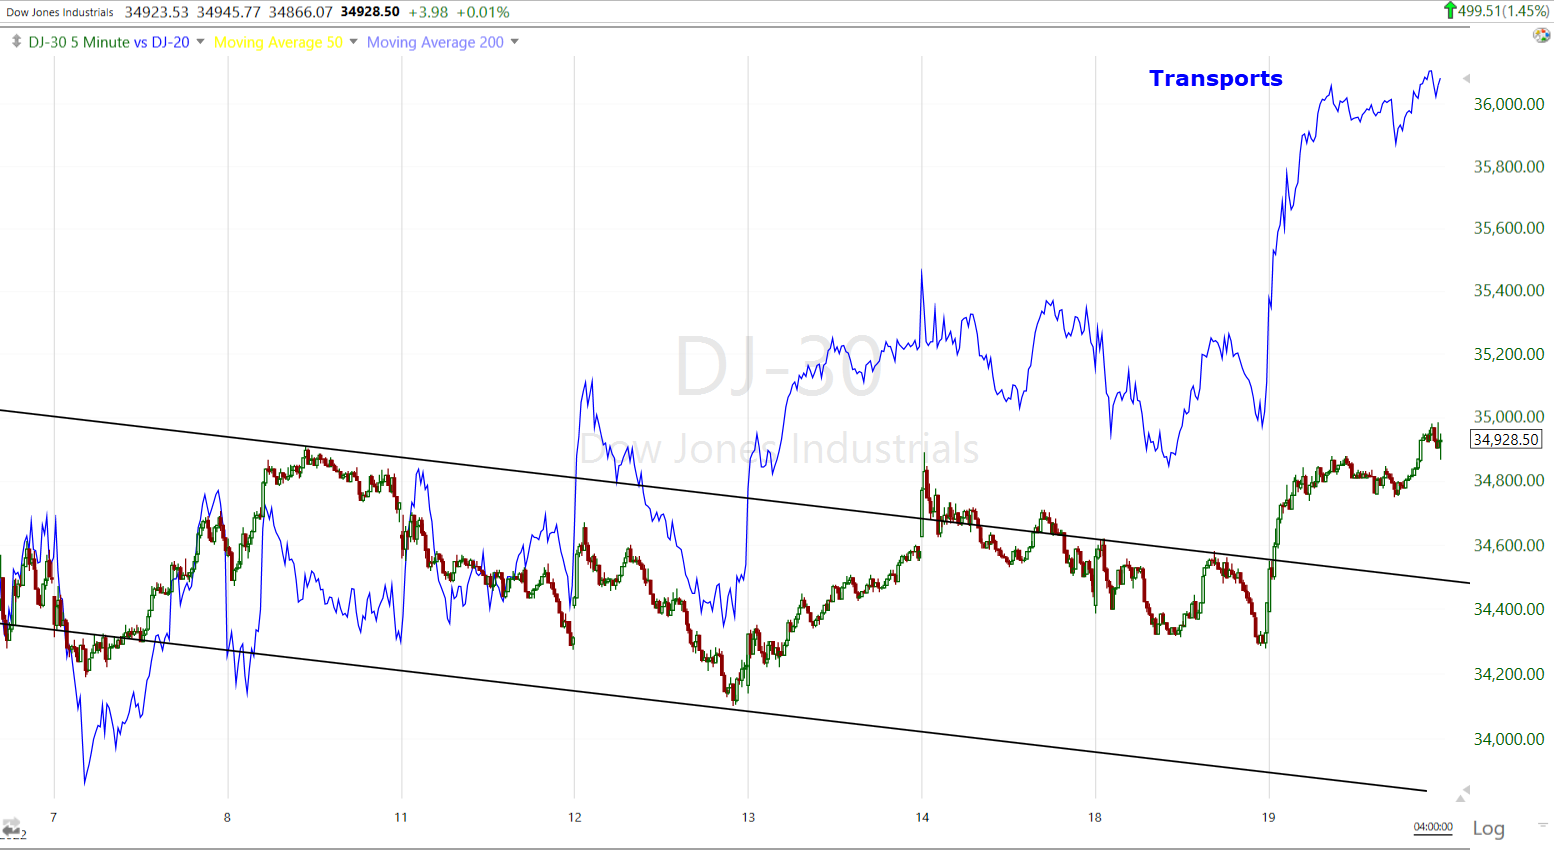 In the short term (5m) Transports have shown better relative performance vs. Industrials a little over a week as this normalized chart shows.
However, from a longer term perspective…
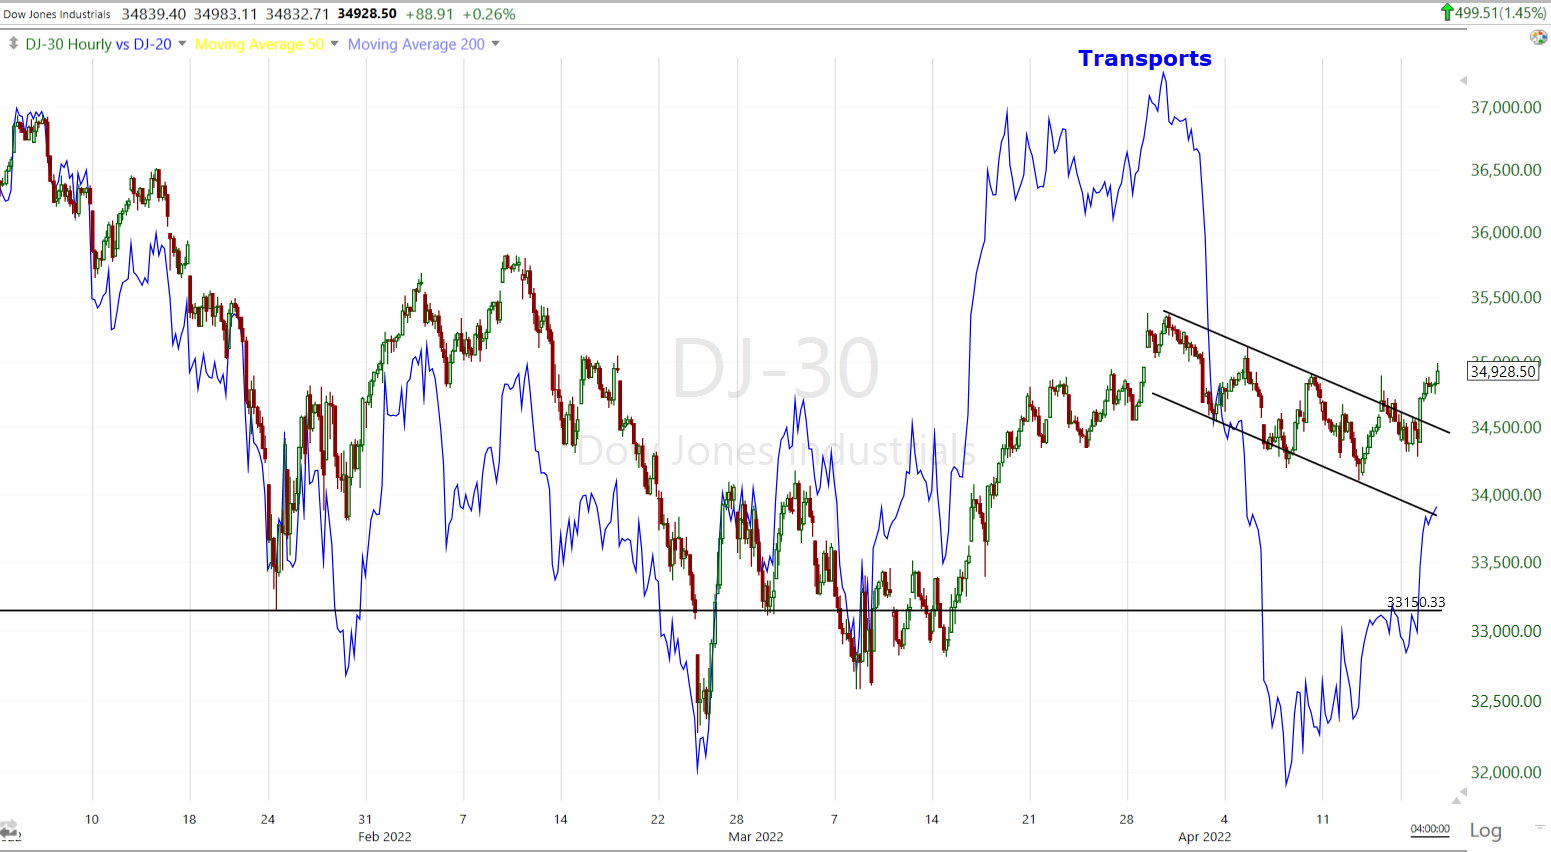
Transports initially led Industrials into the mid-March rally (with better relative strength), but now lag behind on a year-to-date normalized basis.
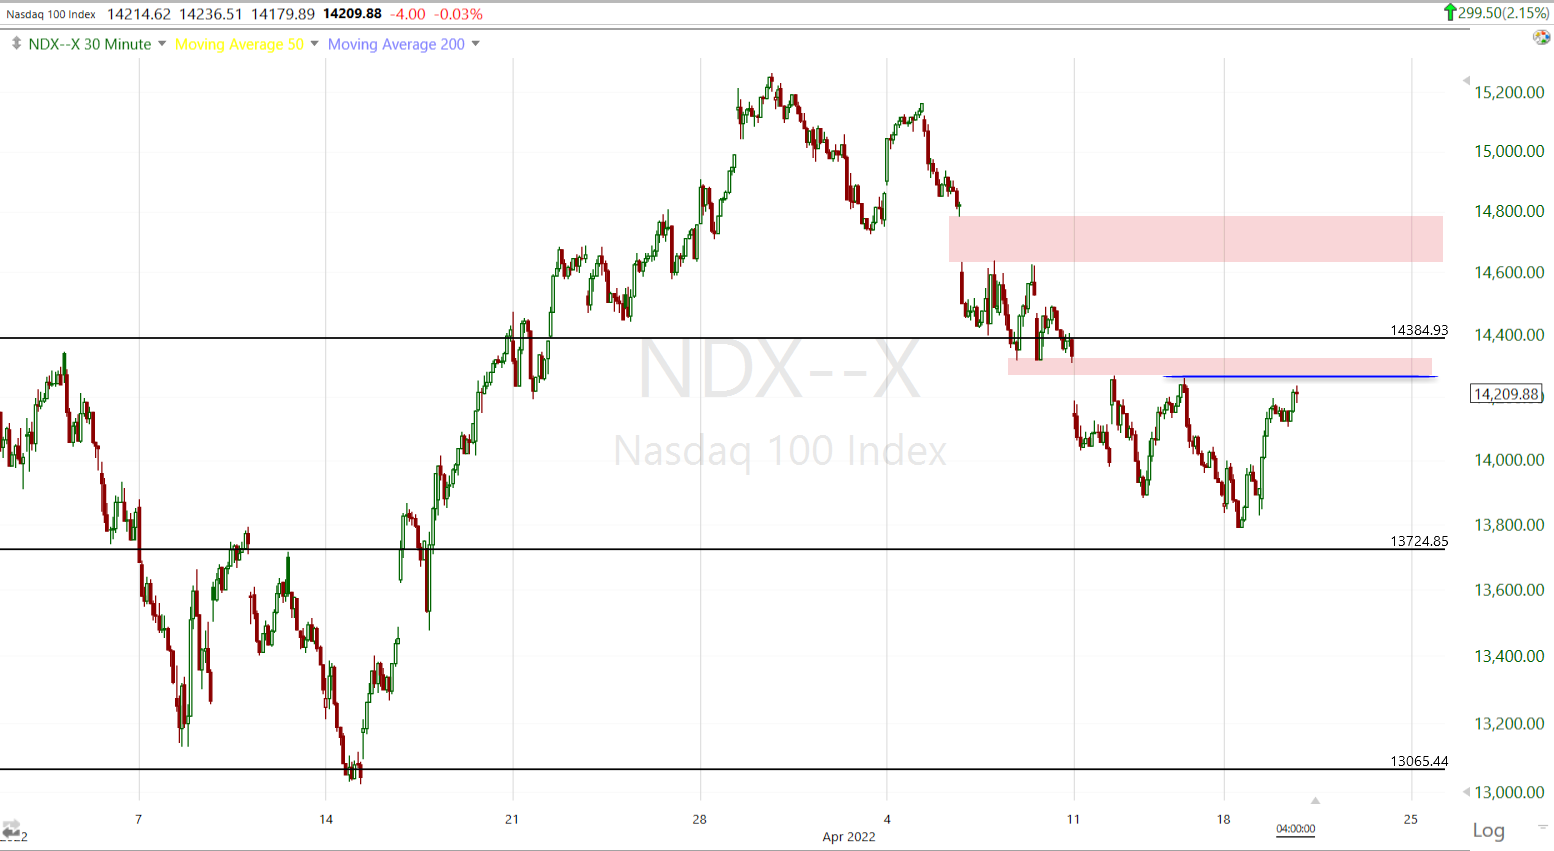 NASDAQ-100 (30m) had a strong day, especially considering the jump in Treasury yields across the curve, but failed to make the higher high (blue), where there’s also a gap. Gaps do tend to pull price into them like magnet, but also can act as resistance as is already obvious from the last two attempts last week.
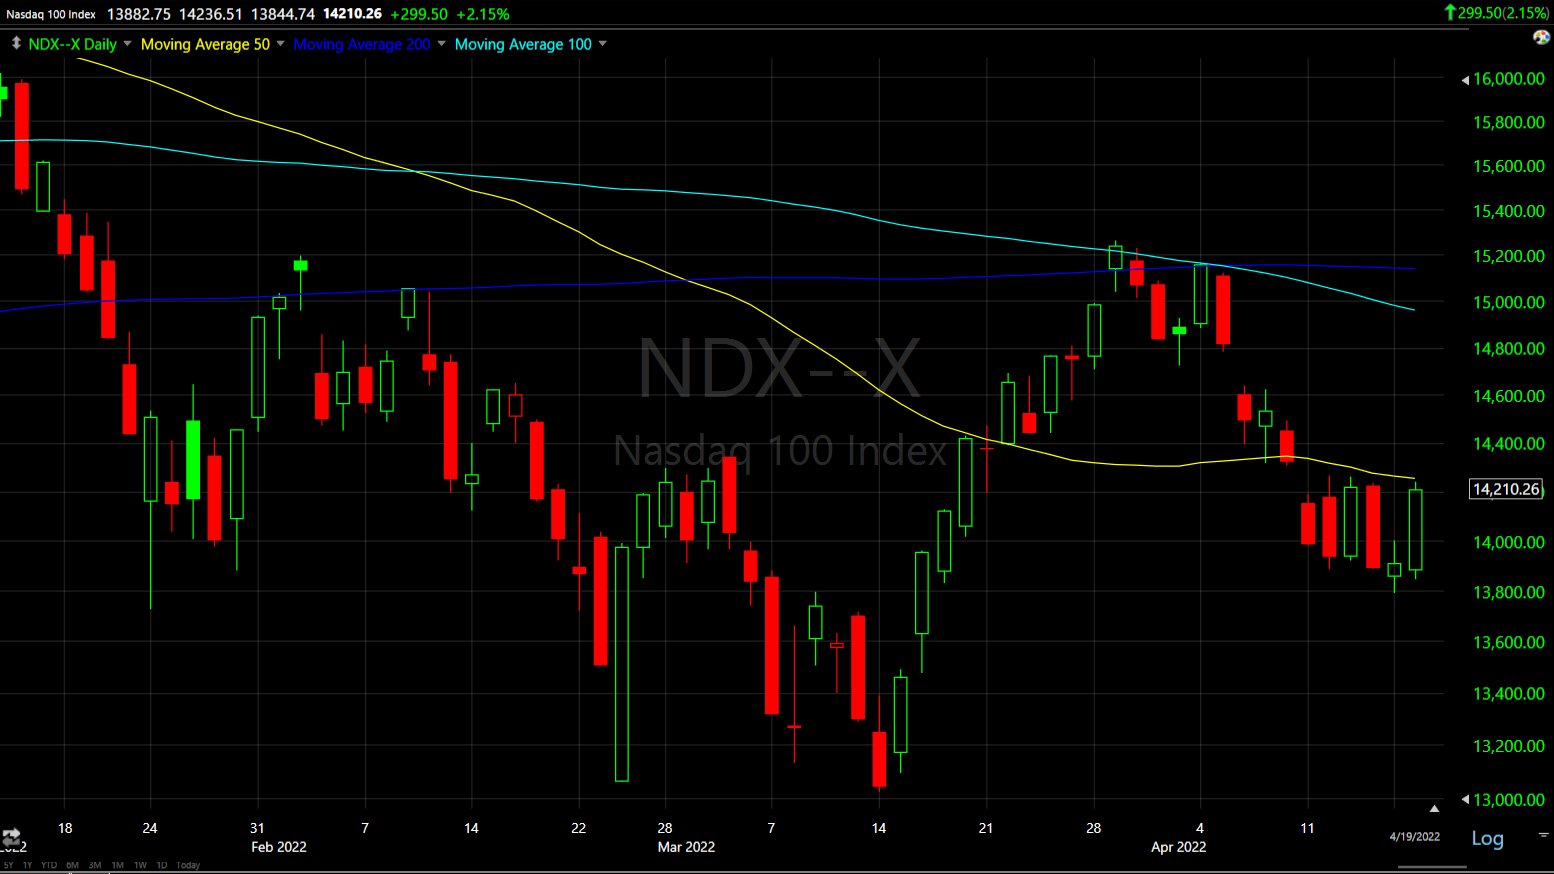 NASDAQ-100 (daily) also met some technical resistance at its yellow 50-day sma.
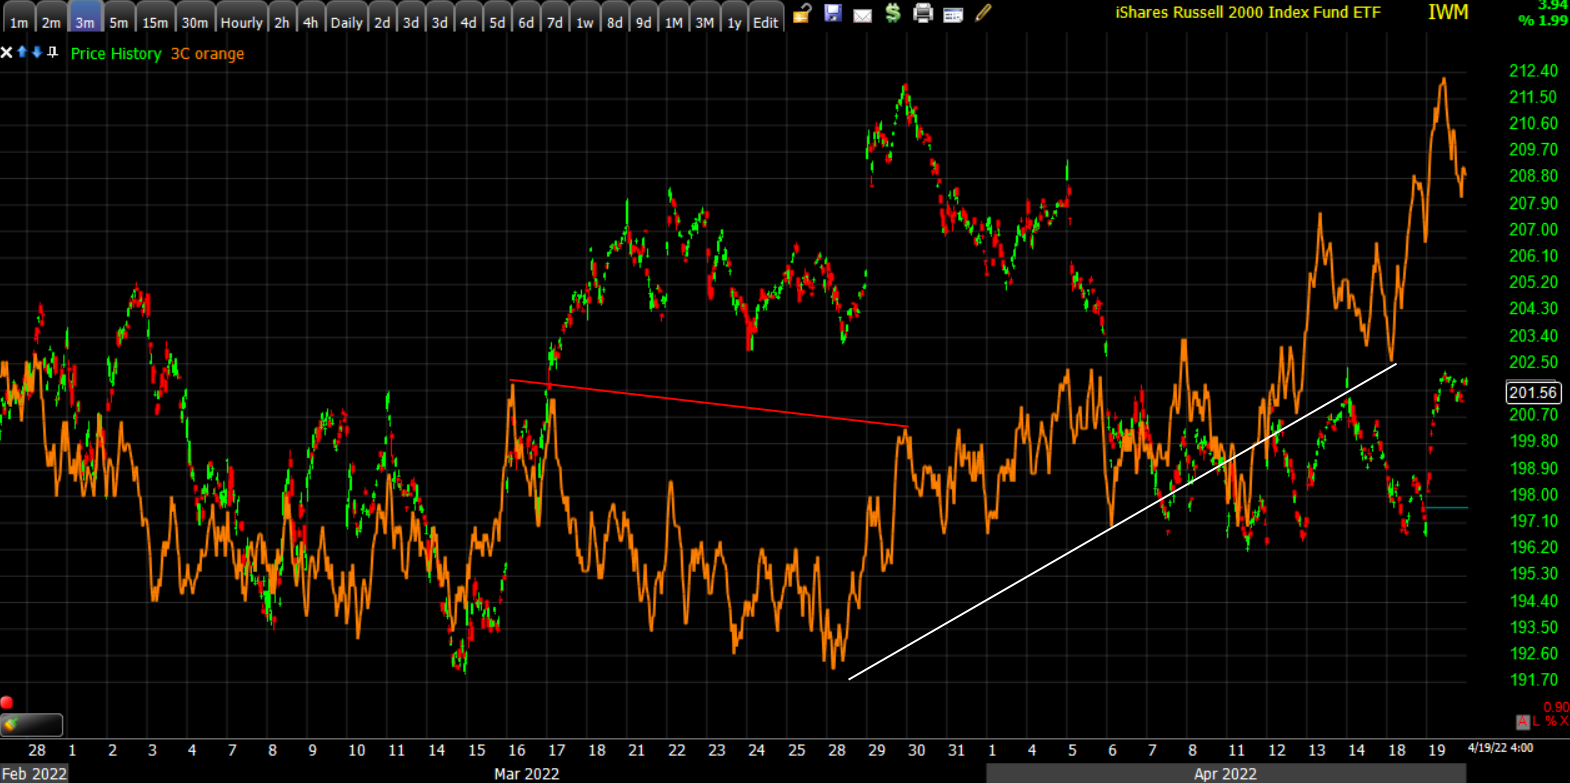
 Small Cap IWM (60m) came close to Thursday’s high, but not quite.
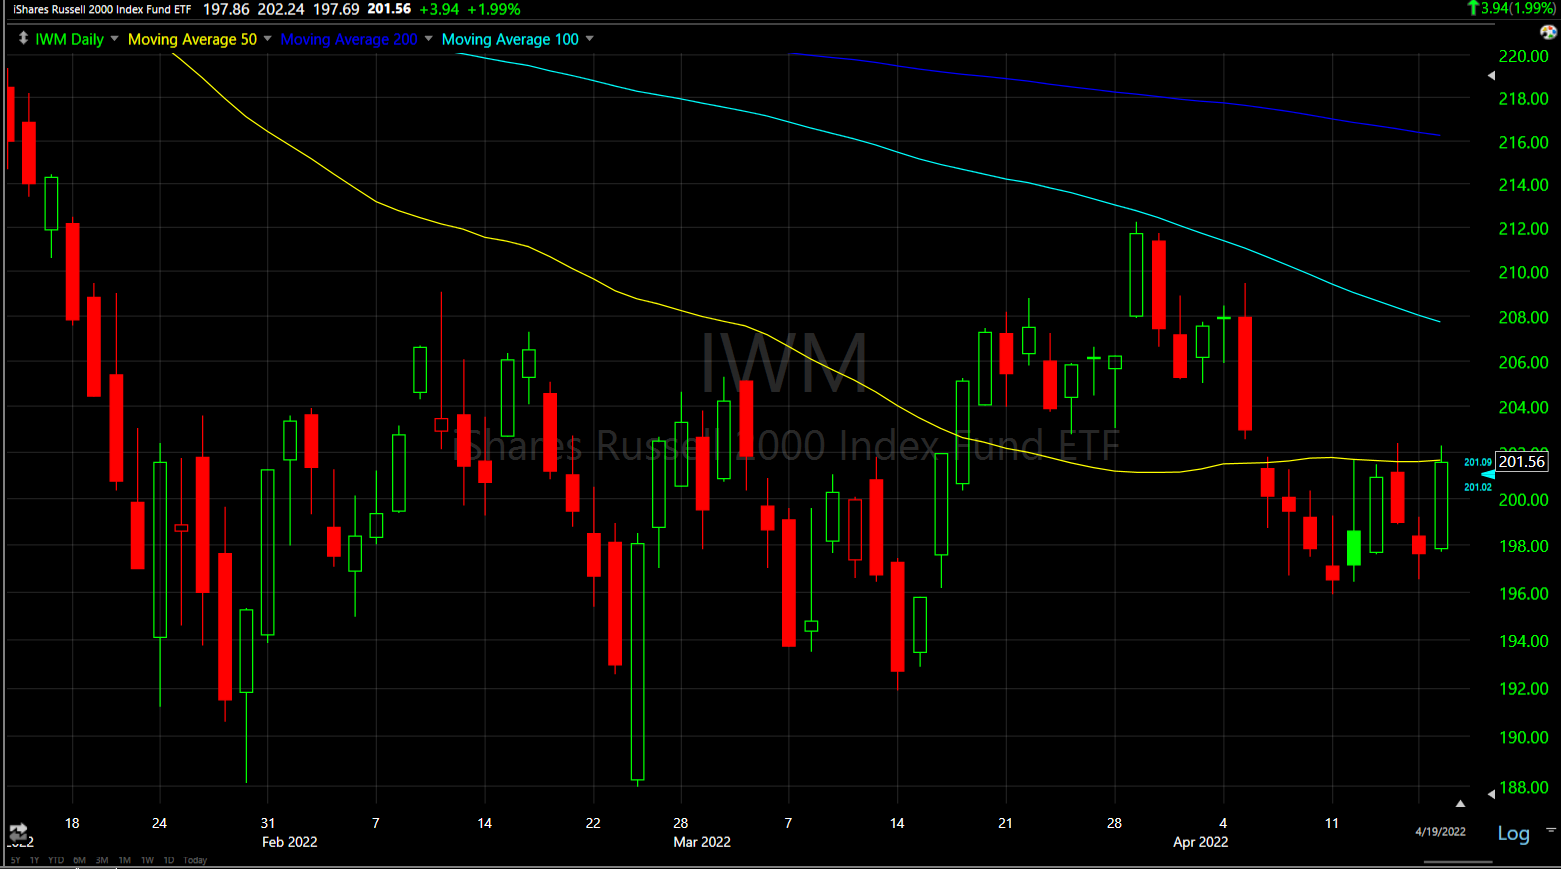 IWM (daily) – like NASDAQ also met technical resistance at its 50-day this afternoon.
A percent or more of gains in Small Caps could unleash the start of a renewed round of short covering, which I haven’t seen yet in the Most Shorted Index of stocks.
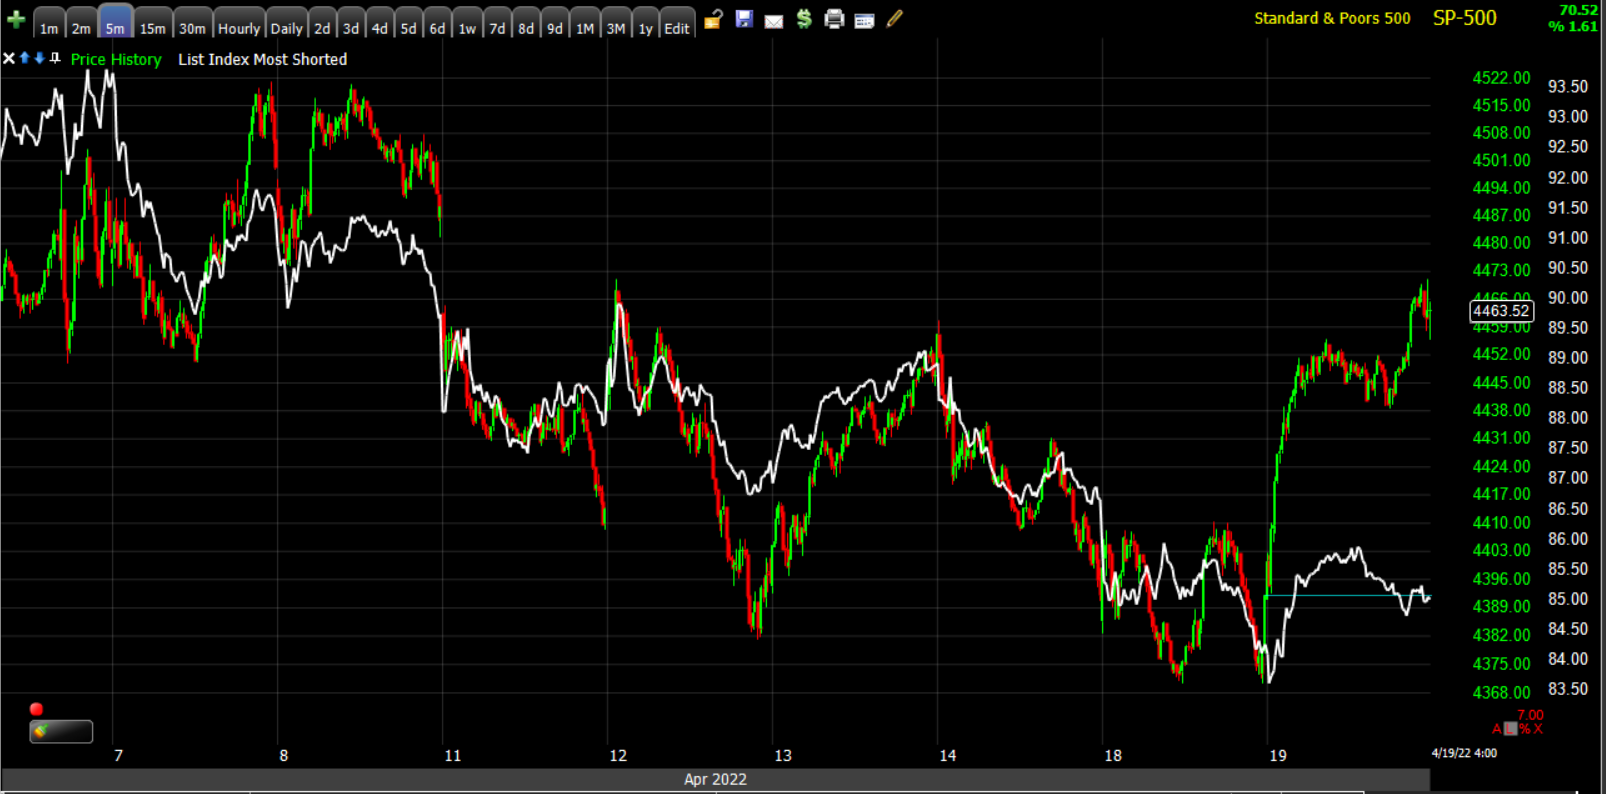 SP-500 (5m) and the Most Shorted Index (white). Should Small Caps trade above the 50-day and make a higher high, shorts are likely to start covering and pushing Small Caps higher, forcing more short covering so the 50-day for IWM is actually quite a significant technical level.
Short term 3C charts didn’t change that much today.
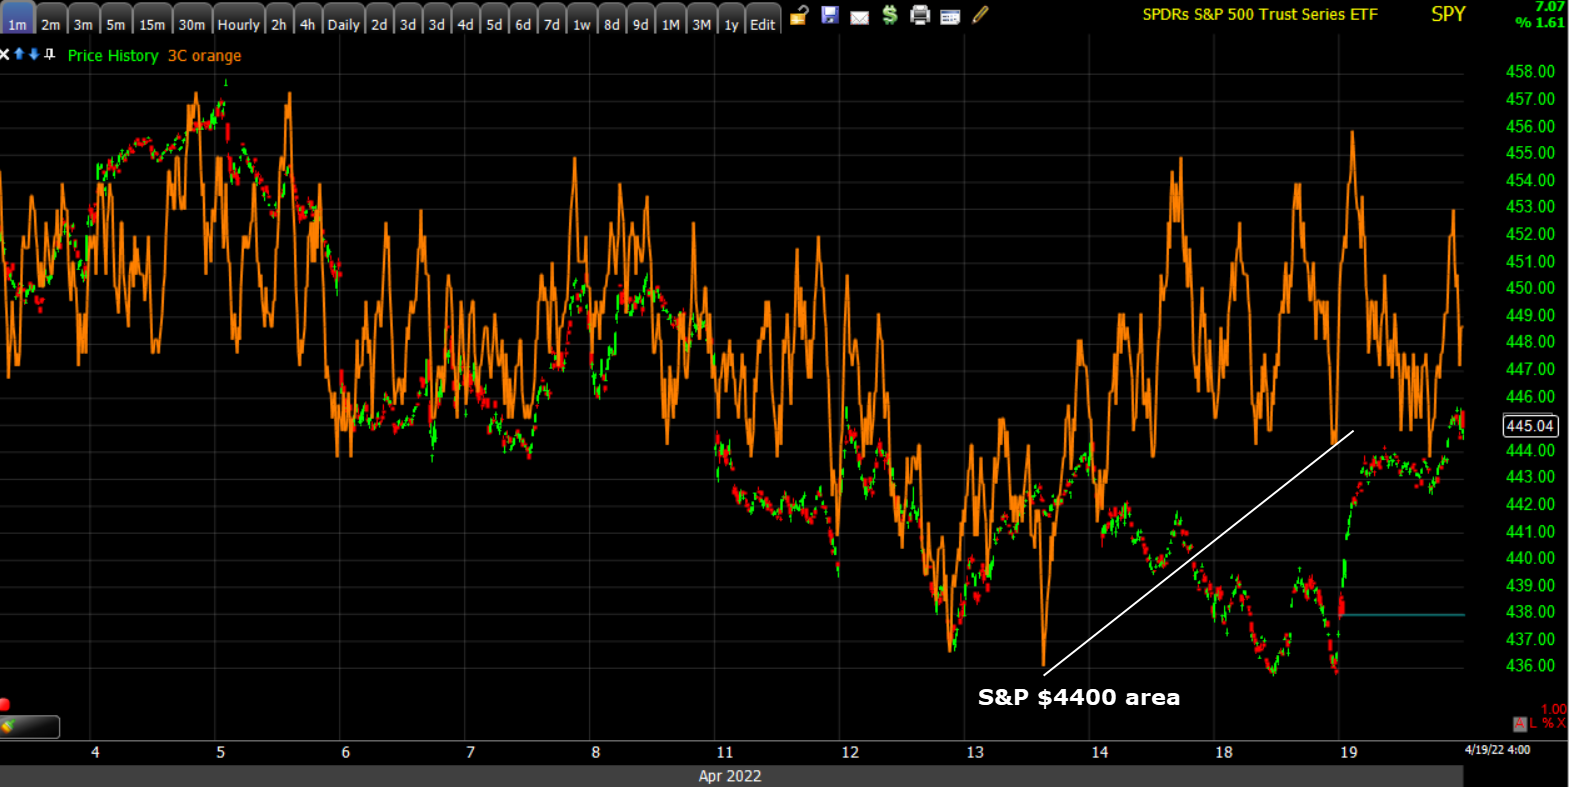 SPY (1m) shows some recent buying interest in the S&P $4400 area.
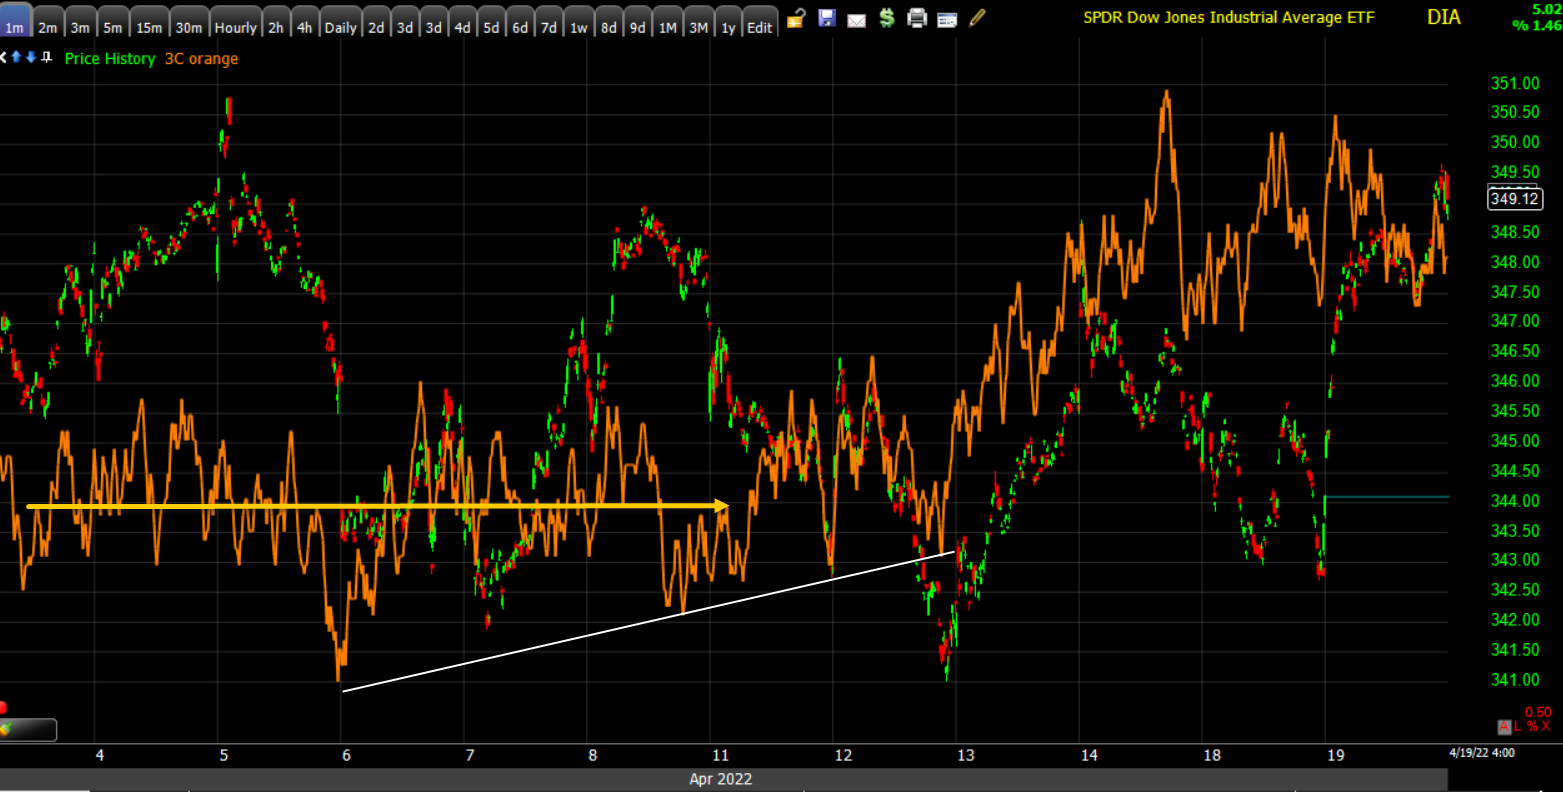 DIA (1m) saw some of the most substantial short term improvement on 3C last week.
The sub-intermediate trend (5m) 3C charts haven’t done anything noteworthy yet, but divergences tend to start on the shortest, most sensitive (and weakest) timeframe, and then if the underlying accumulation or distribution continues, migrate those divergences out to longer, stronger timeframes. Interestingly, many of the 3 min 3C charts are coming alive.
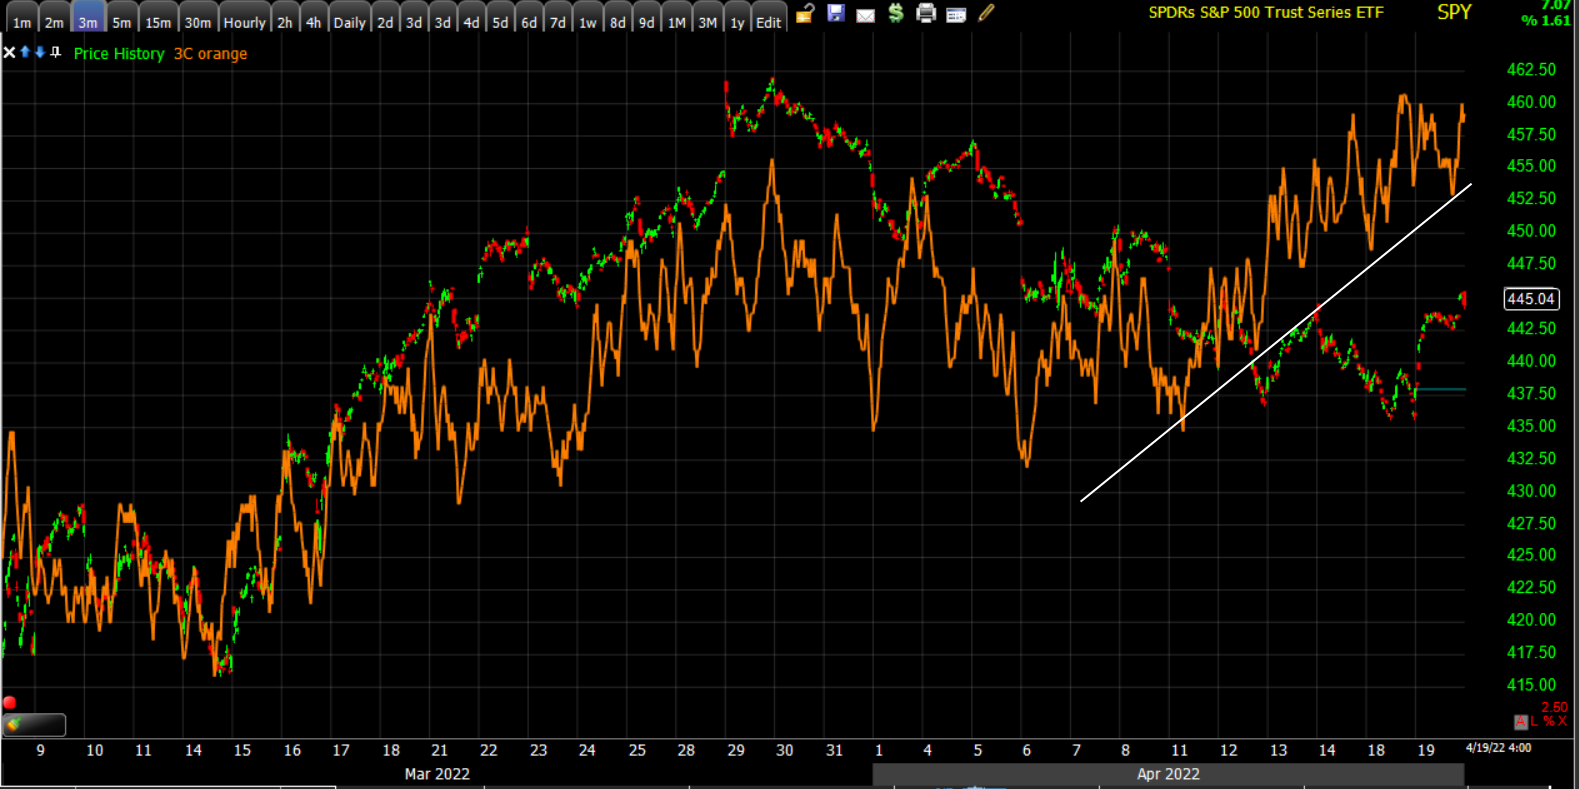 SPY (3m)
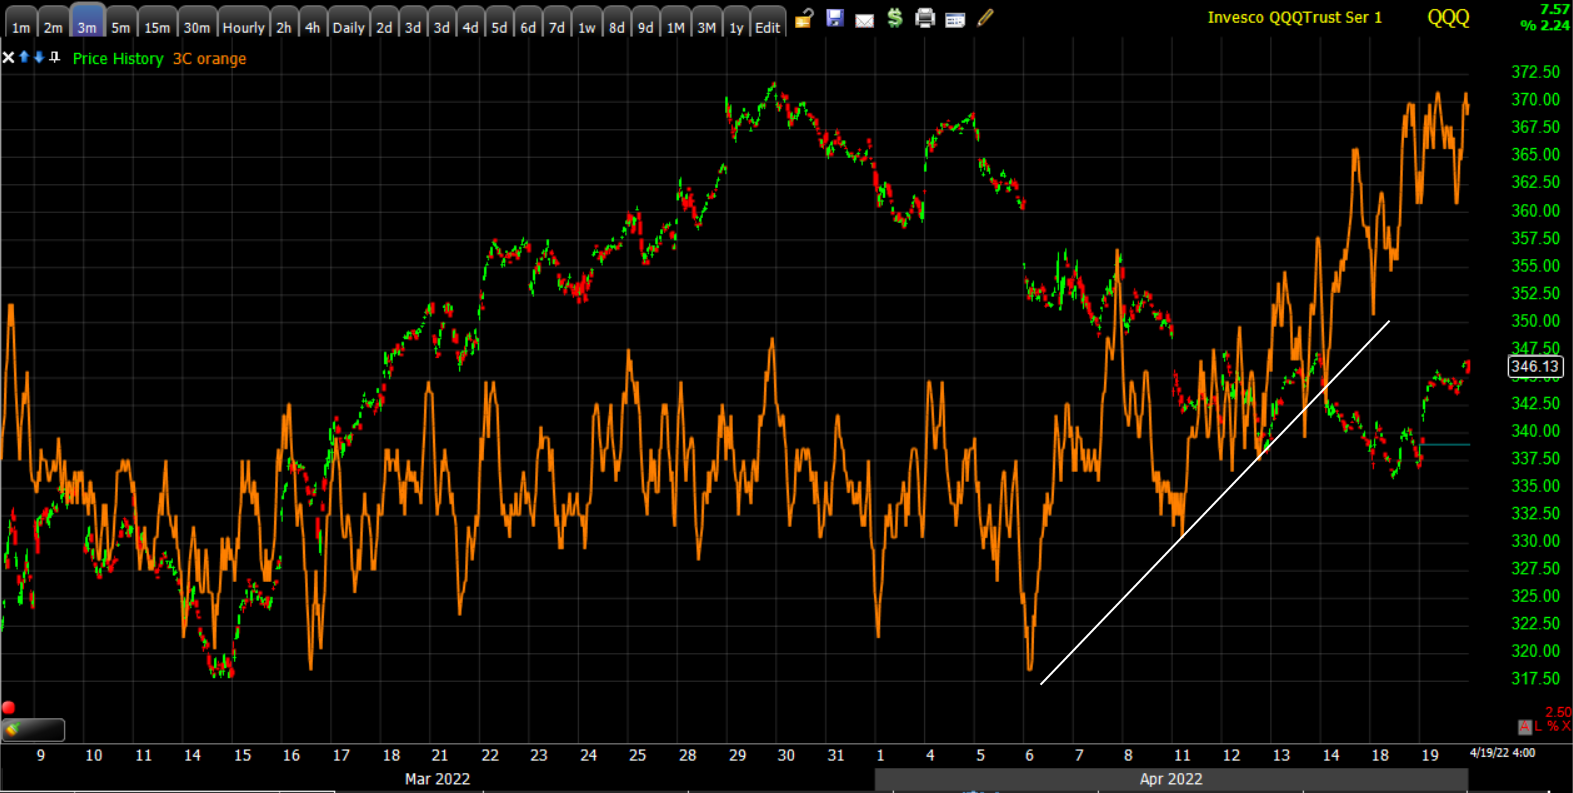 QQQ (3m)
 IWM (3m)
VIX (-3.6%) acted fairly normally today in terms of relative performance, but VVIX (-4.4%) has shown some more extreme relative weakness the past 3 days.
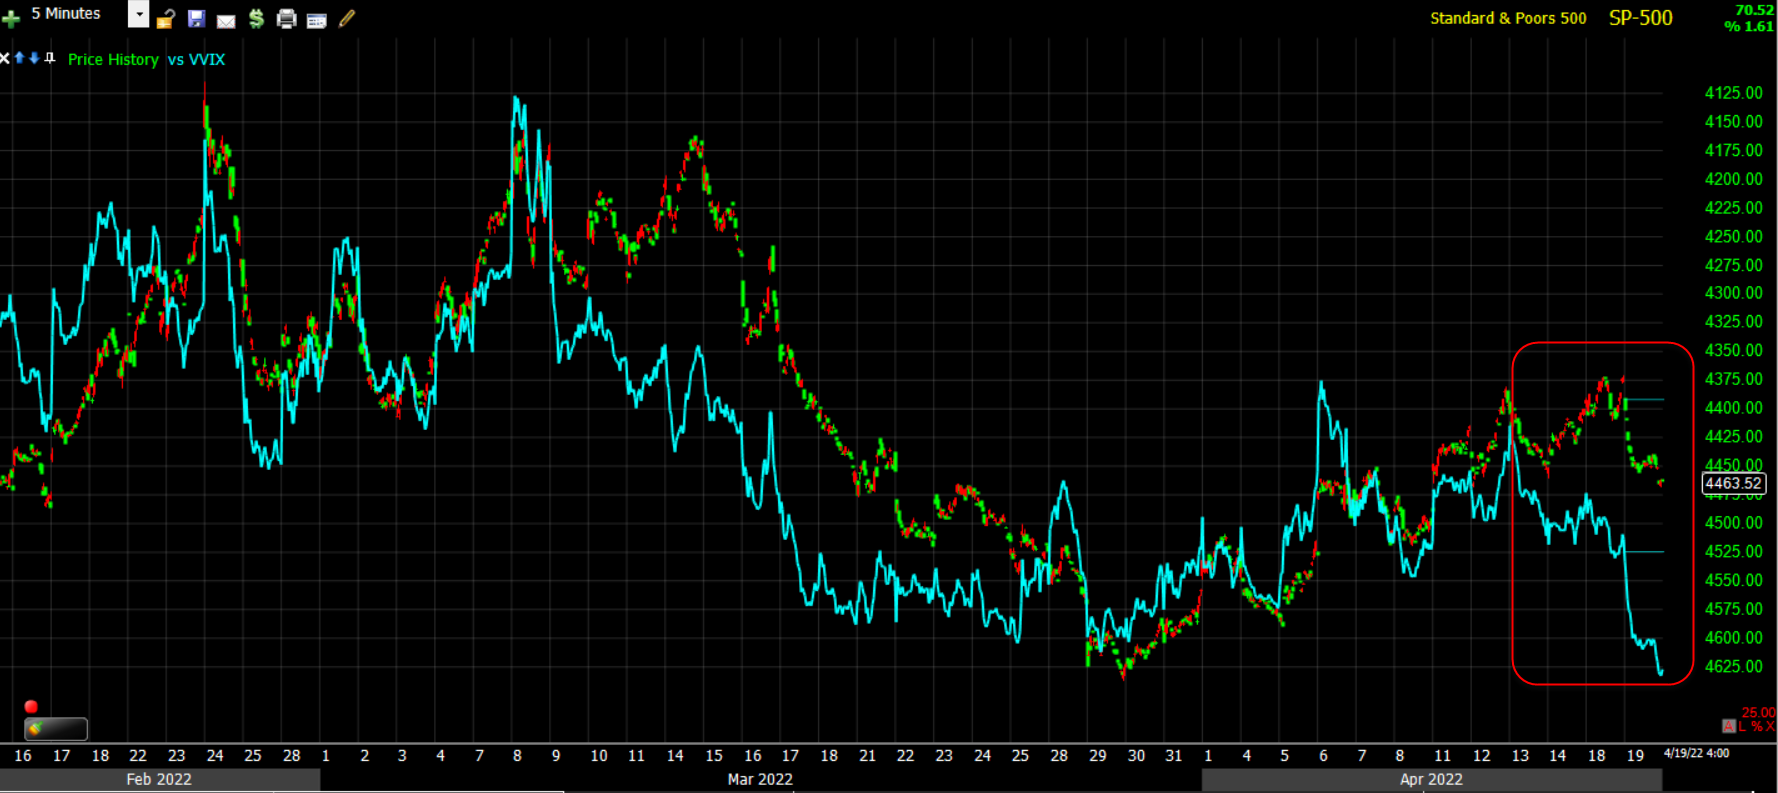 SP-500 (5m) inverted for context and VVIX with notable relative weakness recently (Red).
The Absolute Breadth Index did move into the 17s this morning, but ended around 21. A print below 14 is an important signal, but we’re not there yet.
S&P sectors
The advance today was relatively broad-based with good participation across a variety of sectors. 10 of 11 S&P sectors closed higher led by a diverse mix including defensive Real Estate, mega-cap and growth heavy Communications, Technology and Consumer Discretionary, and pro-cyclical Industrials. Only the lightly weighted Energy sector closed lower as Crude prices fell more than -5%.
Surprisingly, given the jump in yields, mega-caps outperformed (MGK +2.2% vs. the equal weighted S&P +1.8%), and the Growth style factor (+2.15%) nearly doubled that of Value (+1.3%).
Materials ⇧ 0.94 %
Energy ⇩ -0.81 %
Financials ⇧ 1.37 %
Industrial ⇧ 1.82 %
Technology ⇧ 1.88 %
Consumer Staples ⇧ 1.52 %
Utilities ⇧ 0.65 %
Health Care ⇧ 0.96 %
Consumer Discretionary ⇧ 2.90 %
Real Estate ⇧ 2.10 %
Communications ⇧ 1.99 %
Travel-related stocks performed well today amid the drop in oil prices, but many I track are at key technical resistance levels. Additionally, airline stocks extended their recent outperformance following the removal of the mask mandate for airline travel and public transportation. The U.S. Global Jets ETF (JETS) rose 2.8% today.
It seems we’re starting to see Bank’s outperform as a result of the yield curve’s recent steepening. The KBW Bank index gained +2.2%, while Regional Banks gained +3.6%.
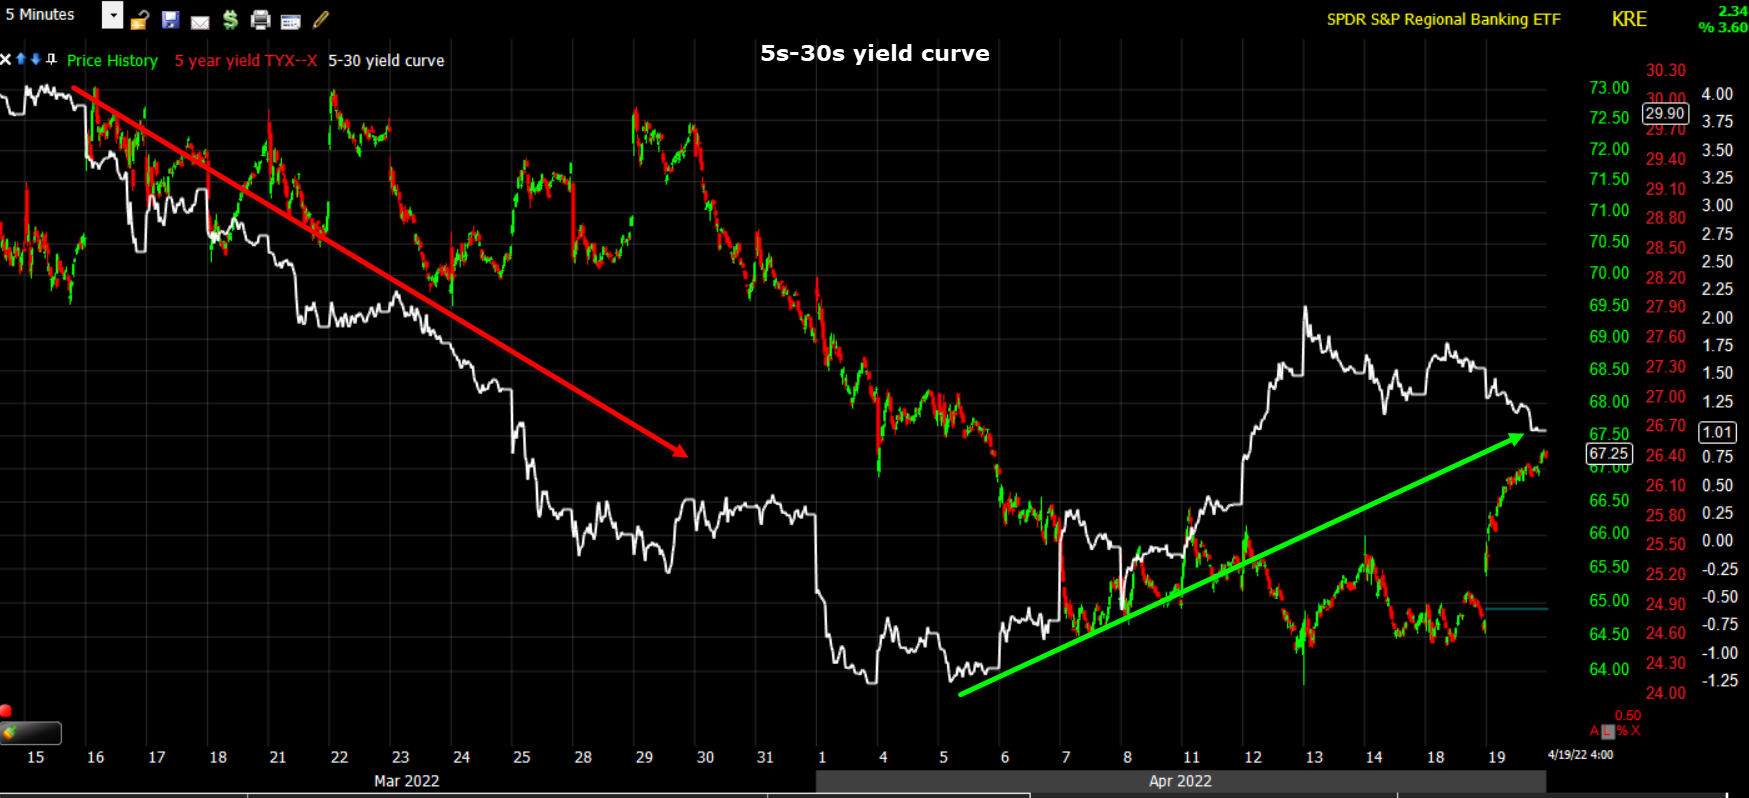 Regional Banks (5m) being led by the 5s-30s yield curve (lower, then higher).
In earnings related news, Johnson & Johnson (JNJ +3.1%) hit a fresh all-time high, putting the focus on the company’s EPS beat instead of its below-consensus FY22 EPS guidance. Fellow Dow component Travelers (TRV -4.9%) fell 5% despite beating top and bottom-line estimates.
Internals
NYSE Advancers (2160) outpaced Decliners (1041) by a 2-to-1 margin and a bit better at the NASDAQ. Volume was a bit heavier at 856.3 mln. shares.
The Dominant price/volume relationship came in at Close Up/Volume up, the most bullish price/volume relationship, which also rules out a 1-day overbought condition.
Breadth Oscillators are sitting at 70, which means the market is also not short term overbought.
NYSE, S&P-500 and NASDAQ-100 New 52 week lows all fell today as they should.
Treasuries
Bonds were sold pretty hard before the open. The short end (2y) makes sense given Bullard upping the ante and mentioning a 75 bp rate hike from the Fed and envisioning that the fed funds rate could be at 3.50% by the end of the year, but the longer end (10-year) didn’t make much sense given the IMF’s global growth forecast being cut this morning. The sharper rise in short term yields vs. longer term yields does make sense in this context.
The fed-funds-sensitive 2-year yield rose 11 basis points to 2.58% while the 10-year yield rose five basis points to 2.91% after flirting with 2.93% in the wake of better-than-expected housing starts and building permits data for March. The 30-year yield was up just shy of four basis points to 2.99%, which means today did see some yield curve flattening after the recent steepening.
10-year Real Yields (10-year yield less inflation) are surging ever closer to being positive for the first time since March 2020. Being gold tends to have a negative correlation with real yields, this may have partly been behind today’s notable early weakness in gold, as well as yields soaring.
HY Credit has been positively diverging with the S&P over the last week or so as S&P neared $4400. HY Credit (HYG -0.1%) underperformed today, but that’s entirely understandable given the jumpin in treasury yields.
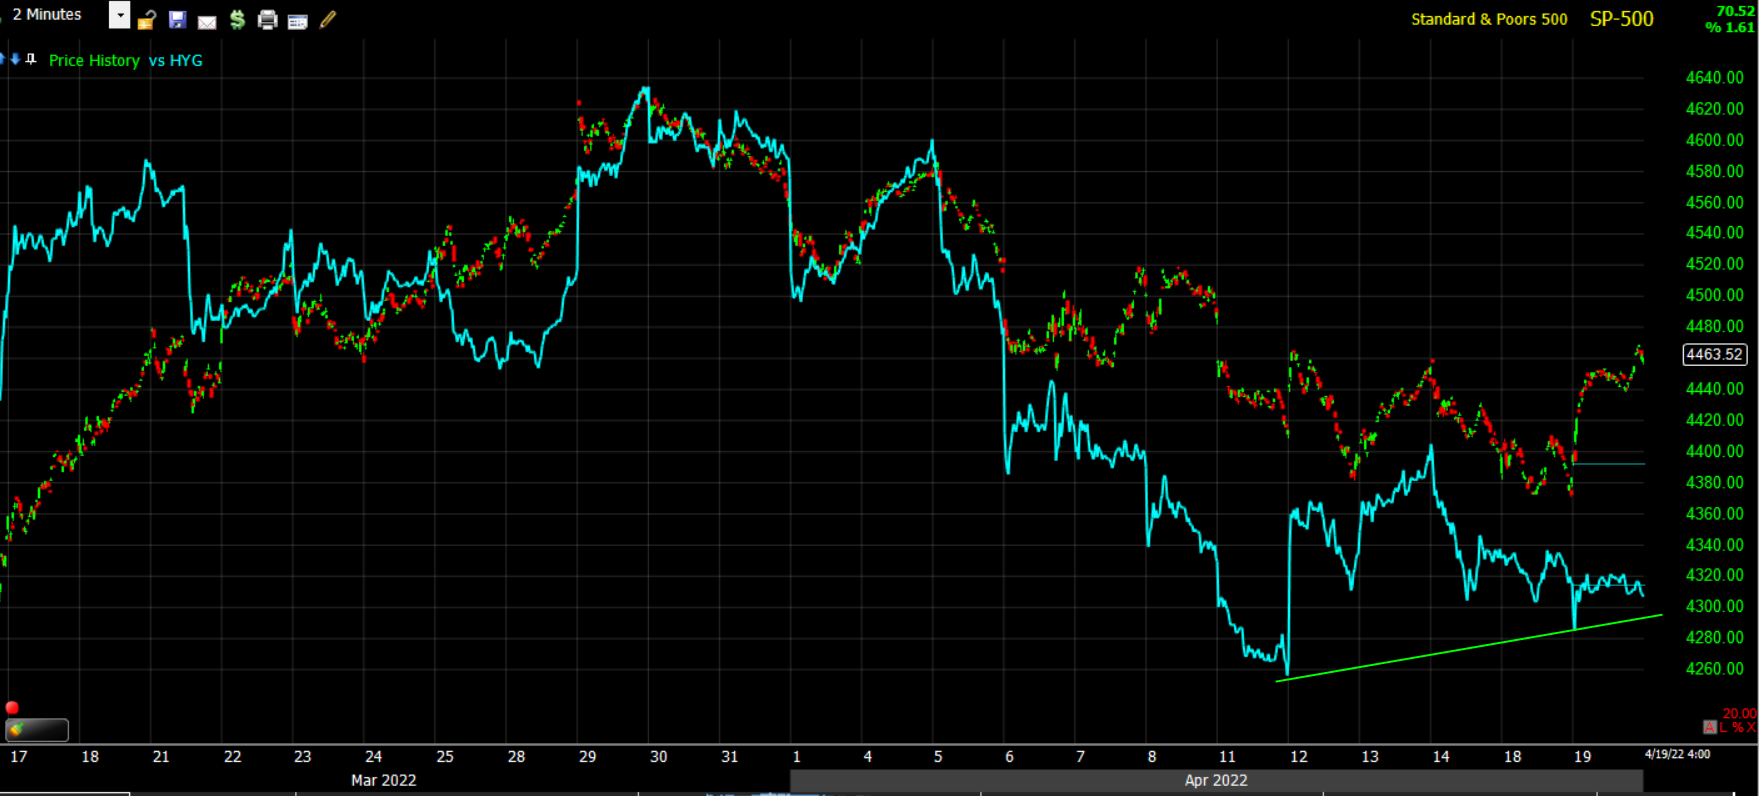 SP-500 (2m) and HYG
Currencies and Commodities
The U.S. Dollar Index gained + 0.2% to 101.00, its highest since 2020 as the Fed is looking like the most hawkish of the major central banks.
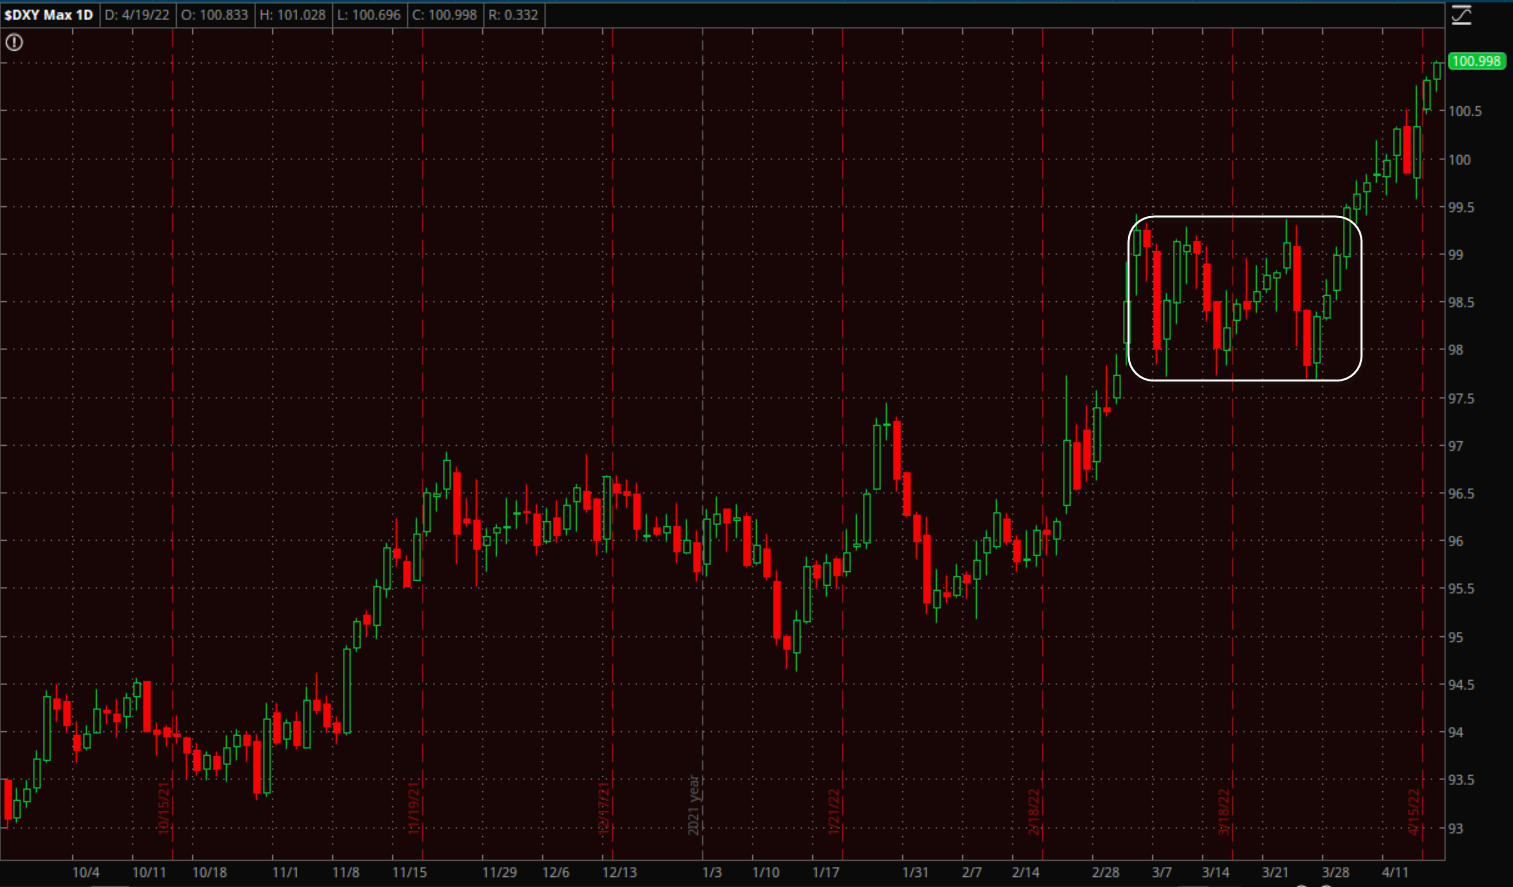 U.S. Dollar Index (daily)
WTI Crude oil closed lower by -5.7% to $102.07/bbl, and natural gas fell -8% to $7.17/MMBtu, -0.63, -8.0%) after the IMF slashed global growth forecasts.
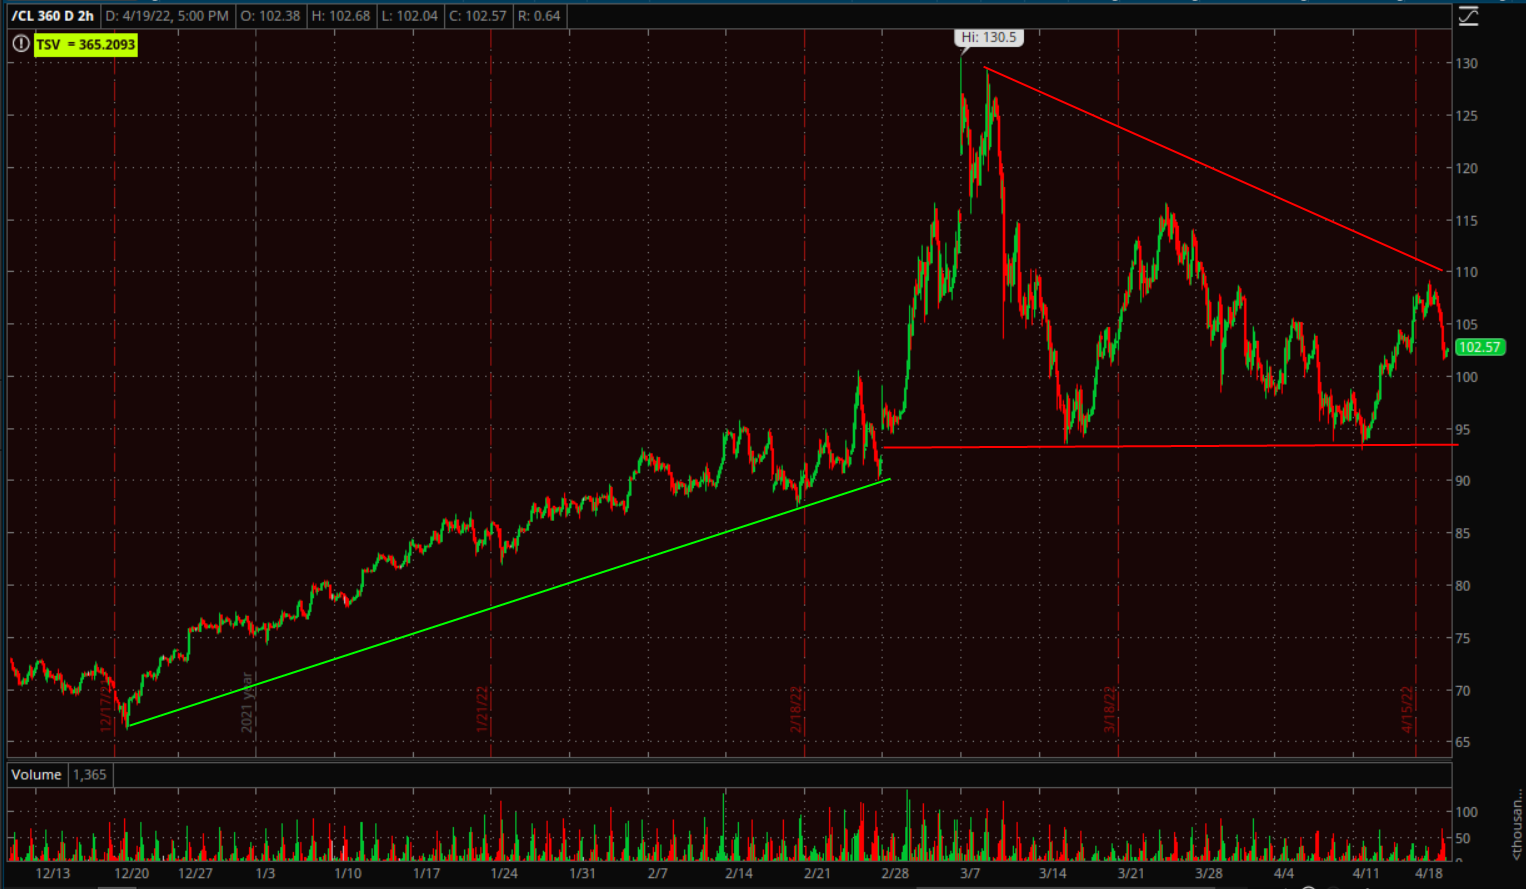 WTI Crude’s (2 hour) price consolidation is turning out to be a large descending triangle with a bearish bias 1) due to its size and volatility, and 2) because of the descending triangle which is a more typical bearish consolidation following a price decline.
After a brief foray above $2000 and pull back yesterday, Gold futures settled lower by -1.4% to $1,959.00/oz, slipping from multi-week highs with the dollar hitting two-year highs and treasury yields moving higher.
 Gold futures (5m) as noted yesterday, I didn’t expect gold to hold above $2000 on its first attempt, and 3C suggested at least a consolidation in the area before another attempt at > $2000. However, the decline in gold this morning was sharper than I’d like to see for a bullish consolidation, but thus far Gold is hanging around the $1950 level which I think is crucial to hold to remain near term constructive.
After a brief consolidation overnight, Bitcoin extended yesterday afternoon’s gains trading above $41,500.
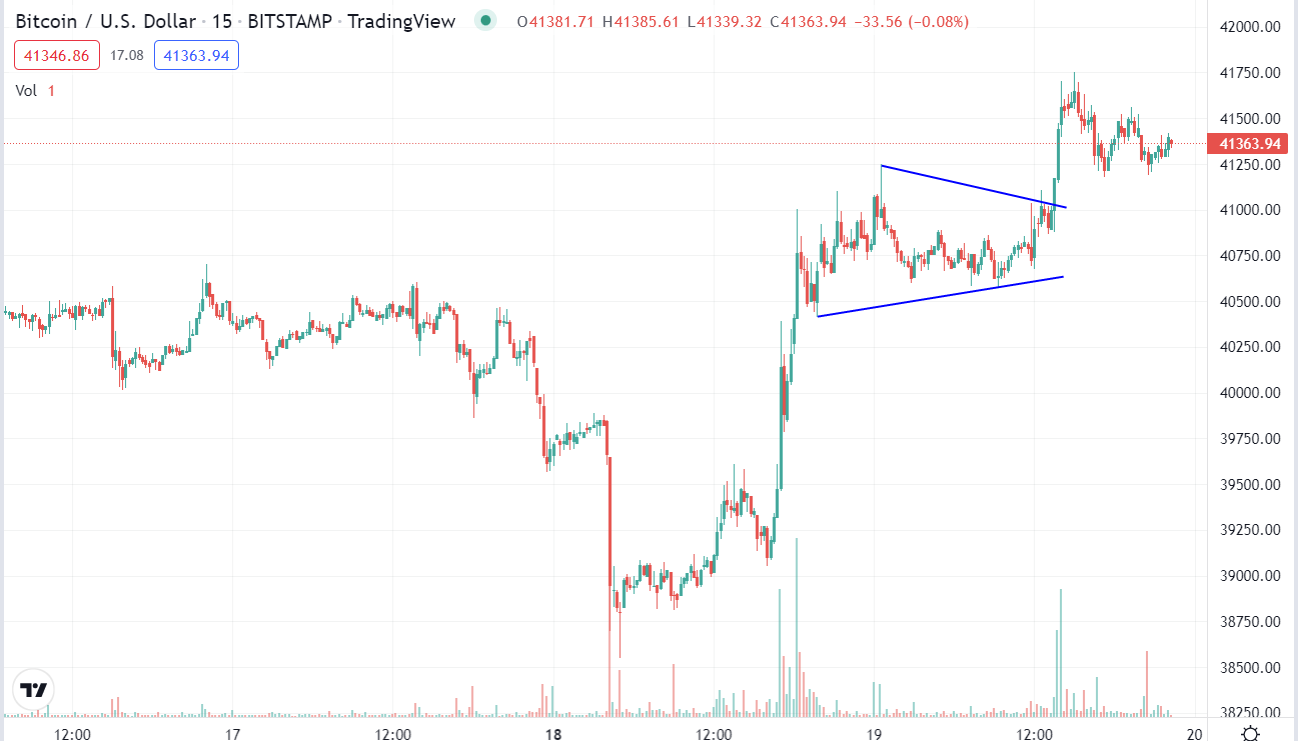 BTC/USD (15m) and ended the afternoon with another small bullish consolidation.
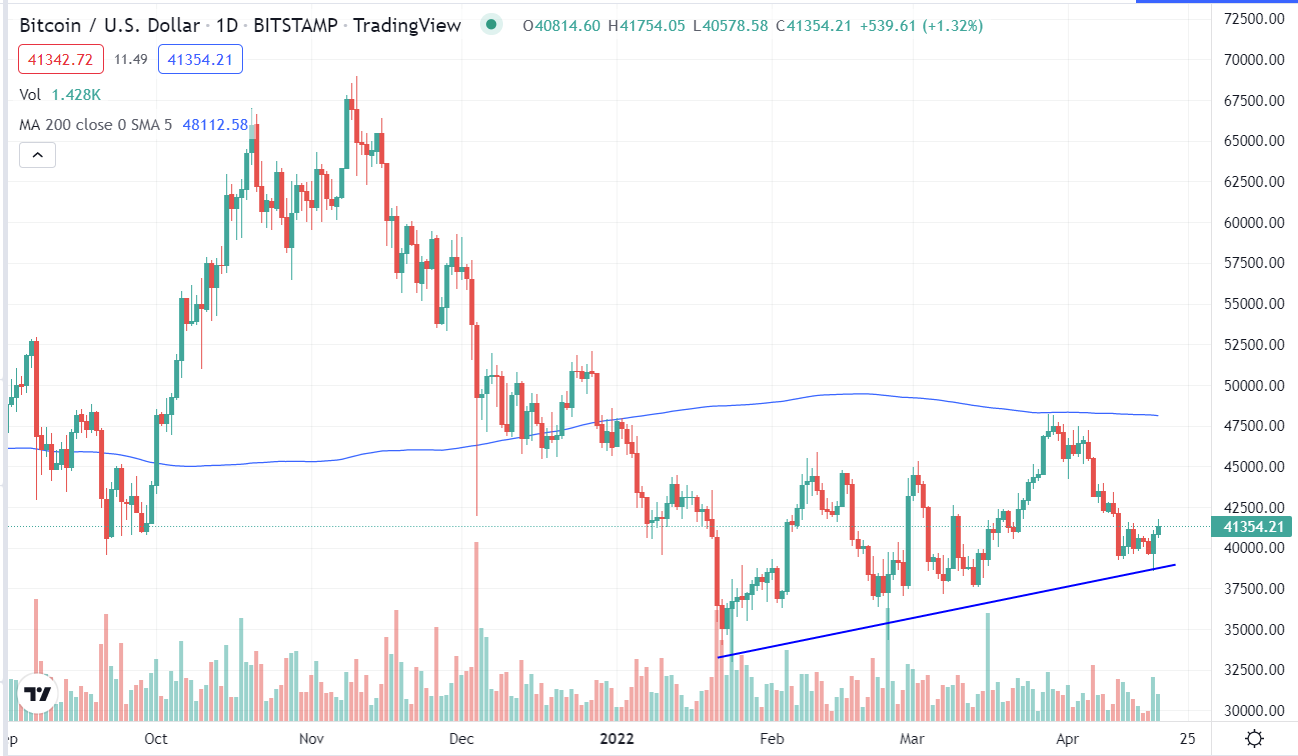 BTC/USD (daily), but from a broader perspective, the price trend from February trading under the 200-day sma is unchanged and I still view this as dead-money for the time being.
Summary
After S&P’s 3C (and Dow) showed some buying interest in the S&P $4400 area over the last week, the market put in impressive performance today in being able to overcome a stronger dollar, higher yields, hawkish comments from the Fed’s Bullard and some technical levels. The lower oil prices likely helped, as did less-hawkish commentary from Chicago Fed President Evans and Atlanta Fed President Bostic, both of whom are not FOMC voters this year.
There also may be a bit of a contrarian extreme in play as well. Last week, a survey by the American Association of Individual Investors showed a bullish sentiment reading of just 15.8%, which was the lowest since 1992.
I’m still of the same mindset I have been since March. I’m still short term bullish, but longer term bearish. I’m still holding long S&P exposure on a short term trade basis, but am much more excited about getting short into price strength and when investors are giddy with bullishness and shorts have capitulated. The S&P and Dow did enough today to turn the 3-week correction trend into a transitional trend, and NASDAQ had impressive performance given the rise in yields. It’s a good start, but there’s more work to be done for this market to prove itself in the short term. I still think the S&P $4750 area is a reasonable upside target, but I doubt it makes a new record high and if it does not, we’ll have a mature H&S top with a fully formed right shoulder. That’s the longer term trade (short) I’m interested in as the year goes on. As always, there are no hard and fast rules in the market, but just like the concept of, “When the missiles fly, it’s time to buy” worked well, the rule of thumb is “Sell the second Fed rate hike”. The short term view and the longer term view (take Dow Transports vs. industrials short and long term as an example) seem in line with this market concept.
Overnight
S&P futures are -0.4% in something of a consolidation extending from the afternoon. NASDAQ-100 futures are down -1% in what also looks like a consolidation (small bull flag), while Dow and Russell 2000 futures show better relative performance (-0.1% each). Dow futures have the most solid 3C chart heading into the overnight session.
WTI Crude is up +1.2% in what is thus far a bearish consolidation of the day’s losses.
Gold futures are down -0.55% since settlement and trading right at $1950.
Treasury futures are down across the board and this is probably the biggest threat to today’s gains as we move into the overnight session. The 2 and 10-year yields are both up about another 4 basis points and I don’t see anything on the price or 3C charts that suggests the move is nearing an end, except the Ultra T-Bond futures are yet to make a lower low for the day. Of course this time last night Treasury futures were looking better until Bullard and the IMF’s comments and analysis. That’s he key risk I see headed into tomorrow for equities.
Looking ahead, investors will receive Existing Home Sales for March, the April Beige Book, and the weekly MBA Mortgage Applications Index on Wednesday.