Daily Wrap – Stock Market Analysis
After some positive developments yesterday on the charts (touched on below), the averages put in a strong and broad-based rally, helped by some positive earnings, better than expected economic data, a decline in long term interest rates, Energy prices not skyrocketing, and really the magnetic pull of open gaps above.
In earnings the high-profile earnings winners included UnitedHealth (UNH +4.2%), Bank of America (BAC +4.5%), Morgan Stanley (MS +2.5%), Walgreens Boots Alliance (WBA +7.4%), Citigroup (C +0.8%), and Taiwan Semi (TSM +2.4%).
Taiwan Semi also provided upside Q4 revenue guidance, which served as an additional boost for the Philadelphia Semiconductor Index (+3.1%). Wells Fargo (WFC -1.6%) and U.S. Bancorp (USB -2.3%) struggled with losses despite beating expectations. Also an FDA advisory committee unanimously recommended Moderna’s (MRNA +3.2%) booster shot for adults 65 years and older and other high-risk adults.
Economic data came in better than expected or feared. Value stocks drew support from better-than-expected Q3 earnings reports and from the lowest level of weekly jobless claims since the start of the pandemic. Initial jobless claims decreased by 36,000 to 293,000 (consensus 332,000).
The Producer Price Index for September was a bit softer than consensus expected. The index for final demand increased 0.5% month-over-month (consensus +0.6%) and the index for final demand, less foods and energy, increased 0.2% (consensus +0.5%). On a year-over-year basis, the index for final demand was up 8.6%, versus 8.3% in August. While better-than feared, that is the largest advance in the history of the index. The charts below are staggering and surely throw the Fed’s transitory inflation in doubt in favor of structural inflation, which is no doubt why the Fed’s tapering and rate hike lift-off have been more and more aggressive since the June FOMC.
Producer Prices
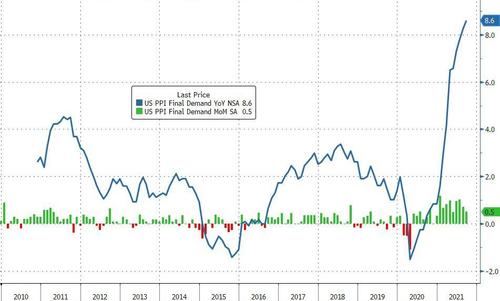
source: Bloomberg
Core PPI
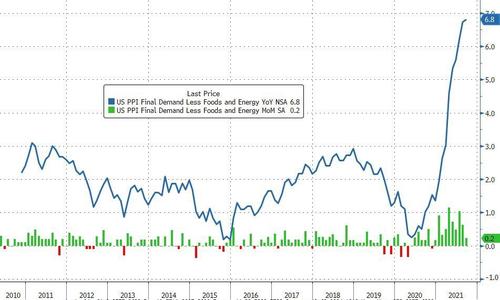 source: Bloomberg
Here are some excerpts from yesterday’s Afternoon Update…
“The S&P is just under its 100-day and if it can move above the neckline, the daily chart will post a short term bullish hammer-like candle….
Likewise, if the Dow can close just a bit stronger it will have a daily hammer (bullish reversal) candle….
Like the S&P, NASDAQ-100 (5m) traded up to its smaller H&S neckline after the minutes.
If it (NASDAQ-100) can close a bit stronger, it to will have a short term more bullish hammer like candle…
Credit/HYG is looking a little better short-term with a relative positive divergence that helps the argument for a short term market low, but does nothing to alter the severely weakened trend…
It’s all about the close and whether slightly better price performance makes a short term low and upside market reversal more likely or not. The averages will just have to do a little better, but if they can, they’ll have taken out some pesky resistance levels and make it more likely of a bounce to the upside, perhaps once again targeting those unfilled gaps above.“
At yesterday’s close, the S&P, Dow, NASDAQ-100 and Small Caps all posted some version of a bullish daily candle.
Averages
The NASDAQ-100 outperformed with lower yields as it often does. NASDAQ had its best day since May, and S&P its best day since March.
S&P 500 ⇧ 1.71 %
NASDAQ ⇧ 1.88 %
DOW JONES ⇧ 1.56 %
RUSSELL 2000 ⇧ 1.44 %
For weeks I’ve been expecting the major averages to fill open price gaps above because a price gap has an extremely powerful magnetic pull for prices. This is the only reason I’ve been waiting to open a market short with H&S tops maturing in the major averages. Last week the Dow was the only major average to fill the gap. Today the S&P followed suit and Small Caps came within a tenth of a percent.
 SP-500 (15m) after filling a gap below (bullish) the S&P filled the gap above.
 The Dow (15m) filled the gap above last week and the gap below yesterday, but there does seem to be resistance again around $35k as seen in July.
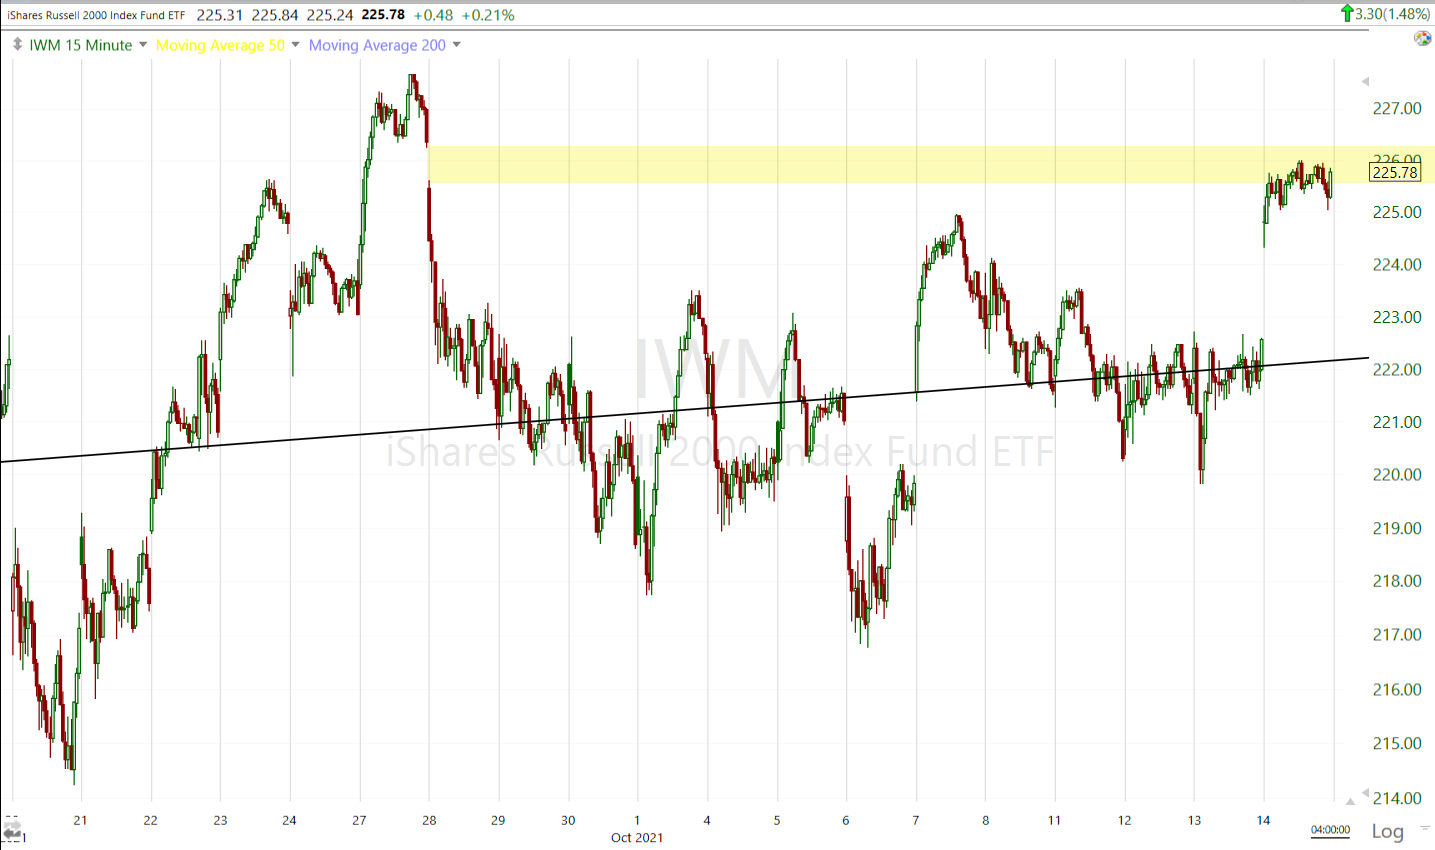 Small Cap IWM (15m) came very close to filling the gap after lingering at the 2021 toppy pattern’s neckline.
 NASDAQ-100 (15m) still has a ways to go with 2 open gaps (between 0.9% and +1.7%).
Short covering played a role…
 SP-500 (1m) and my Most Shorted Index, which saw some covering the last 2 days as the S&P tested its 100-day sma (technical support), with a more notable squeeze at today’s open, but that faded as the S&P’s 50-day sma (technical resistance) came into play today.
As for the bigger picture, shorts have been more emboldened recently as the H&S top takes shape.
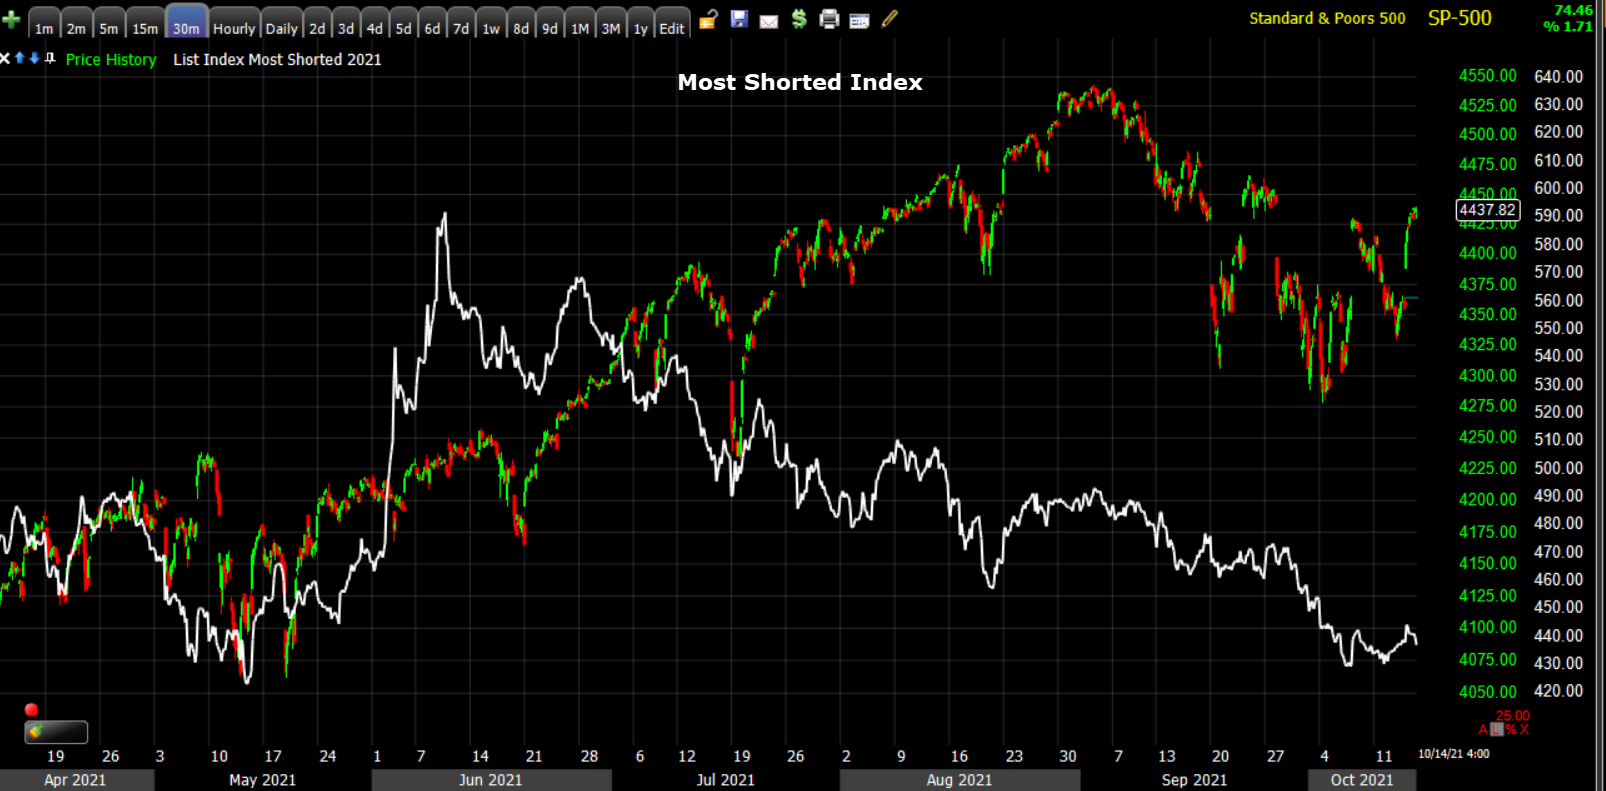 SP-500 (30m) and Most Shorted Index. We haven’t seen squeezes like earlier this year to the left, but rather most shorted stocks declining as the S&P’s H&S top matures suggesting among other things, that short sellers are gaining confidence.
I’ve been noting that many of the gaps are in the area of moving averages and have suspected that 1) the gaps will be filled, but 2) after that I don’t have a lot of confidence in notable upside follow through beyond that. There were some technical levels in play as resistance today.
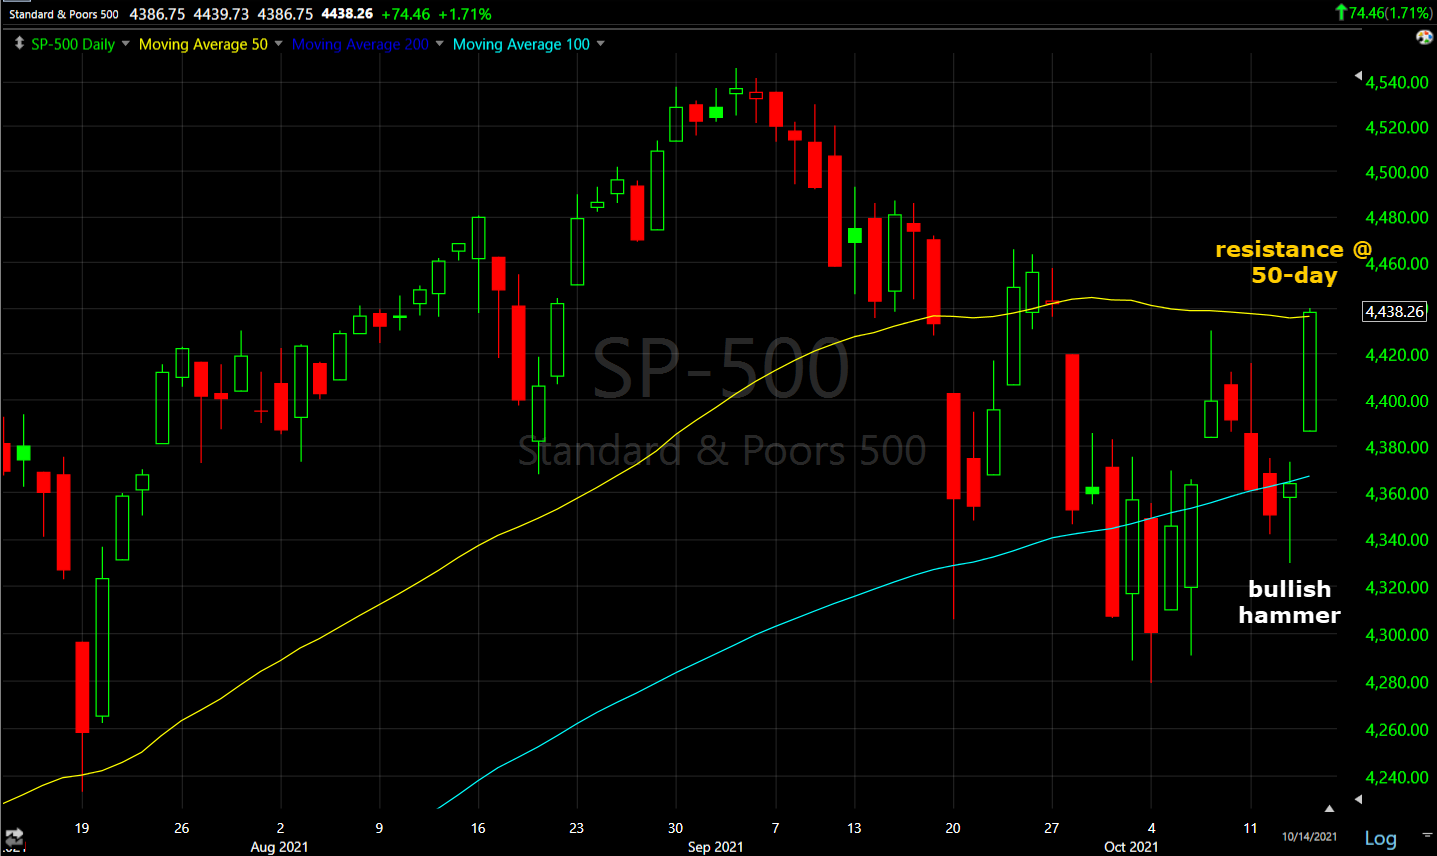 SP-500 (daily) with yesterday’s bullish hammer and prices meeting some resistance at the 50-day sma.
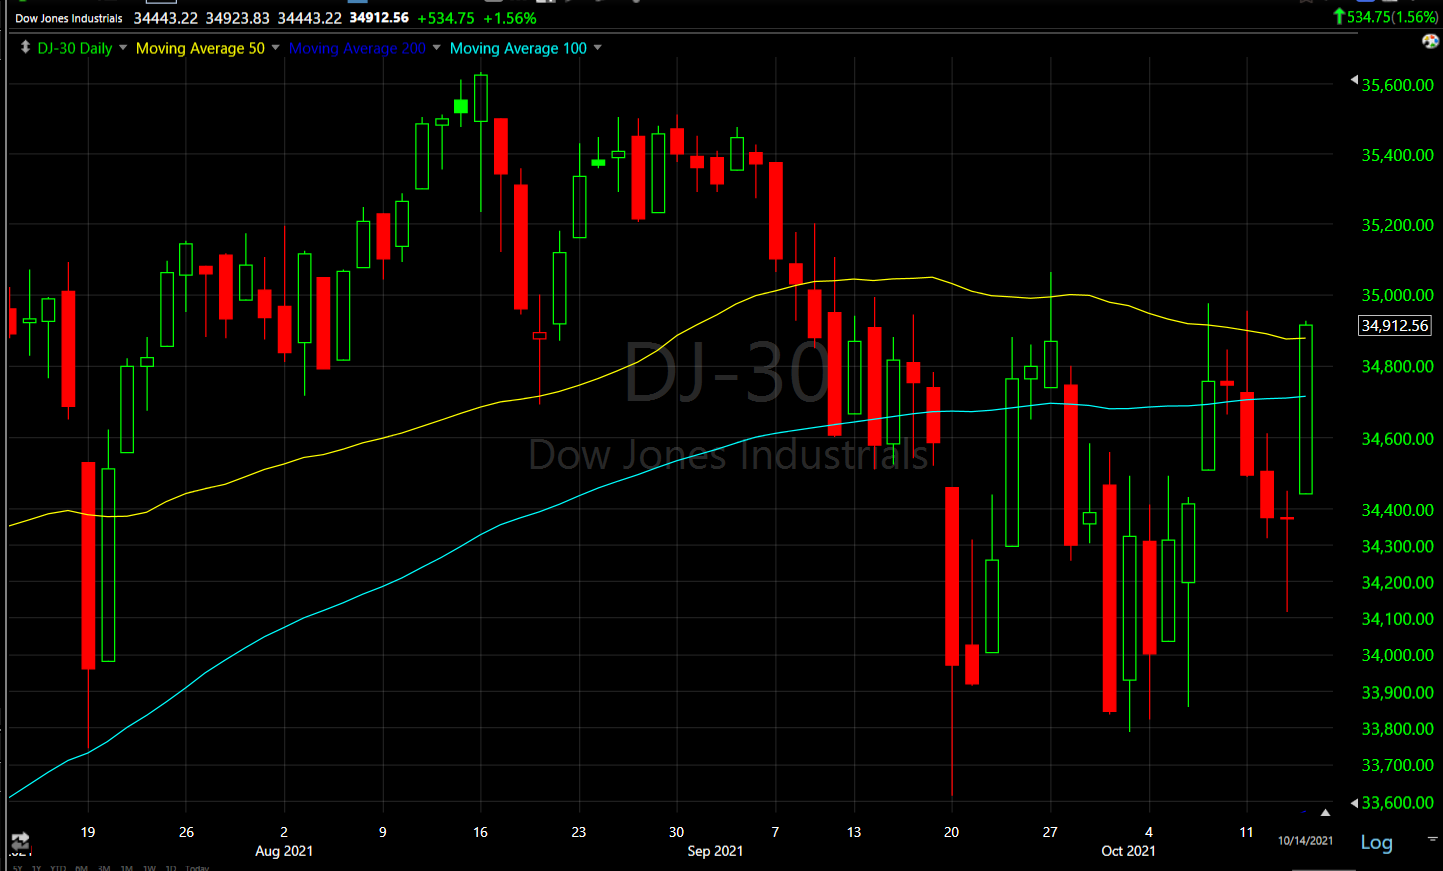 Dow (daily) managed a close above the 50-day, but just barely and the longer upper candle wicks over recent weeks in the area also suggest a probability of resistance. These are in the $35k area.
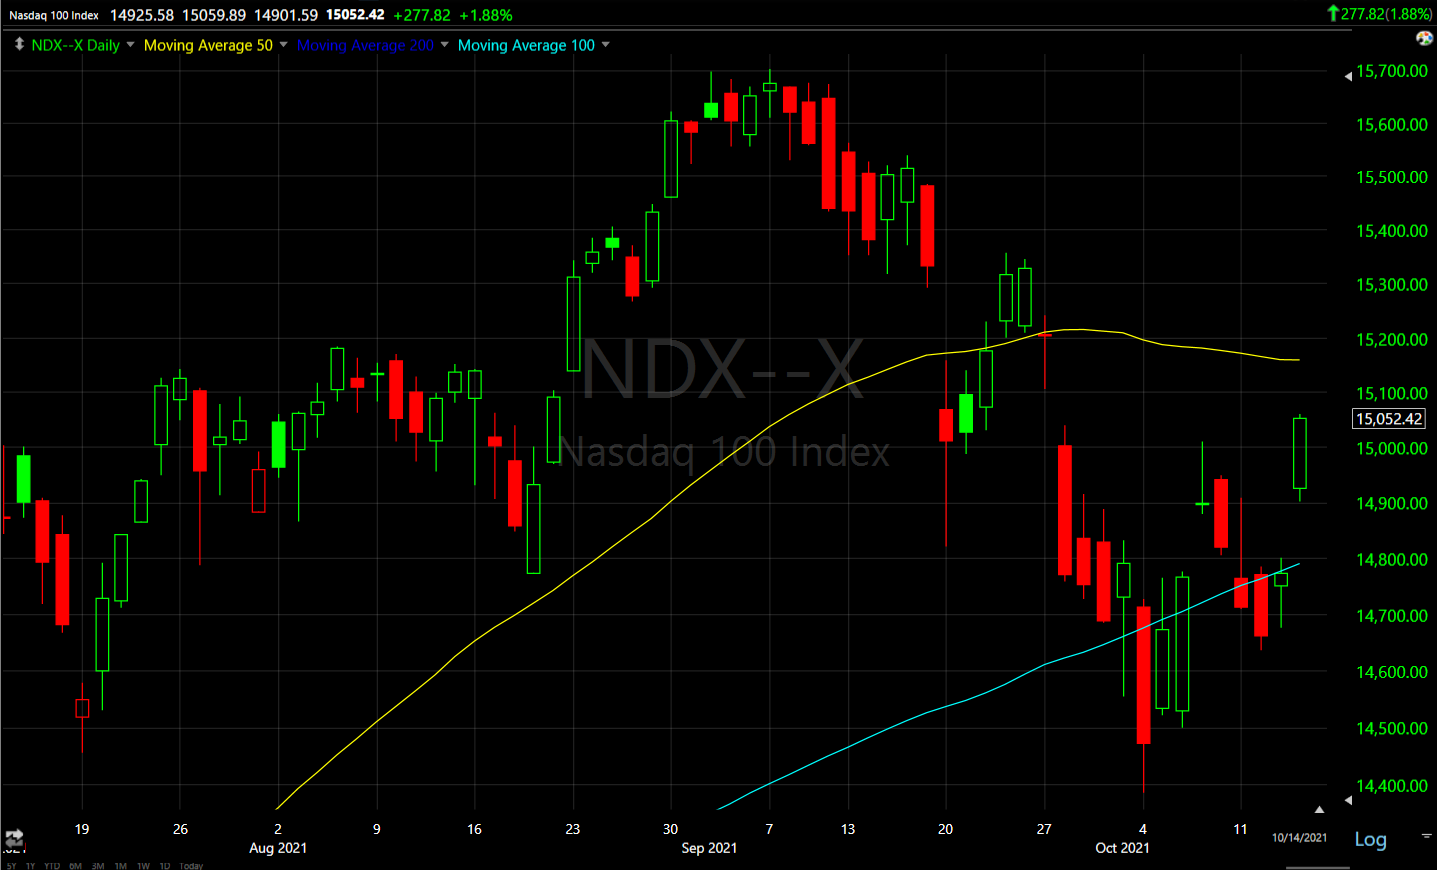 NASDAQ-100 (daily) with a bullish hammer yesterday at the 100-day and the 50-day still a ways above around one of the gaps.
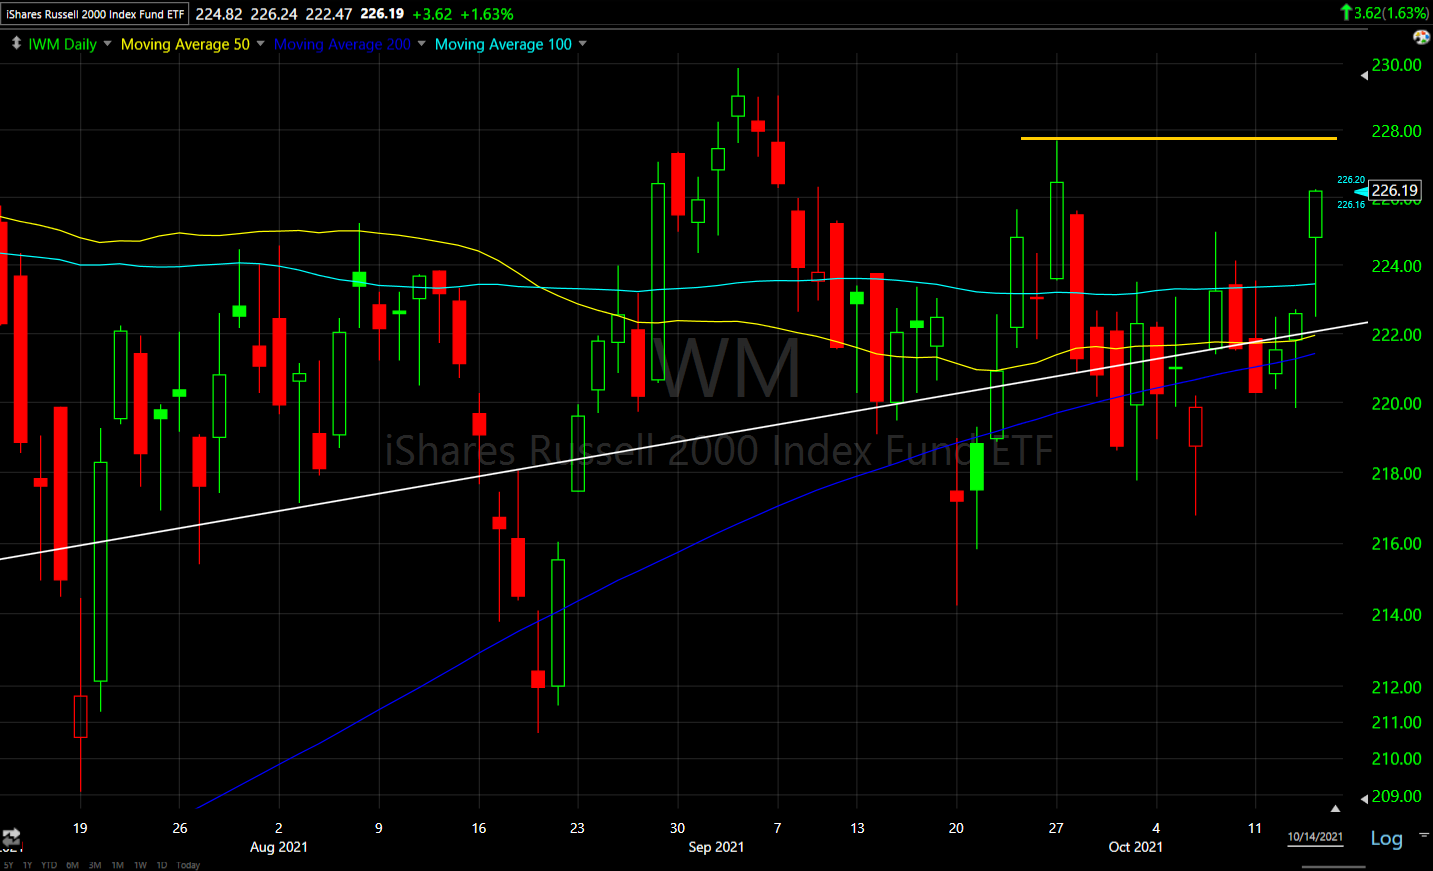 Small Caps (daily) may encounter some resistance around the $228 level
In last night’s Daily Wrap I noted that while 3C didn’t look much better, at least, “3C is not leading lower as it has been recently…at least not on a very short term (1-2 day) basis.”
What was apparent very early on today in the first cash sesion post, Early Update – A Better Start Toward Filling The Gaps, was some of the most notable short-term improvement in 3C in a while. However, by the close a few averages were less impressive.
 SPY (1m) at the white trend line at least 3C was not leading lower as it had been (modest relative positive divergence) wih 3C confirming to the upside intraday. This may not be jumping off the chart, but compared to recent weeks of leading lower, it was a clear positive change.
For more context…
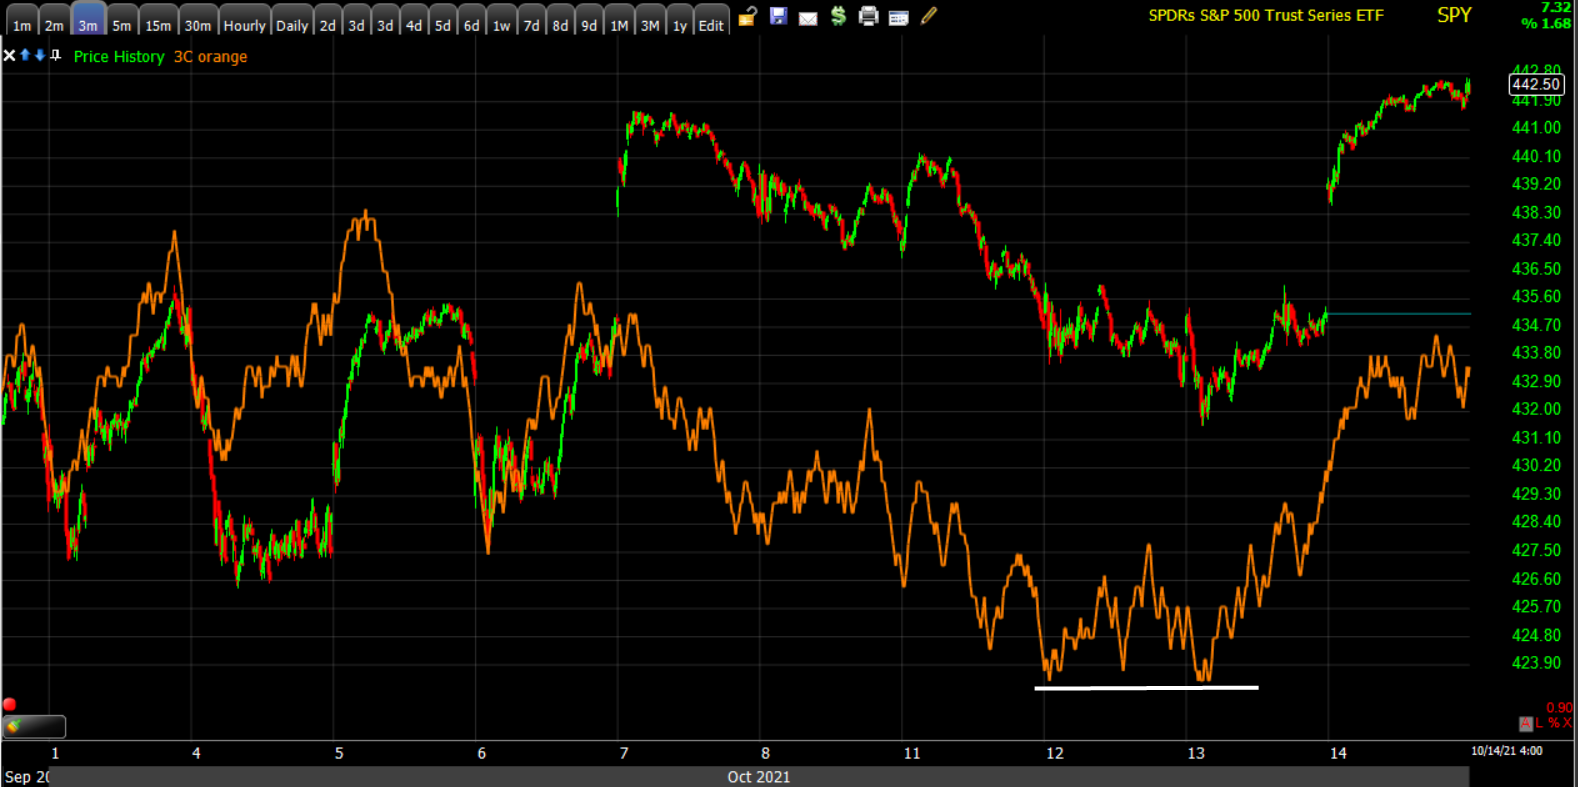
 SPY (3m)
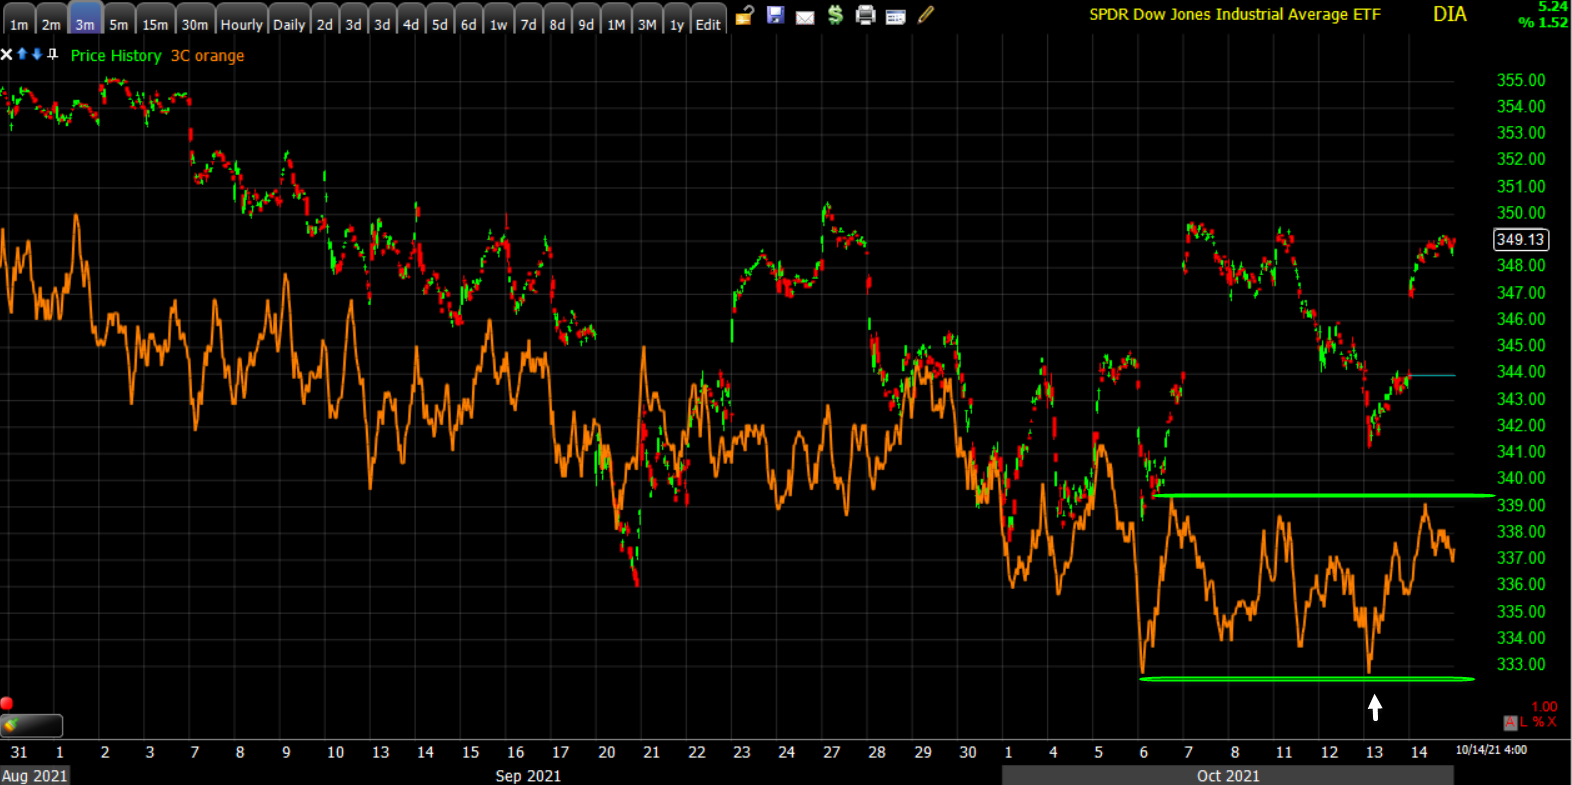 DIA (3m) was a little less impressive today after posting a small relative positive divergence yesterday (white arrow).
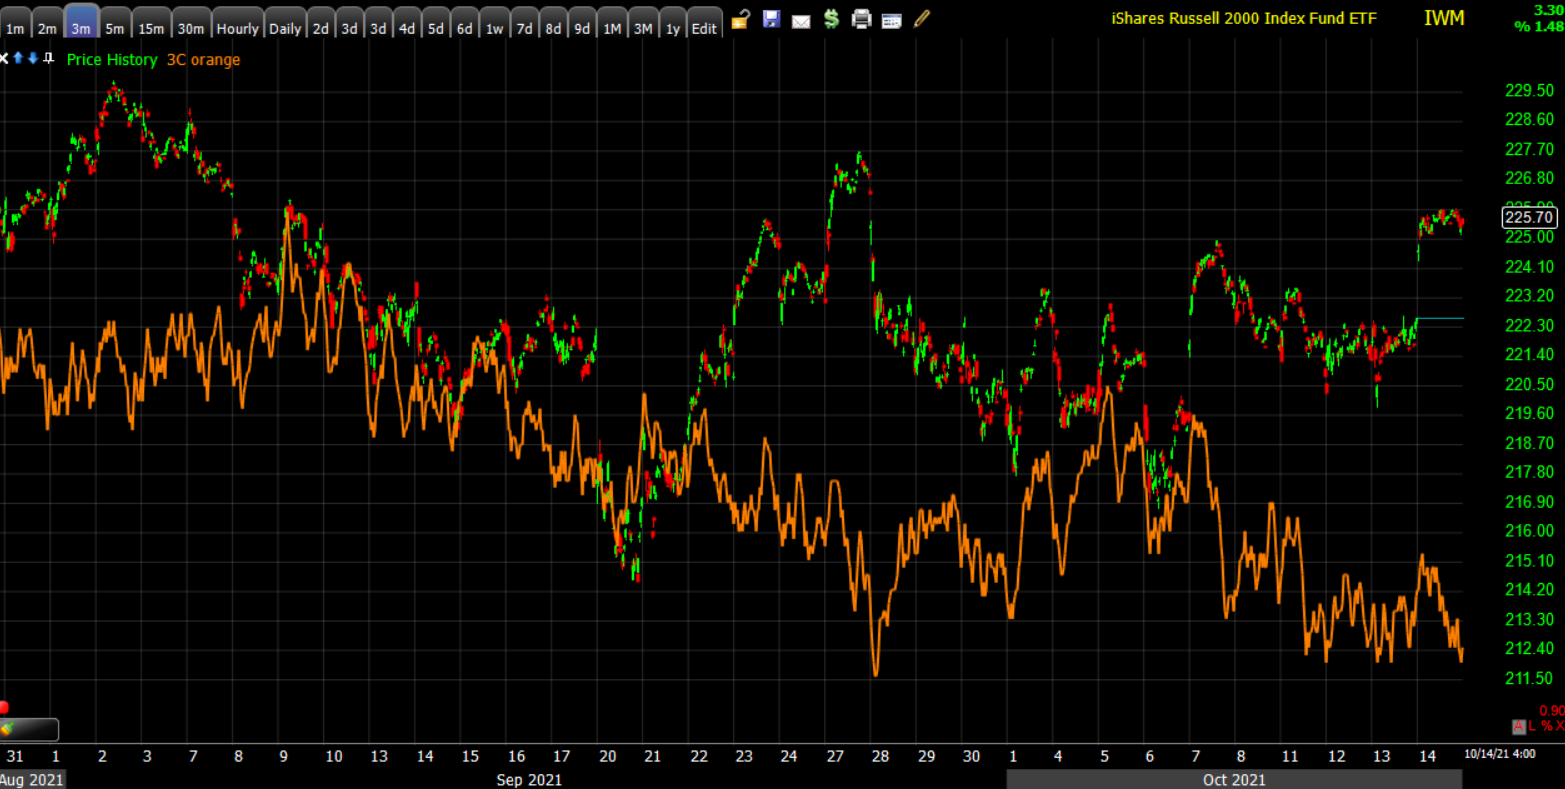
And Small Caps’ (3m) 3C chart was the least impressive, perhaps even troubling.
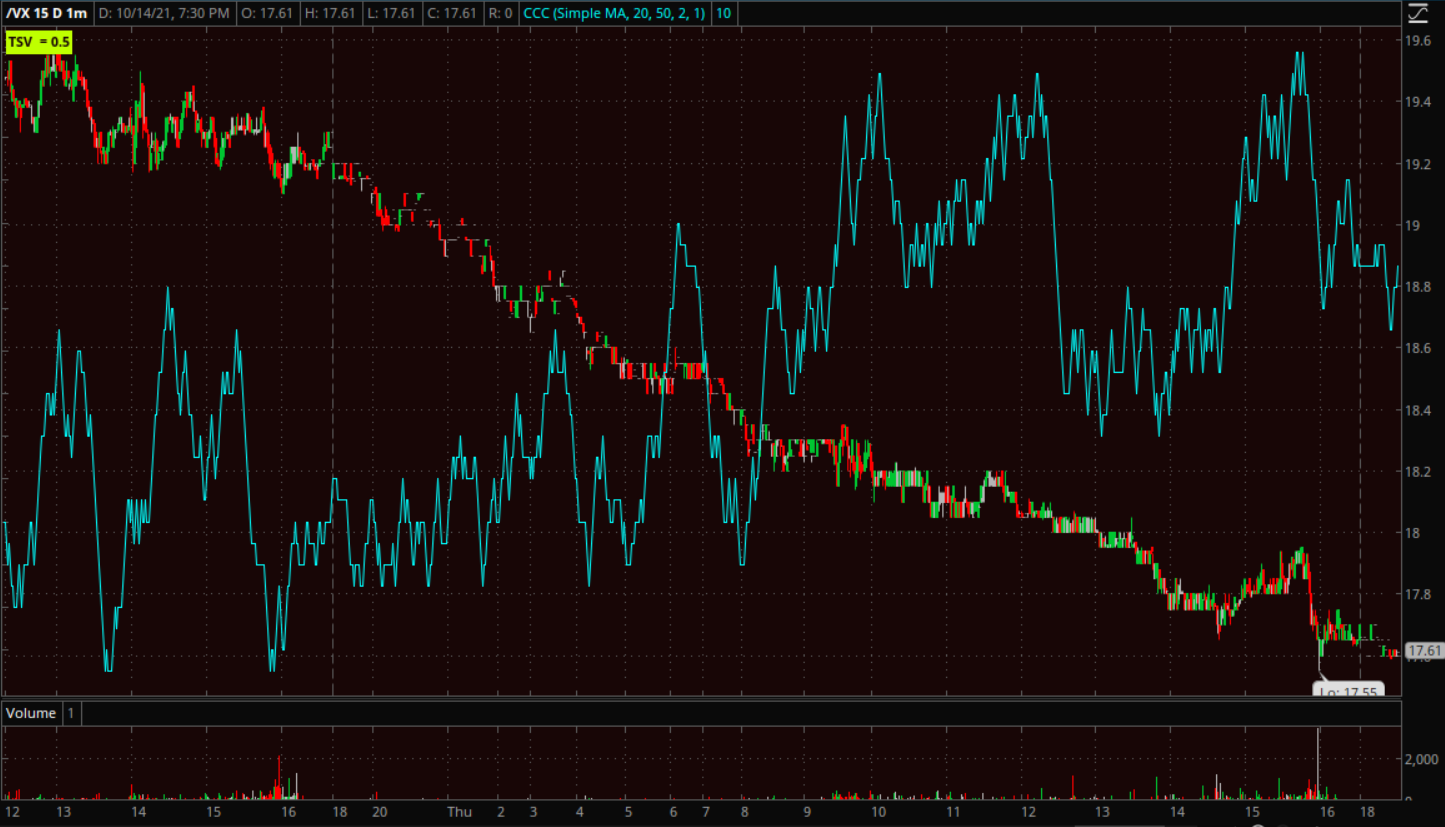
VIX (-9.55%) has seen a 2 week or so trend of relative weakness and that accelerated today.
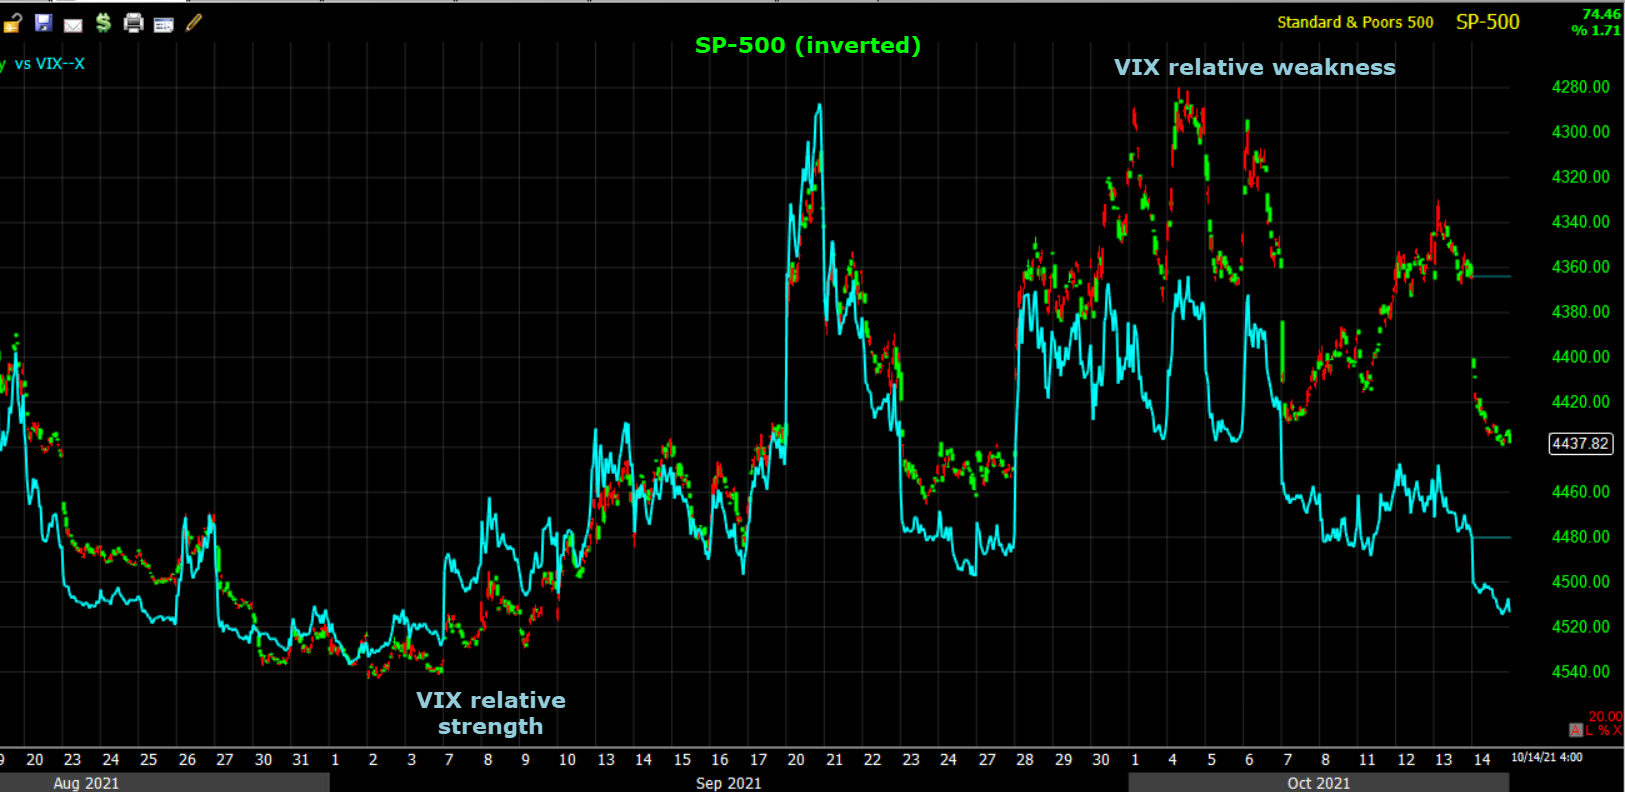 SP-500 (5m) inverted for context and VIX (blue).
However, as noted this afternoon, VIX futures’ 3C started positively diverging and we do have 2 sub-15 Absolute Breadth Index signals in the last week which suggests a very high probability of a double digit percentage gain in VIX within the next 3-4 weeks.
S&P sectors
All 11 S&P sectors closed higher by >+1% in a broad-based rally. The lightly weighted Materials sector was the day’s and week’s best performer, while the most influential sector, Technology, was second best – particularly benefiting from the 10-year yield declining by three basis points to 1.52%. Financials rallied along with everything else today after big bank earnings kicked off earnings season yesterday, but remain lower on the week. So far results have been mixed. Wells Fargo (WFC -1.6%) is the week’s biggest loser while Morgan Stanley (MS +2.5%) and Bank of America (BAC +4.5%) are outperforming, The rest of the big banks are still red for the week.
Materials ⇧ 2.43 %
Energy ⇧ 1.22 %
Financials ⇧ 1.67 %
Industrial ⇧ 1.89 %
Technology ⇧ 2.25 %
Consumer Staples ⇧ 1.13 %
Utilities ⇧ 1.23 %
Health Care ⇧ 1.43 %
Consumer Discretionary ⇧ 1.05 %
Real Estate ⇧ 1.41 %
Communications ⇧ 1.41 %
Internals
NYSE Advancers (2513) outpaced Decliners (753) by a 3-to-1 margin on just ever so slightly higher Volume (795.3 mln. shares).
Below is a chart of SPY and volume during the formation of a complex (more than 1 left and right shoulder or head) Head and Shoulders top. Volume confirmation may be the most important factor in confirming a legitimate H&S top. The price/volume trend at the left shoulder is irrelevant, but by the rally that forms the head a valid H&S should see a trend of declining volume (orange arrow) on the rally. Then there should be a notable increase in volume from the top of the H&S’s head to the neckline – in essence weaker conviction on the part of buyers during the rally, and stronger conviction of sellers on the decline. This same pattern should be present as the right shoulder forms and is often even more extreme with heavier volume on the declines to the neckline.
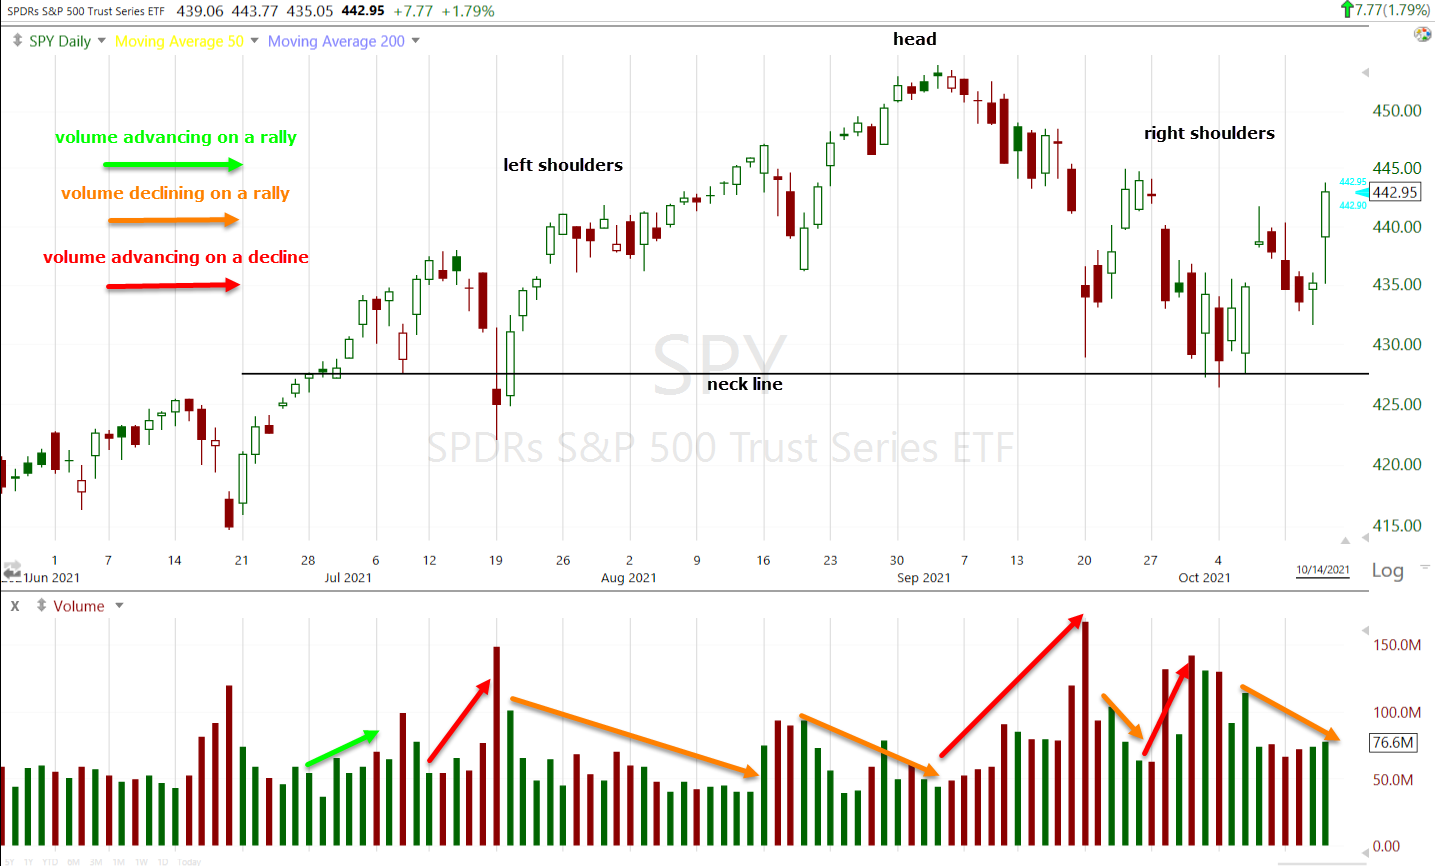 SPY (daily)
There’s no Dominant price/volume relationship, it’s nearly equally split between Close Up/Volume Up (the most bullish) and Close Up/Volume Down (the most bearish). Other than not having a dominant p//v of close Up/Volume Down, internals would otherwise indicate a strong 1-day overbought condition. This leaves some room for the averages to try to add a bit to today’s gains on a follow through move with no 1-day overbought condition.
The breadth oscillators that entered oversold territory yesterday briefly, are well back into overbought territory (I almost never short an oversold market). The NYSE 13 week new high/new low ratio (scale of 0 to 100) came in at 96 today, or overbought.
Treasuries
The Fed-sensitive 2-year yield decreased two basis points to 0.35%.The 10-year yield declined by three basis points to 1.52% resulting in some very modest yield curve steepening.
On Friday I said I thought the 10-year yield could pull back to test the bull flag. It has done so and has not nullified the bullish flag.
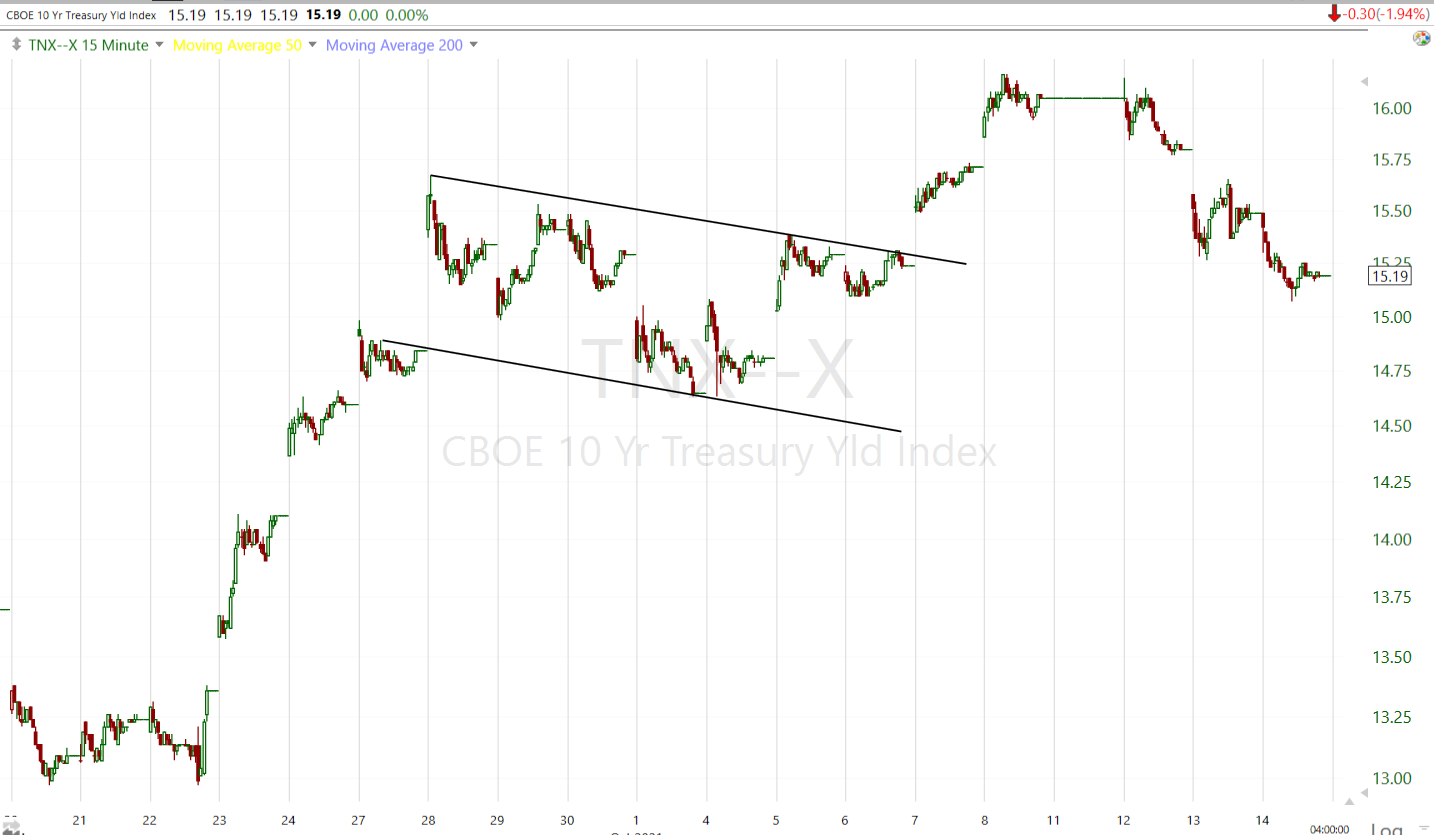 10-year yield (15m)
However the 30-year yield is a failed breakout.
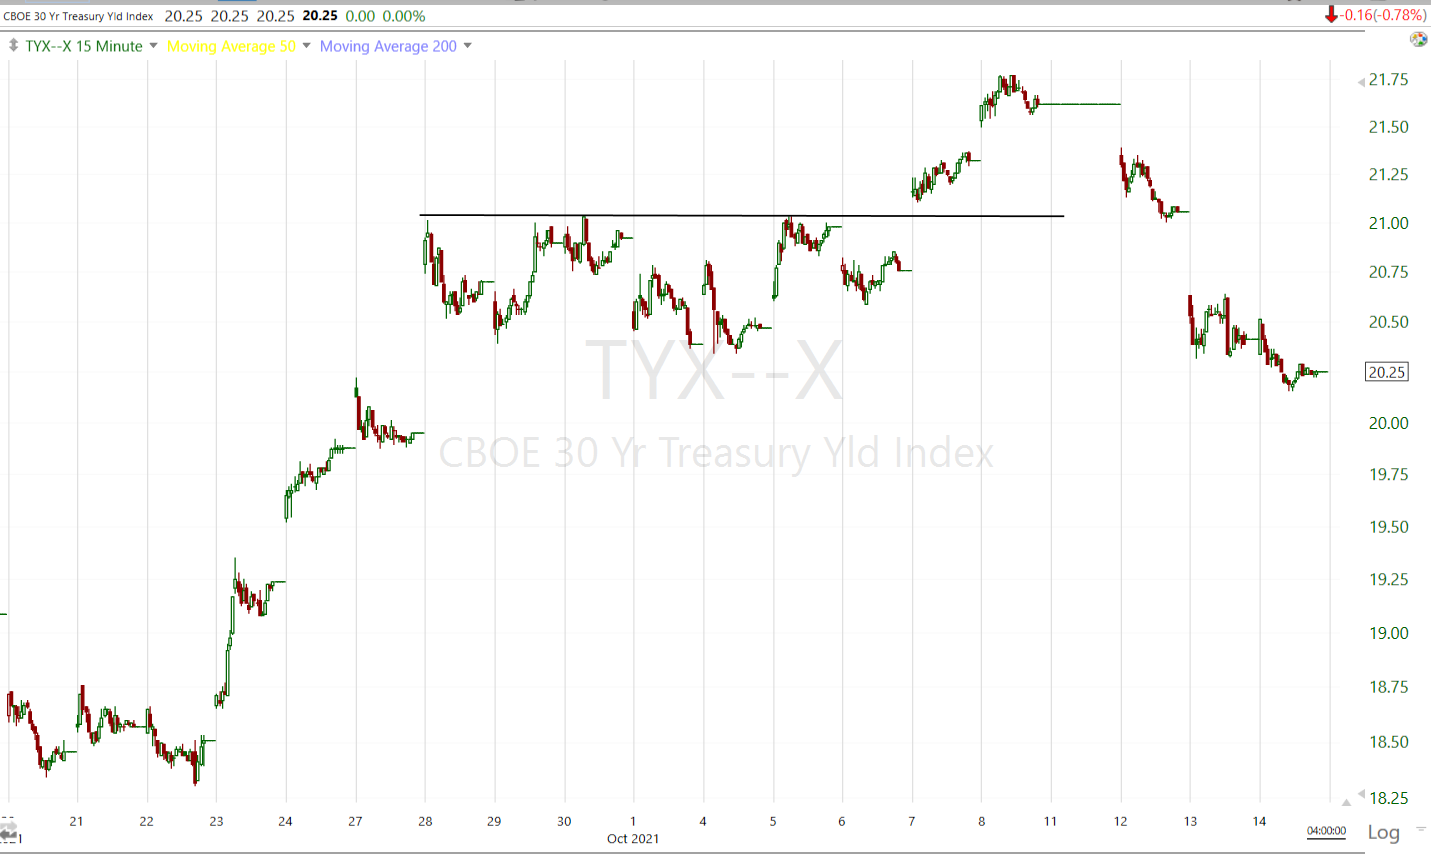 30-year yield (15m)
The 5s-30s yield curve steepened ever so slightly today…
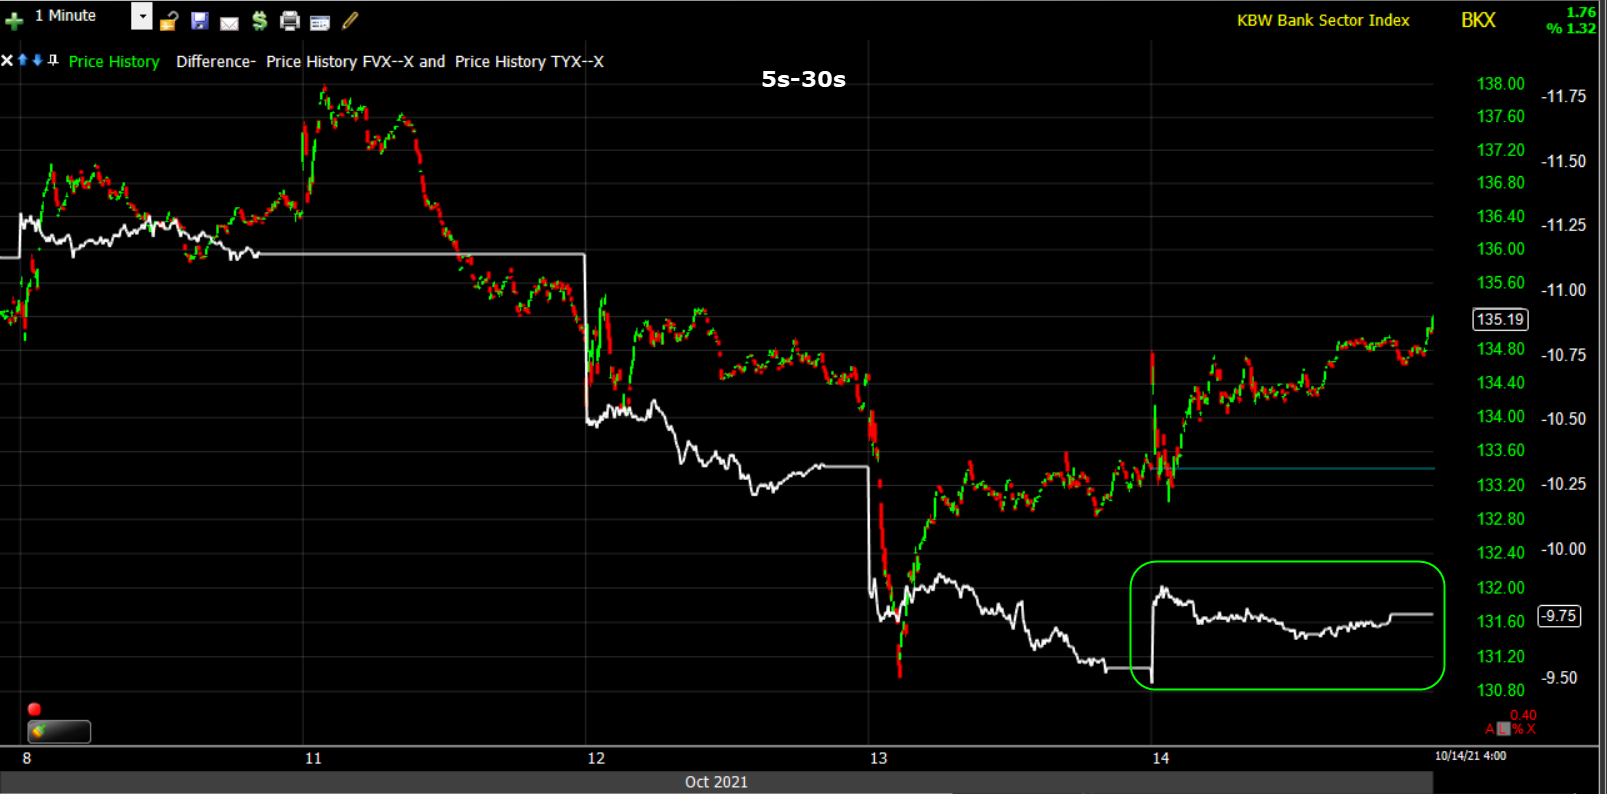 KBW Bank index (1m) and the 5s-30s spread (white).
This is a drop in the bucket compared to the last 2 days of flattening suggesting the market is increasingly concerned about a Fed policy error.
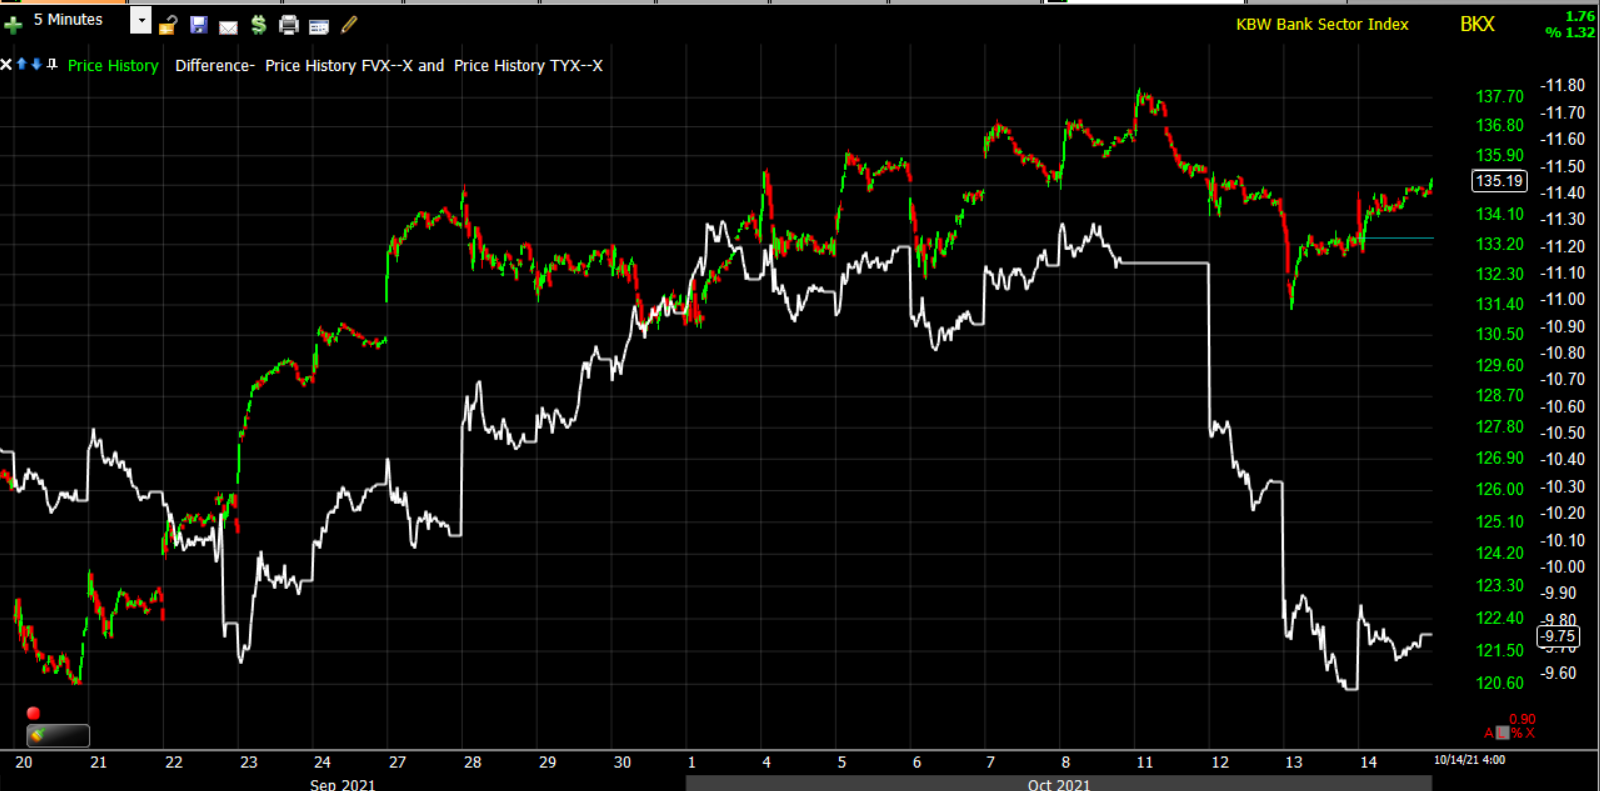 KBW Bank Index (5m) and 5s-30s spread retraced 3 weeks of steepening in just the last 2 days.
In one corner of the U.S. short-term rates market, traders are ramping up short positions in futures on bets the Federal Reserve will hike faster and more aggressively from the end of 2022 amid elevated price pressures.
Credit got a boost from not only lower rates, but improved risk sentiment.
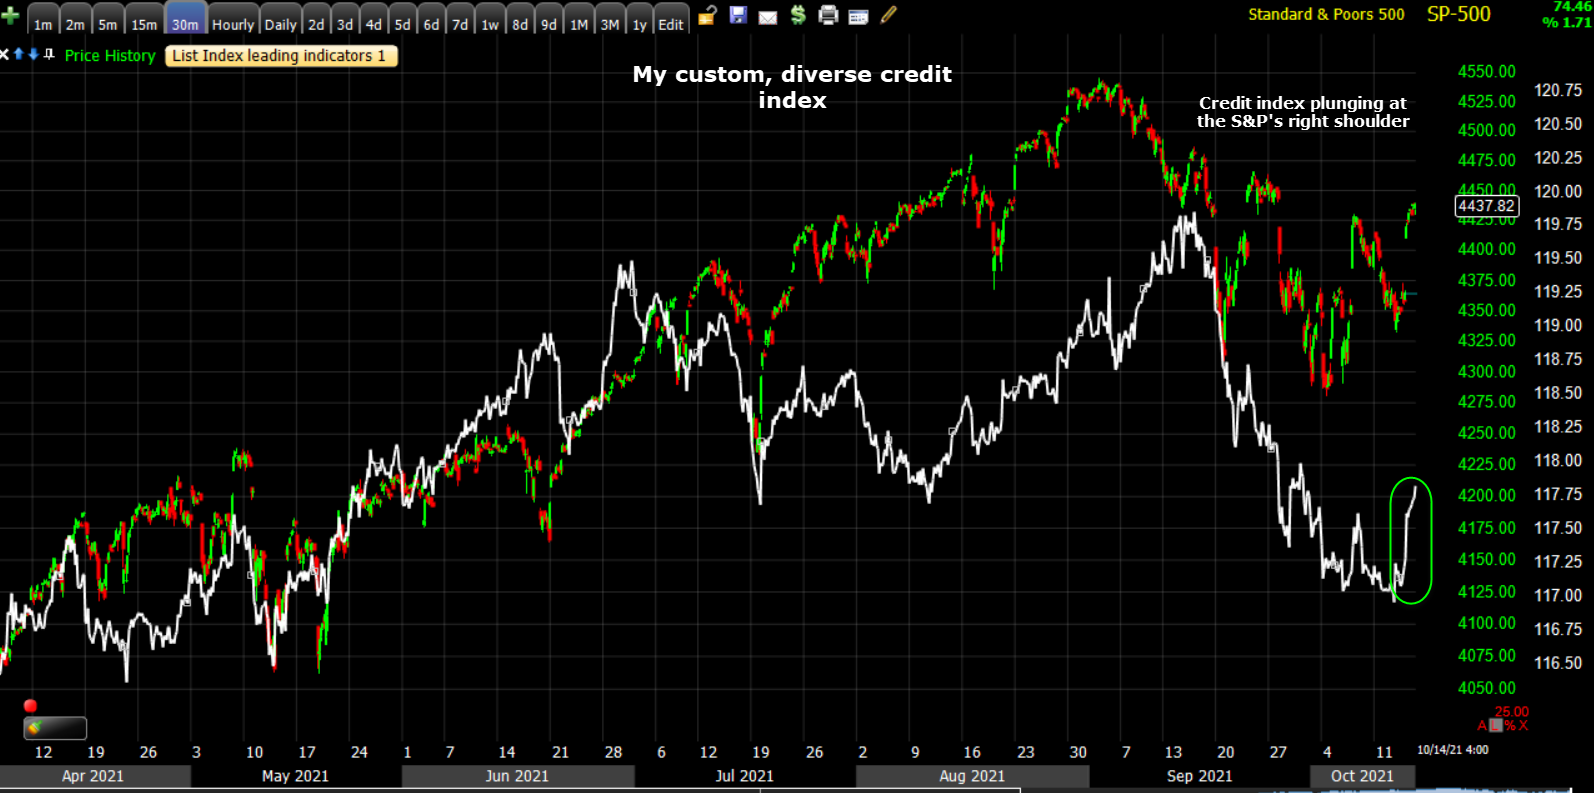 SP-500 (30m) and my custom credit index. Still, it’s a drop in the bucket compared to credit’s sharp decline as the S&P’s right shoulder forms and matures.
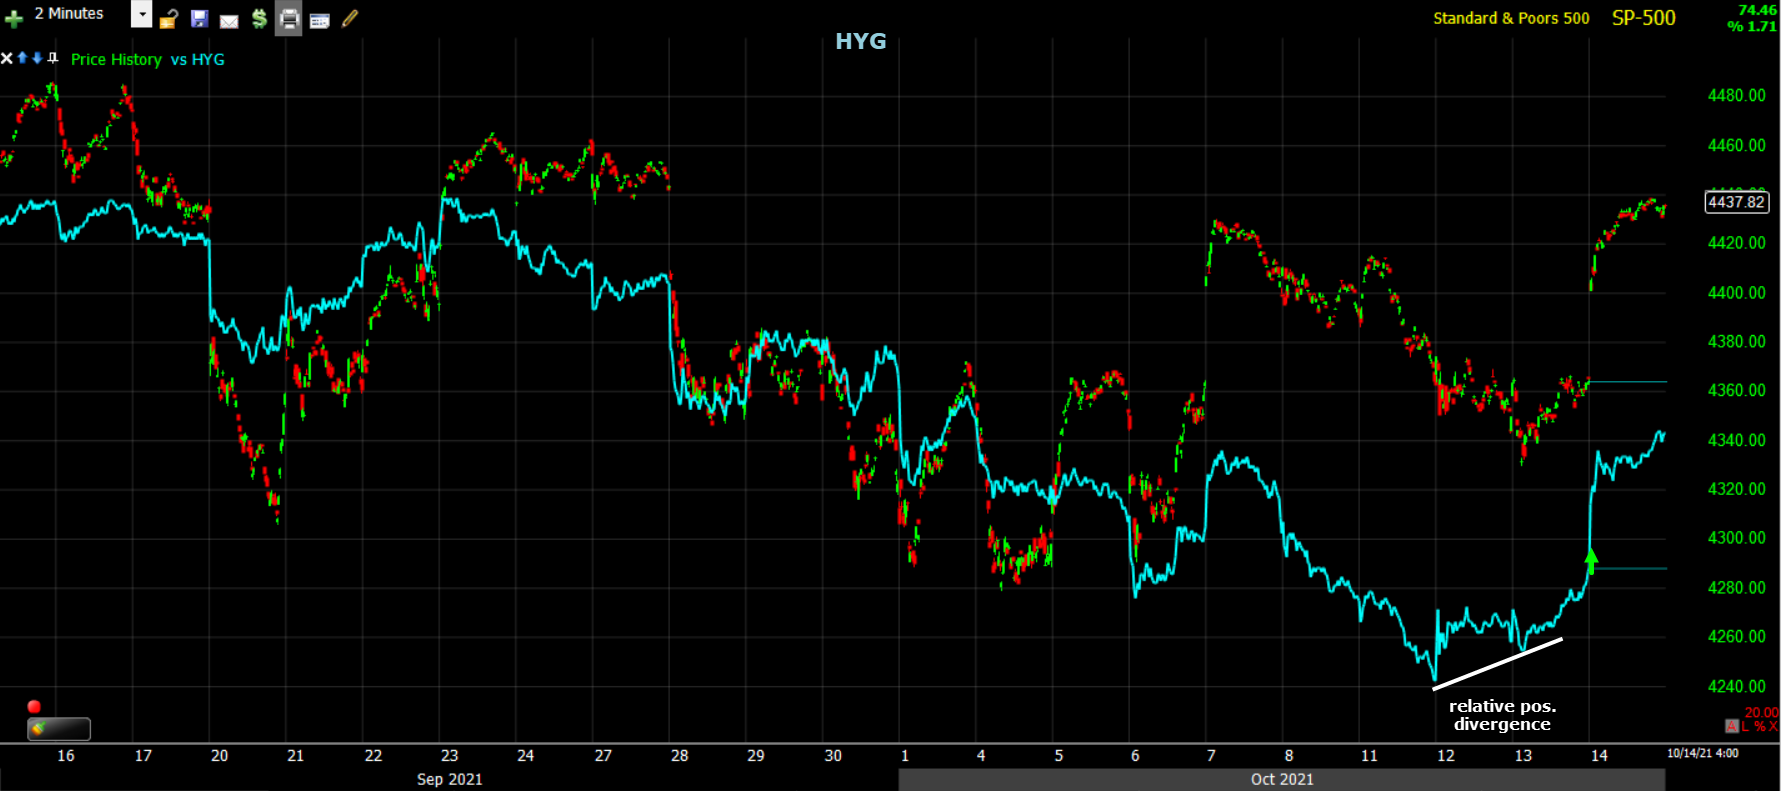 SP-500 (2m) and High yield credit (HYG in blue). Yesterday HYG also posted a modest relative positive divergence and popped higher today, but again, this is modest in the bigger picture of things.
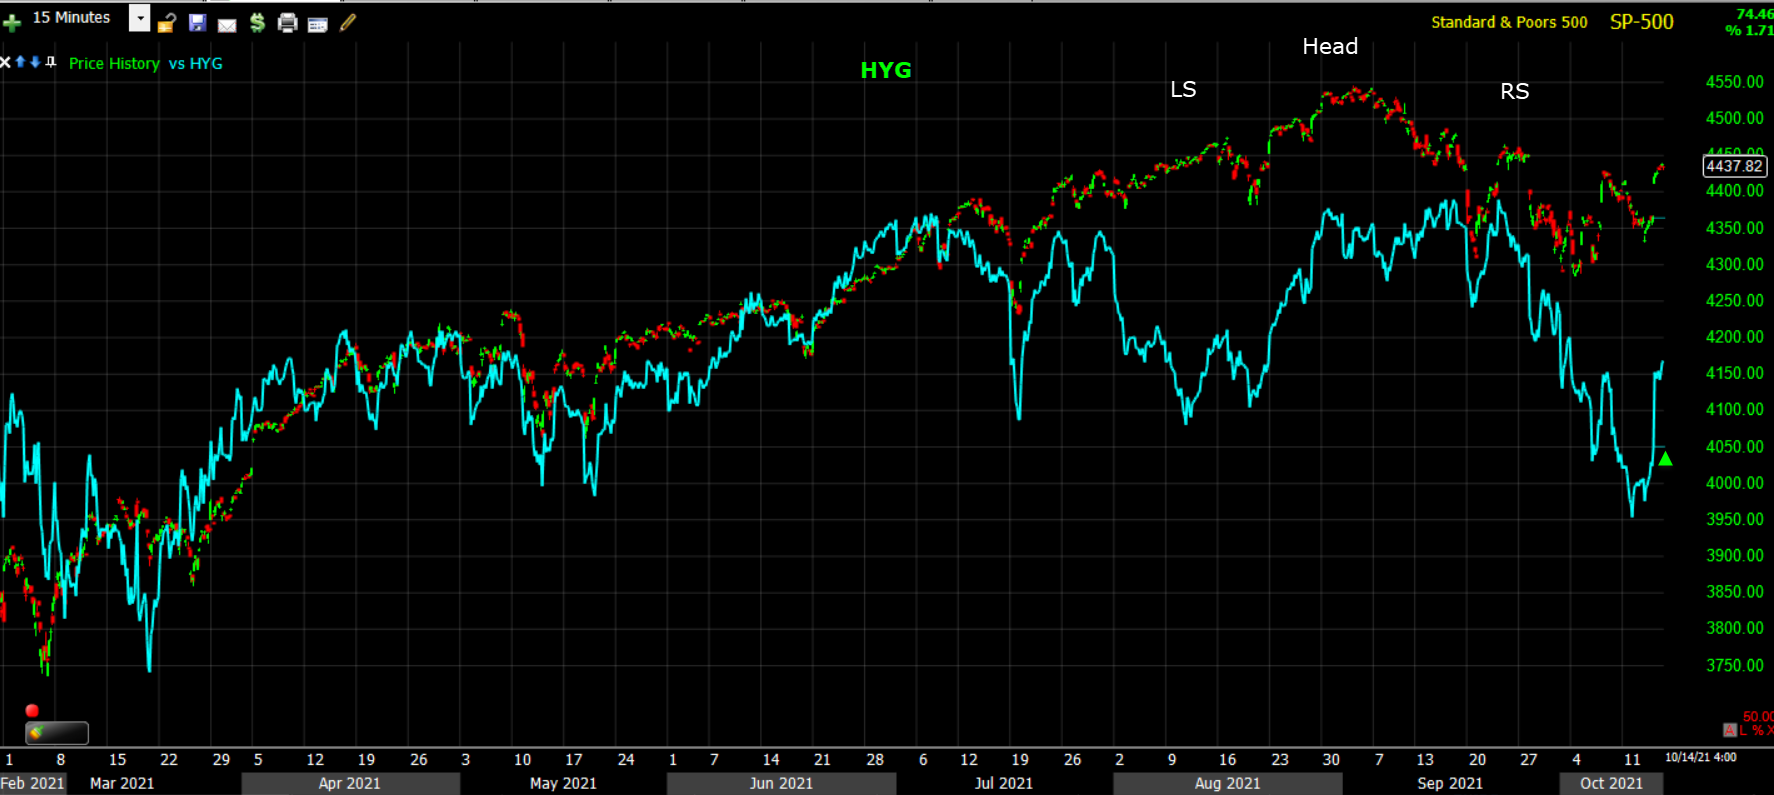 SP-500 (15m) and HYG
Currencies and Commodities
The U.S. Dollar Index decreased 0.1% to 93.99.
WTI crude futures rose 1.0% to $81.28/bbl despite a sizable build in weekly crude inventories (6.09 mln barrels).
Traditional inflation hedge, Gold (futures) gained +0.2% to $1,797.90/oz, aided by modest losses in the greenback and treasury yields. Gold also topped the key $1800 level intraday.
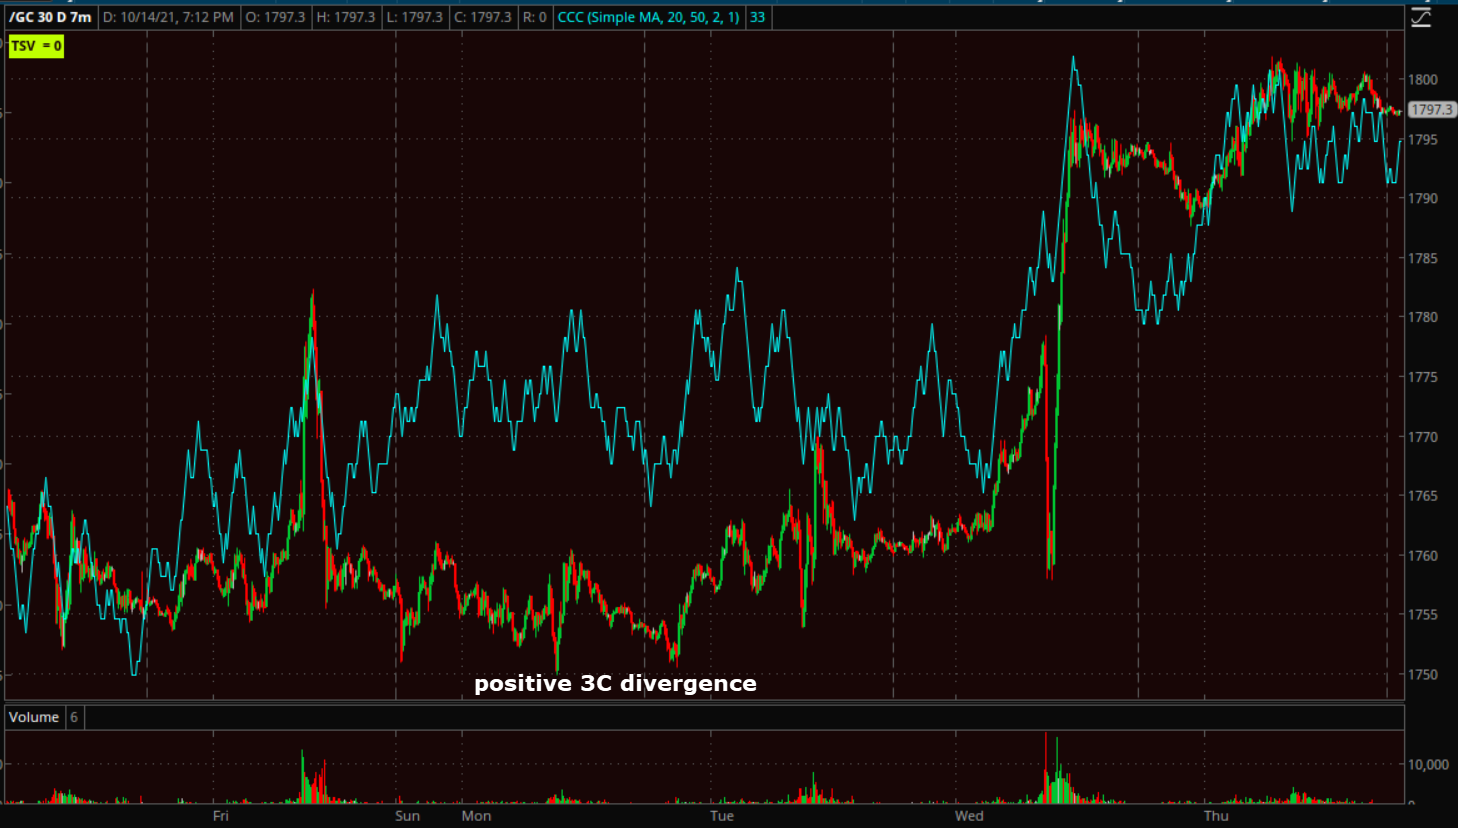 Gold futures (7m) topping the key $1800 level and above its 50, 100 and 200-day sma’s.
Bitcoin added to gains, topping %458k, but it’s Ethereum’s turn to play catch up, topping $3800 for the first time since early September.
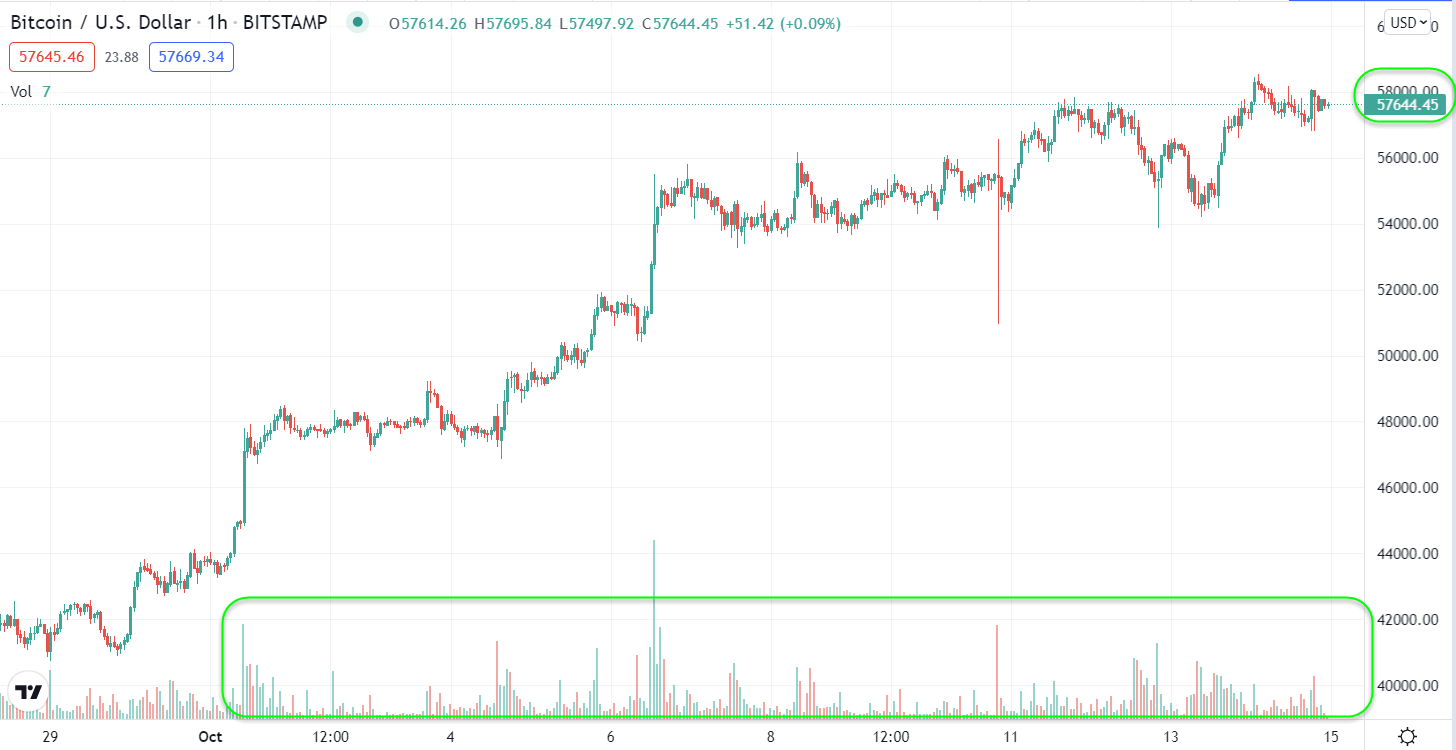 BTC/USD (60m) the rally in October seems to be a hedge against inflation.
 ETH/USD (60m) breaking out above resistance, note the heavy buy-side volume on the breakout (bullish).
Summary
Ever since those gaps were posted at the end of December, I’ve noted 2 things- 1) larger much more serious Head and Shoulders tops taking shape and 2) a high probability those gaps are filled, which ironically just gives more structure and confirmation to the H&S tops. Not all of the averages filled the gaps, but the S&P and Dow did, for me Small Caps came close enough. NASDAQ-100 could still fill the gap and I’d prefer that it did, but if it didn’t, I don’t think it would deter me from opening the market short I’ve been considering, just waiting for those price gaps to be filled. From here I’ll be watching for signs that this rally is losing steam and nearing pivot to the downside. These signals could include 3C negative divergences, credit negatively diverging and/or turning lower. Also keep an eye on inflationary pressures such as the surge in energy prices we saw last week (Crude and natural gas). Additional inflationary pressures puts the Fed in more of a box and makes tapering stimulus (which has been the most important single factor driving stocks higher since the pandemic crash) more likely, more aggressive and moves up the rate-liftoff timetable.
As covered in the Afternoon Update I think we could see some upside follow through, but it may be more mixed than broad-based. The NASDAQ has open gaps and with the pull back in yields, the environment is more conducive to them continuing their advance toward those gaps. On the other hand the S&P and Dow’s 50-day moving averages may continue to put pressure on prices as we saw short covering fall off quickly this afternoon once they were in the area. The Dow’s $35k area has also been a zone of resistance that’s right in the area.
For now, I’m happy to see one more event that’s been expected, come to fruition. While the gains today were impressive and the rally broad-based, it also better fills out the H&S tops and reduces the risk of an upside move against short positions to fill open gaps.
Options expiration is tomorrow and that could certainly play a role in the market’s pivot.
Overnight
Hong Kong’s market reopens after a holiday. S&P futures are up +0.15%. 3C confirmation was solid during the cash session, but has fallen off since then as price trades just above the 50-day.
 S&P futures (1m)
The other major average at its 50-day looks very similar tonight which suggests to me not so much an immediate decline, but some sellers in the area, whether taking profits or otherwise.
 Dow futures (1m) go from excellent 3C confirmation of pre-market and cash market gains until the Dow traded up to the 50-day. If I had to guess, I’d say that prices can add a bit more, but take on more of a lateral consolidation in the area of the 50-day and don’t move too much further on the upside.
For context, here’s Russell 2000 futures’ intraday 3C chart…
 Russell 2000 futures (1m) pretty much excellent confirmation the entire day since there’s no technical resistance in the area. The slightly longer term trend chart in the cash market (IWM 3m above) does not look so good, but we’re just looking at intraday dynamics here.
Also as noted this afternoon, while VIX has been clobbered, it appears some buyers are sniffing around.
 VIX futures (1m) positive divergence. As they say, “Hedge risk when you can, not when you have to”. It looks to me that the “dip” in volatility is finding some buyers of the discount.
Looking ahead to Friday we have options expiration, investors will receive Retail Sales for September, the Empire State Manufacturing Survey for October, Import and Export Prices for September, the preliminary University of Michigan Index of Consumer Sentiment for October, and Business Inventories for August. Also Goldman Sachs Group Inc. reports earnings on Friday.