Early Update – Broad-Based Deleveraging
11:19 a.m. ET
We have an active market this morning, but this is also a fairly heavy day of economic data. The ADP Payrolls sent yields soaring after a massive beat, and that put more downside pressure on stocks- especially the mega-caps in early trade. We have more decently strong data lifting yields and keeping pressure on stocks. Here’s the additional data since the A.M. Update:
- JOLTS job openings 9.824MM, Exp. 9.900MM, Last 10.320MM
- ISM Services 53.9, (consensus 51.2) vs. the last 50.3
Chris Williamson, Chief Business Economist at S&P Global Market Intelligence, said:
“June saw encouraging resilience of the US services economy, which helped offset a renewed contraction of manufacturing output to ensure the overall pace of economic growth remained encouragingly solid.”.
“The worry is that, although selling price inflation has cooled further, June saw increased cost growth in the service sector, which has been the main area of inflation concern in recent months. Higher wages in particular are driving costs up, and could keep selling price inflation stubbornly elevated in the months ahead.”
Most of the averages are down around -1.4% which indicates broad-based deleveraging, but not as panicked as it might seem at first glance. Small Caps are displaying notable relative weakness and you can probably guess why. You’ll see below.
SP-500 -1.35%, Dow -1.45% (Transports -1.5%), NASDAQ-100 -1.45%, Small Caps -2.55%
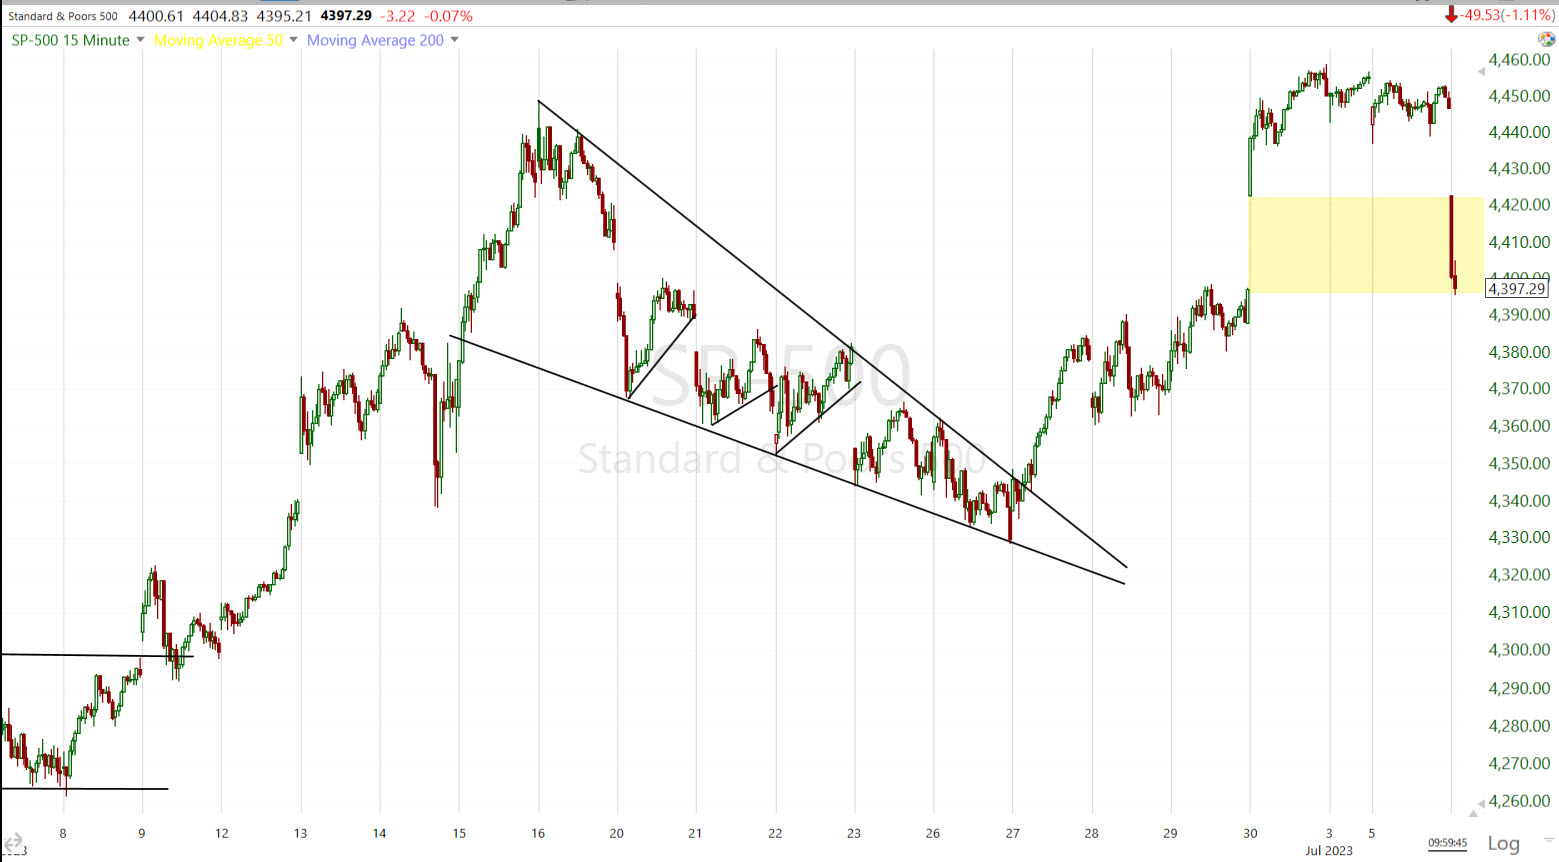 SP-500 (15m) for now the S&P is filling the gap from last Friday’s last day of window dressing of Q2. The Dow, though, is uglier…
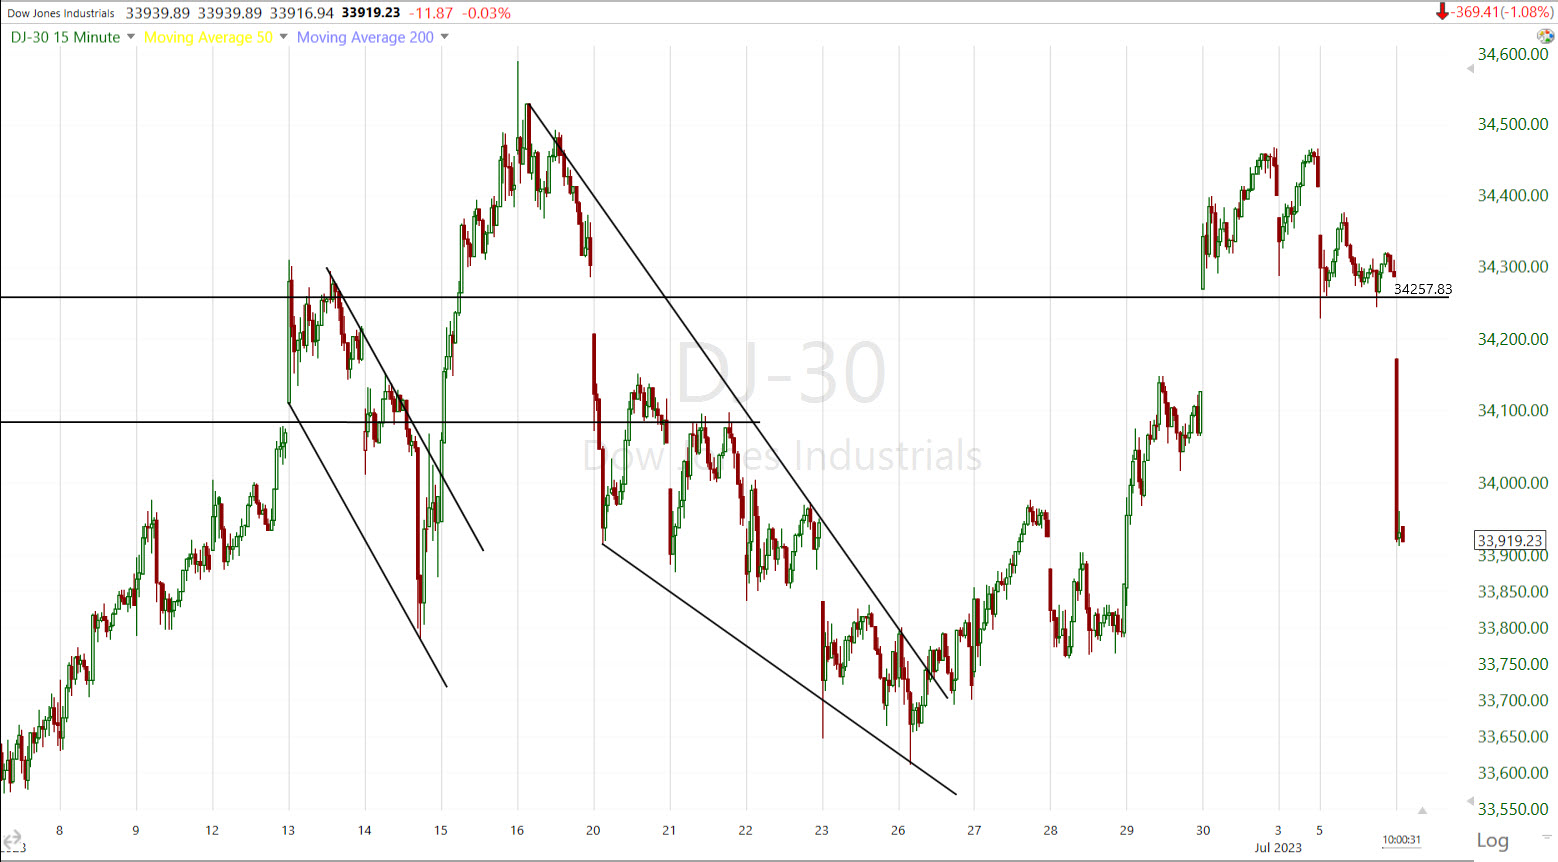 Dow (15m) which is well below the gap.
This of course raises the concerns with price action from last week, specifically that the “apparent breakouts” from “apparent bullish patterns” looked to be at risk due to numerous warning signs of weaker price tone. Taking a look at Small Cap IWM…
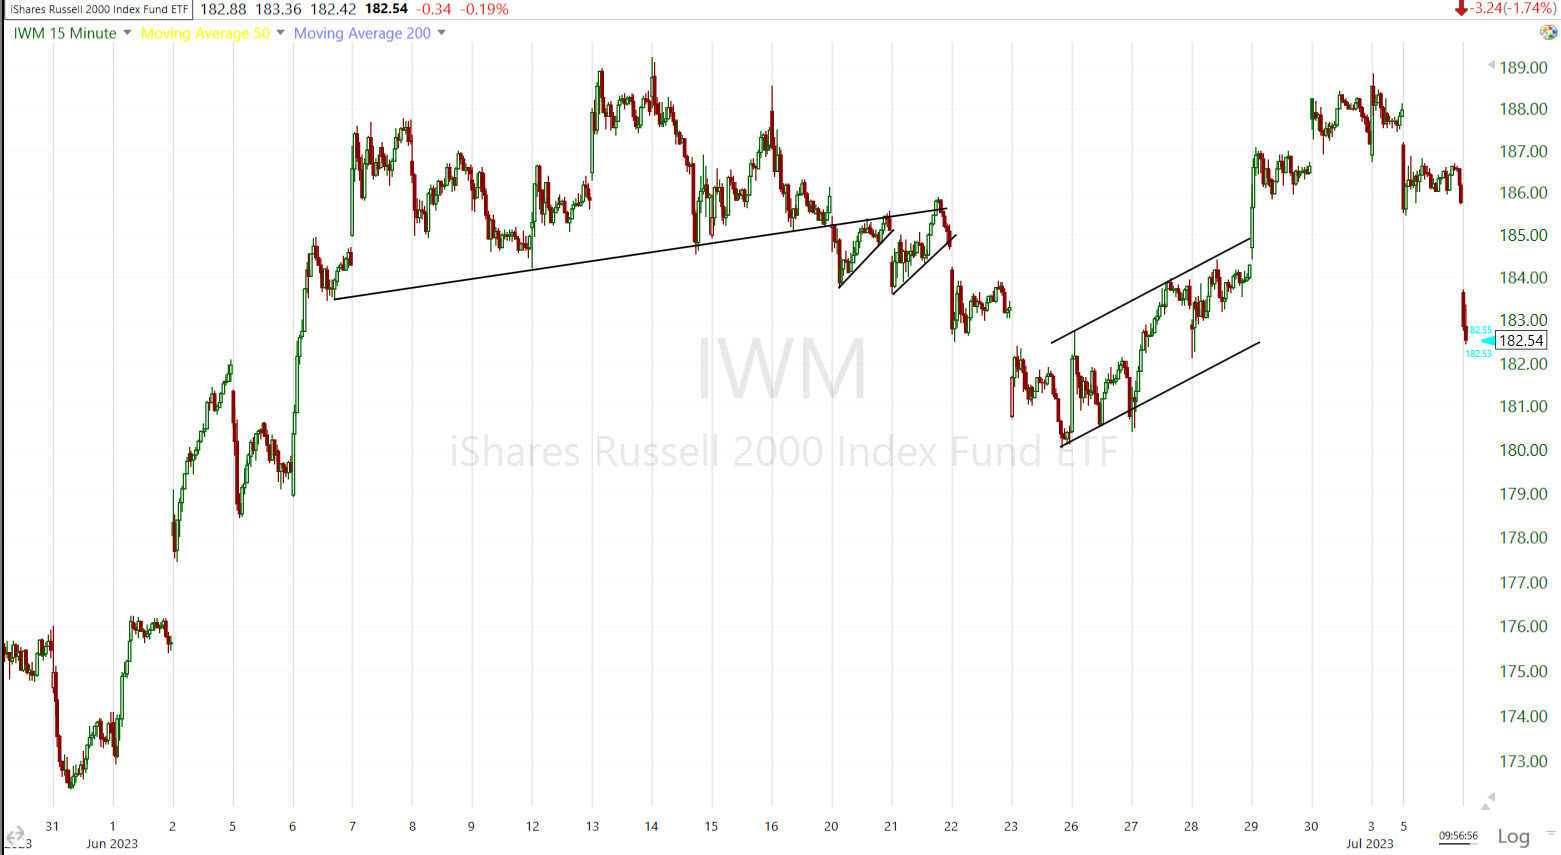 IWM (15m) I’ve detailed the series of events in following IWM’s initially strong early June price action, to what’s developed since. If you need a recent recap, see yesterday’s Intraday Update and look for IWM’s price chat. By following the details of price action as it develops and watching the story, we get a look under the hood that may not have been apparent at a casual glance.
When we take all the detailed trends off the chart and take a broader view, here’s what we end up with…
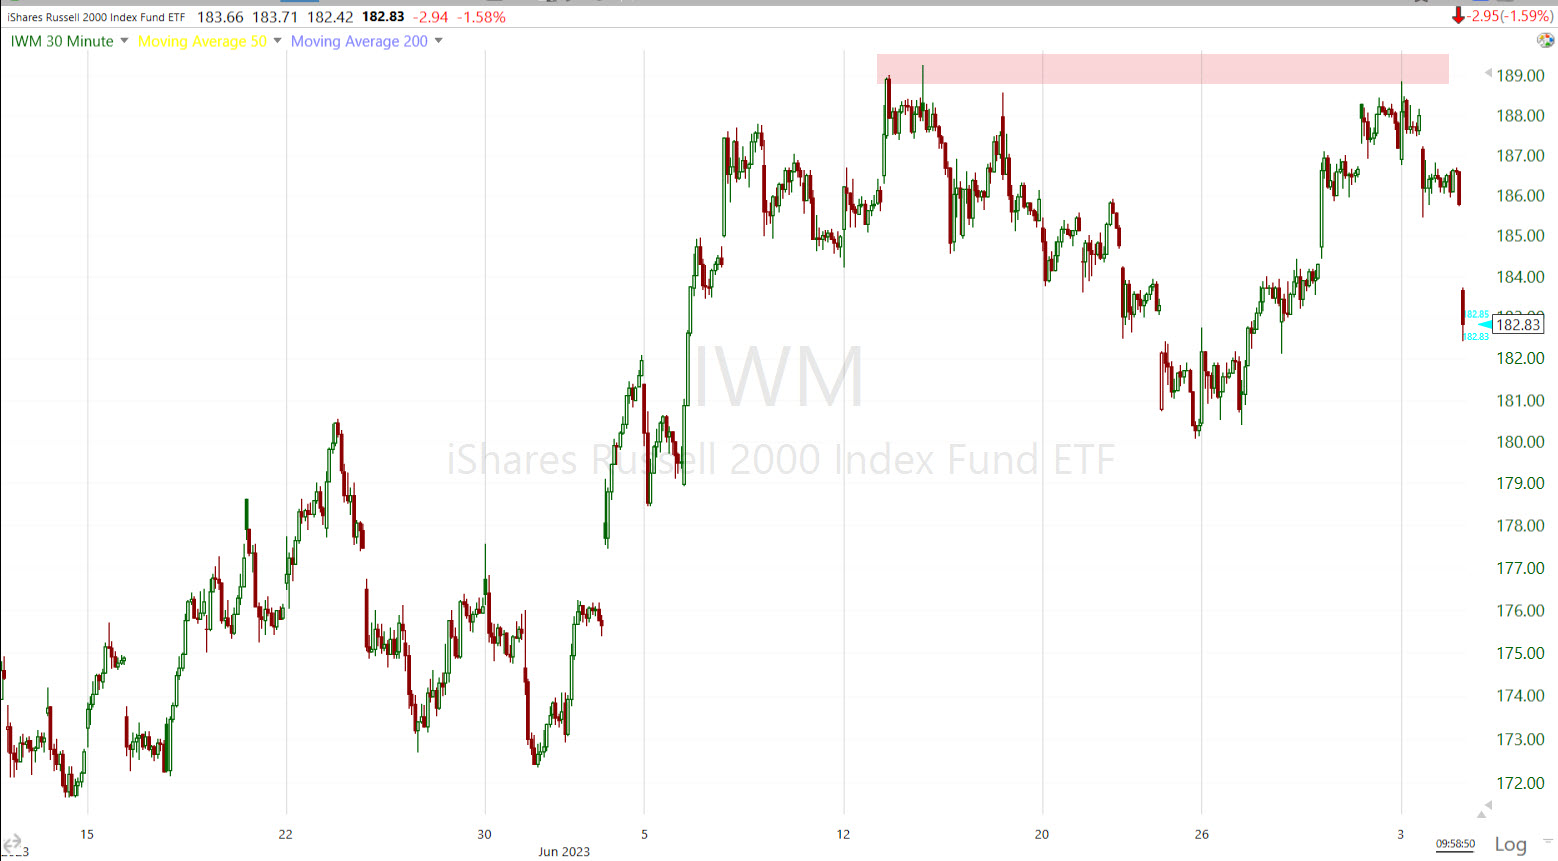 IWM (30m) failing to make a higher high, or a “Double top”. This was discussed in yesterday’s first post of the cash session, the Early Update…
” S&P, NASDAQ-100, Dow and Small Caps have all failed to make the higher high of a definitive breakout, leaving the averages exposed to the increased risk of a failed breakout/fast reversal, or another view would be something of a small double top here.”
And from an even broader view, since there’s so much talk in financial media of late about bull markets every time an average is up +20% from its lows, recall what the expectation was for the broader market last year… That we would see price strength. We would see a rally that would interrupt the primary downtrend or bear market and form an intermediate lateral trend. In other words, something stronger than a bear market rally, but not a new primary up trend or bull market. Small Caps’ best embody the call last year for a lateral intermediate price trend…
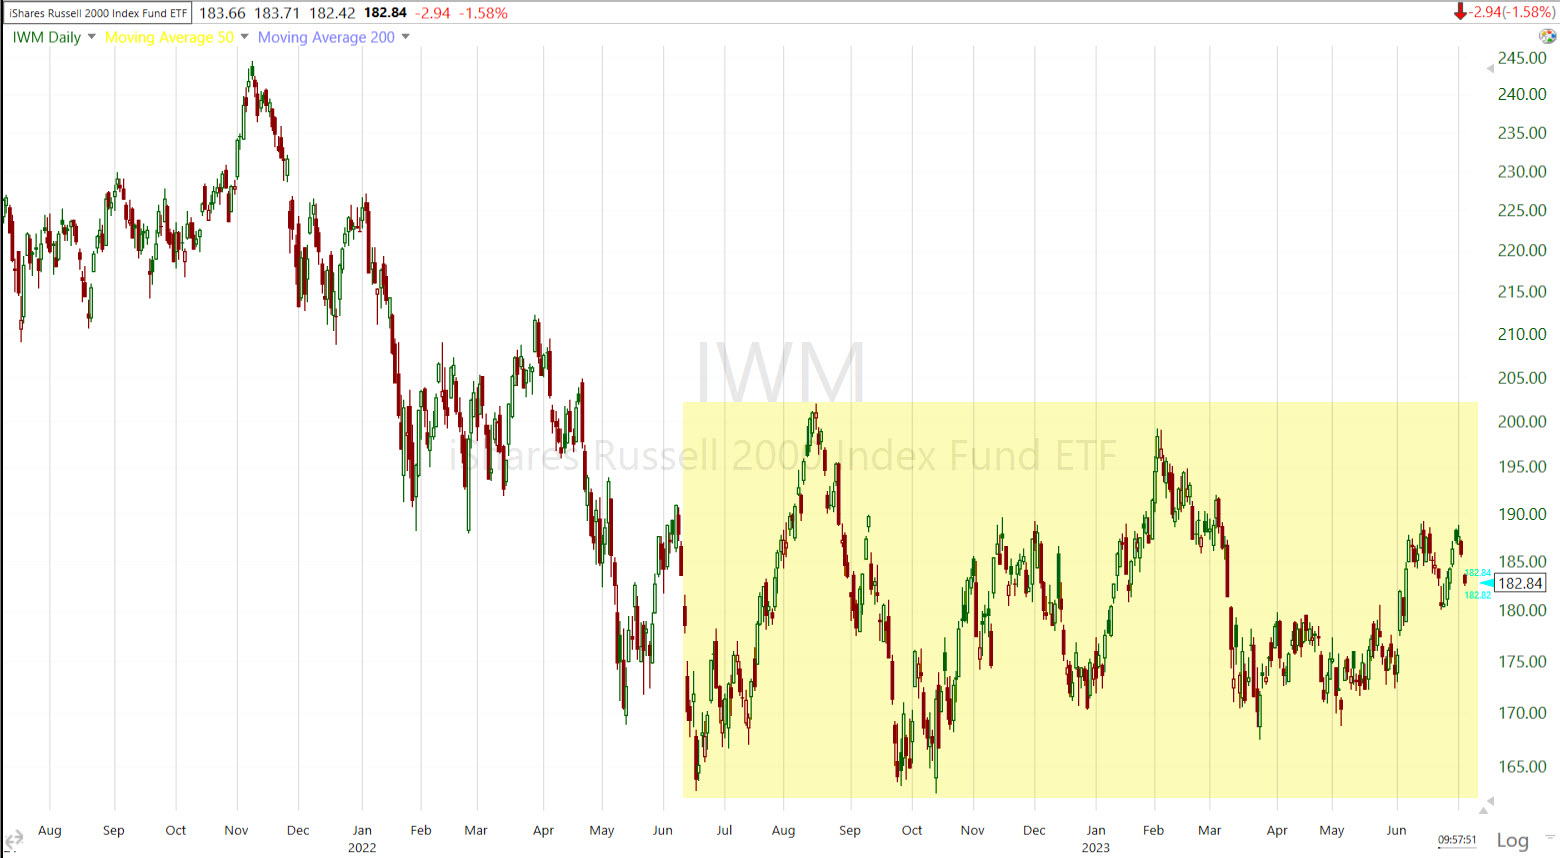 IWM (daily) transitioning from a primary downtrend in the first half of 2022 (bear market) to an intermediate lateral trend. In fact we might even call this a lateral primary trend.
VIX (+20%) is seeing a nice pop after a month of support around the $13.50 area and a recently emerging trend of positive correlation with the S&P (not a good sign for the market historically – see yesterday’s Early Update for more on the recently emerging positive correlation that VVIX +18.5% led). VIX has been ridiculously low and while it’s still unrealistically low, it’s playing some catch-up this morning.
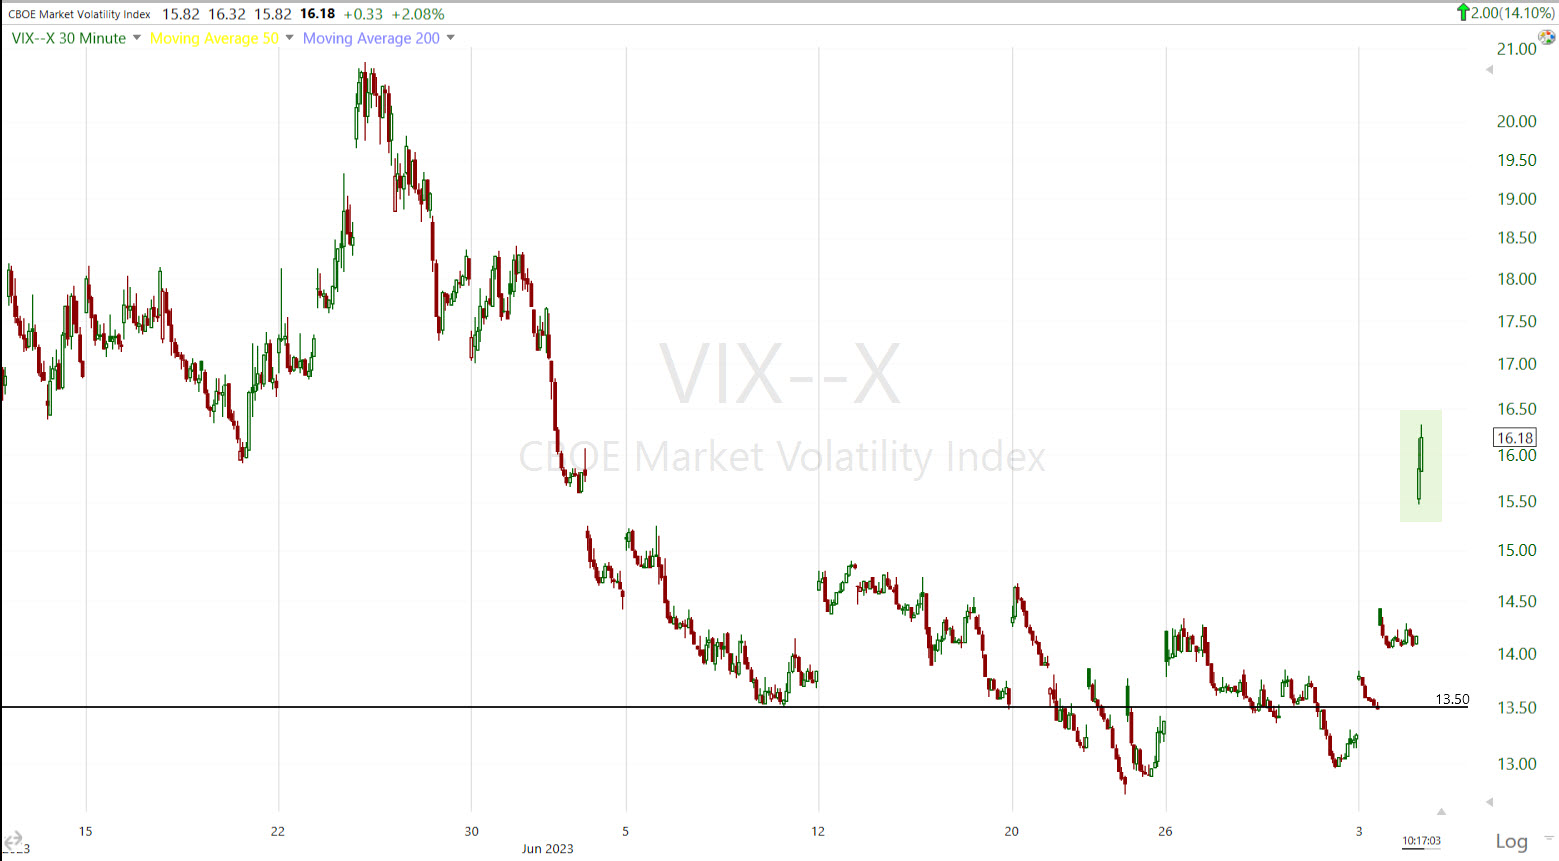 VIX (30m) with nice support around $13.50 for a month-plus.
Volatility’s term structure has seen a ridiculous degree of contango as investors/traders have grown overly complacent. The contango this morning is less severe, but still at levels that suggest an overly complacent market.
The Absolute Breadth Index is at 32.
All 11 S&P sectors are down from -0.4% to -2.5% in broad-based selling. Sector bias is very mixed and unclear at present. It seems mostly like deleveraging. The mega-cap index (MGK -1.3%) is fairly close to the S&P-500 Equal Weight Index (-1.5%) with just 20 basis points between them, which again suggests broad-based deleveraging. Cyclical Materials and Energy, as well as mega-cap heavy Consumer Discretionary are the worst performing sectors, down between -1.85% and -2.5%. ***Since I first wrote this, a more counter-cyclical/defensive bias is taking hold (as we saw yesterday with Utilities as the top performer with a more than 1% gain). Consumer Staples, the one sector we did see 3C positive divergences in June, is sitting at the top of the leaderboard with the smallest loss.
Semiconductors (SOX -2.45%) showed relative weakness yesterday and some more today vs. the Tech sector (-1%).
Another recent area of relative weakness is the banks. The KBW Bank Index (-2.75%) is breaking down from a recent bearish flag-like correction…
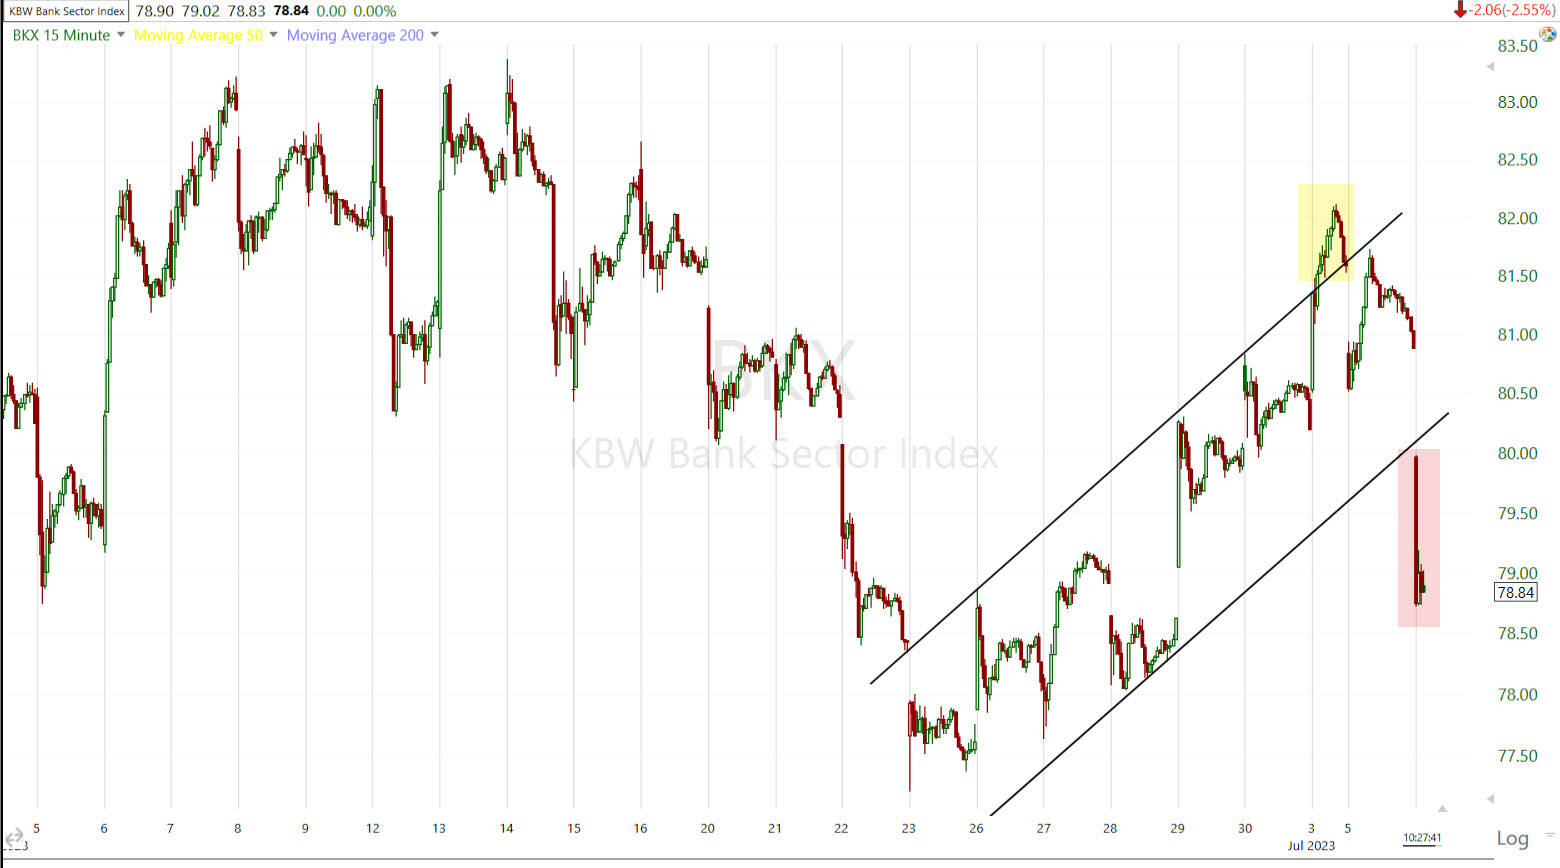
KBW Bank Index (15m) there’s a little channel buster (highlighted yellow). I haven’t talked about these in a while because there haven’t been many, but the concept is the same as a failed breakout, even though we don’t expect a breakout from a bear flag, but this is not a true bear flag, but it did have bearish price tone.
Regional Banks (-3.2%) are another area of recent relative weakness and are also breaking down from a better former bear flag that was back-testing a failed bullish consolidation.
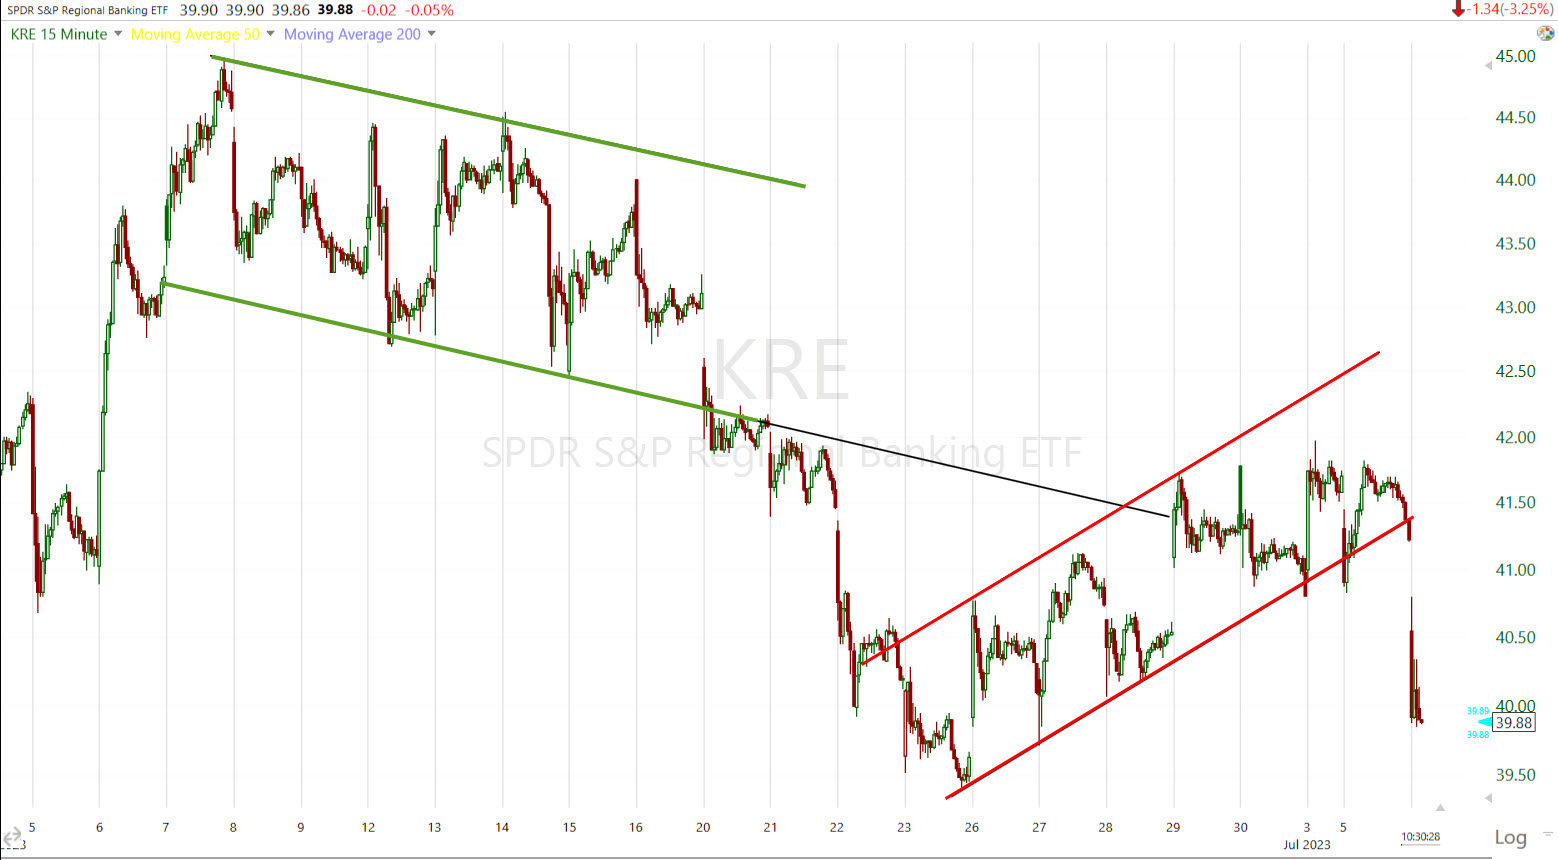 Regional Banks (15m). On the conservative side I’d say the bear flag has a near-term measured move downside target of $39. On the more liberal side, $37.75. The more important takeaway, though, is that Regional Banks and Semiconductors are the more economically sensitive groups and as such, they tend to lead their broader sectors or in this case where we see a lot of them starting to weaken, the broader market. As I’m sure most of you know, Regional Banks have a strong influence on Small Cap Russell 2000.
At last look market breadth reflects the strong negative bias of deleveraging. Decliners have a nearly 15-to-1 lead over advancers at the NYSE and a greater than 5-to-1 lead at the NASDAQ Composite (which you may recall from yesterday, already had a deteriorating advance/decline line).
Yields are sharply higher. The Fed-sensitive 2-year yield is up 10 basis points to 5.05%. This is interesting because it’s now in the Fed Funds corridor of 5% to 5.25%, after having crossed below the Fed funds rate a few months ago, predicting the Fed’s interest rate hike pause. The 10-year yield is up 11 basis points to +4.06% which is weighing on investor sentiment with regard to stock valuations.
As you might have guessed, High Yield Credit (HYG -0.9%) is taking it on the chin this morning and further sharply negatively diverging from the S&P. Keep the recent ex-dividend in mind, but still…
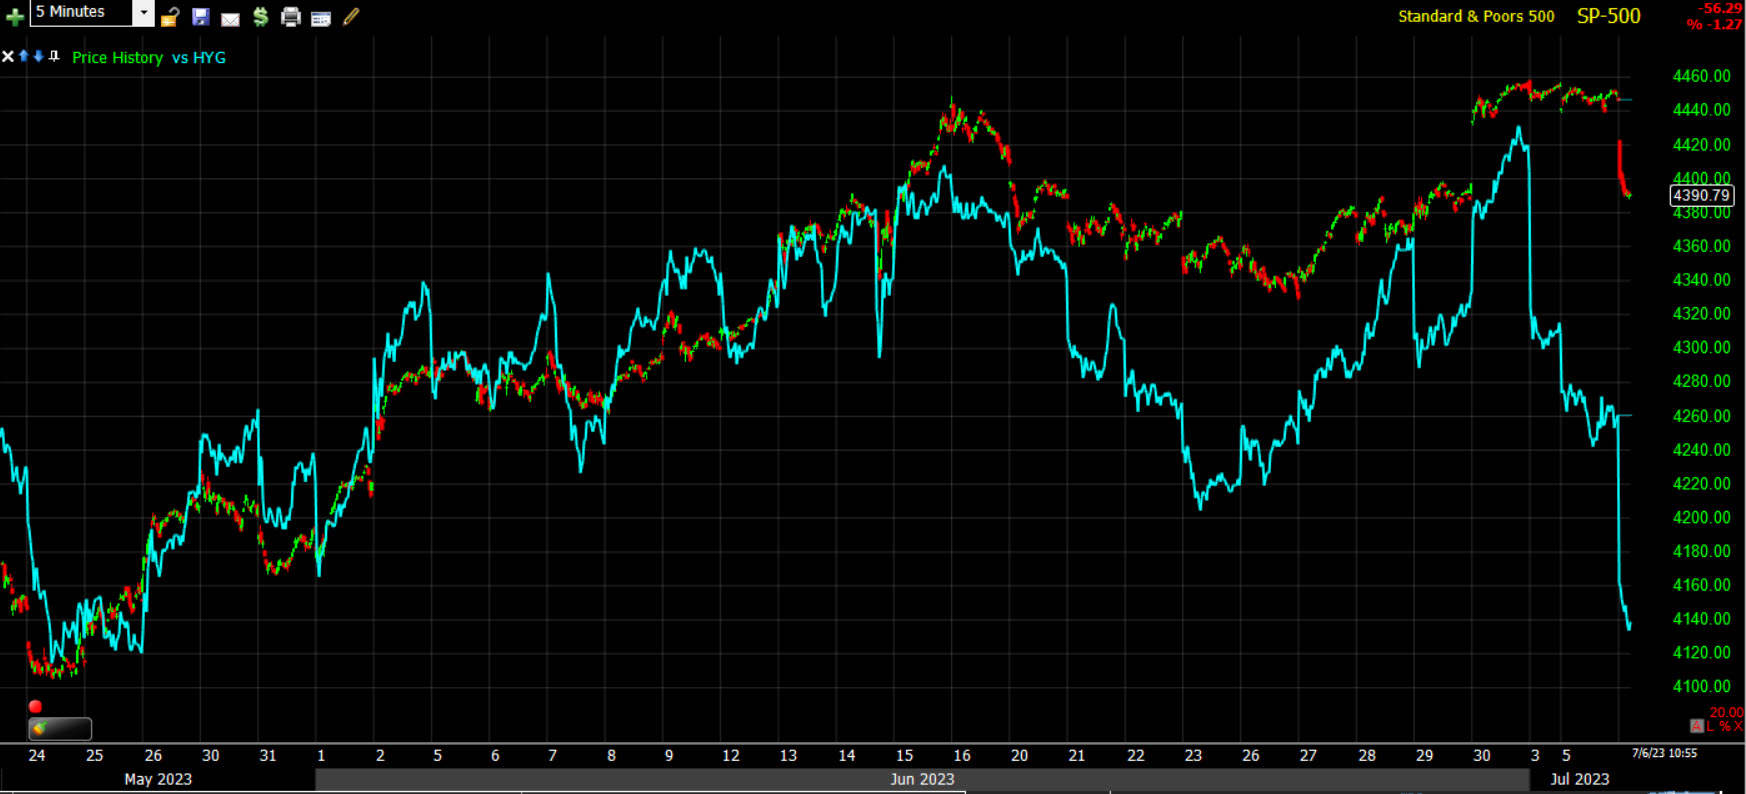 SP-500 (5m) and HYG (blue). HYG has retraced all of June’s gains. That’s not a good look for the S&P moving forward.
The U.S. Dollar Index jumped on the data since this morning’s ADP Payrolls beat, but still remains little changed (-0.08%).
WTI Crude is down -1% (still rangebound between $67-$74).
Gold futures (-0.6%) are predictably lower with the surge in yields, but once again, much like last week, Gold is acting much better than it should be and sitting above $1900 where it found support and unusual relative strength last week, at $1915.60.
Bitcoin futures (-1.3%) were once again rejected with price climbing above $31k, but not able to hold and headed back to recent support near $30k (currently $30,280).
As for 3C charts, they’re largely in line with price action in index futures. NASDAQ-100 futures had some of the weakest 3C charts overnight, leading to NQ being the weakest of index futures in pre-market.
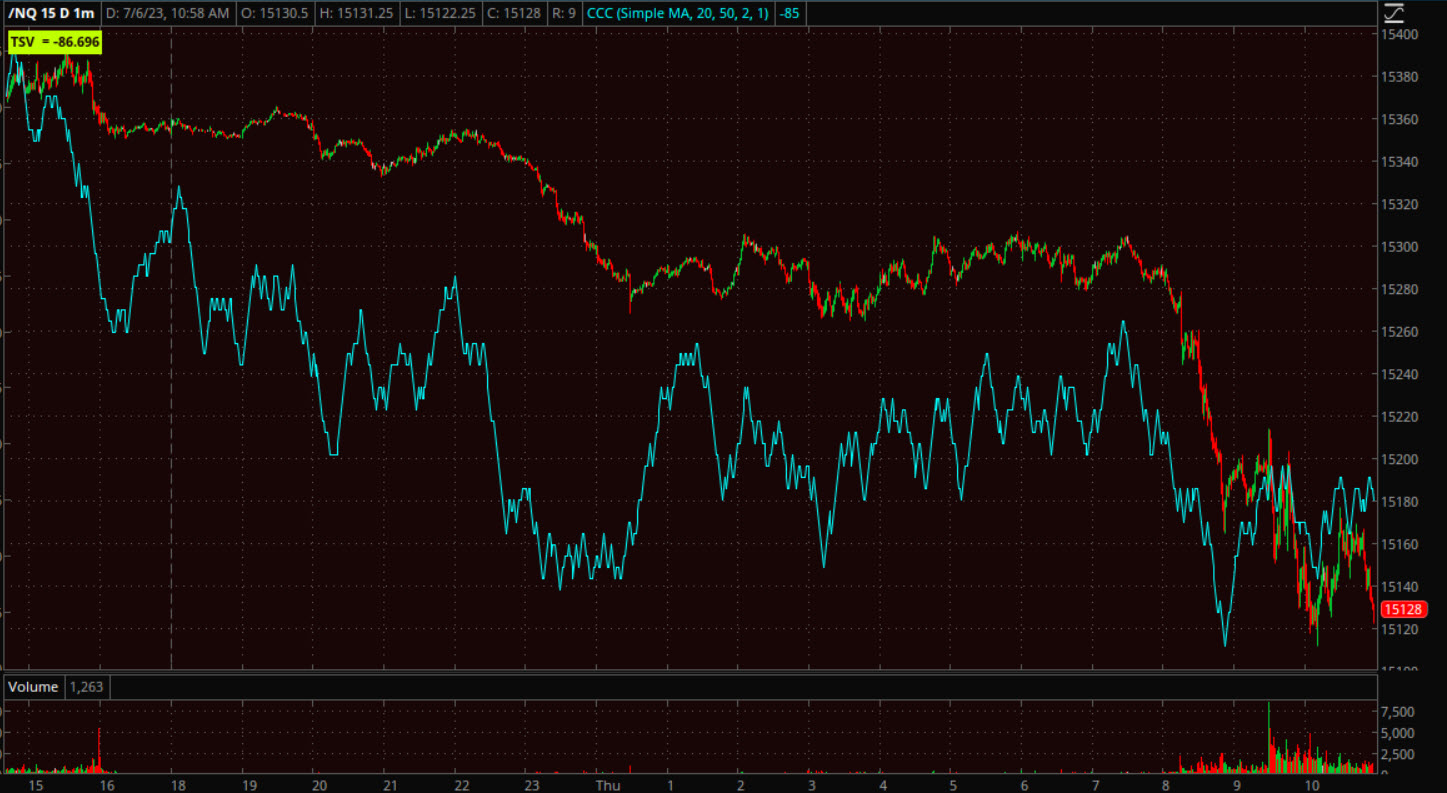 NQ (1m)
While VIX is soaring (relative to how weak it has been), it does not have good 3C support and I think the reason is that investors have been very complacent and not building notable positions there and hedging risk while it’s been pretty darn cheap to do so. We have seen some improvement on that front in some volatility products like VXX’s positive 3C trend divergence throughout June, but even there on an intraday basis, it’s not confirming well either. I suspect that will help the averages find some intraday support/intraday lows shortly. However, when we look at the 3C charts of the averages (keeping in mind the end of quarter and holiday lightened volume disparity), we’re seeing price follow 3C’s negatively divergent lead, especially into last Friday’s window dressing gap up which 3C did not confirm, and I wouldn’t expect it to as window dressing is a gimmick of hedge funds, not an indication of their belief in an asset. As the new quarter starts they often sell the same assets they just bought at the end of the prior quarter, or buyback the weak performing assets they sold for window dressing.
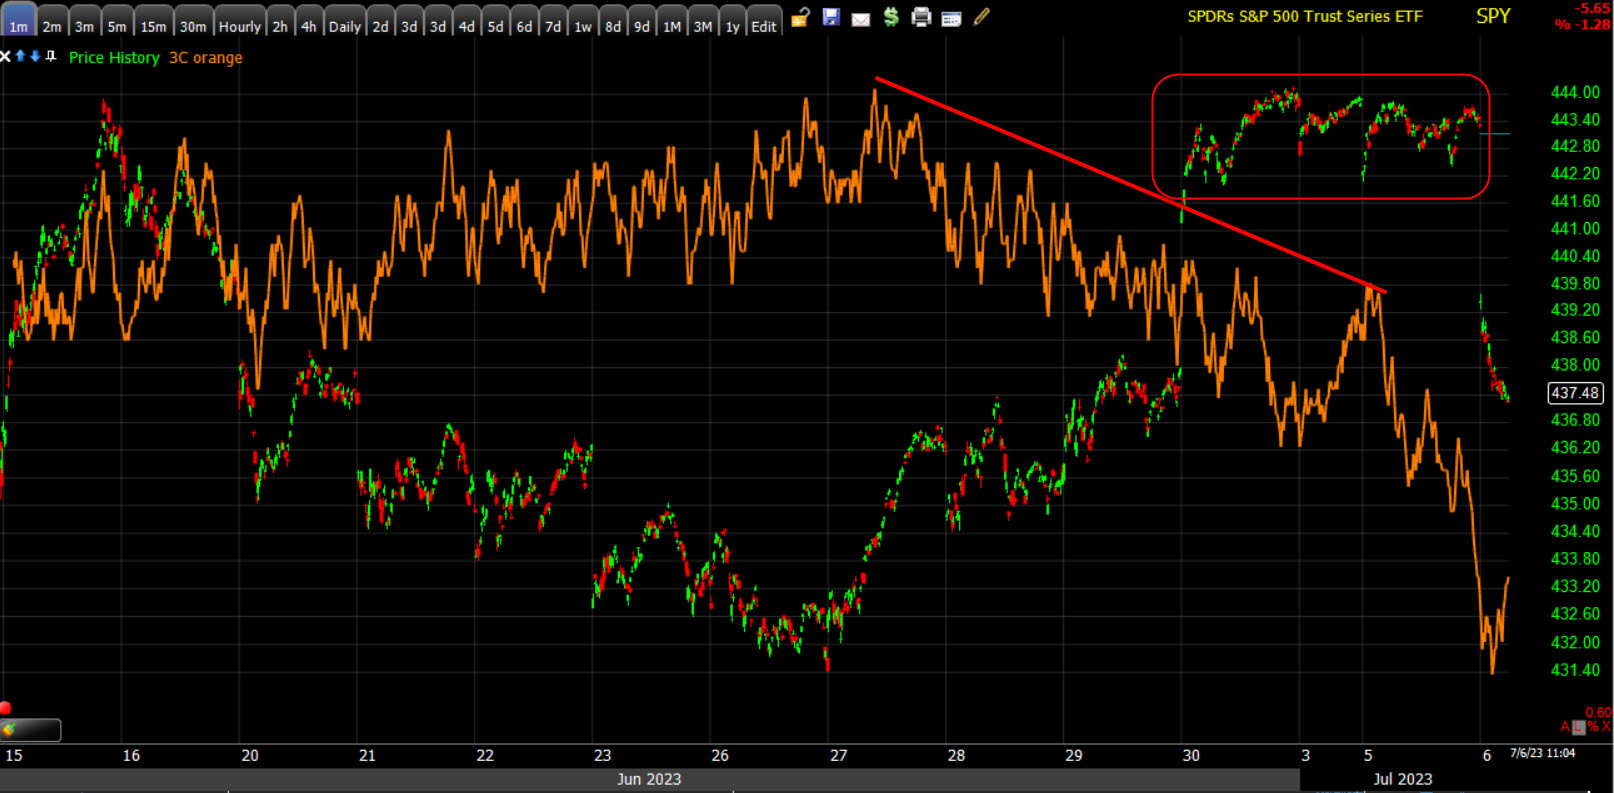
SPY (1m) with 3C positively diverging heading into the last week of June, but negatively diverging (not confirming) price gains that came after, and sharply negatively diverging since.
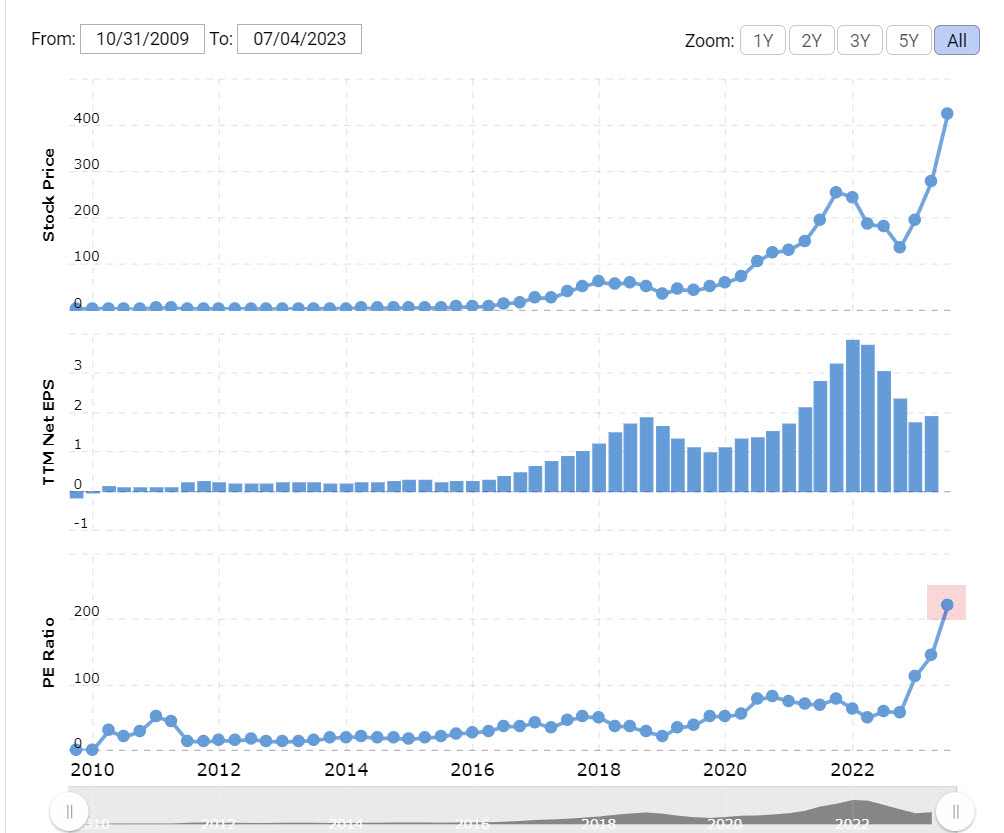
We’ll see how the charts shakeout as the day unfolds. However, I do think we have a lot more evidence leaning toward failed breakouts/bull traps as suspected, and with the stronger U.S. services/employment data, yields that are going to pressure valuations of the Tech/mega-caps. I keep coming back to Nvidia’s recent 220 P/E as one of the most extreme examples with a visual chart included in last night’s Daily Wrap.